Intervenciones para la aplicación de la tromboprofilaxis en pacientes hospitalizados con riesgo de tromboembolia venosa
Información
- DOI:
- https://doi.org/10.1002/14651858.CD008201.pub3Copiar DOI

- Base de datos:
-
- Cochrane Database of Systematic Reviews
- Versión publicada:
-
- 24 abril 2018see what's new
- Tipo:
-
- Intervention
- Etapa:
-
- Review
- Grupo Editorial Cochrane:
-
Grupo Cochrane de Vascular
- Copyright:
-
- Copyright © 2018 The Cochrane Collaboration. Published by John Wiley & Sons, Ltd.
Cifras del artículo
Altmetric:
Citado por:
Autores
Contributions of authors
1. Article reviewers: David Morrison (DM), Gisèle Diendéré (GD), Dr Susan Kahn (SK), Dr Adi J. Klil‐Drori (AJK)
2. Resolving disputes: DM, GD, SK, AJK
3. Statistical expertise: Alexandre Piche (AP), Dr Kristian B Filion (KBF)
4. Content expertise: SK, KF, Dr Vicky Tagalakis (VT), Jessica Emed (JE), Dr André Roussin (AR), Dr William Geerts (WG)
5. Administrative coordination: DM
6. Literature searches: Martin Morris (MM), AJK, DM
7. Drafting the manuscript: DM, GD, SK
8. Revising the manuscript: DM, GD, SK, KBF, VT, JE, AR, AP, AJK, Dr James Douketis, (JD), MM, WG
Sources of support
Internal sources
-
Canadian Institutes for Health Research Knowledge Synthesis Grant (#141001), Canada.
-
Canadian Institutes for Health Research Foundation Grant (#143346), Canada.
External sources
-
Chief Scientist Office, Scottish Government Health Directorates, The Scottish Government, UK.
The Cochrane Vascular editorial base is supported by the Chief Scientist Office.
Declarations of interest
The authors of this review did not receive any funding to undertake this review other than the peer‐reviewed grant noted above. The authors report the following declarations of interest:
SK has received grant support from public granting agencies (CIHR) for research on the treatment of venous thrombosis. She participated in industry‐sponsored advisory board meetings (Boehringer‐Ingelheim, Servier Canada, one meeting for each entity), on the treatment of venous thrombosis and provided expert testimony for the Canadian Medical Protective Association. SK also reports that Sanofi Aventis has partnered with her institution to help create a center of excellence in thrombosis and anticoagulation.
DM: none known
GD: none known
AP: none known
KBF: none known
AJK: AJK's institution has received funds from the Young Investigator Award from the American Society of Clinical Oncology Conquer Cancer Foundation. AJK reports receiving payments from Bristol Myers Squibb for lectures.
JD: JD reports receiving funds from board memberships of Bayer, Boehringer‐Ingelheim, Bristol‐Myers‐Squibb, Daiichi‐Sankyo, Pfizer, and Sanofi; consultancy fees from Actelion, Janssen Research and Development; funds for speaking at educational activities; royalties from the Merck Manual, Up‐to‐Date; JD's institution has received a grant from Boehringer‐Ingelheim.
JE: JE received an honorarium for participation in a single meeting (focus group) with LEO Pharma for work unrelated to the submitted review.
AR: AR reports board membership and consultancy activities for BMS, BI, Pfizer, and Bayer, and received payment for lectures from BMS, BI, Bayer, and Pfizer not related to this review. AR also reports that his institution has received a CIHR grant for AIDS vascular research, and payment for development of educational presentations from BI, Bayer, BMS, and Pfizer for the preparation of university‐accredited symposiums and slide kits.
VT: VT has received, and currently holds grant support from the CIHR for research in venous thrombosis; has engaged in lectures sponsored by companies that manufacture anticoagulants (Leo Pharma, Bristol Myer Squibb, and Pfizer); has received a grant from a manufacturer of an anticoagulant (Sanofi Aventis).
MM: reports receiving funds from American Academy of Clinical Toxicology for creation of search strategies for systematic reviews, and from International Team for Implantology for peer reviewing of search strategy.
WG: WG reports board membership (Canadian Patient Safety Institute (Safer Health Care Now) National lead for venous thromboembolism prevention), consultancy (Bayer Healthcare, Pfizer, Sanofi) and payment for lectures (Bayer Healthcare, Leo Pharma, Sanofi) and development of educational presentations (Bayer Healthcare, Leo Pharma). Other support has been received by his institution from Sanofi for clinical and quality of care outreach programs. WG reports that these relationships in no way impact on his involvement with this Cochrane review.
Acknowledgements
Dr Kahn holds a Tier 1 Canada Research Chair in Venous Thromboembolism. Dr Kahn, Dr Tagalakis, Ms Emed, Dr Roussin, and Dr Geerts are investigators of the CanVECTOR Network (CIHR funding reference CDT‐142654). Dr Klil‐Drori is supported by a CanVECTOR fellowship award. Dr Filion is supported by a Junior II salary support award from the Fonds de recherche du Québec – Santé (Quebec Foundation for Health Research).
This review was funded by a Canadian Institutes for Health Research Knowledge Synthesis Grant (# 141001) and a Canadian Institutes for Health Research Foundation Grant to Dr Kahn (# 143346).
Version history
| Published | Title | Stage | Authors | Version |
| 2018 Apr 24 | Interventions for implementation of thromboprophylaxis in hospitalized patients at risk for venous thromboembolism | Review | Susan R Kahn, David R Morrison, Gisèle Diendéré, Alexandre Piché, Kristian B Filion, Adi J Klil‐Drori, James D Douketis, Jessica Emed, André Roussin, Vicky Tagalakis, Martin Morris, William Geerts | |
| 2013 Jul 16 | Interventions for implementation of thromboprophylaxis in hospitalized medical and surgical patients at risk for venous thromboembolism | Review | Susan R Kahn, David R Morrison, Jacqueline M Cohen, Jessica Emed, Vicky Tagalakis, Andre Roussin, William Geerts | |
| 2010 Jan 20 | Interventions for implementation of thromboprophylaxis in hospitalized medical and surgical patients at risk for venous thromboembolism | Protocol | Susan R Kahn, David R Morrison, Jessica Emed, Vicky Tagalakis, Ian Shrier | |
Differences between protocol and review
Our previous review included both randomized trials and non‐randomized studies (Kahn 2013). In this updated review, we decided to focus solely on randomized trials, as the risk of bias in the non‐randomized studies included in our last review was high. Details of the non‐randomized studies previously classed as included studies can be found in Kahn 2013. We had intended to address heterogeneity via subgroup analyses, but there were not enough trials in the meta‐analysis in question to examine subgroup effects. We also had intended to assess publication bias via funnel plots and cumulative meta‐analysis but there were not enough trials in each meta‐analysis to meaningfully interpret these analyses. However, we presented the funnel plots for all analyses except the sensitivity analyses in Appendix 9, for the sake of completeness.
We split the primary outcome 'Increase in the proportion of participants who received prophylaxis or received appropriate prophylaxis' into a primary outcome (Increase in the proportion of participants who received prophylaxis) and secondary outcome (Increase in the proportion of participants who received appropriate prophylaxis). We added the secondary outcomes 'decrease in the proportion of participants who developed any (i.e. symptomatic or asymptomatic) VTE (all VTE, any, proximal, or distal DVT, PE, fatal PE)' and decrease in the number of deaths (all‐cause mortality, sudden death)'. We assessed the certainty of the evidence according to the GRADE approach.
Keywords
MeSH
Medical Subject Headings (MeSH) Keywords
- *Hospitalization;
- Anticoagulants [therapeutic use];
- Australia;
- Europe;
- Hospitals;
- North America;
- Postoperative Complications [epidemiology, prevention & control];
- Pulmonary Embolism [epidemiology, prevention & control];
- Randomized Controlled Trials as Topic;
- Venous Thromboembolism [epidemiology, *prevention & control];
- Venous Thrombosis [epidemiology, prevention & control];
Medical Subject Headings Check Words
Adult; Humans;
PICO
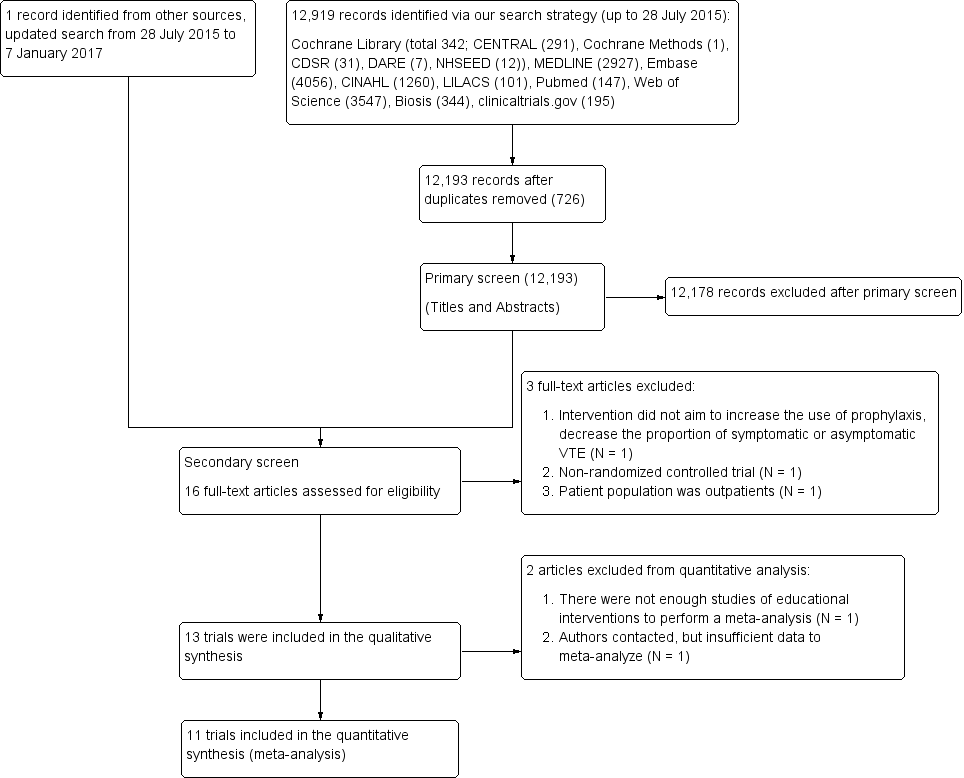
Study flow diagram.
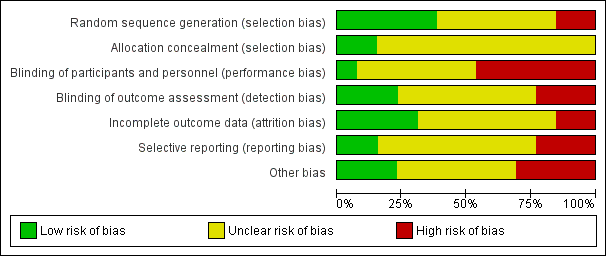
Summary of risk of bias: review authors’ judgements about each 'Risk of bias' item presented as percentages across all included studies
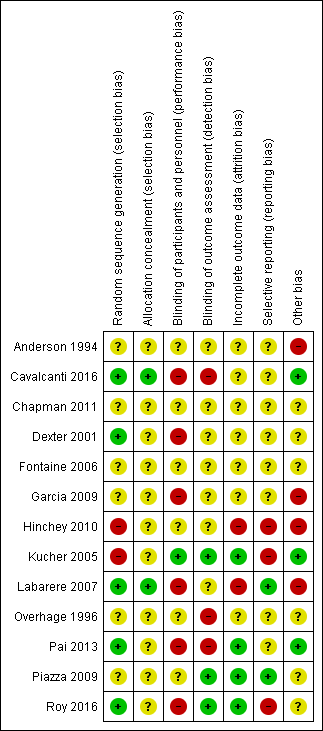
Summary of risk of bias: review authors’ judgements about each 'Risk of bias' item for each included study

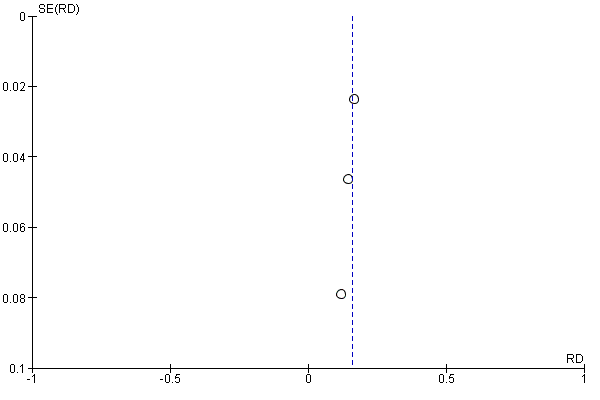
Funnel plot of comparison: 1 Alerts versus standard care, outcome: 1.1 Received prophylaxis.
Funnel plot of comparison: 1 Alerts versus standard care, outcome: 1.2 Received appropriate prophylaxis.

Funnel plot of comparison: 1 Alerts versus standard care, outcome: 1.3 Symptomatic VTE.

Funnel plot of comparison: 2 Multifaceted interventions versus standard care or another intervention, outcome: 2.1 Received prophylaxis (unadjusted).
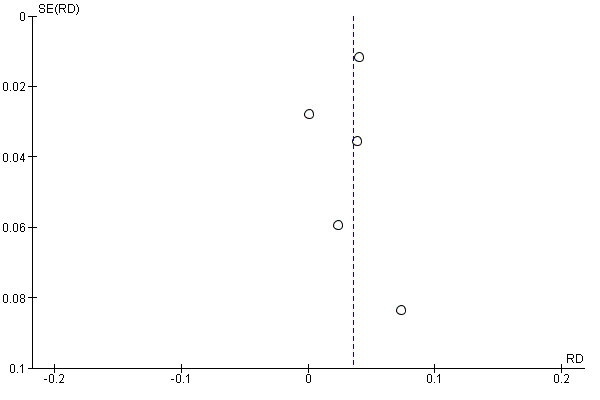
Funnel plot of comparison: 2 Multifaceted interventions versus standard care or another intervention, outcome: 2.2 Received prophylaxis (adjusted).

Comparison 1 Alerts versus standard care, Outcome 1 Received prophylaxis.

Comparison 1 Alerts versus standard care, Outcome 2 Received appropriate prophylaxis.

Comparison 1 Alerts versus standard care, Outcome 3 Symptomatic VTE.

Comparison 2 Multifaceted interventions versus standard care or another intervention, Outcome 1 Received prophylaxis (unadjusted).
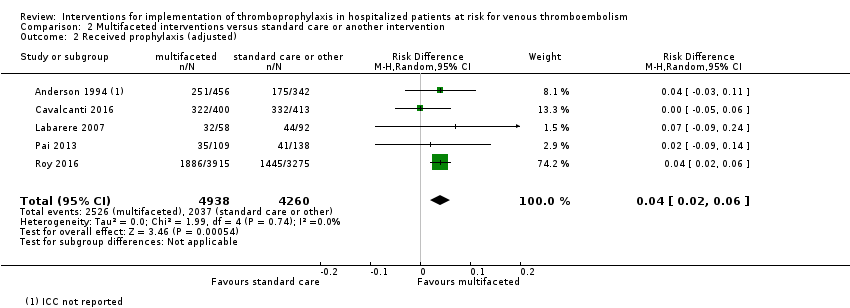
Comparison 2 Multifaceted interventions versus standard care or another intervention, Outcome 2 Received prophylaxis (adjusted).
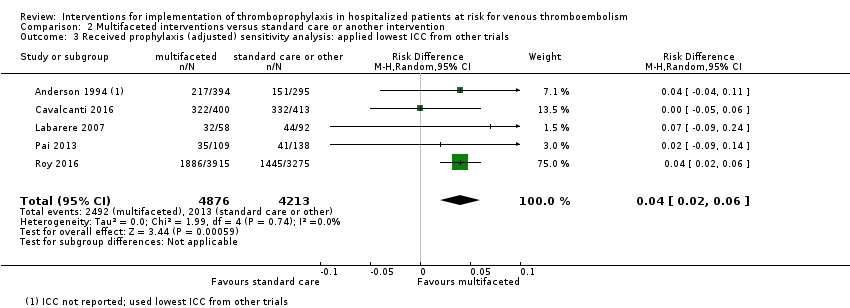
Comparison 2 Multifaceted interventions versus standard care or another intervention, Outcome 3 Received prophylaxis (adjusted) sensitivity analysis: applied lowest ICC from other trials.

Comparison 2 Multifaceted interventions versus standard care or another intervention, Outcome 4 Received prophylaxis (adjusted) sensitivity analysis: applied mean ICC from other trials.
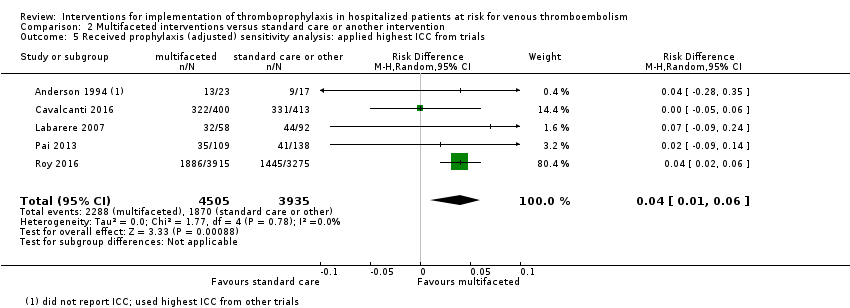
Comparison 2 Multifaceted interventions versus standard care or another intervention, Outcome 5 Received prophylaxis (adjusted) sensitivity analysis: applied highest ICC from trials.
| Computer or human alerts compared with standard care for VTE prophylaxis. | ||||||
| Patient or population: adult medical and surgical patients at risk for VTE Settings: hospital Intervention: automatic reminder systems, such as computer alerts or human alerts, designed to increase the implementation of thromboprophylaxis and/or decrease the incidence of symptomatic or asymptomatic VTE Comparison: standard care (no intervention) | ||||||
| Outcomes | Illustrative comparative risks* (95% CI) | Measures of effect (RD, RR) (95% CI; I²) | No of Participants | Quality of the evidence | Comments | |
| Assumed risk* | Corresponding risk | |||||
| Control group | Intervention group | |||||
| Received prophylaxis** (Follow‐up: 3 months) | Study population | RD 0.21 (0.15 to 0.27; 75%) | 5057 | ⊕⊕⊝⊝ | ||
| 178 per 1000 | 390 per 1000 | |||||
| Low risk population | ||||||
| 145 per 1000 | 318 per 1000 | |||||
| High risk population | ||||||
| 357 per 1000 | 782 per 1000 | |||||
| Received appropriate prophylaxis** (Follow‐up: 36 hours | Study population | RD 0.16 (0.12 to 0.20; 0%) | 1820 | ⊕⊕⊕⊝ | ||
| 305 per 1000 | 460 per 1000 | |||||
| Low risk population | ||||||
| 175 per 1000 | 249 per 1000 | |||||
| High risk population | ||||||
| 663 per 1000 | 941 per 1000 | |||||
| Symptomatic VTE (Follow‐up: 3 months) | Study population | RR 0.64 (0.47 to 0.86; 15%) | 5353 | ⊕⊕⊝⊝ | ||
| 56 per 1000 | 36 per 1000 | |||||
| Low risk population | ||||||
| 29 per 1000 | 19 per 1000 | |||||
| High risk population | ||||||
| 82 per 1000 | 52 per 1000 | |||||
| * Control risk was used as assumed risk (baseline risk), due to lack of well‐designed observational studies that measure this in detail to be presented as baseline risk for the population. The corresponding risk (and its 95% confidence interval) is based on the assumed risk in the comparison group and the relative effect of the intervention (and its 95% CI). ** Clustered trials did not provide sufficient data (intraclass correlation (ICC) or adjusted confidence intervals) for us to pool cluster adjusted estimates. CI: confidence interval; I²: statistical index of heterogeneity; RD: risk difference; RR: risk ratio; VTE: venous thromboembolism | ||||||
| GRADE Working Group grades of evidence | ||||||
| 1 We downgraded the level of certainty of evidence from high to low based on the following reasons: serious study limitations (quasi‐random sequence generation in 1/3 RCTs, no blinding of outcome assessment in 1/3 RCTs, selective reporting of safety outcomes in 1/3 RCTs. Random sequence generation, allocation concealment, blinding of participants and personnel, and other potential biases were unclear in most studies). No indirectness of evidence; some inconsistency of pooled results; no imprecision of pooled results; and undetected publication bias. 2 We downgraded the level of certainty of evidence from high to moderate based on the following reasons: serious study limitations (no blinding of participants and personnel in 2/3 RCTs, incorrect analysis that did not account for the clustered nature of the data in 1/3 RCTs. Random sequence generation, allocation concealment, blinding of outcome assessment, incomplete outcome data, selective reporting, and other potential biases were unclear in most studies). No indirectness of evidence; no inconsistency and imprecision of pooled RD results; and undetected publication bias. 3 We downgraded the level of certainty of evidence from high to low based on the following reasons: serious study limitations (quasi‐random sequence generation in 1/3 RCTs, selective reporting of safety outcomes in 1/3 RCTs. Random sequence generation, allocation concealment, blinding of participants and personnel, and other potential biases were unclear in most studies). No indirectness of evidence, no inconsistency of pooled RR results, some imprecision of pooled results related to the small number of events, and undetected publication bias. | ||||||
| Multifaceted interventions compared with standard care or another type of intervention for VTE prophylaxis. | ||||||
| Patient or population: adult medical and surgical patients at risk for VTE Settings: hospital Intervention: multifaceted interventions (combination of interventions that may include education, audit and feedback, and alert), designed to trigger need for thromboprophylaxis Comparison: standard care (no intervention) or another type of intervention* | ||||||
| Outcomes | Illustrative comparative risks** (95% CI) | Absolute effect (RD) (95% CI; I²) | No of Participants | Quality of the evidence | Comments | |
| Assumed risk** | Corresponding risk | |||||
| Control group | Intervention group | |||||
| Received prophylaxis (Unadjusted; Follow‐up: 2 to 4 months) | Study population | RD 0.03 (0.00 to 0.05; 64%) | 26,330 | ⊕⊕⊕⊝ | Clustered trials did not provide sufficient data (intraclass correlation (ICC) or adjusted confidence intervals) for us to pool cluster‐adjusted estimates Length of follow‐up was not specified in one study (Labarere 2007) | |
| 526 per 1000 | 558 per 1000 | |||||
| Low risk population | ||||||
| 299 per 1000 | 317 per 1000 | |||||
| High risk population | ||||||
| 803 per 1000 | 851 per 1000 | |||||
| Received prophylaxis (Adjusted; Follow‐up: 2 to 4 months) | Study population | RD 0.04 (0.02 to 0.06; 0%) | 9198 | ⊕⊕⊕⊝ | ICCs were available for 4/5 (Cavalcanti 2016 = 0.13, Labarere 2007 = 0.24, Pai 2013 = 0.022, Roy 2016 = 0.002) trials included in this meta‐analysis. ICC's were not available for Anderson 1994. Adjustment for the cluster design effect was performed via reported ICCs, no ICC was applied to the one trial that did not report an ICC (Anderson 1994) Total patients are lower because cluster design effect applied to the numbers of events and participants. Length of follow‐up was not specified in one study (Labarere 2007) | |
| 478 per 1000 | 507 per 1000 | |||||
| Low risk population | ||||||
| 297 per 1000 | 315 per 1000 | |||||
| High risk population | ||||||
| 804 per 1000 | 852 per 1000 | |||||
| * 'another type of intervention' was a multifaceted intervention targeted at different types of healthcare professionals (intervention targeted physicians and nurses; control targeted physicians only). ** Control risk was used as assumed risk (baseline risk), due to lack of well‐designed observational studies that measure this in detail to be presented as baseline risk for the population.The corresponding risk (and its 95% confidence interval) is based on the assumed risk in the comparison group and the relative effect of the intervention (and its 95% CI). CI: confidence interval; I²: Statistical index of heterogeneity; ICC: intraclass correlation; RCT: randomized controlled trial; RD: risk difference; VTE: venous thromboembolism | ||||||
| GRADE Working Group grades of evidence | ||||||
| 1 We downgraded the level of certainty of evidence from high to moderate based on the following reasons: serious study limitations (no blinding of participants and personnel in 4/5 RCTs, no blinding of outcome assessment in 2/5 RCTs, incomplete outcome data in 1/5 RCTs, selective reporting in 1/5 RCTs, baseline imbalances and incorrect analysis in 1/5 RCTs, and loss of clusters in 1/5 RCTs. Allocation concealment and selective reporting were unclear in most studies. No indirectness of evidence; no inconsistency and imprecision of pooled results; and undetected publication bias. | ||||||
| Quantitative risk of bias score for sensitivity analysis | ||
| Trial | Summary ROB Score | Overall ROB |
| ‐1 | Unclear | |
| +1 | Unclear | |
| 0 | Unclear | |
| 0 | Unclear | |
| 0 | Unclear | |
| ‐2 | High | |
| ‐4 | High | |
| +2 | Low | |
| 0 | Unclear | |
| ‐1 | Unclear | |
| +1 | Unclear | |
| +3 | Low | |
| +1 | Unclear | |
| ROB: risk of bias | ||
| Intervention | Outcome | Risk Difference (RD) (95% CI) | I² Statistic for RD | Relative Risk (RR) (95% CI) |
| Multifaceted unadjusted | Received prophylaxis | 0.03 (0.00 to 0.05) | 64% | 1.07 (1.00 to 1.14) |
| Multifaceted adjusted | Received prophylaxis | 0.04 (0.02 to 0.06) | 0% | 1.06 (1.02 to 1.11) |
| Multifaceted lowest ICC | Received prophylaxis | 0.04 (0.02 to 0.06) | 0% | 1.06 (1.02 to 1.11) |
| Multifaceted mean ICC | Received prophylaxis | 0.04 (0.01 to 0.06) | 0% | 1.06 (1.01 to 1.11) |
| Multifaceted highest ICC | Received prophylaxis | 0.04 (0.01 to 0.06) | 0% | 1.06 (1.01 to 1.11) |
| ICCs were available for 4/5 (Cavalcanti 2016 = 0.13, Labarere 2007 = 0.24, Pai 2013 = 0.022, Roy 2016 = 0.002) trials included in this meta‐analysis. ICC's were not available for Anderson 1994. In this table adjustment for the cluster design effect was performed via reported ICCs. No ICC was applied to the one trial that did not report an ICC (Anderson 1994). We performed a sensitivity analysis using the lowest reported ICC (0.002), the mean reported ICC (0.0985), and the highest reported ICC (0.24) for the trial that did not report an ICC (Anderson 1994). All trials in the meta‐analysis were clustered designs. | ||||
| ICC: intracluster correlation Anderson 1994; Cavalcanti 2016; Labarere 2007; Pai 2013; Roy 2016 | ||||
| Outcomes | Number of studies | Risk Difference (RD) | 95% Confidence interval | Events, intervention | Events, control |
| Received prophylaxis | 3 | 0.21 | (0.15 to 0.27) | 1003/2523 | 451/2534 |
| Received appropriate prophylaxis | 3 | 0.16 | (0.12 to 0.20) | 419/906 | 279/914 |
| Venous thromboembolism outcomes | Number of studies | Risk Ratio (RR) | 95% Confidence interval | Events, intervention | Events, control |
| Symptomatic VTE | 3 | 0.64 | (0.47 to 0.86) | 94/2675 | 149/2678 |
| Symptomatic DVT | 2 | 0.43a | (0.23 to 0.78) | 15/1255 | 35/1251 |
| 0.80b | (0.44 to 1.46) | 19/1238 | 24/1255 | ||
| Symptomatic PE | 2 | 0.40a | (0.22 to 0.74) | 14/1255 | 35/1251 |
| 0.63b | (0.21 to 1.93) | 5/1238 | 8/1255 | ||
| Asymptomatic VTE | ‐ | ‐ | ‐ | ‐ | ‐ |
| Asymptomatic DVT | ‐ | ‐ | ‐ | ‐ | ‐ |
| Asymptomatic PE | ‐ | ‐ | ‐ | ‐ | ‐ |
| Mortality | Number of studies | Risk Ratio (RR) | 95% Confidence interval | Events, intervention | Events, control |
| All‐cause mortality | 2 | 1.01a | (0.87 to 1.17) | 282/1255 | 279/1251 |
| 1.04b | (0.88 to 1.24) | 215/1238 | 209/1255 | ||
| Sudden death | ‐ | ‐ | ‐ | ‐ | ‐ |
| Safety outcomes | Number of studies | Risk Ratio (RR) | 95% Confidence interval | Events, intervention | Events, control |
| Major bleeding | 2 | 1.00a | (0.53 to 1.87) | 19/1255 | 19/1251 |
| 0.91b | (0.53 to 1.54) | 25/1238 | 28/1255 | ||
| Minor bleeding | 1 | 0.92a | (0.69 to 1.23) | 81/1255 | 88/1251 |
| Thrombocytopenia | ‐ | ‐ | ‐ | ‐ | ‐ |
| DVT: deep vein thrombosis Chapman 2011; Dexter 2001; Garcia 2009; Kucher 2005; Piazza 2009; Overhage 1996 | |||||
| Outcomes | Number of studies | Risk Difference (RD) | 95% Confidence interval | Events, intervention | Events, control |
| Received prophylaxis | 2 | 0.19a | (0.16 to 0.22) | 421/1255 | 182/1251 |
| 0.08b | (‐0.17 to 0.33) | 13/30 | 10/28 | ||
| Received appropriate prophylaxis | 1 | 0.17c | (0.12 to 0.21) | 228/664 | 116/662 |
| Venous thromboembolism outcomes | Number of studies | Risk Ratio (RR) | 95% Confidence interval | Events, intervention | Events, control |
| Symptomatic VTE | 1 | 0.59a | (0.43 to 0.80) | 61/1255 | 103/1251 |
| Symptomatic DVT | 1 | 0.43a | (0.23 to 0.78) | 15/1255 | 35/1251 |
| Symptomatic PE | 1 | 0.40a | (0.22 to 0.74) | 14/1255 | 35/1251 |
| Asymptomatic VTE | ‐ | ‐ | ‐ | ‐ | ‐ |
| Asymptomatic DVT | ‐ | ‐ | ‐ | ‐ | ‐ |
| Asymptomatic PE | ‐ | ‐ | ‐ | ‐ | ‐ |
| Mortality | Number of studies | Risk Ratio (RR) | 95% Confidence interval | Events, intervention | Events, control |
| All‐cause mortality | 1 | 1.01a | (0.87 to 1.17) | 282/1255 | 279/1251 |
| Sudden death | ‐ | ‐ | ‐ | ‐ | ‐ |
| Safety outcomes | Number of studies | Risk Ratio (RR) | 95% Confidence interval | Events, intervention | Events, control |
| Major bleeding | 1 | 1.00a | (0.53 to 1.87) | 19/1255 | 19/1251 |
| Minor bleeding | 1 | 0.92a | (0.69 to 1.23) | 81/1255 | 88/1251 |
| Thrombocytopenia | ‐ | ‐ | ‐ | ‐ | ‐ |
| DVT: deep vein thrombosis | |||||
| Outcomes | Number of studies | Risk Difference (RD) | 95% Confidence interval | Events, intervention | Events, control |
| Received prophylaxis | 1 | 0.25a | (0.22 to 0.29) | 569/1238 | 259/1255 |
| Received appropriate prophylaxis | 2 | 0.14b | (0.05 to 0.24) | 147/182 | 114/172 |
| 0.12c | (‐0.03 to 0.28) | 44/60 | 49/80 | ||
| Venous thromboembolism outcomes | Number of studies | Risk Ratio (RR) | 95% Confidence interval | Events, intervention | Events, control |
| Symptomatic VTE | 2 | 0.79a | (0.50 to 1.25) | 32/1238 | 41/1255 |
| 0.19b | (0.02 to 1.60) | 1/182 | 5/172 | ||
| Symptomatic DVT | 1 | 0.80a | (0.44 to 1.46) | 19/1238 | 24/1255 |
| Symptomatic PE | 1 | 0.63a | (0.21 to 1.93) | 5/1238 | 8/1255 |
| Asymptomatic VTE | ‐ | ‐ | ‐ | ‐ | ‐ |
| Asymptomatic DVT | ‐ | ‐ | ‐ | ‐ | ‐ |
| Asymptomatic PE | ‐ | ‐ | ‐ | ‐ | ‐ |
| Mortality | Number of studies | Risk Ratio (RR) | 95% Confidence interval | Events, intervention | Events, control |
| All‐cause mortality | 1 | 1.04a | (0.88 to 1.24) | 215/1238 | 209/1255 |
| Sudden death | ‐ | ‐ | ‐ | ‐ | ‐ |
| Safety outcomes | Number of studies | Risk Ratio (RR) | 95% Confidence interval | Events, intervention | Events, control |
| Major bleeding | 1 | 0.91a | (0.53 to 1.54) | 25/1238 | 28/1255 |
| Minor bleeding | ‐ | ‐ | ‐ | ‐ | ‐ |
| Thrombocytopenia | ‐ | ‐ | ‐ | ‐ | ‐ |
| DVT: deep vein thrombosis | |||||
| Outcomes | Number of studies | Risk Difference (RD) | 95% Confidence interval | Events, intervention | Events, control |
| Received prophylaxis | 5 | 0.03 | (0.00 to 0.05) | 7306/13611 | 6509/12722 |
| Received appropriate prophylaxis | 2 | 0.03a | (‐0.00 to 0.06) | 263/1154 | 290/1457 |
| 0.02b | (0.01 to 0.03) | 1474/8359 | 1094/6992 | ||
| Venous thromboembolism outcomes | Number of studies | Risk Ratio (RR) | 95% Confidence interval | Events, intervention | Events, control |
| Symptomatic VTE | 1 | 0.97b | (0.77 to 1.23) | 150/8068 | 128/6692 |
| Symptomatic DVT | 1 | 1.17b | (0.76 to 1.81) | 48/8068 | 34/6692 |
| Symptomatic PE | 1 | 0.71b | (0.44 to 1.15) | 31/8068 | 36/6692 |
| Asymptomatic VTE | ‐ | ‐ | ‐ | ‐ | ‐ |
| Asymptomatic DVT | 1 | 1.21c | (0.86 to 1.70) | 49/315 | 64/497 |
| Asymptomatic PE | ‐ | ‐ | ‐ | ‐ | ‐ |
| Mortality | Number of studies | Risk Ratio (RR) | 95% Confidence interval | Events, intervention | Events, control |
| All‐cause mortality | 2 | 1.02b | (0.93 to 1.12) | 940/8298 | 764/6884 |
| 0.95d | (0.88 to 1.01) | 1096/3327 | 1196/3434 | ||
| Sudden death | 1 | 1.01b | (0.72 to 1.43) | 72/8298 | 59/6884 |
| Safety outcomes | Number of studies | Risk Ratio (RR) | 95% Confidence interval | Events, intervention | Events, control |
| Major bleeding | 1 | 0.96b | (0.72 to 1.28) | 100/8068 | 86/6692 |
| Minor bleeding | ‐ | ‐ | ‐ | ‐ | ‐ |
| Thrombocytopenia | 1 | 0.53c | (0.02 to 12.86) | 0/315 | 1/497 |
| DVT: deep vein thrombosis Anderson 1994 CME + QA Group; Cavalcanti 2016; Hinchey 2010; Labarere 2007; Pai 2013; Roy 2016 | |||||
| Outcomes | Number of studies | Risk Difference (RD) | 95% Confidence interval | Events, intervention | Events, control |
| Received prophylaxis | 1 | ‐0.02 | (‐0.09 to 0.05) | 252/513 | 175/342 |
| Received appropriate prophylaxis | ‐ | ‐ | ‐ | ‐ | ‐ |
| Venous thromboembolism outcomes | Number of studies | Risk Ratio (RR) | 95% Confidence interval | Events, intervention | Events, control |
| Symptomatic VTE | ‐ | ‐ | ‐ | ‐ | ‐ |
| Symptomatic DVT | ‐ | ‐ | ‐ | ‐ | ‐ |
| Symptomatic PE | ‐ | ‐ | ‐ | ‐ | ‐ |
| Asymptomatic DVT | ‐ | ‐ | ‐ | ‐ | ‐ |
| Asymptomatic PE | ‐ | ‐ | ‐ | ‐ | ‐ |
| Mortality | Number of studies | Risk Ratio (RR) | 95% Confidence interval | Events, intervention | Events, control |
| All‐cause mortality | ‐ | ‐ | ‐ | ‐ | ‐ |
| Sudden death | ‐ | ‐ | ‐ | ‐ | ‐ |
| Safety outcomes | Number of studies | Risk Ratio (RR) | 95% Confidence interval | Events, intervention | Events, control |
| Major bleeding | ‐ | ‐ | ‐ | ‐ | ‐ |
| Minor bleeding | ‐ | ‐ | ‐ | ‐ | ‐ |
| Thrombocytopenia | ‐ | ‐ | ‐ | ‐ | ‐ |
| Anderson 1994 CME group | |||||
| DVT: deep vein thrombosis | |||||
| Outcomes | Number of studies | Risk Difference (RD) | 95% Confidence interval | Events, intervention | Events, control |
| Received prophylaxis | 1 | ‐0.05 | (‐0.12 to 0.02) | 115/360 | 133/359 |
| Received appropriate prophylaxis | ‐ | ‐ | ‐ | ‐ | ‐ |
| Venous thromboembolism outcomes | Number of studies | Risk Ratio (RR) | 95% Confidence interval | Events, intervention | Events, control |
| Symptomatic VTE | ‐ | ‐ | ‐ | ‐ | ‐ |
| Symptomatic DVT | ‐ | ‐ | ‐ | ‐ | ‐ |
| Symptomatic PE | ‐ | ‐ | ‐ | ‐ | ‐ |
| Asymptomatic VTE | ‐ | ‐ | ‐ | ‐ | ‐ |
| Asymptomatic DVT | ‐ | ‐ | ‐ | ‐ | ‐ |
| Asymptomatic PE | ‐ | ‐ | ‐ | ‐ | ‐ |
| Mortality | Number of studies | Risk Ratio (RR) | 95% Confidence interval | Events, intervention | Events, control |
| All‐cause mortality | ‐ | ‐ | ‐ | ‐ | ‐ |
| Sudden death | ‐ | ‐ | ‐ | ‐ | ‐ |
| Safety outcomes | Number of studies | Risk Ratio (RR) | 95% Confidence interval | Events, intervention | Events, control |
| Major bleeding | ‐ | ‐ | ‐ | ‐ | ‐ |
| Minor bleeding | ‐ | ‐ | ‐ | ‐ | ‐ |
| Thrombocytopenia | ‐ | ‐ | ‐ | ‐ | ‐ |
| DVT: deep vein thrombosis | |||||
| Outcome or subgroup title | No. of studies | No. of participants | Statistical method | Effect size |
| 1 Received prophylaxis Show forest plot | 3 | 5057 | Risk Difference (M‐H, Random, 95% CI) | 0.21 [0.15, 0.27] |
| 2 Received appropriate prophylaxis Show forest plot | 3 | 1820 | Risk Difference (M‐H, Random, 95% CI) | 0.16 [0.12, 0.20] |
| 3 Symptomatic VTE Show forest plot | 3 | 5353 | Risk Ratio (M‐H, Random, 95% CI) | 0.64 [0.47, 0.86] |
| Outcome or subgroup title | No. of studies | No. of participants | Statistical method | Effect size |
| 1 Received prophylaxis (unadjusted) Show forest plot | 5 | 26330 | Risk Difference (M‐H, Random, 95% CI) | 0.03 [0.00, 0.05] |
| 2 Received prophylaxis (adjusted) Show forest plot | 5 | 9198 | Risk Difference (M‐H, Random, 95% CI) | 0.04 [0.02, 0.06] |
| 3 Received prophylaxis (adjusted) sensitivity analysis: applied lowest ICC from other trials Show forest plot | 5 | 9089 | Risk Difference (M‐H, Random, 95% CI) | 0.04 [0.02, 0.06] |
| 4 Received prophylaxis (adjusted) sensitivity analysis: applied mean ICC from other trials Show forest plot | 5 | 8491 | Risk Difference (M‐H, Random, 95% CI) | 0.03 [0.01, 0.06] |
| 5 Received prophylaxis (adjusted) sensitivity analysis: applied highest ICC from trials Show forest plot | 5 | 8440 | Risk Difference (M‐H, Random, 95% CI) | 0.04 [0.01, 0.06] |