| 1 All‐cause mortality Show forest plot | 4 | 477 | Risk Ratio (M‐H, Random, 95% CI) | 1.40 [0.38, 5.15] |
|
| 2 Commencement of dialysis Show forest plot | 4 | 301 | Risk Ratio (M‐H, Random, 95% CI) | 0.76 [0.36, 1.62] |
|
| 3 Fracture Show forest plot | 1 | | Risk Ratio (M‐H, Random, 95% CI) | Totals not selected |
|
| 4 Parathyroidectomy Show forest plot | 1 | | Risk Ratio (M‐H, Random, 95% CI) | Totals not selected |
|
| 5 Improvement in bone histomorphometry Show forest plot | 1 | | Risk Ratio (M‐H, Random, 95% CI) | Totals not selected |
|
| 6 End of treatment osteoid volume (mm³/cm³) Show forest plot | 1 | | Mean Difference (IV, Random, 95% CI) | Totals not selected |
|
| 7 End of treatment osteoid thickness (µm) Show forest plot | 1 | | Mean Difference (IV, Random, 95% CI) | Totals not selected |
|
| 8 Development of osteitis fibrosa Show forest plot | 2 | 43 | Risk Ratio (M‐H, Random, 95% CI) | 0.54 [0.23, 1.29] |
|
| 9 Development of osteomalacia Show forest plot | 1 | | Risk Ratio (M‐H, Random, 95% CI) | Totals not selected |
|
| 10 End of treatment parathyroid hormone (pg/mL) Show forest plot | 4 | 153 | Mean Difference (IV, Random, 95% CI) | ‐49.34 [‐85.70, ‐12.97] |
|
| 11 Reduction of serum PTH > 30% from baseline value Show forest plot | 2 | 264 | Risk Ratio (M‐H, Random, 95% CI) | 7.87 [4.87, 12.73] |
|
| 12 One or more episodes of hypercalcaemia Show forest plot | 7 | 612 | Risk Ratio (M‐H, Random, 95% CI) | 3.04 [1.17, 7.90] |
|
| 13 One or more episodes of hyperphosphataemia Show forest plot | 2 | 245 | Risk Ratio (M‐H, Random, 95% CI) | 1.58 [0.47, 5.30] |
|
| 14 One or more episodes of elevated calcium x phosphorus product Show forest plot | 3 | 300 | Risk Ratio (M‐H, Random, 95% CI) | 1.63 [0.57, 4.66] |
|
| 15 End of treatment serum phosphorus (mg/dL) Show forest plot | 3 | 140 | Mean Difference (IV, Random, 95% CI) | 0.37 [0.09, 0.66] |
|
| 16 End of treatment serum calcium (mg/dL) Show forest plot | 5 | 184 | Mean Difference (IV, Random, 95% CI) | 0.20 [0.17, 0.23] |
|
| 17 End of treatment alkaline phosphatase (U/L) Show forest plot | 2 | 38 | Mean Difference (IV, Random, 95% CI) | ‐21.81 [‐40.39, ‐3.22] |
|
| 18 End of treatment CrCl (mL/min) Show forest plot | 4 | 111 | Mean Difference (IV, Random, 95% CI) | ‐1.68 [‐6.92, 3.56] |
|
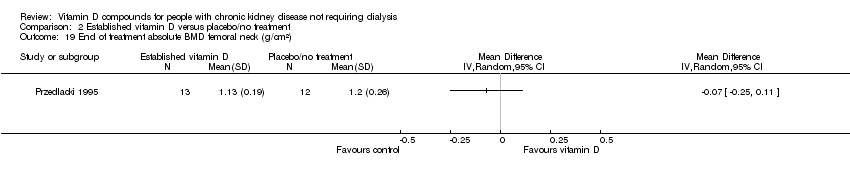
| 19 End of treatment absolute BMD femoral neck (g/cm²) Show forest plot | 1 | | Mean Difference (IV, Random, 95% CI) | Totals not selected |
|
| 20 End of treatment absolute BMD lumbar spine (g/cm²) Show forest plot | 1 | | Mean Difference (IV, Random, 95% CI) | Totals not selected |
|
| 21 Worsening vascular calcification Show forest plot | 1 | | Risk Ratio (M‐H, Random, 95% CI) | Totals not selected |
|
| 22 Development of vascular calcification Show forest plot | 1 | | Risk Ratio (M‐H, Random, 95% CI) | Totals not selected |
|
| 23 Withdrawal of treatment due to hypercalcaemia Show forest plot | 1 | | Risk Ratio (M‐H, Random, 95% CI) | Totals not selected |
|