Contenido relacionado
Revisiones y protocolos relacionados
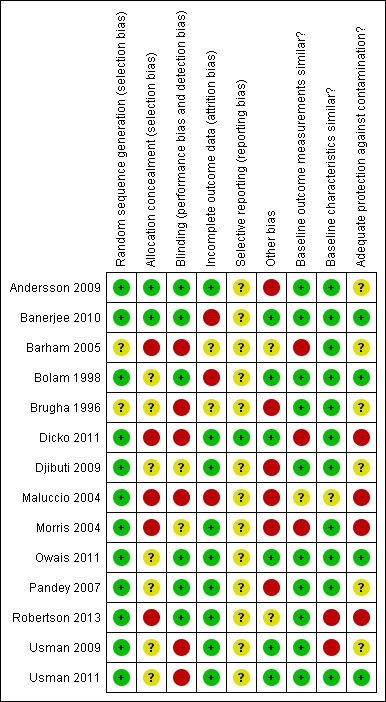
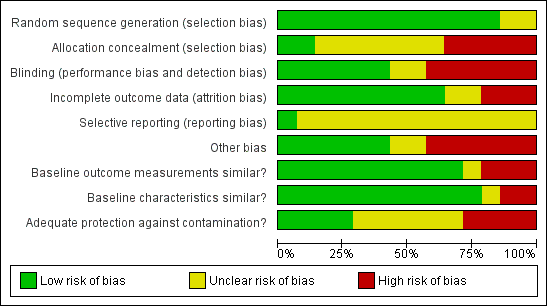
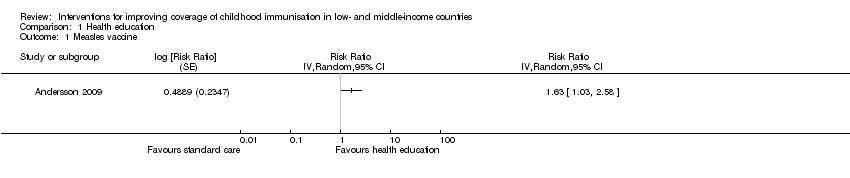
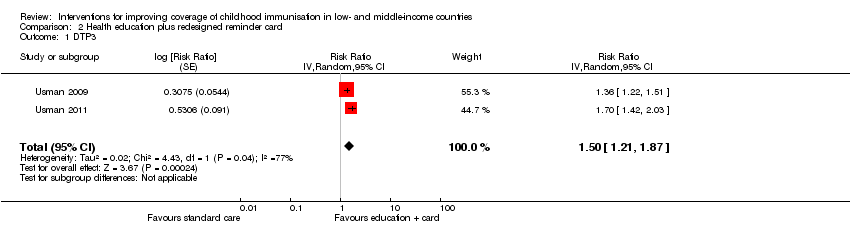
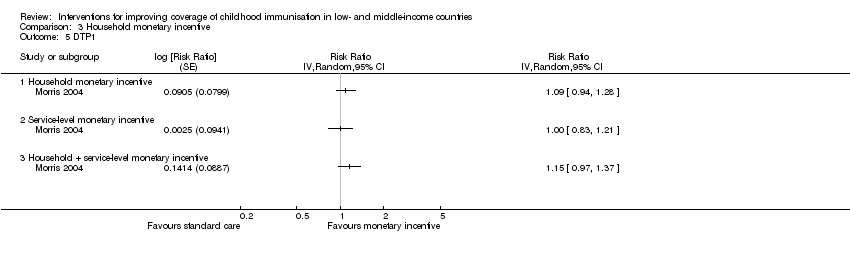
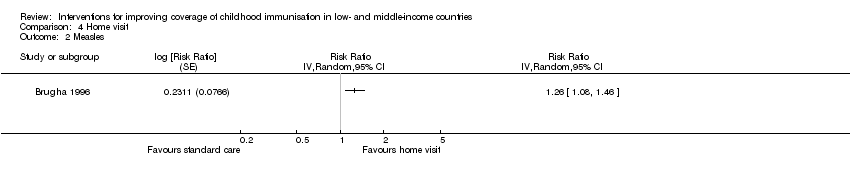
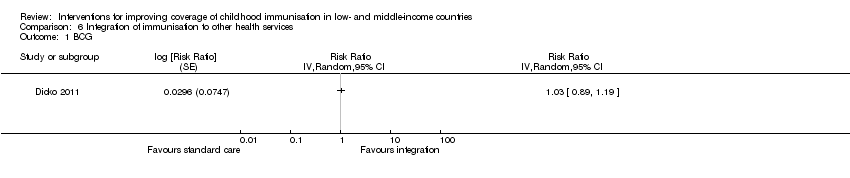
Intervenciones para mejorar la cobertura de vacunación infantil en países de ingresos bajos y medios
Angela Oyo-Ita, Olabisi Oduwole, Dachi Arikpo, Emmanuel E Effa, Ekpereonne B Esu, Yusentha Balakrishna, Moriam T Chibuzor, Chioma M Oringanje, Chukwuemeka E Nwachukwu, Charles S Wiysonge, Martin M Meremikwu | 6 diciembre 2023
Willem A Odendaal, Kim Ward, Jesse Uneke, Henry Uro‐Chukwu, Dereck Chitama, Yusentha Balakrishna, Tamara Kredo | 3 abril 2018
Mylene Lagarde, Natasha Palmer | 13 abril 2011
Marianna Purgato, Eleonora Prina, Caterina Ceccarelli, Camilla Cadorin, Jibril O Abdulmalik, Francesco Amaddeo, Lyria Arcari, Rachel Churchill, Mark JD Jordans, Crick Lund, Davide Papola, Eleonora Uphoff, Nadja van Ginneken, Wietse Anton Tol, Corrado Barbui | 24 octubre 2023
Charles S Wiysonge, Leila H Abdullahi, Valantine N Ndze, Gregory D Hussey | 11 agosto 2016
Sami Pande, Janet E Hiller, Nancy Nkansah, Lisa Bero | 28 febrero 2013
Nicholas P Oliphant, Samuel Manda, Karen Daniels, Willem A Odendaal, Donela Besada, Mary Kinney, Emily White Johansson, Tanya Doherty | 10 febrero 2021
Karin Diaconu, Jennifer Falconer, Adrian Verbel, Atle Fretheim, Sophie Witter | 5 mayo 2021
Blanca Peñaloza, Tomas Pantoja, Gabriel Bastías, Cristian A Herrera, Gabriel Rada | 7 septiembre 2011
Lilian Dudley, Paul Garner | 6 julio 2011
Respuestas clínicas Cochrane
Sera Tort, Michael Eisenhut | 27 abril 2017