促進中、低收入國家幼童疫苗接種覆蓋率的介入措施
Abstract
背景
疫苗接種(Immunisation)為提升兒童存活率有力的公共衛生政策之一,不僅能直接對抗導致兒童死亡的重大疾病,也提供了其他健康服務的平台。然而,全世界每年數百萬的兒童,其大多來自低收入和中等 收入的國家(LMICs),並沒有完成其國家制定的疫苗接種時程。此篇回顧更新2011年發表的考科藍文獻回顧,並聚焦於改善所有中低收入國家(LMICs)的兒童疫苗接種覆蓋率的介入措施。
目的
評估介入策略的有效性,以提高及維持所有在中低收入國家(LMICs)之兒童的高疫苗接種覆蓋率。
搜尋策略
我們搜尋了考科藍圖書館中的─ Cochrane Central Register of Controlled Trials(CENTRAL) 2016, 第 4期www.cochranelibrary.com,並包括 Cochrane Effective Practice and Organisation of Care (EPOC) Group Specialised Register (2016年5月12日搜尋);MEDLINE In‐Process and Other Non‐Indexed Citations, MEDLINE Daily and MEDLINE 1946年至現今, OvidSP (2016年5月12日搜尋); CINAHL 1981年至現今, EbscoHost (2016年5月12日搜尋); Embase 1980年到 2014年第34週, OvidSP (2014年9月2日搜尋); LILACS, VHL (2014年9月2日搜尋); Sociological Abstracts 1952年至現今, ProQuest (2014年9月2日搜尋)。所有納入研究我們進一步搜尋1975年至現今的科學引文索引(Science Citation Index)及社會科學引文索引(Social Sciences Citation Index)1;2015年至現今的Emerging Sources Citation Index,及ISI Web of Science ( 2016年7月2日搜尋)。我們還搜尋了兩個試驗註冊資料庫:ICTRP及ClinicalTrials.gov(2016年7月5日搜尋)。
選擇標準
符合納入條件的研究為執行於中低收入國家(LMICs)之出生到4歲兒童、護理人員和醫療保健機構的 隨機對照試驗、非隨機對照試驗、控制前後對照研究(controlled before‐after studies) 及以中斷性時間序列(interrupted time‐series)設計之試驗。
資料收集與分析
我們獨立篩選搜尋結果、檢視可能符合條件的文章全文、評估偏差風險,以及重複萃取數據;以共識解決不一致之處。我們以隨機效應模式進行統合分析並用GRADE評估證據的確定性。
主要結果
14個研究(10個叢集隨機對照試驗(cluster RCTs)和4個獨立隨機對照試驗)符合我們的納入標準。這些研究分別執行於喬治亞(1個研究)、加納(1個研究)、宏都拉斯(1個研究)、印度(2個研究)、馬利共和國(1個研究)、墨西哥(1個研究)、尼加拉瓜(1個研究)、尼泊爾(1個研究)、巴基斯坦(4個研究)和辛巴威(1個研究)等國家。一個研究有不明確的偏差風險、其他的13個研究有高偏差風險。這些納入研究評估之介入措施為社區基礎健康教育(3個研究)、機構基礎健康教育(3個研究)、家庭誘因(3個研究)、定期免疫接種推廣計畫(1個研究)、家庭訪視(1個研究)、支持性的監管(1個研究)、訊息推廣活動(1個研究),以及結合瘧疾間歇性預防治療的免疫接種服務(1個研究)。
我們發現有中等確定性的證據顯示村落集會或居家的衛教可能提升三劑白喉‐破傷風‐百日咳三合一疫苗(diphtheria‐tetanus‐pertussis vaccines, DTP3)的接種覆蓋率(DTP3: 風險比(RR) 1.68, 95% 信賴區間(CI) 1.09 到 2.59)。我們也發現有低確定性的證據顯示在機構內的衛教搭配上重新設計的疫苗施打提醒卡可提升三合一疫苗的接種覆蓋率(RR 1.50,95%CI 1.21 到1.87)。而家庭金錢的誘因對於全面疫苗覆蓋率可能有些許或沒有影響(RR 1.05, 95%CI 0.90到1.23, 低確定性證據)。定期接種疫苗的推廣有可能提升完全接種覆蓋率(RR3.09,95%CI 1.69 到 5.67, 低確定性證據),而如果與家庭獎勵誘因結合,則可能有顯著性的改善 (RR 6.66, 95% CI 3.93 到 11.28, 低確定性證據)。家訪發現沒有接種疫苗的兒童並轉介到診所可能會提高三劑口服脊髓灰質炎疫苗的使用(RR 1.22,95%CI 1.07 到 1.39,低確定性證據)。而結合疫苗接種與其他服務以提升三合一疫苗接種覆蓋率的可能性則呈現低的證據確定性(RR 1.92, 95%CI 1.42 到 2.59)。
作者結論
提供疫苗接種的訊息給家長與社區成員、結合機構內衛教與發給重新設計的疫苗接種提醒卡、定期疫苗施打推廣(無論有沒有發放家戶獎勵金)、家訪以及結合疫苗施打於其他服務,都可能提升中低收入國家(LMIC)孩童的疫苗接種覆蓋率。 大部分的證據確定性都比較低,這意味了介入措施的真實效果很可能極為不同。 因此針對提升中低收入國家(LMICs)孩童的疫苗接種覆蓋率,有必要進行設計更良好的隨機對照實驗(RCTs)來驗證介入的效果。
PICO
Plain language summary
可能增加和持續在低收入和中等收入國家疫苗接種的介入措施
此回顧研究的目的是什麼?
本篇考科藍文獻回顧的目的是評估為了預防疾病感染而增加中低收入國家孩童接種疫苗數量之不同策略的成果。 考科藍研究人員收集分析所有相關研究來回答這個問題,共找到14篇相關研究
這些策略有改善兒童疫苗接種工作嗎?
提供有關預防接種的訊息給家長和社區成員、發放特別設計的疫苗接種提醒卡、在例行疫苗接種中搭配或不搭配家戶獎勵提供疫苗接種、藉著家訪發現沒有接種疫苗的孩童並轉介他們到診所,以及將疫苗接種服務結合其他服務,都可能讓更多兒童接種到疫苗。然而,提供父母金錢以讓他們的孩子接種疫苗,可能不會增加疫苗接種率。大多數的研究是低確定性證據,我們需要更多在這方面執行良好的研究。
本回顧研究研究了什麼?
數以百萬在中、低收入國家的兒童,仍從本來可以利用疫苗接種預防的疾病中死亡,這是由許多的原因造成,各國政府與其他單位一直在嘗試不同的策略,以提高接種疫苗的兒童人數。
本回顧研究的主要結果是什麼?
研究者發現14個來自喬治亞、加納、宏都拉斯、印度、馬利共和國、墨西哥、尼加拉瓜、尼泊爾、巴基斯坦和辛巴威的相關研究。這些研究比較接受到這些接種策略的人與只有接受一般醫療服務的人。研究結果如下:
在村莊集會或家中,提供訊息並與家長以及其他社區成員討論疫苗接種,可能使更多兒童接種到三劑的白喉 ‐ 破傷風 ‐ 百日咳疫苗(diphtheria‐tetanus‐pertussis vaccines, DTP3) (中等確定性證據)。
利用回診時提供有關疫苗接種重要性的訊息給家長並提供特別設計的接種提醒卡及合併疫苗接種與其他醫療服務,可能增加三劑白喉‐ 破傷風 ‐ 百日咳疫苗接種率(低確定性證據)。
提供金錢給父母使他們的孩子接種疫苗,對完成接種的孩童數量可能只有稍微或沒有差異(低確定性證據)。
利用疫苗推展團隊每月固定時間提供疫苗接種給村莊,可能會增加完成疫苗接種率(低確定性的證據)。
本篇回顧研究有多新?
研究者搜尋了到2016年5月前發表的研究。
Authors' conclusions
Summary of findings
| Population: children aged < 24 months | |||||
| Outcomes | Anticipated absolute effects (95% CI)* | Relative effect | No of participants | Certainty of the evidence | |
| Standard care | Health education | ||||
| DTP3 (Follow‐up: 4‐9 months) | 577 per 1000 | 969 per 1000 | RR 1.68 | 1692 | ⊕⊕⊕⊝ |
| *The effect in the 'health education' group (and its 95% CI) was based on the assumed risk in the 'standard care' group and the relative effect of the intervention (and its 95% CI). CI: Confidence interval;DTP3: 3 doses of diphtheria‐tetanus‐pertussis containing vaccines; RR: risk ratio. | |||||
| GRADE Working Group grades of evidence High certainty: This research provides a very good indication of the likely effect. The likelihood that the effect will be substantially different is low. Moderate certainty: This research provides a good indication of the likely effect. The likelihood that the effect will be substantially different is moderate. Low certainty: This research provides some indication of the likely effect. However, the likelihood that it will be substantially different is high. Very low certainty: This research does not provide a reliable indication of the likely effect. The likelihood that the effect will be substantially different is very high. 'Substantially different' implies a large enough difference that it might affect a decision. | |||||
| 1 We rated down by 1 level because we judged the included studies at high risk of bias. 2 We rated down by 1 level because of unexplained heterogeneity of effects across studies, P value < 0.00001, I2 = 68%. | |||||
| Population: children aged 6 weeks Setting: Pakistan | |||||
| Outcomes | Anticipated absolute effects* (95% CI) | Relative effect | No of participants | Certainty of the evidence | |
| Standard care | Health education plus redesigned card | ||||
| DTP3 (Follow‐up: 90 days) | 470 per 1000 | 705 per 1000 | RR 1.50 | 1502 | ⊕⊕⊝⊝ |
| *The effect in the 'health education + redesigned card' group (and its 95% CI) was based on the assumed risk in the 'standard care' group and the relative effect of the intervention (and its 95% CI). CI: confidence interval;DTP3: 3 doses of diphtheria‐tetanus‐pertussis containing vaccines; RR: risk ratio. | |||||
| GRADE Working Group grades of evidence High certainty: This research provides a very good indication of the likely effect. The likelihood that the effect will be substantially different is low. Moderate certainty: This research provides a good indication of the likely effect. The likelihood that the effect will be substantially different is moderate. Low certainty: This research provides some indication of the likely effect. However, the likelihood that it will be substantially different is high. Very low certainty: This research does not provide a reliable indication of the likely effect. The likelihood that the effect will be substantially different is very high. 'Substantially different' implies a large enough difference that it might affect a decision. | |||||
| 1 We rated down by 1 level because of unexplained heterogeneity of effects across studies; P value = 0.04; I2 = 77%. 2 We rated down by 1 level because we judged the 2 included studies at unclear risk of selection bias and at high risk of performance and detection bias. 3 Usman 2009; Usman 2011. | |||||
| Population: children aged < 5 years | |||||
| Outcomes | Anticipated absolute effects* (95% CI) | Relative effect | No of participants | Certainty of the evidence | |
| Standard care | Monetary incentive | ||||
| Fully immunised children (Follow‐up: 13 months to 5 years) | 701 per 1000 | 736 per 1000 | RR 1.05 | 1000 | ⊕⊕⊝⊝ |
| *The effect in the 'monetary incentive' group (and its 95% CI) was based on the assumed risk in the 'standard care' group and the relative effect of the intervention (and its 95% CI). | |||||
| GRADE Working Group grades of evidence High certainty: This research provides a very good indication of the likely effect. The likelihood that the effect will be substantially different is low. Moderate certainty: This research provides a good indication of the likely effect. The likelihood that the effect will be substantially different is moderate. Low certainty: This research provides some indication of the likely effect. However, the likelihood that it will be substantially different is high. Very low certainty: This research does not provide a reliable indication of the likely effect. The likelihood that the effect will be substantially different is very high. 'Substantially different' implies a large enough difference that it might affect a decision. | |||||
| 1 We rated down by 2 levels because we judged the 2 included studies at high risk of bias. | |||||
| Population: children aged 12‐18 months Setting: Ghana | |||||
| Outcomes | Anticipated absolute effects* (95% CI) | Relative effect | No of participants | Certainty of the evidence | |
| Standard care | Home visits | ||||
| OPV3 | 73 per 100 | 89 per 100 | RR 1.22 | 419 | ⊕⊕⊝⊝ |
| *The effect in the 'home visits' group (and its 95% CI) was based on the assumed risk in the 'standard care' group and the relative effect of the intervention (and its 95% CI). | |||||
| GRADE Working Group grades of evidence High certainty: This research provides a very good indication of the likely effect. The likelihood that the effect will be substantially different is low. Moderate certainty: This research provides a good indication of the likely effect. The likelihood that the effect will be substantially different is moderate. Low certainty: This research provides some indication of the likely effect. However, the likelihood that it will be substantially different is high. Very low certainty: This research does not provide a reliable indication of the likely effect. The likelihood that the effect will be substantially different is very high. | |||||
| 1 We rated down by 2 levels because the 1 included study was judged to be at high risk of bias. | |||||
| Population: children aged 0‐6 months | |||||
| Outcomes | Anticipated absolute effects* (95% CI) | Relative effect | No of participants | Certainty of the evidence | |
| Standard care | Immunisation outreach | ||||
| Fully immunised ‐ regular immunisation outreach only (Follow‐up: 18 months) | 58 per 1000 | 180 per 1000 | RR 3.09 | 1239 | ⊕⊕⊝⊝ |
| Fully immunised ‐ regular immunisation outreach + non‐monetary incentive (Follow‐up: 18 months) | 58 per 1000 | 387 per 1000 | RR 6.66 | 1242 | ⊕⊕⊝⊝ |
| *The effect in the 'immunisation outreach' group (and its 95% CI) was based on the assumed risk in the 'standard care' group and the relative effect of the intervention (and its 95% CI). | |||||
| GRADE Working Group grades of evidence High certainty: This research provides a very good indication of the likely effect. The likelihood that the effect will be substantially different is low. Moderate certainty: This research provides a good indication of the likely effect. The likelihood that the effect will be substantially different is moderate. Low certainty: This research provides some indication of the likely effect. However, the likelihood that it will be substantially different is high. Very low certainty: This research does not provide a reliable indication of the likely effect. The likelihood that the effect will be substantially different is very high. 'Substantially different' implies a large enough difference that it might affect a decision. | |||||
| 1 We rated down by 2 levels because we judged the 1 included study at high risk of bias. | |||||
| Population: children aged 0‐23 months | |||||
| Outcomes | Anticipated absolute effects* (95% CI) | Relative effect | No of participants | Certainty of the evidence | |
| Standard care | Integration | ||||
| DTP3 | 602 per 1000 | 1000 per 1000 | RR 1.92 | 1481 | ⊕⊕⊝⊝ |
| *The effect in the 'integration' group (and its 95% CI) was based on the assumed risk in the 'standard care' group and the relative effect of the intervention (and its 95% CI). | |||||
| GRADE Working Group grades of evidence High certainty: This research provides a very good indication of the likely effect. The likelihood that the effect will be substantially different is low. Moderate certainty: This research provides a good indication of the likely effect. The likelihood that the effect will be substantially different is moderate. Low certainty: This research provides some indication of the likely effect. However, the likelihood that it will be substantially different is high. Very low certainty: This research does not provide a reliable indication of the likely effect. The likelihood that the effect will be substantially different is very high. 'Substantially different' implies a large enough difference that it might affect a decision. | |||||
| 1 We rated down by 2 levels because we judged the 1 included study at high risk of bias. 2 Dicko 2011. | |||||
Background
Immunisation is a powerful public health tool for improving child survival, not only by directly combating some of the key diseases and causes of child mortality, but also by providing a platform for broader health services (Andre 2008; Bloom 2011; CDC 1999; Clements 2008; JAMA 2006; Okwo‐Bele 2012; Wiysonge 2006). The concerted global effort to use immunisation as a public health strategy began when the World Health Organization (WHO) launched the Expanded Programme on Immunization (EPI) in 1974, following the successful global smallpox eradication programme (Wiysonge 2013). When the EPI was launched, WHO recommended a standard immunisation schedule covering six basic antigens (i.e. tuberculosis (Bacille Calmette‐Guérin (BCG)), polio, diphtheria, tetanus, pertussis, and measles), which are generally referred to as traditional EPI vaccines. With the emergence of new vaccines, more killer diseases can be prevented in infancy and adolescence. These vaccines include (but are not limited to) hepatitis B, Haemophilus influenzae type b (Hib), human papilloma virus, pneumococcal conjugate, rotavirus, yellow fever, meningococcal meningitis A, Japanese encephalitis, and rubella vaccines (WHO 2012a).
The proportion of children who receive the full series of three doses of diphtheria‐tetanus‐pertussis containing vaccines (DTP3) by 12 months of age is traditionally used as a standard measure of the programme's ability to reach the target population, and is used as an indicator of the overall performance of EPI programmes (Okwo‐Bele 2011; WHO‐UNICEF 2009). The traditional EPI vaccines are estimated to prevent 2.5 million child deaths annually (mainly from measles, pertussis, tetanus, and diphtheria), as well as to prevent severe morbidity for millions more children around the world from devastating diseases such as poliomyelitis and tuberculous meningitis (CDC 1999; Liu 2012; Machingaidze 2013a; Okwo‐Bele 2011; Rainey 2011; Wiysonge 2005). However, immunisation has the potential to do more; increasing coverage with existing vaccines, as well as the introduction and increased uptake of a portfolio of newly available vaccines in EPI programmes in low‐ and middle‐income countries (LMICs), could save the lives of millions more children each year (Andre 2008; Brown 2011; Chopra 2013; Duclos 2009; Liu 2012; Machingaidze 2013a; WHO‐UNICEF 2009; Wiysonge 2012a). Despite these huge potentials, the vaccination achievements so far have been described as 'fragile', given the outbreaks of some of these infectious diseases in LMICs (Duclos 2009; SAGE 2015; Siegfried 2010), and in high‐income countries (Dubé 2013; SAGE 2015). These outbreaks reflect the existence of communities with partially vaccinated or unvaccinated children (Dubé 2013; SAGE 2015), which are communities whose herd immunity is not high enough to stall the transmission of these diseases.
In order to overcome these weaknesses and realise the full potential of immunisation, the 'Decade of Vaccines Collaboration' developed the Global Vaccine Action Plan (GVAP), which was endorsed by the World Health Assembly in May 2012. The plan envisions "a world in which all individuals and communities enjoy lives free from vaccine‐preventable diseases". The mission of the GVAP is to extend, by 2020 and beyond, the full benefit of immunisation to all people, regardless of where they are born, who they are, or where they live (WHO 2012a).
Description of the condition
Global DTP3 coverage hovered around 5% in 1974, when EPI was launched, and increased very slowly to 17% in 1980 (WHO 2012b). Through the 1980s, WHO and the United Nations Children Fund (UNICEF) led an aggressive global campaign to achieve universal childhood immunisation, by vaccinating at least 80% of all children with the six traditional EPI vaccines by 1990 (Machingaidze 2013a; Okwo‐Bele 2011). The global DTP3 coverage reached 76% in 1990 (WHO 2015). However, the progress in LMICs was slow as DTP3 coverage was only 57% in Africa and 70% in South‐East Asia (UNICEF 2015a). Up to 2006, only 27% of LMICs had DTP3 coverage above the 80% target (Rainey 2011). A significant improvement was reported in 2007 in LMICs, particularly in sub‐Saharan Africa and South‐East Asia although these two regions did not reach the 80% DTP3 coverage (Duclos 2009). WHO and UNICEF estimated that DTP3 coverage increased to 86% globally in 2014 (WHO 2015).
In spite of this improvement, about 18.7 million children under one year of age were said to be unvaccinated with DTP3 globally in 2014. Close to 70% of these children live in just 10 LMICs in Africa and South‐East Asia: Democratic Republic of Congo, Ethiopia, India, Indonesia, Kenya, Mexico, Nigeria, Pakistan, South Africa, and Viet Nam (WHO 2015). As a consequence of this continued failure to reach optimal immunisation coverage, 1.5 million children die each year from diseases preventable by vaccines currently recommended by WHO. These include 476,000 deaths from pneumococcal disease, 453,000 from rotavirus diarrhoea, 199,000 from Hib, 195,000 from pertussis, 118,000 from measles, and 59,000 from neonatal tetanus (WHO 2015). Factors associated with low immunisation coverage are linked to the health system, healthcare providers, and healthcare recipients (Bloom 2005; Rainey 2011; Wiysonge 2012b).
Some experts have observed growing concerns about vaccines, which has influenced vaccine acceptance (Bloom 2005; Dubé 2013; Feemster 2013; Larson 2014). Vaccine acceptance spans a spectrum from complete rejection to total acceptance (Feemster 2013). Along the spectrum is an emerging phenomenon: vaccine hesitancy (Larson 2014). The Strategic Advisory Group of Experts on Immunisation (SAGE) defines vaccine hesitancy as a behaviour that includes confidence, complacency, and convenience. According to SAGE, vaccine‐hesitant people may accept all vaccines but with concerns, may accept only some vaccines or delay in taking up vaccines, or may totally reject all vaccines (Larson 2014).
There are varied reasons for failing to achieve universal coverage in different settings. Such reasons span from inaccessible services and poor logistic support, to political instability, including wars and public perceptions (Bloom 2005). Evidence is required to inform strategies to reach partially vaccinated and unvaccinated people in these countries. Such strategies also need to be tailored to local issues, needs, and conditions.
Description of the intervention
Several experts have highlighted the wide range of issues affecting uptake of vaccines in various settings (Bloom 2005; Dubé 2013; Mills 2005;Munoz 2015). The issues vary between and within settings due to social, economic, cultural, geographical, political, and religious factors. Therefore, potential interventions are also likely to vary across different settings. Based on the findings from reviews on this, Table 1 presents a matrix of interventions to address the issues. Broadly, these strategies could include recipient‐oriented interventions, for example, recipient recalls and reminders, health education of clients, teaching recipients skills; provider‐oriented interventions, such as audit and feedback and chart‐based or computerised provider reminders; and health system interventions, such as outreach programmes and improved quality of delivery of care (Lewin 2011). These could be delivered as single or multi‐faceted interventions.
| Target | Interventions | Purpose of the interventions |
| Recipients | Communication interventions to inform and educate targeting individuals, groups, communities or providers, or a combination of these through face‐to‐face interaction, use of mass media, printed material, etc | To improve understanding on vaccination; its relevance; benefits and risks of vaccination; where, when, and how to receive vaccine services; and who should receive vaccine services (Willis 2013) |
| Communication interventions to recall or remind using face‐to‐face interaction, telephone, mail, etc | To remind those who are overdue for vaccination in order to reduce drop‐out rate (Willis 2013) | |
| Communication interventions to teach skills, e.g. parenting skills | To provide people with the ability to operationalise knowledge through the adoption of practical skills (Willis 2013) | |
| Communication interventions to provide support | To provide assistance or advice for consumers (Willis 2013) | |
| Interventions to facilitate decision‐making, e.g. decision aids on vaccination for parents | To assist carers in participating in decision making (Dubé 2013) | |
| Interventions to enable communication through traditional media, internet, etc | To make communication possible (Dubé 2013) | |
| Interventions, including communication, to enhance community ownership, e.g. community dialogues involving traditional and religious rulers | To increase demand for vaccination To ensure sustainability To build trust in vaccination and vaccination services To drive demand for vaccination | |
| Incentives | To reward service uptake; to cover out‐of‐pocket cost | |
| Providers | Training | To improve knowledge on vaccination, to improve skills, to improve attitudes to clients, to reduce missed opportunities for vaccination |
| Audit and feedback | To ensure quality and client satisfaction with services | |
| Supportive supervision | To ensure quality and maintain standards, to reduce missed opportunities for vaccination | |
| Incentives | To boost morale and enhance performance | |
| Health system | Infrastructural development, e.g. provision of health facilities, provision of road to improve access to health facilities | To ensure access to services |
| Logistic support | To improve service quality service and so improve utilisation to ensure availability of services | |
| Service delivery, e.g. outreach; home visits; integration of vaccination with other services; guidelines/protocol for vaccination; increased resources | Outreach to improve access to services Home visits to remind parents about vaccination and identify unimmunised children for immunisation Integration to encourage vaccine uptake Guidelines and protocols to ensure quality of services Improved resources to ensure availability of services | |
| Policy makers | Advocacy for: development of supporting policies, increased funding of health services | To promote the development of policies to support vaccine uptake To increase funding to the health sector |
How the intervention might work
The various interventions serve different purposes. Table 1 presents this matrix. Some interventions can be used for both recipients and providers, for example, remind/recall interventions could target both caregivers and healthcare providers.
Why it is important to do this review
In many LMICs, immunisation coverage is low (WHO 2012b; UNICEF 2015b), routine immunisation systems are weak (Machingaidze 2013a), and community knowledge of immunisation is low (Zipursky 2010). The target of GVAP was to achieve DTP3 coverage of at least 90% in all countries by 2015. While 129 countries achieved the 90% coverage target by 2014, the 10 countries with the largest numbers of unimmunised children are all low‐income or lower‐ to middle‐income countries (SAGE 2015; WHO 2015).
Making well‐informed decisions about how best to achieve and sustain high and equitable immunisation coverage in these countries will depend partly on decision makers accessing the best scientific evidence about what interventions work, and integrating this evidence into their national health systems (Lewin 2008). One previous Cochrane review assessed recipient‐oriented reminders and recalls (Jacobson Vann 2005). The evidence indicated that reminding people to receive vaccinations through postcards, letters, or telephone calls increased immunisation uptake. This strategy generally relies on setting up an efficient computerised vaccination registry or other practice‐based information systems to track clients' vaccination status and eligibility for recommended vaccines, and also an efficient communication system to send reminders to clients. These technologies are lacking in many LMICs. This review examines the effects of strategies that utilise available resources in LMICs for improving vaccination coverage in the bid to provide evidence on appropriate strategies to improve and sustain immunisation coverage in these settings. In addition, it also explores provider‐oriented interventions (Djibuti 2009), and health system interventions (Brugha 1996), towards improving immunisation coverage.
This is the first update of the Cochrane review published in 2011 (Oyo‐Ita 2011), and complements two other Cochrane reviews conducted under the auspices of the 'Communicate to Vaccinate' project (Lewin 2011), which have a worldwide focus and assess the effects of face‐to‐face (Kaufman 2013) and community‐directed interventions (Saeterdal 2014) to inform or educate about childhood vaccination. It also complements Jacobson Vann's review on participant reminder and recall systems to improve immunisation rates (Jacobson Vann 2005) by providing evidence on the wide range of interventions covering recipients, providers, and the health system that can be used to improve vaccination coverage.
Objectives
To evaluate the effectiveness of intervention strategies to boost and sustain high childhood immunisation coverage in LMICs.
Methods
Criteria for considering studies for this review
Types of studies
We included:
-
randomised controlled trials (RCTs), with randomisation at either individual or cluster level. For cluster RCTs, we only included those with at least two intervention and two control clusters.
-
non‐randomised controlled trials (nRCTs), with allocation at either individual or cluster level. We included studies that allocated by alternation between groups, by the use of birth dates or weekdays, or by other non‐random methods. For cluster trials, we only included those with at least two intervention and two control clusters.
-
interrupted time series studies (ITS) and repeated measures studies, with a clearly defined time point when the intervention occurred and at least three data points before and three after the intervention.
-
controlled before‐after (CBA) studies with a minimum of two intervention and two control sites; comparable timing of the periods of study for the control and intervention groups; and comparability of the intervention and control groups on key characteristics.
We excluded:
CBA studies, cluster RCTs, and nRCTs that had only two study locations, in accordance with Effective Practice and Organisation of Care (EPOC) criteria for inclusion of studies (EPOC 2015a).
Types of participants
Studies conducted in LMICs (World Bank 2016) that included:
-
children under five years of age receiving WHO‐recommended vaccines through routine childhood immunisation services;
-
caregivers of children who were receiving vaccines through routine childhood immunisation services;
-
healthcare workers administering vaccines through routine childhood immunisation services;
-
or a combination of these.
For the purposes of this review, we defined routine childhood immunisation services as regularly scheduled immunisation services to children under five years of age, whether these services were offered at healthcare facilities, at fixed outreach sites, or by mobile health teams in communities (Machingaidze 2013b).
We limited the review to LMICs because of the continued failure to meet immunisation target and the weak routine immunisation system in this setting.
Types of interventions
Interventions
-
Recipient‐oriented interventions, for example:
-
interventions to improve communication about childhood immunisation, including to (Willis 2013):
-
inform or educate;
-
remind or recall;
-
teach skills;
-
provide support;
-
facilitate decision making;
-
enable communication;
-
enhance community ownership;
-
meet vaccination requirement for school entry;
-
use recipient incentives.
-
-
-
Provider‐oriented interventions, for example:
-
any intervention to reduce missed opportunities for childhood vaccination (e.g. audit and feedback, provider reminders, supportive supervision);
-
health education, training, and refresher courses for providers.
-
-
Health system interventions, for example:
-
interventions to improve the quality of services, such as provision of a reliable cold chain system, provision of transport for vaccination, vaccine stock management;
-
outreach programmes (e.g. school immunisation outreach programmes, door‐to‐door canvassing (channeling);
-
expanded services (e.g. extended hours for immunisation);
-
increases in budgets for immunisation;
-
integration of immunisation services with other services;
-
plans of action for immunisation coverage and disease reduction goals.
-
-
Multi‐faceted (i.e. any combination of the above categories of) interventions.
-
Other interventions intended to improve immunisation coverage.
Comparisons
-
Standard immunisation practices in the study setting.
-
Different interventions, or similar interventions implemented with different degrees of intensity.
Types of outcome measures
Primary outcomes
-
Proportion of children who received DTP3 by one year of age.
-
Proportion of children who received all recommended vaccines by two years of age.
Secondary outcomes
-
Proportion of children who received the vaccine under study.
-
Number of children under five years of age fully immunised with all scheduled vaccines.
-
Occurrence of vaccine preventable diseases.
-
Costs of the intervention.
-
Attitudes of caregivers and clients towards immunisation.
-
Adverse events following immunisation (AEFI).
Search methods for identification of studies
Electronic searches
We placed no language or date restrictions on the search strategy. We translated the MEDLINE (Ovid) search strategy into the other databases using the appropriate controlled vocabulary.
We searched the following electronic databases on the dates indicated:
-
Cochrane Central Register of Controlled Trials (CENTRAL), 2016, Issue 4, including the Cochrane EPOC Group Specialized Register (searched 12 May 2016)
-
MEDLINE In‐Process and Other Non‐Indexed Citations, MEDLINE Daily and MEDLINE 1946 to Present, OvidSP (searched 12 May 2016)
-
CINAHL 1981 to present, EbscoHost (searched 12 May 2016)
-
Embase 1980 to 2014 Week 34, OvidSP (searched 2 September 2014)
-
LILACS (VHL) (searched 2 September 2014)
-
Sociological Abstracts 1952 ‐ current, ProQuest (searched 2 September 2014)
On 12 May 2016 we searched only CENTRAL, MEDLINE, and CINAHL. Embase, Socioligical Abstracts, and LILACs were not searched for the following reasons. All 14 studies included in the review after the 2014 searches are indexed in CENTRAL, and 11 of the 14 studies are indexed in MEDLINE. The three studies not indexed in MEDLINE are not indexed in EMBASE. None of the 14 studies are indexed in Sociological Abstarcts. The three studies not indexed in MEDLINE are not indexed in LILACS. All of the search strategies are in Appendix 1.
Searching other resources
We also searched the Cochrane Database of Systematic Reviews (CDSR) and the Database of Abstracts of Reviews of Effectiveness (DARE) for related reviews. We searched the reference lists of relevant reviews for potentially eligible studies (Batt 2004; Bordley 2000; Glenton 2011; Harvey 2015; Jacobson Vann 2005; Johri 2015b; Kaufman 2013; Kendrick 2000; Lagarde 2009a; Lagarde 2009b; Pegurri 2005; Ryman 2008; Saeterdal 2014). We also searched the reference lists of included studies for potentially eligible studies. We did a citation search for all included studies in Science Citation Index and Social Sciences Citation Index, 1975 to present; Emerging Sources Citation Index 2015 to present, ISI Web of Science (searched 2 July 2016)
We searched the following Trials Registries
· International Clinical Trials Registry Platform (ICTRP), Word Health Organization (WHO) http://www.who.int/ictrp/en/ (searched 5 July 2016)
· ClinicalTrials.gov, US National Institutes of Health (NIH) http://clinicaltrials.gov/ (searched 5 July 2016)
Data collection and analysis
Selection of studies
At least two review authors independently screened the titles and abstracts of papers identified in the search output for potentially eligible studies. We retrieved full texts of potentially eligible studies for further assessment, and two review authors independently applied the inclusion criteria to these publications. We resolved disagreements about the inclusion of studies through discussion and consensus between the two review authors; and involved a third review author if the disagreement was not resolved. We obtained methodological advice from the EPOC editorial base for unresolved issues. The Characteristics of excluded studies presents reasons for excluding studies.
Data extraction and management
All review authors developed and reviewed a data extraction form. Two review authors independently carried out data extraction and risk of bias assessment. We resolved disagreements in data extraction by consensus between the two review authors, with arbitration by a third author as required. The data extracted into an Excel spreadsheet included the following:
-
Setting of the study.
-
Type of study: distinguishing between individual RCTs, cluster RCTs, nRCTs, CBA studies, and ITS studies.
-
Type of participants: children, caregivers, and providers.
-
Type of interventions: categorised into participant and community, provider, health system, and multi‐faceted.
-
Types of outcomes measured: data on outcome measures such as proportion of children immunised with different antigens based on the different interventions.
Assessment of risk of bias in included studies
Two review authors applied the EPOC risk of bias criteria for RCTs, nRCTs, CBAs, and ITS studies to determine the risk of bias in included studies (EPOC 2015b). We resolved disagreements by discussion and consensus, with arbitration by a third review author as required.
Each criterion was scored as 'low risk', 'unclear risk', or 'high risk' (Characteristics of included studies table). Figure 1 and Figure 2 present the risk of bias for each included study. We considered a study as having a 'low risk of bias' if all criteria prescribed by EPOC were scored as 'Yes'; 'unclear risk of bias' if one or more criteria were scored as 'Unclear'; and 'high risk of bias' if one or more key criteria scored as 'No'. The key criteria included allocation concealment, completeness of outcome data, blinding of outcome assessors, and protection against contamination for RCTs and NRCTs; and independence of intervention from other changes, possibility of intervention affecting data collection, completeness of outcome data, and blinding of outcome assessors for ITS studies.

Methodological quality summary: review authors' judgements about each methodological quality item for each included study.

Methodological quality graph: review authors' judgements about each methodological quality item presented as percentages across all included studies.
Measures of treatment effect
We used the risk ratio (RR) for dichotomous data. We planned to calculate the mean difference (MD) for costs and any other analysis of continuous data but none of the included studies reported these types of data. We reported 95% confidence intervals (CI) for all measures.
Unit of analysis issues
We included cluster RCTs in the meta‐analysis after making adjustments for design effect using standard procedures (Rao 1992), and the formula: design effect = 1 + (m ‐ 1)r, where m was the mean cluster size and r was the intra‐cluster correlation coefficient (ICC). Using data from Andersson 2009, we calculated the ICC for measles to be 0.25 and for DTP3 to be 0.14. We used this to estimate the adjusted standard error for the data of Andersson 2009; Banerjee 2010; Barham 2005; Brugha 1996; Dicko 2011; Maluccio 2004; and Robertson 2013 none of the data from the cluster RCTs were appropriately adjusted for clustering. We entered data from Dicko 2011 as absolute figures into Review Manager 5 (RevMan 2014) and calculated RRs; consequently, we applied the ICC to adjust for cluster effect.
Dealing with missing data
We contacted the authors of two studies to obtain missing data (Djibuti 2009; Morris 2004). Morris 2004 responded, and we used the additional data to estimate the ICC for the study. Additional data received included the absolute number of events in each arm of the study for the Morris 2004 study; we estimated the ICC for mumps, measles, rubella (MMR) (0.013) and DTP1 (0.0377) for the post‐intervention assessment only. We then used the ICC to adjust the standard error for the two outcomes from this study that we included in this review.
Five studies followed up the same set of participants post‐intervention (Bolam 1998; Brugha 1996; Owais 2011; Usman 2009; Usman 2011). There were no missing data in three of these studies (Brugha 1996; Usman 2009; Usman 2011), and missing data were minimal (2%) in one study (Owais 2011) and high (greater than 20%) in Bolam 1998 study. Robertson 2013 accounted for missing data and applied intention‐to‐treat analysis. The remaining studies had independent sampling at pre‐ and post‐intervention stages so missing data from loss to follow‐up was not applicable in these studies (Andersson 2009; Banerjee 2010; Barham 2005; Dicko 2011; Djibuti 2009; Maluccio 2004; Morris 2004; Pandey 2007).
Assessment of heterogeneity
We reviewed heterogeneity in the setting, interventions, and outcomes of included studies in order to make a qualitative assessment of the extent to which the included studies were similar to each other. We examined the forest plots visually to assess the levels of heterogeneity. We considered meta‐analyses with a P value for the Chi2 test of less than 0.1 to have considerable statistical heterogeneity. We used an I2 statistic of 50% or more to quantity the level of statistical heterogeneity. We planned to subject such meta‐analyses to subgroup analyses for investigation of heterogeneity (see Subgroup analysis and investigation of heterogeneity). However, due to the paucity of data, such subgroup analysis was not feasible.
Assessment of reporting biases
Test for asymmetry with a funnel plot was not feasible because the number of included studies for meta‐analysis was too few.
Data synthesis
We planned to pool data from studies with similar interventions (participant or community, provider, health system, multi‐faceted), grouped by study design (RCTs, nRCTs, CBAs, ITS studies), in a meta‐analysis using the random‐effects model. For studies that reported only effect estimates with the measures of uncertainty, but without numbers of participants and numbers of events, we planned to analyse the effect estimate using the generic inverse variance approach. ITS studies were to be reported as changes in level and slope. We selected the random‐effects model as the default procedure in the analysis due to heterogeneity, based on the assumption of random distribution of the variation in the effects of interventions in the different studies.
Subgroup analysis and investigation of heterogeneity
We planned to explore anticipated differences in the impact of interventions across settings and mode of delivery of the interventions. We planned the following subgroup analyses:
-
Setting of the study (rural, urban).
-
Individual or group intervention.
-
Single or multi‐faceted/integrated intervention.
-
Conditional or non‐conditional incentive.
-
Facility‐ or community‐based intervention.
Due to paucity of data subgroup analysis was only possible for facility‐ versus community‐based health education.
Sensitivity analysis
We planned to perform a sensitivity analysis based on risk of bias and missing data if we found sufficient data: however, available data were insufficient to perform this analysis. Due to diversity in the reported outcomes across studies, we pooled data for only three interventions, namely health education for DTP3, health education plus redesigned cards for DTP3, and monetary incentive for full immunisation. There was heterogeneity in the pooled data on health education and health education plus redesigned card interventions. This could be attributed to the high risk of bias of included studies and the difference in the mode of delivery of the interventions.
Assessment of certainty of evidence
We assessed certainty of the evidence using GRADE (Grading of Recommendations, Assessment, Development, and Evaluation) (Guyatt 2008; Higgins 2011). We entered data for key interventions into the Grade Profiler and graded the certainty of evidence for the outcomes as 'high', 'moderate', 'low', and 'very low', defined as follows:
High certainty: this research provided a very good indication of the likely effect. The likelihood that the effect will be substantially different was low.
Moderate certainty: this research provided a good indication of the likely effect. The likelihood that the effect will be substantially different was moderate.
Low certainty: this research provided some indication of the likely effect. However, the likelihood that it will be substantially different was high.
Very low certainty: this research did not provide a reliable indication of the likely effect. The likelihood that the effect will be substantially different was very high.
'Substantially different' implies a large enough difference that it might affect a decision.
Results
Description of studies
Results of the search
The electronic and supplementary searches yielded 10158 records, after removing duplicates. Following screening of titles and abstracts, we selected 79 studies for full text screening; 14 were eligible for inclusion in the review; we excluded 54, and 11 studies are awaiting assessment (Figure 3). In this update, we added an additional eight studies (Banerjee 2010; Barham 2005; Bolam 1998; Dicko 2011; Maluccio 2004; Owais 2011; Robertson 2013; Usman 2011) to the six studies included in the first version of the review (Oyo‐Ita 2011).
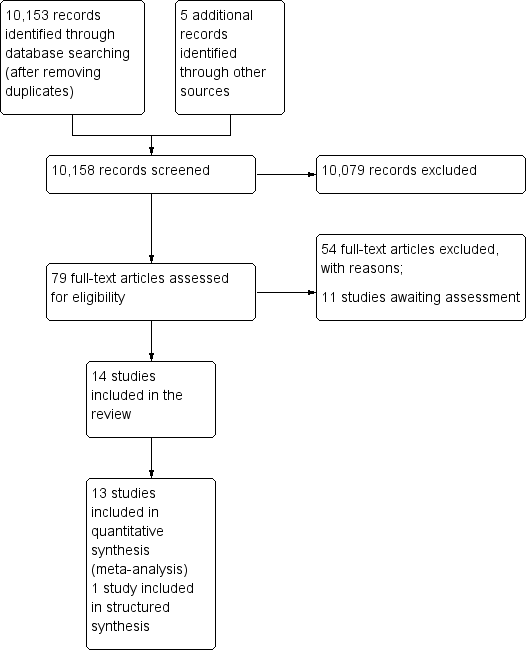
Study flow diagram.
Included studies
Study design and setting
Fourteen studies met the inclusion criteria (Andersson 2009; Banerjee 2010; Barham 2005; Bolam 1998; Brugha 1996; Dicko 2011; Djibuti 2009; Maluccio 2004; Morris 2004; Owais 2011; Pandey 2007; Robertson 2013; Usman 2009; Usman 2011). Ten studies were cluster RCTs (Andersson 2009; Banerjee 2010; Barham 2005; Brugha 1996; Dicko 2011; Djibuti 2009; Maluccio 2004; Morris 2004; Pandey 2007; Robertson 2013). Of these, Brugha 1996 and Robertson 2013 were matched cluster RCTs and Djibuti 2009 used stratified cluster sampling. The remaining four studies were individually randomised controlled trials (Bolam 1998; Owais 2011; Usman 2009; Usman 2011). The unit of analysis was the participant in all the studies except Morris 2004 and Pandey 2007, in which household was the unit of analysis. There were no nRCTs, CBAs, or ITS studies among the included studies.
Location of studies
The studies were conducted in Georgia (Djibuti 2009), Ghana (Brugha 1996), Honduras (Morris 2004), India (Banerjee 2010; Pandey 2007), Mali (Dicko 2011), Nepal (Bolam 1998), Pakistan (Andersson 2009; Owais 2011; Usman 2009; Usman 2011), Mexico (Barham 2005), Nicaragua (Maluccio 2004), and Zimbabwe (Robertson 2013).
Participants
Owais 2011 recruited children aged less than six weeks; Usman 2009 and Usman 2011 included children registering for DTP1 (which the authors noted was given at six weeks of age in the country); Banerjee 2010 included children aged from birth to six months; Dicko 2011 recruited children aged from birth to 23 months; Andersson 2009 included children aged 12 to 23 months; and Brugha 1996 studied children who were aged 12 to 18 months. Barham 2005 studied children aged 12 to 18 months and Maluccio 2004 studied children aged from birth to 30 months. Robertson 2013 studied children under the age of five years. Participants in four studies were adults: primary healthcare workers (Djibuti 2009), the general population (Pandey 2007), pregnant women (Morris 2004), and postpartum women (Bolam 1998). The adults were targeted with a view to improving childhood immunisation coverage.
Outcomes
Outcome measurements were similar at baseline between intervention and control groups except for Dicko 2011; the researchers did not adjust for this baseline difference.
Sampling
Five studies carried out independent sampling in the pre‐ and post‐intervention periods (Andersson 2009; Banerjee 2010; Dicko 2011; Djibuti 2009; Maluccio 2004). Morris 2004 and Barham 2005 had independent sampling for each outcome and for each arm of the intervention groups. Seven studies followed up the same participants at pre‐ and post‐intervention (Bolam 1998; Brugha 1996; Owais 2011; Pandey 2007; Robertson 2013; Usman 2009; Usman 2011).
Interventions
The individual studies evaluated interventions as follows:
-
Recipient‐oriented interventions.
-
Health education on the importance of completion of the immunisation schedule, and on other immunisation‐related issues.
-
Health education plus 'reminder‐type' immunisation cards to remind caregivers of their next immunisation appointment.
-
Easy to understand pictorial card using simple language to explain how vaccines save children's lives, and where the vaccination centre was located.
-
Monetary incentives to increase demand for preventive healthcare interventions.
-
Conditional and unconditional cash transfers to encourage clinic attendance for child development services.
-
-
-
Provider‐oriented interventions.
-
Training of immunisation district managers, together with supportive supervision and audit and feedback regarding solving problems on immunisation services.
-
Training of health providers on valid doses for vaccination.
-
-
Health system‐oriented interventions.
-
Home visits to identify unimmunised children.
-
Regular immunisation outreach sessions in the villages to ensure regular availability of immunisation services.
-
Integration of immunisation with intermittent preventive treatment of malaria to support child health interventions.
-
-
Multi‐faceted interventions.
-
Health system plus provider‐oriented interventions.
-
Health system plus provider‐oriented plus recipient‐oriented interventions.
-
Reach every district approach: a combination of planning, outreach, community mobilisation, supportive supervision, and monitoring.
-
See below for more detail of these interventions.
Recipient‐oriented interventions
Health education
Health education interventions included evidence‐based discussions in the community on the prevalence of measles among children and the importance of childhood immunisation in Pakistan (Andersson 2009); an information campaign in India that involved presentation of audiotape messages, and distribution of posters and leaflets in the community (Pandey 2007); and three targeted pictorial messages regarding vaccines administered by trained lay/community health workers at the mothers' homes in Pakistan (Owais 2011). The first key pictorial message highlighted how vaccines save children's lives. The second message provided logistic information about the address and location of the local vaccination centres. The third key message emphasised the significance of retaining immunisation cards, and the role they could play at the time of the child's school admissions. A copy of these pictorial messages was left with the mother. Three studies in Nepal and Pakistan provided health education in the health facility on the importance of completion of the immunisation schedule (Bolam 1998; Usman 2009; Usman 2011). In the Bolam 1998 study in Nepal, one arm had only one‐to‐one facility‐based education after delivery and before discharge from the hospital, the second arm had only a one‐to‐one education session in the mothers' homes three months after delivery, while the third arm included both one‐to‐one health education immediately after birth and three months later. The last arm was included in the study.
Monetary incentives
Barham 2005 in Mexico combined conditional cash transfers with free provision of health and education services. The conditions for the cash transfer included receiving regular immunisation, growth monitoring, mother's attendance at health, hygiene, and nutrition education programs; and nutritional supplements for children aged from birth to two years and for pregnant and lactating mothers.
In Nicaragua, one of the interventions in Maluccio 2004 was a monthly "food security" cash transfer ("bono alimentario" = USD224 per year = 13% of total amount of household expenditures in beneficiary households before the programme), conditional on attendance at monthly health educational workshops, on bringing their children aged under five for free scheduled preventive childcare appointments (which include the provision of anti‐parasites drugs, and vitamins and iron supplements), on having up‐to‐date vaccination, and on adequate weight gain. Morris 2004 assessed the effect of withdrawing monetary vouchers if the mothers were not up‐to‐date with routine antenatal care and well‐child preventive health care, and if the child did not attend school regularly.
Robertson 2013 in Zimbabwe compared two interventions. Both included a cash transfer of USD18 per household and USD4 per child every two months. In one of the arms, the transfer was on the condition that: those aged below 18 years with no birth certificate applied for one within three months; children aged under five years were up‐to‐date with immunisation, and attended growth monitoring clinics; children aged from six to 17 years had 90% monthly attendance at school; and a representative of every household attended two‐thirds of local parenting skills classes. In the second arm there were no conditions attached to the cash transfer.
Health Education plus 'reminder‐type' immunisation card
Two studies evaluated an enlarged immunisation card, designed to remind mothers of immunisation appointments (Usman 2009; Usman 2011).
Provider‐oriented interventions
Interventions targeting providers in Georgia included training in continuous supportive supervision, development of supportive supervision guidelines, and tools for immunisation district managers (Djibuti 2009).
Health system interventions
Home visits
Brugha 1996 reported on the effects of home visits on childhood immunisation in Ghana: undergraduate students conducted the home visits, which aimed to identify non‐immunised children and refer them for immunisation at the health centre. Another review considered these students to be lay/community health workers (Glenton 2011).
Integration of services
The Dicko 2011 study assessed the effects of integrating immunisation service delivery with intermittent preventive treatment of malaria in infants.
Regular immunisation outreach sessions
One study assessed the effects of regular monthly immunisation camps (Banerjee 2010). This intervention focused on ensuring the regular availability of immunisation services. It consisted of a mobile immunisation team, including a nurse and assistant, who conducted monthly immunisation camps in villages. The camp was held on a fixed date and time every month in each village.
Multi‐faceted (health system plus provider interventions)
One arm of the Morris 2004 study set up quality assurance (QA) teams in rural Honduras in health centres allocated to the intervention. The team, with wide representation from the local communities, was trained on QA methods. They produced work plans that could include minor structural repairs to health centres and the purchase of equipment, materials, and essential drugs. This arm of the study also included training of lay nutrition promoters who conducted monthly weighing of children aged less than two years and counselling of mothers. This intervention was not carried out as stipulated in the protocol, as only 17% of the total budget for the intervention was disbursed.
QA training was limited to only the introduction to the QA course. It was not clear what the composition of the QA course was. However, QA usually aims at ensuring that standards are met. This assures the service users of the quality of services and may encourage increased utilisation of services.
One arm of the study by Banerjee and colleagues assessed a regular once‐monthly immunisation camp complemented with small material incentives in India (Banerjee 2010). The investigators offered parents 1 kg of raw lentils per immunisation administered and a set of "thalis" (metal plates used for meals) on completion of a child's full immunisation. The value of the lentils was about USD1, equivalent to three‐quarters of one day's wage, and the value of the "thalis" was about USD2.00
Comparison
The comparison groups received routine care in five studies (Andersson 2009; Brugha 1996; Dicko 2011; Morris 2004; Usman 2009). The study authors did not state what comprised routine care. The comparison group received no interventions in seven studies (Banerjee 2010; Barham 2005; Bolam 1998; Djibuti 2009; Maluccio 2004; Pandey 2007; Usman 2011). In the Owais 2011 study, the comparison group received verbal general messages (while the intervention group received three targeted pictorial messages). In the Robertson 2013 study, the comparison group received unconditional cash transfers.
Outcomes
Eleven studies provided data on the proportion of the target population that was fully immunised (by age) by the recommended vaccine (Andersson 2009; Banerjee 2010; Bolam 1998; Brugha 1996; Dicko 2011; Djibuti 2009; Maluccio 2004; Owais 2011; Robertson 2013; Usman 2009; Usman 2011). Other outcomes reported were: DTP3 coverage (Andersson 2009; Bolam 1998; Dicko 2011; Owais 2011; Usman 2009; Usman 2011); percentage change in immunisation coverage over time (Andersson 2009; Morris 2004); tetanus toxoid coverage in children (Pandey 2007); received at least one vaccine (Pandey 2007); oral polio coverage (Brugha 1996); completion of schedule (Brugha 1996); cost of the intervention (Andersson 2009); and coverage for tuberculosis and measles vaccines (Barham 2005).
Nine studies measured outcomes at the participant level (Andersson 2009; Banerjee 2010; Bolam 1998; Brugha 1996; Dicko 2011; Djibuti 2009; Owais 2011; Usman 2009; Usman 2011); while five studies measured the outcome at the household level (Barham 2005; Maluccio 2004; Morris 2004; Pandey 2007; Robertson 2013)..
Follow‐up
The period of follow‐up varied between studies from three months to four years. Two studies had no loss to follow‐up (Usman 2009; Usman 2011), three studies had 2% to 5% loss to follow‐up (Morris 2004; Owais 2011; Pandey 2007), and two studies had loss to follow‐up of 17% or more (Banerjee 2010; Bolam 1998). Five studies had two independent samples for pre‐ and post‐ follow‐up (Andersson 2009; Barham 2005; Dicko 2011; Djibuti 2009; Maluccio 2004), while Brugha 1996 did not account for loss to follow‐up. Robertson 2013 had less than 4% loss to follow‐up.
Excluded studies
We excluded 54 potentially studies for reasons provided in the Characteristics of excluded studies table.
Eleven studies are awaiting assessment of their eligibility (see Characteristics of studies awaiting classification table)
Risk of bias in included studies
Based on our pre‐defined criteria, we assessed no study as having a low risk of bias; one study had unclear risk of bias (Owais 2011), and the remaining 13 studies had high risk of bias.
Allocation
The risk of selection bias (allocation concealment) was low for three studies (Andersson 2009; Banerjee 2010; Dicko 2011), unclear for seven studies (Bolam 1998; Brugha 1996; Djibuti 2009; Owais 2011; Pandey 2007; Usman 2009; Usman 2011), and high for four studies (Barham 2005; Maluccio 2004; Morris 2004; Robertson 2013).
Blinding
Risk of bias in relation to blinding of participants, personnel, and outcome assessments was low for six studies (Andersson 2009; Banerjee 2010; Bolam 1998; Owais 2011; Pandey 2007; Robertson 2013), unclear for three studies (Dicko 2011; Djibuti 2009; Morris 2004), and high for five studies (Barham 2005; Brugha 1996; Maluccio 2004; Usman 2009; Usman 2011).
Incomplete outcome data
The risk of attrition bias (completeness of outcome data) was low for nine studies (Andersson 2009; Dicko 2011; Djibuti 2009; Morris 2004; Owais 2011; Pandey 2007; Robertson 2013; Usman 2009; Usman 2011), unclear for two studies (Barham 2005; Brugha 1996), and high for three studies (Banerjee 2010; Bolam 1998; Maluccio 2004).
Other potential sources of bias
The risk of contamination was low for four studies (Banerjee 2010; Bolam 1998; Owais 2011; Usman 2011), unclear for five studies (Andersson 2009; Brugha 1996; Djibuti 2009; Pandey 2007; Usman 2009), and high for five studies (Barham 2005; Dicko 2011; Maluccio 2004; Morris 2004; Robertson 2013).
Effects of interventions
See: Summary of findings for the main comparison Community‐based health education for improving childhood immunisation coverage; Summary of findings 2 Facility‐based health education plus redesigned reminder card for improving childhood immunisation coverage; Summary of findings 3 Monetary incentives for improving childhood immunisation coverage; Summary of findings 4 Home visits for improving childhood immunisation coverage; Summary of findings 5 Immunisation outreach with and without incentives for improving childhood immunisation coverage; Summary of findings 6 Integration of immunisation with other health services for improving childhood immunisation coverage in low‐ and middle‐income countries
Primary outcomes
Proportion of children who received DTP3 by one year of age
Recipient‐oriented interventions versus standard care
These interventions included health education, use of a combination of redesigned cards and health education, and a monetary incentive.
Health education
Included studies considered both community‐ and facility‐based health education.
Andersson 2009 compared community‐based health education with standard care; Owais 2011 compared community‐based health education with general health promotion given verbally; and Pandey 2007 compared community‐based health education with no intervention.
Community‐based health education probably improved coverage of DTP3 (RR 1.68, 95% CI 1.09 to 2.59; I2 = 68%; Analysis 1.2). Overall, there was high heterogeneity between the studies, probably due to the differing study methods. Certainty of evidence for community‐based health education interventions was moderate (summary of findings Table for the main comparison). Pandey 2007 did not report DTP3 coverage and was, therefore, not included in this pooled analysis.
Three studies assessed facility‐based health education, and found substantial heterogeneity of effects (heterogeneity P value < 0.0001; I2 = 91%: Analysis 1.2) (Bolam 1998; Usman 2009; Usman 2011). As we were unable to explain the heterogeneity, we did not report the pooled result. The findings from the three studies showed that the impacts of facility‐based education on improving DTP3 uptake range from little to no effect (Bolam 1998: RR 1.01, 95% CI 0.95 to 1.08) to potentially important benefits (Usman 2009: RR 1.18, 95% CI 1.05 to 1.33; and Usman 2011: RR 1.50, 95% CI 1.27 to 1.77).
Health education plus 'reminder‐type' immunisation card
We found low‐certainty evidence that combining facility‐based health education with a redesigned 'reminder‐type' immunisation card may improve DTP3 coverage (RR 1.50, 95% CI 1.21 to 1.87; I2 = 77%; Analysis 2.1; summary of findings Table 2) (Usman 2009; Usman 2011).
Provider‐oriented interventions versus usual care
One study assessed the impact on immunisation coverage of training immunisation managers to provide supportive supervision for health providers (Djibuti 2009). This study provided low‐certainty evidence that the intervention had little or no effect on coverage for DTP3. The difference in coverage between the intervention and control groups was 4.3% (P value = 0.285).
Integration of immunisation with other healthcare services versus standard care
The Dicko 2011 study provided low‐certainty evidence that integrating immunisation services with intermittent prophylactic treatment of malaria in infants may improve DTP3 coverage (RR 1.92, 95% CI 1.42 to 2.59; Analysis 6.2; summary of findings Table 6).
Proportion of children who received all recommended vaccines by two years of age
Monetary incentives or disincentives versus no intervention
One study in Nicaragua provided low‐certainty evidence that monetary incentives may have little or no effect on coverage of all vaccines among children aged 12 to 23 months (RR 1.03, 95% CI 0.83 to 1.28; Analysis 3.2) (Maluccio 2004). One additional study from Zimbabwe provided low‐certainty evidence on the effects of monetary incentives (Robertson 2013).
Pooled data from these two studies indicated that, overall, there was low‐certainty evidence that monetary incentives may have little or no effect in improving vaccination coverage, although the CI included an important benefit (RR 1.05, 95% CI 0.90 to 1.23; Analysis 3.2; summary of findings Table 3) (Maluccio 2004; Robertson 2013).
Immunisation outreach sessions versus no intervention
The Banerjee 2010 study provided low‐certainty evidence that regular once‐monthly reliable immunisation outreach may increase the coverage for full immunisation (RR 3.09, 95% CI 1.69 to 5.67; Analysis 5.1; summary of findings Table 5).
Multi‐faceted interventions
Integration of immunisation to other healthcare services versus standard care
There was low‐certainty evidence that integrating immunisation services with intermittent prophylactic treatment of malaria in infants may improve DTP3 coverage (RR 1.92, 95% CI 1.42 to 2.59; Analysis 6.2; summary of findings Table 6) (Dicko 2011).
Health system plus recipient‐oriented interventions versus no intervention
The Banerjee 2010 study provided low‐certainty evidence that a multi‐faceted intervention consisting of a health system (mobile immunisation camp) and recipient‐oriented (non‐monetary incentive) intervention may improve coverage for full vaccination (RR 6.66, 95% CI 3.93 to 11.28; Analysis 5.1; summary of findings Table 5).
Secondary outcomes
Proportion of children who received the vaccine under study
Recipient‐oriented interventions versus usual care
Health education
Evidence‐based discussions probably improve coverage of measles vaccine (RR 1.63, 95% CI 1.03 to 2.58; Analysis 1.1) (Andersson 2009). We also found low‐certainty evidence that information campaigns (presentation of audiotape messages, and distribution of posters and leaflets in the community) may increase the coverage of at least one dose of a vaccine (RR 1.43, 95% CI 0.72 to 2.86; Analysis 1.3) (Pandey 2007).
Monetary incentives or disincentives versus no intervention
One study conducted in Mexico provided low‐certainty evidence that monetary incentives may have little or no effect on measles vaccination coverage (RR 1.00, 95% CI 0.69 to 1.45; Analysis 3.1) (Barham 2005), and coverage of BCG vaccination according to schedule (RR 0.98, 95% CI 0.47 to 2.05; Analysis 3.3) (Barham 2005). However, the CI for BCG uptake included an important benefit. Morris 2004 reported data on the impact of withdrawing monetary vouchers (a household‐level monetary incentive) on the coverage of MMR and DTP1 vaccines. The study provided low‐certainty evidence that withdrawing monetary vouchers may have little or no effect on coverage of MMR (RR 0.95, 95% CI 0.83 to 1.07; Analysis 3.4) and DTP1 (RR 1.09, 95% CI 0.94 to 1.28; Analysis 3.5).
Provider‐oriented interventions versus usual care
Djibuti 2009 provided low‐certainty evidence that training immunisation managers to provide supportive supervision for health providers may have little or no effect on coverage for three doses of oral polio vaccine (OPV3), and three doses of hepatitis B virus (HBV3). The differences in coverage between the intervention and control groups were 8.4% (P value = 0.173) for OPV3 and 13.4% (P value = 0.172) for HBV3.
Health system interventions versus usual care
Home visits versus usual care
Brugha 1996 assessed the effect of home visits on improving coverage for OPV3 and measles. This study provided low‐certainty evidence that home visits may improve OPV3 (RR 1.22, 95% CI 1.07 to 1.39; Analysis 4.1; summary of findings Table 4) and measles vaccine coverage (RR 1.26, 95% CI 1.08 to 1.46; Analysis 4.2).
Multi‐faceted interventions
Integration of immunisation to other healthcare services versus standard care
There was low‐certainty evidence that integrating immunisation services with intermittent prophylactic treatment of malaria in infants may improve measles vaccine coverage (RR 1.13, 95% CI 1.06 to 1.20; Analysis 6.3), but may have little or no effect on BCG coverage (RR 1.03, 95% CI 0.89 to 1.19; Analysis 6.1) (Dicko 2011).
Health system plus provider‐oriented interventions versus standard care
One arm of the study by Morris 2004 aimed to strengthen peripheral health services through training QA teams (provider package) and the provision of equipment, drugs, and materials (health system package) and also provided nutritional promotion. This arm of the intervention was not delivered as per protocol. There was low‐certainty evidence that this intervention may lead to little or no difference in MMR coverage (RR 1.06, 95% CI 0.91 to 1.23; Analysis 3.4) and DTP1 coverage (RR 1.00, 95% CI 0.83 to 1.21; Analysis 3.5).
Health system plus provider‐oriented plus participant‐oriented interventions versus standard care
Another arm of Morris 2004 evaluated a combination of monetary incentives (recipient‐oriented); QA (provider‐oriented); and provision of equipment, drugs, and materials (health system oriented interventions). The study provided low‐certainty evidence that this intervention may lead to little or no difference in MMR coverage (RR 1.11, 95% CI 0.99 to 1.24; Analysis 3.4) and DPT1 coverage (RR 1.15, 95% CI 0.97 to 1.37; Analysis 3.5), though the CIs included important benefits.
Number of children under five years of age fully immunised with all scheduled vaccines
Monetary incentives
Robertson 2013 and Maluccio 2004 provide low‐certainty evidence that monetary incentives may have little or no effect on coverage of all vaccines among children aged under five years (RR 1.05, 95% CI 0.90 to 1.23; Analysis 3.2; summary of findings Table 3).
Occurrence of vaccine preventable diseases
None of the included studies provided data on the occurrence of the targeted diseases.
Costs of the intervention
Only one of the included studies estimated the costs of the intervention (Andersson 2009). This evaluation indicated that community‐based health education cost USD9.00 per child.
Attitudes of carers and clients towards immunisation
None of the included studies provided data on the attitudes of caregivers and clients towards immunisation.
Adverse events following immunisation
None of the included studies reported data on AEFI.
Discussion
Summary of main results
Ten cluster RCTs and four individually randomised controlled trials met our inclusion criteria. These were conducted in Georgia, Ghana, Honduras, India, Mali, Mexico, Nepal, Nicaragua, Pakistan, and Zimbabwe. The interventions evaluated in the studies included community‐based health education, facility‐based health education, home visits, household monetary incentives, and integration of immunisation services to intermittent preventive treatment of malaria. These were implemented either as single interventions or as multi‐faceted interventions.
We found moderate‐certainty evidence that giving information and discussing vaccination with parents and other community members at village meetings or at home probably improve immunisation coverage. We also found low‐certainty evidence that giving information to parents about the importance of vaccinations during visits to health clinics combined with specially designed 'reminder‐type' immunisation cards may improve immunisation coverage. There was low‐certainty evidence that regular immunisation outreach, home visits, and integration of immunisation with other primary healthcare services (such as intermittent preventive treatment of malaria) may improve immunisation coverage. However, there was currently low‐certainty evidence that household monetary incentives (in the form of conditional or unconditional cash transfers) may have little or no effect on immunisation coverage.
Overall completeness and applicability of evidence
In the context of the GVAP, there is an urgent need for effective interventions that would ensure equitable uptake of existing vaccines by people in all communities around the world (WHO 2012a). However, immunisation coverage remains uneven between and within the world's regions and countries. For example, in 2014, DTP3 coverage was 96% in Europe and the Western Pacific and only 77% in sub‐Saharan Africa (WHO 2015). The GVAP coverage target was to achieve DTP3 coverage of 90% in all countries by 2015; but only 129 (66%) countries have achieved this coverage target. The 10 countries with the largest numbers of unimmunised children are all low‐income or lower‐ to middle‐income countries (SAGE 2015).
Barriers to improving immunisation coverage could be broadly categorised into factors that affect the demand for vaccines, barriers to the supply of vaccines, or both (Lewin 2011). Around 2014, the concept of vaccine hesitancy emerged as a factor hindering the demand of vaccines (Larson 2014). The Strategic Advisory Group of Experts on immunisation identified factors that influence vaccine hesitancy. These were grouped into three major areas, namely contextual influences, vaccine and vaccination specific issues, and individual and social group influences. The influences of these factors are said to be complex and context‐specific, varying in time, place, and vaccine (Larson 2014). It is unclear if the interventions tested in the included studies were derived from identified barriers in the settings, though specific concepts were tested. In general, though, interventions to improve coverage should focus on identified barriers within settings.
The included studies evaluated interventions that varied enormously in content and in the intensity of delivery, raising questions regarding the likely impact of interventions in different settings and regarding how best to implement the interventions. For instance, how effective will a three‐minute health education intervention (Usman 2009; Usman 2011; low‐certainty evidence) be in a typical clinical setting in improving completion of the immunisation schedule? Will the same effect be obtained for more than one vaccine? How feasible is evidence‐based discussion (Andersson 2009; moderate‐certainty evidence) in a community with low literacy? How feasible is a monetary incentive intervention (Morris 2004; low‐certainty evidence) in a resource‐poor setting without donor support? The limited number of studies makes it difficult to explore these issues and restricts the wider applicability of the evidence.
Home visits to promote childhood vaccination uptake or to deliver vaccination are common in many settings. The applicability of the home visit intervention as implemented in Brugha 1996 may be affected by several factors. First, the use of first‐degree university students as lay/community health workers to deliver this type of intervention may not be feasible in many resource‐poor settings. Two reviews reported moderate‐certainty evidence on the effectiveness of lay health workers in promoting the uptake of childhood immunisation services (Glenton 2011; Lewin 2010). In these reviews, the level of education of the lay health workers varied from primary school graduates to high school graduates, with some studies not reporting this information. Furthermore, the settings of the studies were middle‐ and high‐income countries. Second, referring caregivers of children who need immunisation to a health facility requires that there be a facility within reasonable distance of the community. This type of intervention may not be useful in settings in which households do not have easy access to health facilities. Finally, administering injectable vaccines at home has implications for vaccine quality and injection safety; given the need to maintain the cold chain from manufacture to administration of vaccines as well as the need to dispose of injection material safely (preferably by incineration). This approach may not be cost effective or sustainable in a resource‐constrained economy. The high diversity of the interventions and the contextual differences, therefore, make it difficult to draw conclusion on their effectiveness in improving vaccination coverage.
There is paucity of data on the sustainability of the interventions presented in this review, as none of the included studies reported long‐term follow‐up data. All had two data points that were at baseline and post‐intervention, making it impossible to ascertain the long‐term effects of the interventions. However, two studies aimed to build the capacity of the providers (Djibuti 2009; Morris 2004), and to upgrade the physical structure (Morris 2004). These strategies can contribute to sustainability if other supporting resources are available. A sustainability framework for projects aimed at strengthening immunisation systems in LMICs should include maintenance or continuance of health benefits from projects, institutionalisation of projects within the system, and capacity development (Gruen 2008; Shediac‐Rizkallah 1998). It has been observed that for a programme to be sustained, early and active planning is required (Shediac‐Rizkallah 1998). Sustainability of quality improvement interventions has been particularly challenging in LMICs, especially when a programme is supported by external funds (Gruen 2008). Withdrawal of external funds may not only impact negatively on the gains of the programme but may jeopardise support for future programmes (Gruen 2008). This is particularly so when the intervention is cost intensive.
Information on the resource implications of interventions may be helpful in determining their long‐term sustainability and cost effectiveness. Only one study provided data on the cost of the intervention (Andersson 2009). This study reported that community‐based health education in Pakistan costs USD9.00 per child. The cost of interventions would depend on the context of the intervention, as the cost to vaccinate a child fully has been reported to vary between USD1 and USD40 in LMICs (Shea 2009). Therefore, the cost of interventions should be reviewed within the context and settings of the studies. As part of their systematic review on the effects of lay or community health workers in primary health care (Glenton 2011; Lewin 2010), Glenton and colleagues reviewed the costs and cost‐effectiveness of vaccination programme interventions involving lay health workers (Corluka 2009). The authors found that studies did not adequately address affordability and sustainability and were also highly heterogeneous in terms of settings and outcomes, limiting their comparability. In addition, they found insufficient data to allow any conclusions to be drawn regarding the cost‐effectiveness of lay health worker interventions to promote vaccination uptake. Studies focused largely on health outcomes and did illustrate to some extent how the institutional characteristics of communities, such as governance and sources of financial support, influence sustainability (Corluka 2009). Considering that the interventions assessed in this review were set up as parallel programmes, rather than being integrated into routine services, it is unclear how effective they will be if integrated with other services within the system, with the typical levels of human and other resources available. This calls for cost‐effectiveness evaluations of these interventions, particularly as integrated rather than stand‐alone programmes (Dicko 2011; Okwo‐Bele 2012). Such evaluations also have limitations as it can be difficult to translate these findings from one setting to another. Therefore, there is need for study authors to provide the details of the required resources to implement the intervention.
Many immunisation programmes in LMICs are delivered as mass immunisation on set 'immunisation days', following mass immunisation campaigns (Balraj 1986; Bandyopadhyay 1996; Berry 1991; Cutts 1990; Gomber 1996; Kumar 1990; Lin 1971; Linkins 1995; Shaikh 2003). None of the reports of this commonly used strategy met the criteria for inclusion in our review or for the Saeterdal 2014 Cochrane review on interventions aimed at communities to inform and /or educate on early childhood vaccination. Shea 2009 has noted that it may be difficult to randomise mass media interventions. However, ITS designs could be used to assess the effects of these mass immunisation campaigns on immunisation coverage (Nglazi 2014).
Quality of the evidence
This review included 14 studies, three had unclear risk of bias (Andersson 2009; Owais 2011; Pandey 2007), while all the others had high risk of bias. The main study limitations were non‐concealment of allocation, no blinding, lack of protection against contamination, and extraneous sources of bias. The cluster RCTs were adjusted for cluster effects. Overall, the certainty of the evidence for most interventions was low. This implies that the currently available research provides some indication of the likely effect of the interventions. However, the likelihood is high that the true effect of the interventions will be substantially different.
Potential biases in the review process
We minimised bias in the process of conducting and reporting the current review by adhering to standard Cochrane guidelines (Higgins 2011). However, access to studies from LMICs is limited to those studies published in indexed journals. There may be a need to identify non‐indexed local journals and the grey literature in low‐income countries, and to conduct handsearching of these sources. In addition, as noted by Machingaidze and colleagues, due to the broad nature of childhood immunisation (encompassing many different components) identifying a search strategy that includes all aspects of childhood immunisations is challenging (Machingaidze 2014). However, in one 2014 Cochrane review on community‐aimed interventions to inform and educate about childhood vaccination, the authors did not identify additional studies to those included in this review (Saeterdal 2014).
Agreements and disagreements with other studies or reviews
Several previous systematic reviews assessed the effectiveness of interventions for improving childhood immunisation coverage (Batt 2004; Bordley 2000; Giles 2014; Glenton 2011; Jacobson Vann 2005; Johri 2015b; Kaufman 2013; Kendrick 2000; Pegurri 2005; Ryman 2008), although very few of them included studies from LMICs (Batt 2004; Glenton 2011; Pegurri 2005; Ryman 2008), and many were already out‐of‐date as the dates of the most recent searches for the reviews were pre‐2005 (Batt 2004; Bordley 2000; Jacobson Vann 2005; Kendrick 2000; Pegurri 2005).
Measures of effect for participant reminders in this review tend to agree with a now out‐of‐date systematic review of interventions aimed at reminding people of their immunisation schedules (Jacobson Vann 2005). Home visits, participant reminders through a redesigned immunisation card, and health education improved the uptake of immunisation in this review. Similarly, telephone calls, sending of letters and postcards, and speaking to clients in person improved the coverage of childhood vaccines in the participant‐reminder review (Jacobson Vann 2005).
We found low‐certainty evidence that monetary incentives (in the form of vouchers, conditional, and unconditional cash transfers) may have little or no effect on uptake of vaccines. This differs from the findings of several related systematic reviews: one systematic review on the effect of conditional cash transfers on health outcomes and the use of health services reported an improvement in the use of health services but, similar to this review, reported mixed results for uptake of immunisation in children (Lagarde 2009a). Two older (and now out of date) reviews also reported on the effects of this intervention (Giuffrida 1997; Kane 2004). One more recent review on the topic included 16 studies from high‐income countries on smoking cessation (10 studies), attendance for vaccination or screening (five studies), and physical activity (one study) (Giles 2014). It reported an increase in vaccination and screening attendance with monetary incentives. However, subgroup analysis showed that cash plus other motivational components was more effective than cash or vouchers alone. The differences between our review findings and those of this review may reflect differences across settings (high‐income compared to low‐ and middle‐income countries) or limitations of the studies included in our review. In addition, the Morris 2004 study findings were of low certainty because of high risk of bias.
Ryman and colleagues conducted a comprehensive search in 2005 to identify peer‐reviewed and grey literature on strategies for improving childhood immunisation coverage in LMICs (Ryman 2008). They identified 25 studies that included an appropriate control group, and grouped the papers into four strategic approaches: bringing immunisation closer to communities (11 studies), using information dissemination to increase demand for vaccination (three studies), changing practices in fixed sites (four studies), and using innovative management practices (seven studies). The studies included RCTs, nRCTs, CBAs, and observational studies, and reported improvements in immunisation coverage of varying degrees. Unlike Ryman and colleagues, we excluded observational studies. We included CBAs if they had more than two units in both the intervention and control groups, in accordance with EPOC guidance (EPOC 2015a). Though the Ryman review identified studies that reported improvements in immunisation coverage, they noted that the indicators of success varied widely making it impossible for the data to be merged in a meta‐analysis (Ryman 2008). We also found that studies reported immunisation outcomes in a variety of ways, for example, proportion of children aged 12 to 23 months who had received measles, proportion of children aged 12 to 23 month who had received full course of DTP (Andersson 2009); probability of receiving at least one immunisation (excluding OPV), the presence of the BCG scar, the number of immunisations received, the probability of being fully immunised (Banerjee 2010); immunisation full coverage of children aged 12 to 23 months with three doses of DTP, BCG, and measles vaccines (Barham 2005); DTP3 coverage at the end of day 90 post‐enrolment (Usman 2011), etc. However, our foreknowledge of childhood immunisation programmes guided our decisions regarding which outcomes were synonymous (and thus can be combined in a meta‐analysis) and which are not.
In a related systematic review, Glenton and colleagues assessed the effects of lay or community health worker interventions on childhood immunisation coverage (Glenton 2011). They conducted the last search in 2009, and identified 12 studies; including 10 RCTs. Five of the studies were carried out in LMICs. In 10 studies, community health workers promoted childhood immunisation and in the remaining two studies, community health workers vaccinated children themselves. Most of the studies showed that the use of lay or community health workers to promote immunisation uptake probably increased the number of children who were fully immunised. Our findings on the effect of community‐based health education and home visits were consistent with these findings.
Johri and colleagues reported a systematic review of "strategies to increase demand for vaccination are effective in increasing child vaccine coverage in low‐ and middle‐income countries". The authors concluded that, "demand‐side interventions are effective in improving the uptake of childhood vaccines delivered through routine immunization services in low‐ and middle‐income countries" (Johri 2015b).
Finally, our review is related to two other Cochrane reviews (Kaufman 2013; Saeterdal 2014); conducted under the auspices of the 'Communicate to Vaccinate' project (Lewin 2011). Kaufman 2013 assessed the effects of face‐to‐face interventions for informing or educating parents about early childhood vaccination on immunisation uptake and parental knowledge and Saeterdal 2014 reviewed interventions aimed at communities to inform or educate (or both) about early childhood vaccination. The two reviews included studies from any setting while this review focused on low LMICs. We included three of the studies (Bolam 1998; Usman 2009; Usman 2011) included in the Kaufman 2013 review in our review and two studies (Andersson 2009; Pandey 2007) from our review were included in the Saeterdal 2014 review. While the findings of this review were similar to the findings of the Saeterdal 2014 review (i.e. that these interventions probably increase immunisation coverage), they differed from the findings of Kaufman 2013 that reported little or no improvement in immunisation coverage. This may be because Kaufman included studies from high‐, middle‐, and low‐income countries.
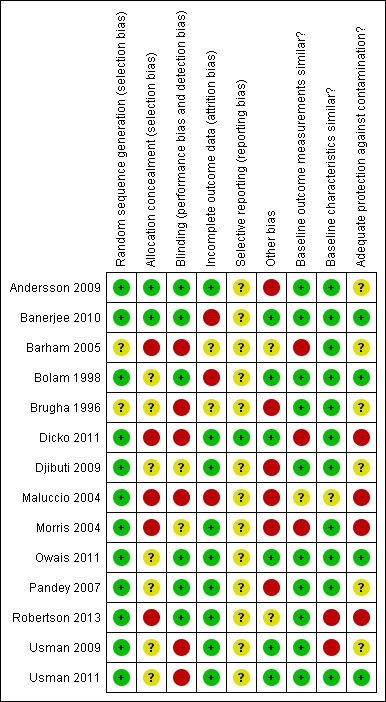
Methodological quality summary: review authors' judgements about each methodological quality item for each included study.
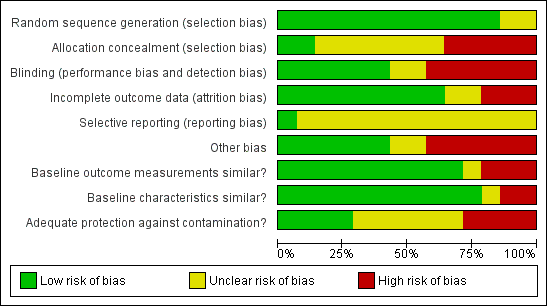
Methodological quality graph: review authors' judgements about each methodological quality item presented as percentages across all included studies.

Study flow diagram.
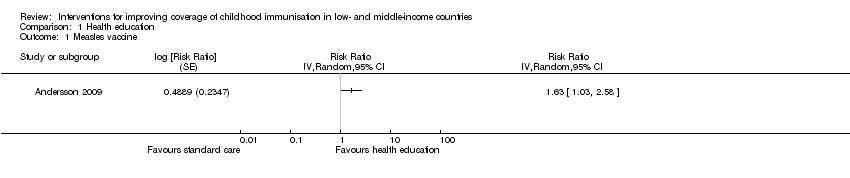
Comparison 1 Health education, Outcome 1 Measles vaccine.

Comparison 1 Health education, Outcome 2 DTP3.

Comparison 1 Health education, Outcome 3 Received at least 1 vaccine.
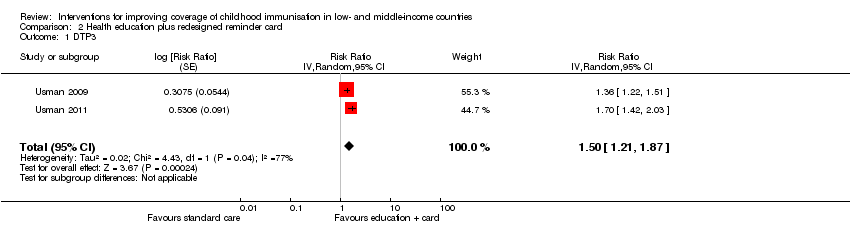
Comparison 2 Health education plus redesigned reminder card, Outcome 1 DTP3.

Comparison 3 Household monetary incentive, Outcome 1 Measles.

Comparison 3 Household monetary incentive, Outcome 2 Fully immunised children.

Comparison 3 Household monetary incentive, Outcome 3 BCG.

Comparison 3 Household monetary incentive, Outcome 4 MMR.
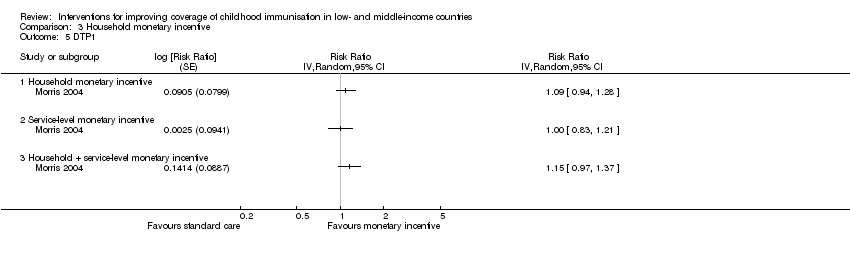
Comparison 3 Household monetary incentive, Outcome 5 DTP1.

Comparison 4 Home visit, Outcome 1 OPV3.
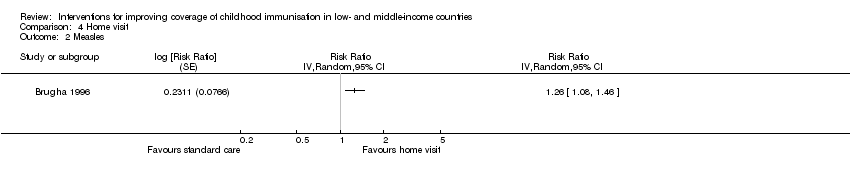
Comparison 4 Home visit, Outcome 2 Measles.

Comparison 5 Regular immunisation outreach, Outcome 1 Fully immunised children.
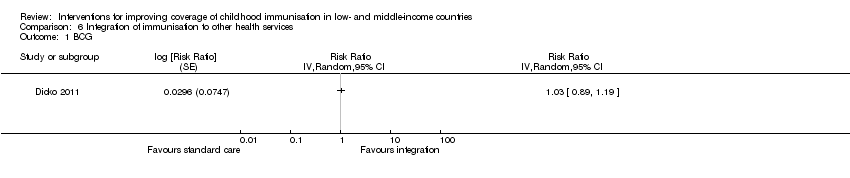
Comparison 6 Integration of immunisation to other health services, Outcome 1 BCG.

Comparison 6 Integration of immunisation to other health services, Outcome 2 DTP3.

Comparison 6 Integration of immunisation to other health services, Outcome 3 Measles.
| Population: children aged < 24 months | |||||
| Outcomes | Anticipated absolute effects (95% CI)* | Relative effect | No of participants | Certainty of the evidence | |
| Standard care | Health education | ||||
| DTP3 (Follow‐up: 4‐9 months) | 577 per 1000 | 969 per 1000 | RR 1.68 | 1692 | ⊕⊕⊕⊝ |
| *The effect in the 'health education' group (and its 95% CI) was based on the assumed risk in the 'standard care' group and the relative effect of the intervention (and its 95% CI). CI: Confidence interval;DTP3: 3 doses of diphtheria‐tetanus‐pertussis containing vaccines; RR: risk ratio. | |||||
| GRADE Working Group grades of evidence High certainty: This research provides a very good indication of the likely effect. The likelihood that the effect will be substantially different is low. Moderate certainty: This research provides a good indication of the likely effect. The likelihood that the effect will be substantially different is moderate. Low certainty: This research provides some indication of the likely effect. However, the likelihood that it will be substantially different is high. Very low certainty: This research does not provide a reliable indication of the likely effect. The likelihood that the effect will be substantially different is very high. 'Substantially different' implies a large enough difference that it might affect a decision. | |||||
| 1 We rated down by 1 level because we judged the included studies at high risk of bias. 2 We rated down by 1 level because of unexplained heterogeneity of effects across studies, P value < 0.00001, I2 = 68%. | |||||
| Population: children aged 6 weeks Setting: Pakistan | |||||
| Outcomes | Anticipated absolute effects* (95% CI) | Relative effect | No of participants | Certainty of the evidence | |
| Standard care | Health education plus redesigned card | ||||
| DTP3 (Follow‐up: 90 days) | 470 per 1000 | 705 per 1000 | RR 1.50 | 1502 | ⊕⊕⊝⊝ |
| *The effect in the 'health education + redesigned card' group (and its 95% CI) was based on the assumed risk in the 'standard care' group and the relative effect of the intervention (and its 95% CI). CI: confidence interval;DTP3: 3 doses of diphtheria‐tetanus‐pertussis containing vaccines; RR: risk ratio. | |||||
| GRADE Working Group grades of evidence High certainty: This research provides a very good indication of the likely effect. The likelihood that the effect will be substantially different is low. Moderate certainty: This research provides a good indication of the likely effect. The likelihood that the effect will be substantially different is moderate. Low certainty: This research provides some indication of the likely effect. However, the likelihood that it will be substantially different is high. Very low certainty: This research does not provide a reliable indication of the likely effect. The likelihood that the effect will be substantially different is very high. 'Substantially different' implies a large enough difference that it might affect a decision. | |||||
| 1 We rated down by 1 level because of unexplained heterogeneity of effects across studies; P value = 0.04; I2 = 77%. 2 We rated down by 1 level because we judged the 2 included studies at unclear risk of selection bias and at high risk of performance and detection bias. 3 Usman 2009; Usman 2011. | |||||
| Population: children aged < 5 years | |||||
| Outcomes | Anticipated absolute effects* (95% CI) | Relative effect | No of participants | Certainty of the evidence | |
| Standard care | Monetary incentive | ||||
| Fully immunised children (Follow‐up: 13 months to 5 years) | 701 per 1000 | 736 per 1000 | RR 1.05 | 1000 | ⊕⊕⊝⊝ |
| *The effect in the 'monetary incentive' group (and its 95% CI) was based on the assumed risk in the 'standard care' group and the relative effect of the intervention (and its 95% CI). | |||||
| GRADE Working Group grades of evidence High certainty: This research provides a very good indication of the likely effect. The likelihood that the effect will be substantially different is low. Moderate certainty: This research provides a good indication of the likely effect. The likelihood that the effect will be substantially different is moderate. Low certainty: This research provides some indication of the likely effect. However, the likelihood that it will be substantially different is high. Very low certainty: This research does not provide a reliable indication of the likely effect. The likelihood that the effect will be substantially different is very high. 'Substantially different' implies a large enough difference that it might affect a decision. | |||||
| 1 We rated down by 2 levels because we judged the 2 included studies at high risk of bias. | |||||
| Population: children aged 12‐18 months Setting: Ghana | |||||
| Outcomes | Anticipated absolute effects* (95% CI) | Relative effect | No of participants | Certainty of the evidence | |
| Standard care | Home visits | ||||
| OPV3 | 73 per 100 | 89 per 100 | RR 1.22 | 419 | ⊕⊕⊝⊝ |
| *The effect in the 'home visits' group (and its 95% CI) was based on the assumed risk in the 'standard care' group and the relative effect of the intervention (and its 95% CI). | |||||
| GRADE Working Group grades of evidence High certainty: This research provides a very good indication of the likely effect. The likelihood that the effect will be substantially different is low. Moderate certainty: This research provides a good indication of the likely effect. The likelihood that the effect will be substantially different is moderate. Low certainty: This research provides some indication of the likely effect. However, the likelihood that it will be substantially different is high. Very low certainty: This research does not provide a reliable indication of the likely effect. The likelihood that the effect will be substantially different is very high. | |||||
| 1 We rated down by 2 levels because the 1 included study was judged to be at high risk of bias. | |||||
| Population: children aged 0‐6 months | |||||
| Outcomes | Anticipated absolute effects* (95% CI) | Relative effect | No of participants | Certainty of the evidence | |
| Standard care | Immunisation outreach | ||||
| Fully immunised ‐ regular immunisation outreach only (Follow‐up: 18 months) | 58 per 1000 | 180 per 1000 | RR 3.09 | 1239 | ⊕⊕⊝⊝ |
| Fully immunised ‐ regular immunisation outreach + non‐monetary incentive (Follow‐up: 18 months) | 58 per 1000 | 387 per 1000 | RR 6.66 | 1242 | ⊕⊕⊝⊝ |
| *The effect in the 'immunisation outreach' group (and its 95% CI) was based on the assumed risk in the 'standard care' group and the relative effect of the intervention (and its 95% CI). | |||||
| GRADE Working Group grades of evidence High certainty: This research provides a very good indication of the likely effect. The likelihood that the effect will be substantially different is low. Moderate certainty: This research provides a good indication of the likely effect. The likelihood that the effect will be substantially different is moderate. Low certainty: This research provides some indication of the likely effect. However, the likelihood that it will be substantially different is high. Very low certainty: This research does not provide a reliable indication of the likely effect. The likelihood that the effect will be substantially different is very high. 'Substantially different' implies a large enough difference that it might affect a decision. | |||||
| 1 We rated down by 2 levels because we judged the 1 included study at high risk of bias. | |||||
| Population: children aged 0‐23 months | |||||
| Outcomes | Anticipated absolute effects* (95% CI) | Relative effect | No of participants | Certainty of the evidence | |
| Standard care | Integration | ||||
| DTP3 | 602 per 1000 | 1000 per 1000 | RR 1.92 | 1481 | ⊕⊕⊝⊝ |
| *The effect in the 'integration' group (and its 95% CI) was based on the assumed risk in the 'standard care' group and the relative effect of the intervention (and its 95% CI). | |||||
| GRADE Working Group grades of evidence High certainty: This research provides a very good indication of the likely effect. The likelihood that the effect will be substantially different is low. Moderate certainty: This research provides a good indication of the likely effect. The likelihood that the effect will be substantially different is moderate. Low certainty: This research provides some indication of the likely effect. However, the likelihood that it will be substantially different is high. Very low certainty: This research does not provide a reliable indication of the likely effect. The likelihood that the effect will be substantially different is very high. 'Substantially different' implies a large enough difference that it might affect a decision. | |||||
| 1 We rated down by 2 levels because we judged the 1 included study at high risk of bias. 2 Dicko 2011. | |||||
| Target | Interventions | Purpose of the interventions |
| Recipients | Communication interventions to inform and educate targeting individuals, groups, communities or providers, or a combination of these through face‐to‐face interaction, use of mass media, printed material, etc | To improve understanding on vaccination; its relevance; benefits and risks of vaccination; where, when, and how to receive vaccine services; and who should receive vaccine services (Willis 2013) |
| Communication interventions to recall or remind using face‐to‐face interaction, telephone, mail, etc | To remind those who are overdue for vaccination in order to reduce drop‐out rate (Willis 2013) | |
| Communication interventions to teach skills, e.g. parenting skills | To provide people with the ability to operationalise knowledge through the adoption of practical skills (Willis 2013) | |
| Communication interventions to provide support | To provide assistance or advice for consumers (Willis 2013) | |
| Interventions to facilitate decision‐making, e.g. decision aids on vaccination for parents | To assist carers in participating in decision making (Dubé 2013) | |
| Interventions to enable communication through traditional media, internet, etc | To make communication possible (Dubé 2013) | |
| Interventions, including communication, to enhance community ownership, e.g. community dialogues involving traditional and religious rulers | To increase demand for vaccination To ensure sustainability To build trust in vaccination and vaccination services To drive demand for vaccination | |
| Incentives | To reward service uptake; to cover out‐of‐pocket cost | |
| Providers | Training | To improve knowledge on vaccination, to improve skills, to improve attitudes to clients, to reduce missed opportunities for vaccination |
| Audit and feedback | To ensure quality and client satisfaction with services | |
| Supportive supervision | To ensure quality and maintain standards, to reduce missed opportunities for vaccination | |
| Incentives | To boost morale and enhance performance | |
| Health system | Infrastructural development, e.g. provision of health facilities, provision of road to improve access to health facilities | To ensure access to services |
| Logistic support | To improve service quality service and so improve utilisation to ensure availability of services | |
| Service delivery, e.g. outreach; home visits; integration of vaccination with other services; guidelines/protocol for vaccination; increased resources | Outreach to improve access to services Home visits to remind parents about vaccination and identify unimmunised children for immunisation Integration to encourage vaccine uptake Guidelines and protocols to ensure quality of services Improved resources to ensure availability of services | |
| Policy makers | Advocacy for: development of supporting policies, increased funding of health services | To promote the development of policies to support vaccine uptake To increase funding to the health sector |
| Outcome or subgroup title | No. of studies | No. of participants | Statistical method | Effect size |
| 1 Measles vaccine Show forest plot | 1 | Risk Ratio (Random, 95% CI) | Totals not selected | |
| 2 DTP3 Show forest plot | 5 | Risk Ratio (Random, 95% CI) | Subtotals only | |
| 2.1 Community‐based education | 2 | Risk Ratio (Random, 95% CI) | 1.68 [1.09, 2.59] | |
| 2.2 Facility‐based education | 3 | Risk Ratio (Random, 95% CI) | 1.20 [0.97, 1.48] | |
| 3 Received at least 1 vaccine Show forest plot | 1 | Risk Ratio (Random, 95% CI) | Totals not selected | |
| Outcome or subgroup title | No. of studies | No. of participants | Statistical method | Effect size |
| 1 DTP3 Show forest plot | 2 | Risk Ratio (Random, 95% CI) | 1.50 [1.21, 1.87] | |
| Outcome or subgroup title | No. of studies | No. of participants | Statistical method | Effect size |
| 1 Measles Show forest plot | 1 | Risk Ratio (Random, 95% CI) | Totals not selected | |
| 2 Fully immunised children Show forest plot | 2 | Risk Ratio (Random, 95% CI) | 1.05 [0.90, 1.23] | |
| 3 BCG Show forest plot | 1 | Risk Ratio (Random, 95% CI) | Totals not selected | |
| 4 MMR Show forest plot | 1 | Risk Ratio (Random, 95% CI) | Totals not selected | |
| 4.1 Household monetary incentive | 1 | Risk Ratio (Random, 95% CI) | 0.0 [0.0, 0.0] | |
| 4.2 Service‐level monetary incentive | 1 | Risk Ratio (Random, 95% CI) | 0.0 [0.0, 0.0] | |
| 4.3 Household + service‐level monetary incentive | 1 | Risk Ratio (Random, 95% CI) | 0.0 [0.0, 0.0] | |
| 5 DTP1 Show forest plot | 1 | Risk Ratio (Random, 95% CI) | Totals not selected | |
| 5.1 Household monetary incentive | 1 | Risk Ratio (Random, 95% CI) | 0.0 [0.0, 0.0] | |
| 5.2 Service‐level monetary incentive | 1 | Risk Ratio (Random, 95% CI) | 0.0 [0.0, 0.0] | |
| 5.3 Household + service‐level monetary incentive | 1 | Risk Ratio (Random, 95% CI) | 0.0 [0.0, 0.0] | |
| Outcome or subgroup title | No. of studies | No. of participants | Statistical method | Effect size |
| 1 OPV3 Show forest plot | 1 | Risk Ratio (Random, 95% CI) | Totals not selected | |
| 2 Measles Show forest plot | 1 | Risk Ratio (Random, 95% CI) | Totals not selected | |
| Outcome or subgroup title | No. of studies | No. of participants | Statistical method | Effect size |
| 1 Fully immunised children Show forest plot | 1 | Risk Ratio (Fixed, 95% CI) | Totals not selected | |
| 1.1 Regular immunisation outreach only | 1 | Risk Ratio (Fixed, 95% CI) | 0.0 [0.0, 0.0] | |
| 1.2 Regular immunisation outreach + incentive | 1 | Risk Ratio (Fixed, 95% CI) | 0.0 [0.0, 0.0] | |
| Outcome or subgroup title | No. of studies | No. of participants | Statistical method | Effect size |
| 1 BCG Show forest plot | 1 | Risk Ratio (Random, 95% CI) | Totals not selected | |
| 2 DTP3 Show forest plot | 1 | Risk Ratio (Random, 95% CI) | Totals not selected | |
| 3 Measles Show forest plot | 1 | Risk Ratio (Random, 95% CI) | Totals not selected | |