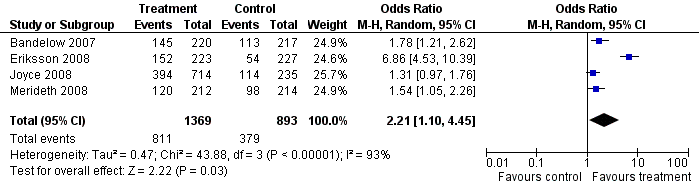
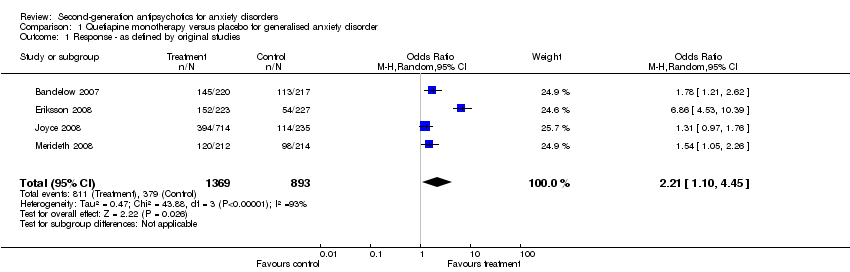
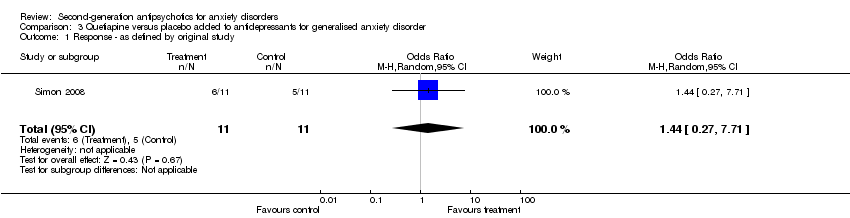
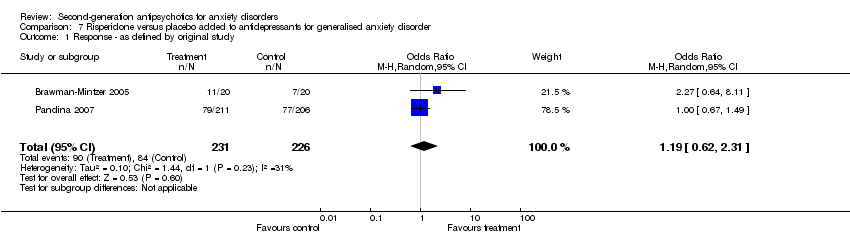
| 1 Response ‐ as defined by original studies Show forest plot | 4 | 2262 | Odds Ratio (M‐H, Random, 95% CI) | 2.21 [1.10, 4.45] |
|
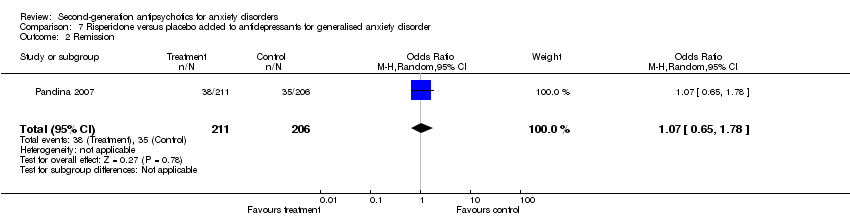
| 2 Remission ‐ as defined by original studies Show forest plot | 4 | 2262 | Odds Ratio (M‐H, Random, 95% CI) | 1.83 [1.07, 3.12] |
|
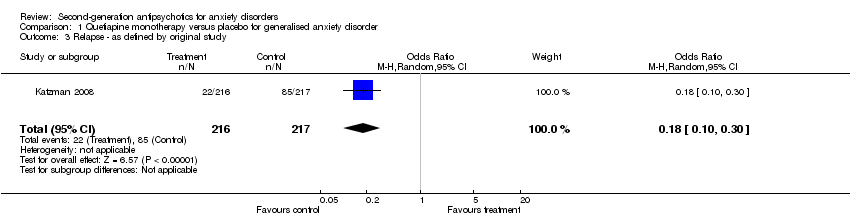
| 3 Relapse ‐ as defined by original study Show forest plot | 1 | 433 | Odds Ratio (M‐H, Random, 95% CI) | 0.18 [0.10, 0.30] |
|
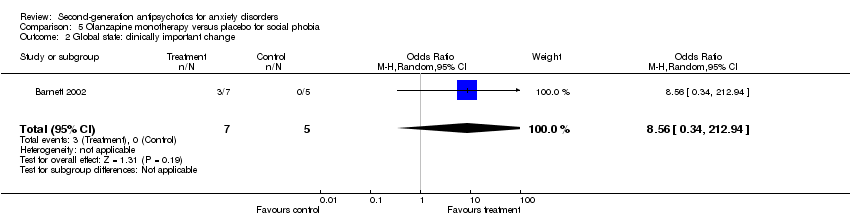
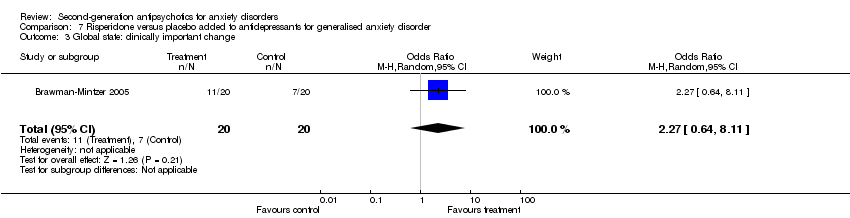
| 4 Global state: clinically important change Show forest plot | 4 | 2262 | Odds Ratio (M‐H, Random, 95% CI) | 2.28 [1.01, 5.14] |
|
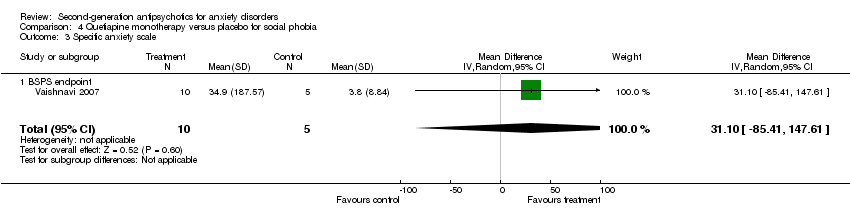
| 5 Specific anxiety scale Show forest plot | 5 | | Mean Difference (IV, Random, 95% CI) | Subtotals only |
|
| 5.1 Short‐term HAM‐A change | 4 | 2196 | Mean Difference (IV, Random, 95% CI) | ‐2.58 [‐4.00, ‐1.16] |
| 5.2 Long‐term HAM‐A‐change | 1 | 432 | Mean Difference (IV, Random, 95% CI) | ‐2.04 [‐3.25, ‐0.83] |
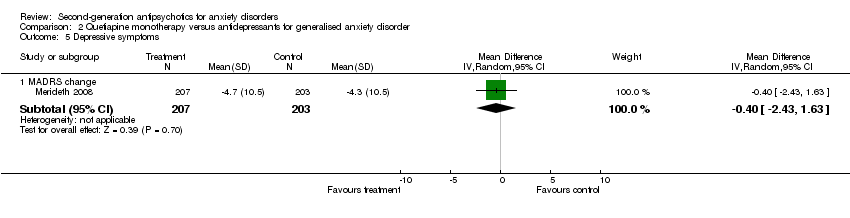
| 6 Depressive Symptoms : MADRS change Show forest plot | 3 | | Mean Difference (IV, Random, 95% CI) | Subtotals only |
|
| 6.1 Short‐term MADRS‐change | 2 | 867 | Mean Difference (IV, Random, 95% CI) | ‐3.05 [‐5.99, ‐0.10] |
| 6.2 Long‐term MADRS change | 1 | 432 | Mean Difference (IV, Random, 95% CI) | ‐1.85 [‐2.94, ‐0.76] |
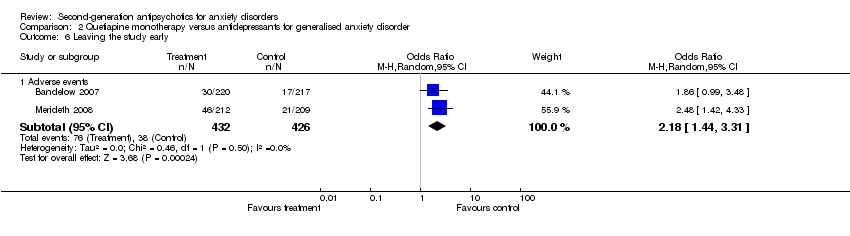
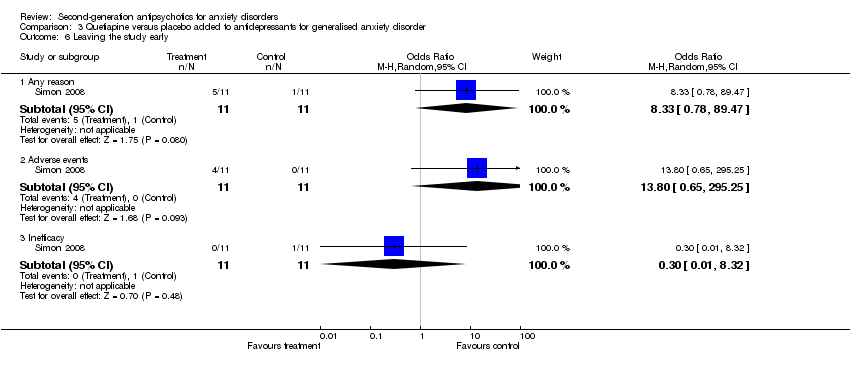
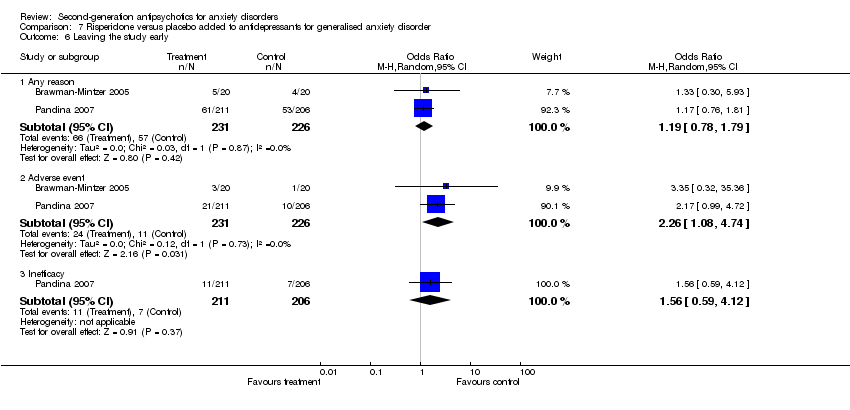
| 7 Leaving the study early Show forest plot | 5 | | Odds Ratio (M‐H, Random, 95% CI) | Subtotals only |
|
| 7.1 Short‐term adverse events | 4 | 2262 | Odds Ratio (M‐H, Random, 95% CI) | 3.76 [2.64, 5.34] |
| 7.2 Long‐term adverse events | 1 | 433 | Odds Ratio (M‐H, Random, 95% CI) | 0.62 [0.20, 1.92] |
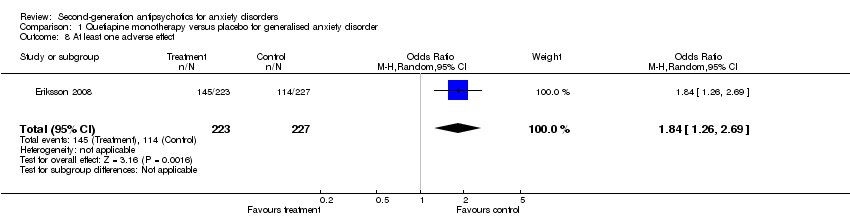
| 8 At least one adverse effect Show forest plot | 1 | 450 | Odds Ratio (M‐H, Random, 95% CI) | 1.84 [1.26, 2.69] |
|
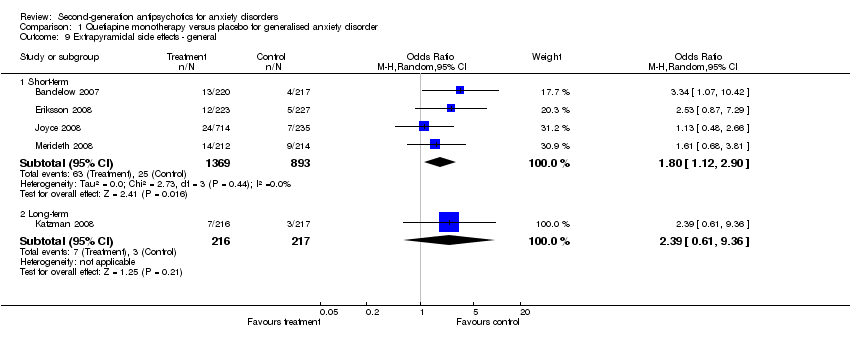
| 9 Extrapyramidal side effects ‐ general Show forest plot | 5 | | Odds Ratio (M‐H, Random, 95% CI) | Subtotals only |
|
| 9.1 Short‐term | 4 | 2262 | Odds Ratio (M‐H, Random, 95% CI) | 1.80 [1.12, 2.90] |
| 9.2 Long‐term | 1 | 433 | Odds Ratio (M‐H, Random, 95% CI) | 2.39 [0.61, 9.36] |
| 10 Weight ‐ number of patients with significant weight change Show forest plot | 5 | | Odds Ratio (M‐H, Random, 95% CI) | Subtotals only |
|
| 10.1 Short‐term | 4 | 2262 | Odds Ratio (M‐H, Random, 95% CI) | 2.39 [1.23, 4.65] |
| 10.2 Long‐term | 1 | 433 | Odds Ratio (M‐H, Random, 95% CI) | 1.00 [0.20, 5.03] |
| 11 Weight ‐ mean change of weight in kg Show forest plot | 4 | 2201 | Mean Difference (IV, Random, 95% CI) | 0.63 [0.40, 0.86] |
|
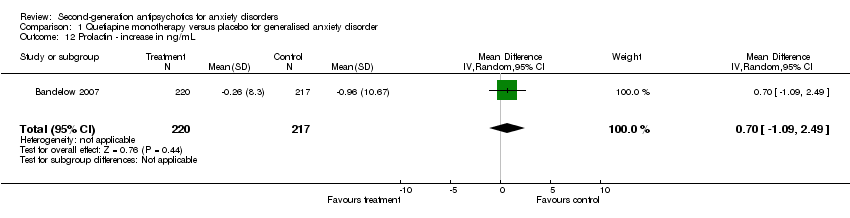
| 12 Prolactin ‐ increase in ng/mL Show forest plot | 1 | 437 | Mean Difference (IV, Random, 95% CI) | 0.7 [‐1.09, 2.49] |
|
| 13 Sedation Show forest plot | 5 | | Odds Ratio (M‐H, Random, 95% CI) | Subtotals only |
|
| 13.1 Short‐term | 4 | 2262 | Odds Ratio (M‐H, Random, 95% CI) | 4.48 [2.65, 7.59] |
| 13.2 Long‐term | 1 | 433 | Odds Ratio (M‐H, Random, 95% CI) | 11.31 [0.62, 205.84] |
| 14 Subgroup analysis: older versus younger participants ‐ response ‐ as defined by the original studies Show forest plot | 4 | 2262 | Odds Ratio (IV, Random, 95% CI) | 2.21 [1.10, 4.45] |
|
| 14.1 Younger participants (< 65 years) | 3 | 1812 | Odds Ratio (IV, Random, 95% CI) | 1.49 [1.22, 1.81] |
| 14.2 Older participants (> 65 years) | 1 | 450 | Odds Ratio (IV, Random, 95% CI) | 6.86 [4.53, 10.39] |
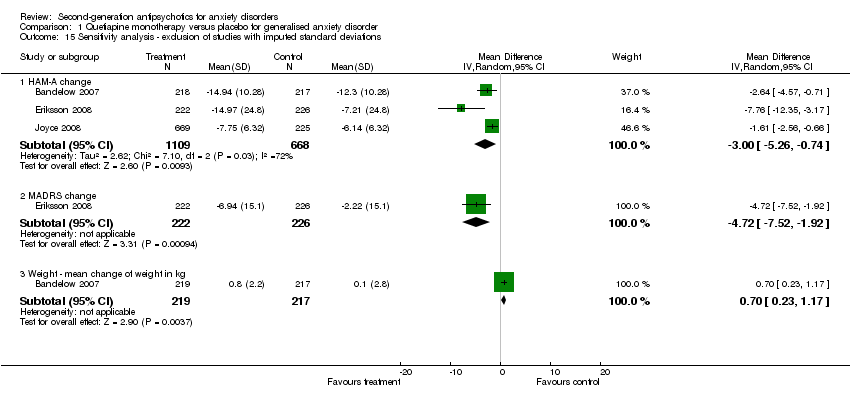
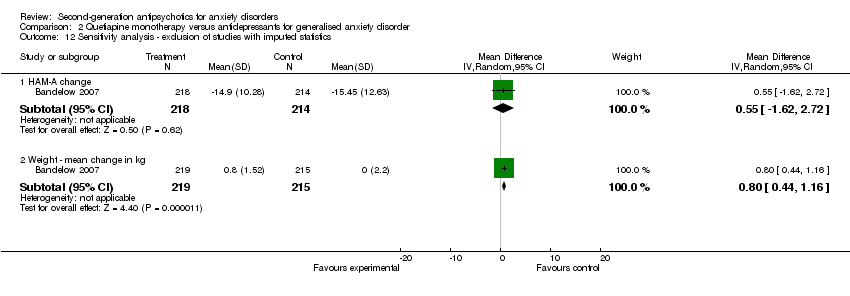
| 15 Sensitivity analysis ‐ exclusion of studies with imputed standard deviations Show forest plot | 3 | | Mean Difference (IV, Random, 95% CI) | Subtotals only |
|
| 15.1 HAM‐A change | 3 | 1777 | Mean Difference (IV, Random, 95% CI) | ‐1.00 [‐5.26, ‐0.74] |
| 15.2 MADRS change | 1 | 448 | Mean Difference (IV, Random, 95% CI) | ‐4.72 [‐7.52, ‐1.92] |
| 15.3 Weight ‐ mean change of weight in kg | 1 | 436 | Mean Difference (IV, Random, 95% CI) | 0.70 [0.23, 1.17] |