Intervenciones farmacológicas para la hipertensión en niños
Información
- DOI:
- https://doi.org/10.1002/14651858.CD008117.pub2Copiar DOI

- Base de datos:
-
- Cochrane Database of Systematic Reviews
- Versión publicada:
-
- 01 febrero 2014see what's new
- Tipo:
-
- Intervention
- Etapa:
-
- Review
- Grupo Editorial Cochrane:
-
Grupo Cochrane de Hipertensión
- Copyright:
-
- Copyright © 2014 The Cochrane Collaboration. Published by John Wiley & Sons, Ltd.
Cifras del artículo
Altmetric:
Citado por:
Autores
Contributions of authors
Swasti Chaturvedi formulated the idea and developed the basis for the protocol. She took a lead role in searching, identifying and assessing studies, data extraction and analysis, and writing up the final review.
Deborah Lipszyc helped in identifying and assessing studies, double‐checking the data extraction and the 'Risk of bias' assessment. She also participated in writing up the final review.
Christoph Licht participated in writing up the review.
Jonathan Craig helped in resolving any disagreement and completion ofthe review.
Rulan Parekh participated in developing the protocol, assessment of studies, data extraction and analysis, and in completing the final manuscript.
Sources of support
Internal sources
-
Hospital for Sick Children, Toronto, Canada.
External sources
-
No sources of support supplied
Declarations of interest
None known.
Acknowledgements
The authors would like to acknowledge the help provided by the Cochrane Hypertension Group and Ms Miranda Cumpston from the Australasian Cochrane Centre.
Version history
| Published | Title | Stage | Authors | Version |
| 2014 Feb 01 | Pharmacological interventions for hypertension in children | Review | Swasti Chaturvedi, Deborah H Lipszyc, Christoph Licht, Jonathan C Craig, Rulan Parekh | |
| 2009 Oct 07 | Pharmacological interventions for essential hypertension in children | Protocol | Swasti Chaturvedi, Christoph Licht, Rulan Parekh, Jonathan C Craig | |
Differences between protocol and review
Changed protocol from pharmacological interventions for primary hypertension to include pharmacological interventions for both primary and secondary causes of hypertension, given the paucity of trials for primary hypertension.
Deborah Lipszyc was added as an author. She helped in identifying and assessing studies, double‐checking the data extraction and the 'Risk of bias' assessment. She also participated in writing up the final review.
Keywords
MeSH
Medical Subject Headings (MeSH) Keywords
- Angiotensin Receptor Antagonists [therapeutic use];
- Angiotensin‐Converting Enzyme Inhibitors [therapeutic use];
- Antihypertensive Agents [*therapeutic use];
- Blood Pressure [drug effects];
- Calcium Channel Blockers [therapeutic use];
- Diuretics [therapeutic use];
- Hypertension [*drug therapy];
- Randomized Controlled Trials as Topic;
Medical Subject Headings Check Words
Adolescent; Child; Humans;
PICO
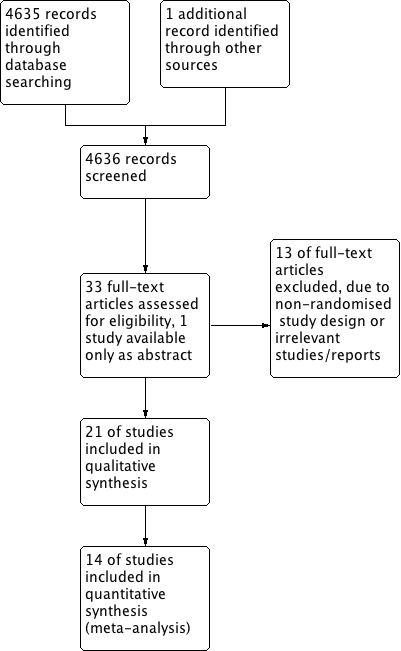
Study flow diagram.
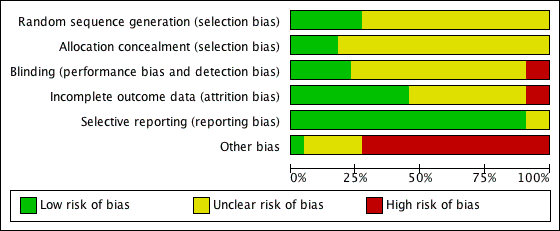
'Risk of bias' graph: review authors' judgements about each methodological quality item presented as percentages across all included studies.

'Risk of bias' summary: review authors' judgements about each risk of bias item for each included study.

Forest plot of comparison: 1 Antihypertensive drug class versus placebo, outcome: 1.1 Systolic blood pressure.
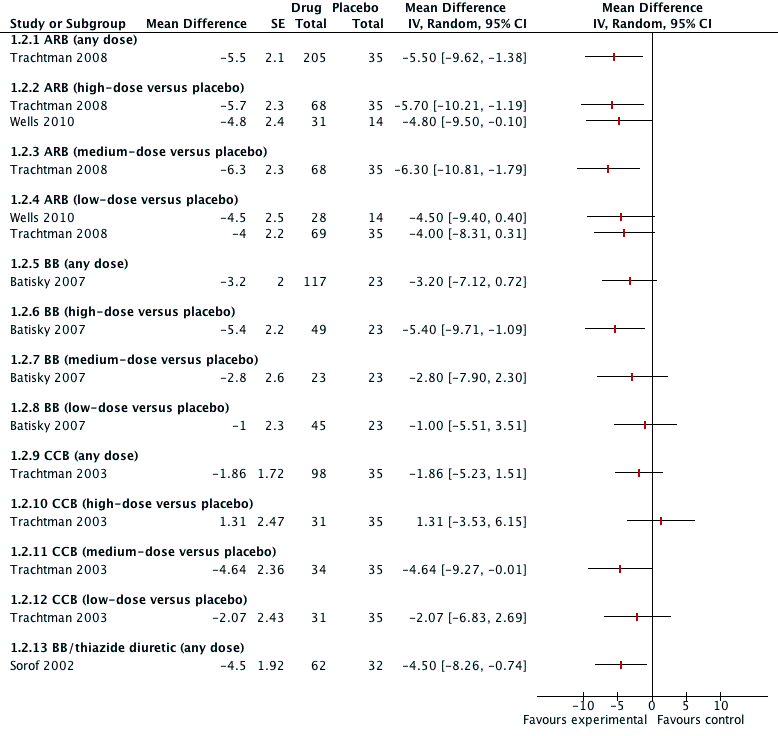
Forest plot of comparison: 1 Antihypertensive drug class versus placebo, outcome: 1.2 Diastolic blood pressure.

Forest plot of comparison: 2 Drug different doses, outcome: 2.1 SBP.

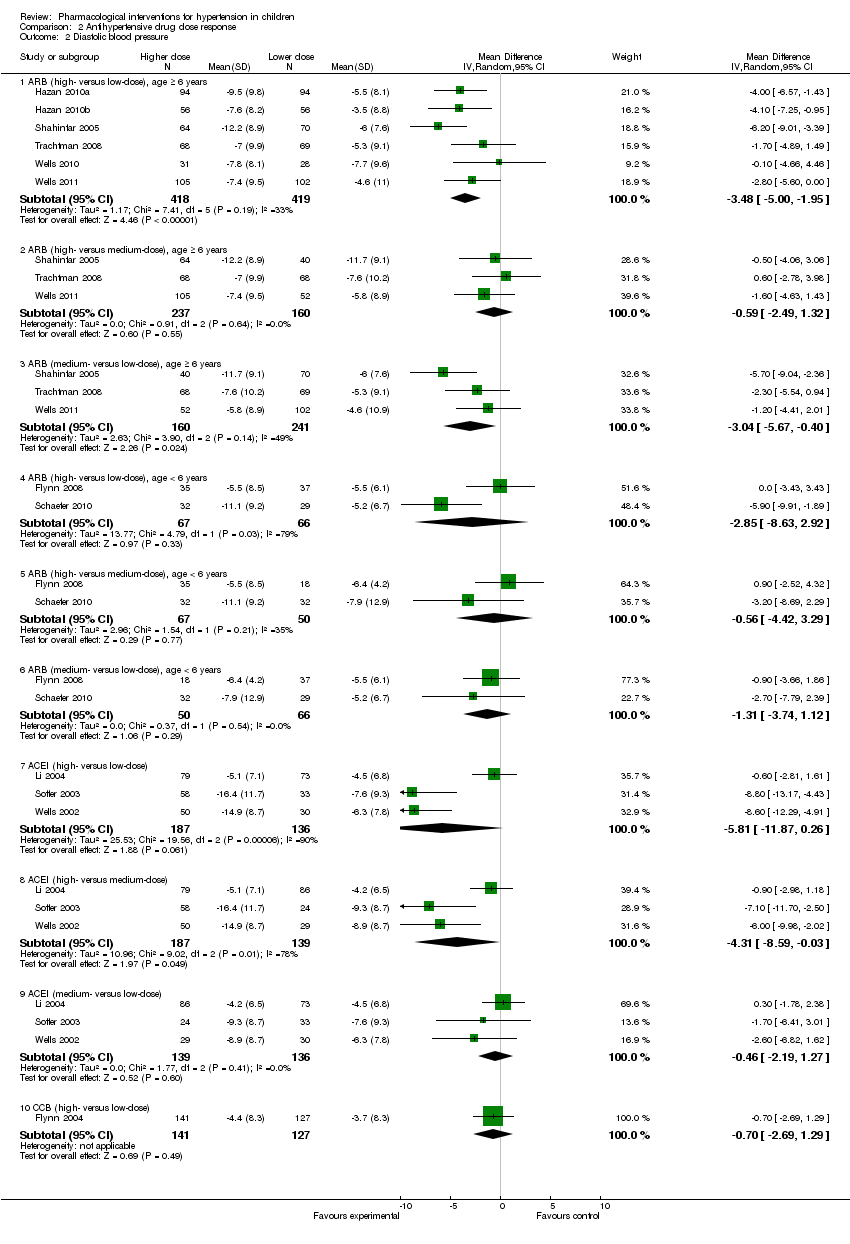
Forest plot of comparison: 2 Drug different doses, outcome: 2.2 DBP.

Comparison 1 Antihypertensive drug class versus placebo, Outcome 1 Systolic blood pressure.
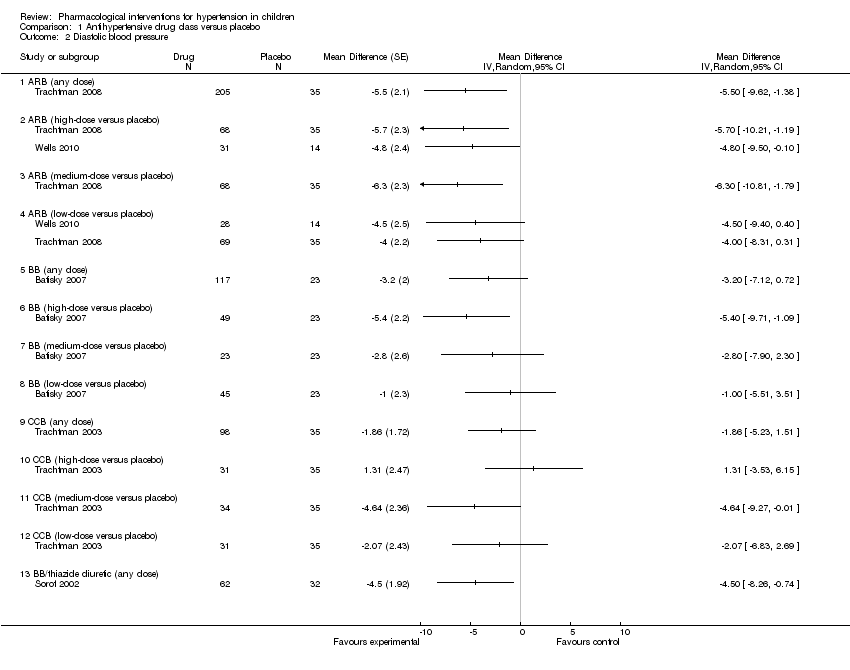
Comparison 1 Antihypertensive drug class versus placebo, Outcome 2 Diastolic blood pressure.

Comparison 2 Antihypertensive drug dose response, Outcome 1 Systolic blood pressure.
Comparison 2 Antihypertensive drug dose response, Outcome 2 Diastolic blood pressure.
| Antihypertensive drug class compared to placebo for hypertension in children: systolic blood pressure reduction | ||||
| Patient or population: children (from 1 to 18 years of age) with hypertension from primary or secondary causes | ||||
| Outcomes | Magnitude of reduction in systolic blood pressuremmHg in treatment group minus placebo response Mean difference with 95% CI | No of participants | Quality of the evidence | Comments |
| Angiotensin receptor blocker (any dose) Mean duration of 4 weeks | ‐6.50 (‐9.44 to ‐3.56) | 240 | ⊕⊝⊝⊝ | Refer 1 , 2 , 4 and 5 below. |
| Beta‐blocker (any dose) | ‐4.20 (‐8.12 to ‐0.28) | 140 | ⊕⊝⊝⊝ Very low | Refer 1 to 5 below. |
| Calcium channel blocker (any dose) | ‐0.62 (‐2.97 to 1.73) | 133 | ⊕⊝⊝⊝ | Refer 1 to 5 below. |
| Beta‐blocker/thiazide combination (any dose) Mean duration of 10 weeks | ‐4.40 (‐8.99 to 0.19) | 94 | ⊕⊝⊝⊝ | Refer 1 to 5 below. |
| *The basis for the assumed risk (e.g. the median control group risk across studies) is provided in footnotes. The corresponding risk (and its 95% confidence interval) is based on the assumed risk in the comparison group and the relative effect of the intervention (and its 95% CI). | ||||
| GRADE Working Group grades of evidence Comments: 1. Evidence based on only one study. 2. “Industry‐funded study. Industry‐funded studies are at risk of over‐estimating effect size.” 3. “Wide confidence interval.” 4. “High risk of publication bias.” 5. “Unclear method of randomisation and allocation concealment”. | ||||
| Antihypertensive drug class compared to placebo for hypertension in children: diastolic blood pressure reduction | ||||
| Patient or population: children (from 1 to 18 years of age) with hypertension from primary or secondary causes | ||||
| Outcomes | Magnitude of reduction in diastolic blood pressure mmHg in treatment group minus placebo response Mean difference with 95% CI | No of participants | Quality of the evidence | Comments |
| Angiotensin receptor blocker (any dose) Mean duration of 4 weeks | ‐5.50 (‐9.62 to ‐1.38) | 240 | ⊕⊝⊝⊝ | Refer to 1, 2, 4 and 5 below. |
| Beta‐blocker (any dose) | ‐3.20 (‐7.12 to 0.72) | 140 | ⊕⊝⊝⊝ | Refer to 1 to 5 below. |
| Calcium channel blocker (any dose) | ‐1.86 (‐5.23 to 1.51) | 133 | ⊕⊝⊝⊝ | Refer to 1 to 5 below. |
| Beta‐blocker/thiazide combination (any dose) Mean duration of 10 weeks | ‐4.5 (‐8.26 to ‐0.74) | 94 | ⊕⊝⊝⊝ | Refer to 1 to 5 below. |
| *The basis for the assumed risk (e.g. the median control group risk across studies) is provided in footnotes. The corresponding risk (and its 95% confidence interval) is based on the assumed risk in the comparison group and the relative effect of the intervention (and its 95% CI). | ||||
| GRADE Working Group grades of evidence Comments: 1. Evidence based on only one study. 2. “Industry‐funded study. Industry‐funded studies are at risk of over‐estimating effect size.” 3. “Wide confidence interval.” 4. “High risk of publication bias.” 5. “Unclear method of randomisation and allocation concealment”. | ||||
| Angiotensin receptor blocker for hypertension in children: dose response in systolic blood pressure | ||||
| Patient or population: children (from 1 to 18 years of age) with hypertension from primary or secondary causes | ||||
| Outcomes | Magnitude of reduction in systolic blood pressure mmHg in treatment group at various dose comparisons Mean difference with 95% CI | No of participants | Quality of the evidence | Comments |
| Angiotensin receptor blocker >/= 6 years | ||||
| Angiotensin receptor blocker (high‐ versus low‐dose) | ‐4.16 (‐5.47 to ‐2.86) | 418 (5 studies) | ⊕⊕⊝⊝ | Refer to 1 and 3 below. |
| Angiotensin receptor blocker (high‐ versus medium‐dose) | ‐0.46 (‐2.44 to 1.53) | 237 (3 studies) | ⊕⊝⊝⊝ | Refer to 1 to 3 below. |
| Angiotensin receptor blocker (medium‐ versus low‐dose) | ‐3.13 (‐5.43 to ‐0.83) | 160 (3 studies) | ⊕⊝⊝⊝ | Refer to 1 and 3 below. |
| Angiotensin receptor blocker < 6 years | ||||
| Angiotensin receptor blocker (high‐ versus low‐dose) | ‐3.01 (‐8.79 to 2.76) | 67 (2 studies) | ⊕⊝⊝⊝ Very Low | Refer to 1 to 3 below. |
| Angiotensin receptor blocker (high‐ versus medium‐dose) | ‐1.76 (‐4.80 to 1.29) | 67 (2 studies) | ⊕⊝⊝⊝ Very Low | Refer to 1 to 3 below. |
| Angiotensin receptor blocker (medium‐ versus low‐dose) | ‐1.32 (‐4.54 to 1.90) | 50 (2 studies) | ⊕⊝⊝⊝ Very Low | Refer to 1 to 3 below. |
| *The basis for the assumed risk (e.g. the median control group risk across studies) is provided in footnotes. The corresponding risk (and its 95% confidence interval) is based on the assumed risk in the comparison group and the relative effect of the intervention (and its 95% CI). | ||||
| GRADE Working Group grades of evidence Comments: 1. “Industry‐funded study. Industry‐funded studies are at risk of over‐estimating effect size.” 2. “Wide confidence interval.” 3. “Unclear method of randomisation and allocation concealment in some studies”. | ||||
| Angiotensin receptor blocker for hypertension in children: dose response in diastolic blood pressure | ||||
| Patient or population: children (from 1 to 18 years of age) with hypertension from primary or secondary causes | ||||
| Outcomes | Magnitude of reduction in diastolic blood pressuremmHg in treatment group at various dose comparisons Mean difference with 95% CI | No of participants | Quality of the evidence | Comments |
| Angiotensin receptor blocker >/= 6 years | ||||
| High‐ versus low‐dose | ‐3.48 (‐5.00 to ‐1.95) | 418 (5 studies) | ⊕⊕⊝⊝ | Evidence based on 5 reasonable quality studies. Refer to comments 1 and 3. |
| High‐ versus medium‐dose | ‐0.59 (‐2.49 to 1.32) | 237 (3 studies) | ⊕⊝⊝⊝ | Refer to comments 1 to 3. |
| Medium‐ versus low‐dose | ‐3.04 (‐5.67to ‐0.40) | 160 (3 studies) | ⊕⊝⊝⊝ | Refer to comments 1 and 3. |
| Angiotensin receptor blocker < 6 years | ||||
| High‐ versus low‐dose | ‐2.85 (‐8.63 to 2.92) | 67 (2 studies) | ⊕⊝⊝⊝ Very low | Refer to comments 1 to 3. |
| High‐ versus medium‐dose | ‐0.56 (‐4.42 to 3.29) | 67 (2 studies) | ⊕⊝⊝⊝ Very low | Refer to comments 1 to 3. |
| Medium‐ versus low‐dose | ‐1.31 (‐3.74 to 1.12) | 50 (2 studies) | ⊕⊝⊝⊝ Very low | Refer to comments 1 to 3. |
| *The basis for the assumed risk (e.g. the median control group risk across studies) is provided in footnotes. The corresponding risk (and its 95% confidence interval) is based on the assumed risk in the comparison group and the relative effect of the intervention (and its 95% CI). | ||||
| GRADE Working Group grades of evidence Comments: 1. “Industry‐funded study. Industry‐funded studies are at risk of over‐estimating effect size.” 2. “Wide confidence interval.” 3. “Unclear method of randomisation and allocation concealment in some studies”. | ||||
| Angiotensin converting enzyme inhibitor for hypertension in children: dose response in systolic blood pressure | ||||
| Patient or population: children (from 1 to 18 years of age) with hypertension from primary or secondary causes | ||||
| Outcomes | Magnitude of reduction in systolic blood pressure mmHg in treatment group at various dose comparisons Mean difference with 95% CI | No of participants | Quality of the evidence | Comments |
| Angiotensin‐converting enzyme inhibitor | ||||
| High‐ versus low‐dose | ‐5.20 (‐10.46 to 0.06) | 187 (3 studies) | ⊕⊝⊝⊝ Very Low | Refer to 1 to 3 below. |
| High‐ versus medium‐ dose | ‐2.72 (‐5.83 to 0.40) | 187 (3 studies) | ⊕⊝⊝⊝ Very Low | Refer to 1 to 3 below. |
| Medium‐ versus low‐dose | ‐2.01 (‐6.07 to 2.05) | 139 (3 studies) | ⊕⊝⊝⊝ Very Low | Refer to 1 to 3 below. |
| *The basis for the assumed risk (e.g. the median control group risk across studies) is provided in footnotes. The corresponding risk (and its 95% confidence interval) is based on the assumed risk in the comparison group and the relative effect of the intervention (and its 95% CI). | ||||
| GRADE Working Group grades of evidence Comments: 1. “Industry‐funded study. Industry‐funded studies are at risk of over‐estimating effect size.” 2. “Wide confidence interval.” 3. “Unclear method of randomisation and allocation concealment in some studies”. | ||||
| Angiotensin converting enzyme inhibitor for hypertension in children: dose response in diastolic blood pressure | ||||
| Patient or population: children (from 1 to 18 years of age) with hypertension from primary or secondary causes | ||||
| Outcomes | Magnitude of reduction in diastolic blood pressuremmHg in treatment group at various dose comparisons Mean difference with 95% CI | No of participants | Quality of the evidence | Comments |
| High‐ versus low‐dose | ‐5.81 (‐11.87 to 0.26) | 187 (3 studies) | ⊕⊝⊝⊝ Very Low | Refer comments 1 to 3. |
| High‐ versus medium‐dose | ‐4.31 (‐8.59 to ‐0.03) | 187 (3 studies) | ⊕⊝⊝⊝ Very Low | Refer comments 1 to 3. |
| Medium‐ versus low‐dose | ‐0.46 (‐2.19 to 1.27) | 139 (3 studies) | ⊕⊝⊝⊝ Very Low | Refer comments 1 to 3. |
| *The basis for the assumed risk (e.g. the median control group risk across studies) is provided in footnotes. The corresponding risk (and its 95% confidence interval) is based on the assumed risk in the comparison group and the relative effect of the intervention (and its 95% CI). | ||||
| GRADE Working Group grades of evidence Comments: 1. “Industry‐funded study. Industry‐funded studies are at risk of over‐estimating effect size.” 2. “Wide confidence interval.” 3. “Unclear method of randomisation and allocation concealment in some studies”. | ||||
| Calcium channel blocker for hypertension in children: dose response in systolic and diastolic blood pressure | ||||
| Patient or population: children (from 1 to 18 years of age) with hypertension from primary or secondary causes | ||||
| Outcomes | Magnitude of reduction in systolic blood pressure mmHg in treatment group at various dose comparisons Mean difference with 95% CI | No of participants | Quality of the evidence | Comments |
| High vs low dose Systolic blood pressure | ‐1.7 (‐4.43 to 1.03) | 141 (1 study) | ⊕⊝⊝⊝ Very Low | Refer to 1 to 5 below. |
| High vs low dose Diastolic blood pressure | ‐0.70 (‐2.63 to 1.29) | 141 (1 study) | ⊕⊝⊝⊝ Very Low | Refer comments from 1 to 5. Only 2 doses were studied. Dose was not based on child's weight. |
| *The basis for the assumed risk (e.g. the median control group risk across studies) is provided in footnotes. The corresponding risk (and its 95% confidence interval) is based on the assumed risk in the comparison group and the relative effect of the intervention (and its 95% CI). | ||||
| GRADE Working Group grades of evidence Comments: 1. Evidence based on only one study. 2. “Industry‐funded study. Industry‐funded studies are at risk of over‐estimating effect size.” 3. “Wide confidence interval.” 4. “High risk of publication bias.” 5. “Unclear method of randomisation and allocation concealment”. | ||||
| Study | n | Systolic blood pressure: | SD | 95% CI | Diastolic blood pressure: | SD | 95% CI | |
| Angiotensin receptor blocker | ||||||||
| Trachtman 2008 (candesartan) | ||||||||
| Low (0.05 mg/kg) | 69 | ‐8.50 | 8.00 | ‐10.39 to ‐6.61 | ‐5.30 | 9.1 | ‐7.45 to ‐3.15 | |
| Medium (0.2 mg/kg) | 68 | ‐10.80 | 9.60 | ‐13.08 to ‐8.52 | ‐7.60 | 10.2 | ‐10.02 to ‐5.18 | |
| High (0.4 mg/kg) | 68 | ‐11.30 | 10.80 | ‐13.87 to ‐8.73 | ‐7.00 | 9.9 | ‐9.35 to ‐4.65 | |
| Placebo | 35 | ‐3.80 | 7.80 | ‐6.38 to ‐1.22 | ‐1.30 | 11.5 | ‐5.11 to 2.51 | |
| Wells 2010 (telmisartan) | ||||||||
| Low (1 mg/kg) | 28 | ‐9.00 | 7.80 | ‐6.10 to ‐11.90 | ‐7.70 | 9.60 | ‐4.10 to ‐11.30 | |
| High (2 mg/kg) | 31 | ‐13.00 | 8.70 | ‐9.90 to ‐16.10 | ‐7.80 | 8.10 | ‐4.90 to ‐10.70 | |
| Placebo | 14 | ‐4.70 | 10.70 | +0.90 to ‐10.30 | ‐2.90 | 7.60 | +1.10 to ‐6.90 | |
| Beta‐blocker | ||||||||
| Batisky 2007 (metoprolol) | ||||||||
| Low (0.2 mg/kg) | 45 | ‐5.20 | 8.70 | ‐7.70 to ‐2.60 | ‐3.10 | 8.90 | ‐5.70 to ‐0.50 | |
| Medium (1 mg/kg) | 23 | ‐7.70 | 8.60 | ‐11.30 to ‐4.00 | ‐4.90 | 8.90 | ‐8.60 to ‐1.30 | |
| High (2 mg/kg) | 49 | ‐6.30 | 9.00 | ‐8.70 to ‐3.80 | ‐7.50 | 8.90 | ‐10.00 to ‐5.00 | |
| Placebo | 23 | ‐1.90 | 8.90 | ‐5.50 to 1.80 | ‐2.10 | 8.80 | ‐5.70 to 1.50 | |
| Combination | ||||||||
| Sorof 2002 (bisoprolol/hydrochlorothiazide) | ||||||||
| Bisoprolol 10 mg/hydrochlorothiazide 6.25 mg | 62 | ‐9.30 | 11.81 | ‐12.24 to ‐6.36 | ‐7.20 | 9.45 | ‐9.55 to ‐4.85 | |
| Placebo | 32 | ‐4.90 | 10.18 | ‐8.43 to ‐1.37 | ‐2.70 | 8.49 | ‐5.64 to 0.24 | |
| Calcium channel blocker | ||||||||
| Trachtman 2003 (felodipine extended‐release) | Placebo corrected | Placebo corrected | ||||||
| Low (2.5 mg) | 33 | ‐0.71 | 11.99 | ‐4.80 to 3.38 | ‐2.07 | 13.94 | ‐6.82 to 2.69 | |
| Medium (5 mg) | 34 | ‐0.06 | 11.80 | ‐4.60 to 3.33 | ‐4.64 | 13.79 | ‐9.18 to 0.09 | |
| High (10 mg) | 31 | ‐1.13 | 11.86 | ‐5.30 to 3.05 | +1.31 | 13.73 | ‐3.56 to 6.11 | |
| CI: confidence interval; SD: standard deviation. All doses mentioned are: per day | ||||||||
| Study | n | Systolic blood pressure: | SD | 95% CI | Diastolic blood pressure: | SD | 95% CI |
| ≥ 6 years of age | |||||||
| Shahinfar 2005 (losartan) | |||||||
| Low (0.07 mg/kg) | 70 | ‐4.40 | 7.60 | ‐6.20 to ‐2.60 | ‐6.00 | 7.60 | ‐7.80 to ‐4.20 |
| Medium (0.75 mg/kg) | 40 | ‐10.00 | 9.10 | ‐12.90 to ‐7.10 | ‐11.70 | 9.10 | ‐14.60 to ‐8.80 |
| High (1.44 mg/kg) | 64 | ‐8.60 | 9.50 | ‐11.00 to ‐6.30 | ‐12.20 | 8.90 | ‐14.40 to ‐10.00 |
| Wells 2011 (valsartan) | |||||||
| Low (0.4 mg/kg) | 102 | ‐7.90 | 10.40 | ‐9.92 to ‐5.88 | ‐4.60 | 11.00 | ‐6.72 to ‐2.48 |
| Medium (1.3 mg/kg) | 52 | ‐9.60 | 9.10 | ‐12.07 to ‐7.13 | ‐5.80 | 8.90 | ‐8.22 to ‐3.38 |
| High (2.7 mg/kg) | 105 | ‐11.50 | 11.20 | ‐13.64 to ‐9.36 | ‐7.40 | 9.50 | ‐9.22 to ‐5.58 |
| Hazan 2010a* (olmesartan) | |||||||
| Low (2.5/5 mg) | 95 | ‐7.80 | 9.18 | ‐9.66 to ‐5.94 | ‐5.50 | 8.06 | ‐7.15 to ‐3.89 |
| High (20/40 mg) | 95 | ‐12.60 | 10.15 | ‐14.65 to ‐10.55 | ‐9.50 | 9.76 | ‐11.47 to ‐7.53 |
| Hazan 2010b* (olmesartan) | |||||||
| Low (2.5/5 mg) | 56 | ‐4.70 | 11.48 | ‐7.71 to ‐1.69 | ‐3.50 | 8.84 | ‐1.18 to ‐5.82 |
| High (20/40 mg) | 56 | ‐10.70 | 9.26 | ‐13.13 to ‐8.27 | ‐7.60 | 8.17 | ‐5.46 to ‐9.74 |
| BMS 2005 (irbesartan) | |||||||
| Low (0.5 mg/kg) | 106 | ‐11.7 | ‐ | ‐ | ‐3.80 | ‐ | ‐ |
| Medium (1.5 mg/kg) | 106 | ‐9.30 | ‐ | ‐ | ‐3.20 | ‐ | ‐ |
| High (4.5 mg/kg) | 106 | ‐13.30 | ‐ | ‐ | ‐6.60 | ‐ | ‐ |
| < 6 years of age | |||||||
| Schaefer 2010 (candesartan) | |||||||
| Low (0.05 mg/kg) | 29 | ‐6.00 | 9.40 | ‐9.42 to ‐2.58 | ‐5.20 | 6.70 | ‐7.64 to ‐2.76 |
| Medium (0.2 mg/kg) | 32 | ‐8.90 | 9.20 | ‐12.09 to ‐5.71 | ‐7.90 | 12.90 | ‐12.37 to ‐3.43 |
| High (0.4 mg/kg) | 32 | ‐12.10 | 8.30 | ‐14.98 to ‐9.22 | ‐11.10 | 9.20 | ‐14.29 to ‐7.91 |
| Flynn 2008 (valsartan) | |||||||
| Low (5/10 mg) | 37 | ‐8.40 | 8.44 | ‐11.12 to ‐5.68 | ‐5.50 | 6.06 | ‐7.45 to ‐3.55 |
| Medium (20/40 mg) | 18 | ‐8.30 | 7.63 | ‐11.82 to ‐4.78 | ‐6.40 | 4.23 | ‐8.35 to ‐4.45 |
| High (40/80 mg) | 35 | ‐8.60 | 7.55 | ‐11.10 to ‐6.10 | ‐5.50 | 8.47 | ‐8.31 to ‐2.69 |
| Webb 2013 (losartan) | |||||||
| Low (0.1 mg/kg) | 33 | ‐7.30 | ‐ | ‐ | ‐8.20 | ‐ | ‐ |
| Medium (0.3 mg/kg) | 34 | ‐7.60 | ‐ | ‐ | ‐5.10 | ‐ | ‐ |
| High (0.7 mg/kg) | 32 | ‐6.70 | ‐ | ‐ | ‐6.70 | ‐ | ‐ |
| *Hazan 2010 study stratified study population into 2 cohorts (cohort A, 62% white; cohort B, 100% black). Cohort A was termed Hazan 2010a and Cohort B was termed Hazan 2010b. All doses mentioned are per day. CI: confidence interval; SD: standard deviation | |||||||
| Study | n | Systolic blood pressure: | SD | 95% CI | Diastolic blood pressure: | SD | 95% CI |
| Angiotensin‐converting enzyme inhibitors | |||||||
| Wells 2002 (enalapril) | |||||||
| Low (0.02 mg/kg) | 30 | ‐7.10 | 9.30 | ‐10.60 to ‐3.60 | ‐6.30 | 7.80 | ‐9.20 to ‐3.40 |
| Medium (0.08 mg/kg) | 29 | ‐6.60 | 10.10 | ‐10.40 to ‐2.80 | ‐8.90 | 8.70 | ‐12.20 to ‐5.60 |
| High (0.58 mg/kg) | 50 | ‐12.50 | 11.70 | ‐15.80 to ‐9.20 | ‐14.90 | 8.70 | ‐17.40 to ‐12.40 |
| Li 2004 (fosinopril) | |||||||
| Low (0.1 mg/kg) | 73 | ‐10.90 | 10.25 | ‐13.20 to ‐8.60 | ‐4.50 | 6.84 | ‐6.00 to ‐3.00 |
| Medium (0.3 mg/kg) | 86 | ‐11.30 | 10.25 | ‐13.40 to ‐9.10 | ‐4.20 | 6.49 | ‐5.70 to ‐2.80 |
| High (0.6 mg/kg) | 79 | ‐11.90 | 9.78 | ‐14.20 to ‐9.70 | ‐5.10 | 7.11 | ‐6.60 to ‐3.60 |
| Soffer 2003 (lisinopril) | |||||||
| Low (0.02 mg/kg) | 33 | ‐5.40 | 9.90 | ‐9.00 to ‐1.90 | ‐7.60 | 9.30 | ‐10.90 to ‐4.30 |
| Medium (0.07 mg/kg) | 24 | ‐12.10 | 9.10 | ‐16.00 to ‐8.30 | ‐9.30 | 8.70 | ‐13.00 to ‐5.70 |
| High (0.61 mg/kg) | 58 | ‐15.20 | 12.10 | ‐18.40 to ‐12.00 | ‐16.40 | 11.70 | ‐19.50 to 13.30 |
| Selective aldosterone receptor blocker | |||||||
| Li 2011 (eplerenone) | |||||||
| Low (25 mg) | 58 | ‐7.66 | ‐ | ‐ | ‐3.80 | ‐ | ‐ |
| Medium (50 mg) | 62 | ‐7.84 | ‐ | ‐ | ‐2.70 | ‐ | ‐ |
| High (100 mg) | 184 | ‐7.99 | ‐ | ‐ | ‐3.05 | ‐ | ‐ |
| Calcium channel blocker | |||||||
| Flynn 2004 (amlodipine) | |||||||
| Low (2.5 mg) | 127 | ‐7.3 | 11.4 | ‐9.3 to ‐5.3 | ‐3.7 | 8.3 | ‐5.1 to ‐2.3 |
| High (5 mg) | 141 | ‐9.0 | 11.4 | ‐10.9 to ‐7.1 | ‐4.4 | 8.3 | ‐5.8 to ‐3.0 |
| *Angiotensin receptor blocker versus angiotensin‐converting enzyme inhibitor | |||||||
| Schaefer 2011 | |||||||
| Valsartan (80/160/320 mg) | 148 | ‐15.40 | ‐ | ‐ | ‐9.40 | ‐ | ‐ |
| Enalapril (10/20/40 mg) | 148 | ‐14.10 | ‐ | ‐ | ‐8.50 | ‐ | ‐ |
| Calcium channel blockers versus angiotensin receptor blockers | |||||||
| Webb 2010 (amlodipine versuslosartan) | |||||||
| Amlodipine (0.05 to 0.2 mg/kg) | 30 | ‐0.10 | ‐ | ‐ | ‐0.80 | ‐ | ‐ |
| Losartan (0.7 to 1.4mg/kg) | 30 | ‐5.50 | ‐ | ‐ | ‐3.40 | ‐ | ‐ |
| Gartenmann 2003 (amlodipine versusirbesartan) | Median change from baseline | Range | Median change from baseline | Range | |||
| Amlodipine (20 to 40 kg: 5 to 10 mg; > 40 kg: 10 to 20 mg) | 11 | 12.00 | 10.00 to 14.00 | 7.00 | 5.00 to 10.00 | ||
| Irbesartan (20 to 40 kg: 75 to 150 mg; > 40 kg: 150 to 300 mg) | 13 | 13.00 | 9 to 16 | 9.00 | 7.00 to 11.00 | ||
| Alpha blocker versus diuretic, Falkner 1981 (clonidine versus hydrochlorothiazide) | |||||||
| Clonidine | Mean BP | SD | Mean BP | SD | |||
| Pre | 15 | 146 | 16.00 | 138 to 154 | 96 | 6.00 | 93 to 99 |
| Low (0.1 mg twice) | 136 | 13.00 | 129 to 143 | 89 | 8.00 | 85 to 93 | |
| High (0.2 mg twice) | 136 | 8.00 | 132 to 140 | 88 | 5.00 | 85 to 91 | |
| Hydrochlorothiazide | |||||||
| Pre | 15 | 145 | 6.00 | 142 to 148 | 97 | 8.00 | 93 to 101 |
| Low (25 mg twice) | 139 | 10.00 | 134 to 144 | 94 | 6.00 | 91 to 97 | |
| High (50 mg twice) | 135 | 11.00 | 129 to 141 | 93 | 8.00 | 89 to 97 | |
| All doses mentioned are per day | |||||||
| BP: blood pressure; CI: confidence interval; SD: standard deviation | |||||||
| Drugs | Common side effects | Less common side effects |
| Angiotensin‐converting enzyme inhibitor | Headache (20.1%), nasopharyngitis (9.6%), cough (9.1%) with fosinopril Dizziness was the most common side effect in the enalapril study (4 patients, followed by cough (3 patients) and headache (2 patients). No angioedema reported in any of the 3 trials | Low‐dose lisinopril ‐ 1 patient developed leucopenia and another patient had elevated creatinine. High‐dose lisinopril: 1 patient developed hyperkalaemia and another had elevated creatinine In the fosinopril study: elevated creatinine was the most frequent lab abnormality (drug versus placebo 8.9% versus 4.1%). All elevations were transient and did not exceed the upper limit of normal None of the patients in the enalapril study experienced renal failure or hyperkalaemia |
| Angiotensin receptor blocker in > 6 years | Headache was reported in 33.2% of children in the valsartan study and in 5.4% to 14.7% of children in the olmesartan study The most common side effects in the candesartan trial were headache, upper respiratory infection, dizziness, cough and sore throat The olmesartan study reported headache (7.4%) and pharyngo‐laryngeal pain (6.3%) in the low‐dose group and headache (14.7%) and dizziness (9.5%) in the high‐dose group among the mixed racial cohort. Among the black patients, headache (5.4%) in the low‐dose and headache (8.9%) and toothache (3.6%) in high‐dose group were reported | In the valsartan study, 10% of patients had elevated creatinine and 4% patients had hyperkalaemia at some point during the study In the candesartan trial, 8 patients discontinued treatment. The reasons for discontinuation were hypotension, arm fracture, dizziness, headache, low white cell count and progression of underlying renal disease (2 patients) 2 patients in the mixed racial group in the olmesartan study discontinued treatment (1 patient because of hypertension and other due to hypoaesthesia) |
| Angiotensin receptor blocker < 6 years | Angiotensin receptor blocker was well tolerated in this age group with a low incidence of side effects and no adverse effect on growth | 2 significant adverse events were reported in the candesartan study (Schaefer 2010). 1 event was a death related to acute on chronic renal failure provoked by diarrhoea‐induced hypovolaemia and the second event was a vaso‐occlusive event which occurred in a child with nephrotic syndrome. The authors report that both events were not directly attributed to angiotensin receptor blocker use 1 participant each had pruritus and rash, decreased appetite and blurred vision in phase 1 of the valsartan study. In phase 2, 1 patient had headache and 1 hypertriglyceridaemia |
| Beta‐blocker | Headache (30%), upper respiratory infection (10%) and cough (19%) in the metoprolol study | Fatigue (9%) and dizziness (6%). 5 patients discontinued the metoprolol study in the open‐label period because of an adverse event (1 patient each for fatigue, nightmares, anxiety, dizziness and asthma) |
| Beta‐blocker + diuretic | No significant adverse effects reported |
|
| Calcium channel blocker | Headache (33%), respiratory infection (12%) and nausea (10%) were the common adverse events among children on extended‐release felodipine | Pedal oedema was noted in 2% of patients in the felodipine study and in ˜3.1% to 4.3% patients on amlodipine |
| Centrally acting α blocker versus diuretic | 14 of the 15 hydrochlorothiazide‐treated participants had a reduction in serum potassium. Symptomatic hypokalaemia in 4 participants requiring potassium supplementation in the hydrochlorothiazide group | Drowsiness and dry mouth in 1 patient on clonidine |
| Outcome or subgroup title | No. of studies | No. of participants | Statistical method | Effect size |
| 1 Systolic blood pressure Show forest plot | 5 | Mean Difference (Random, 95% CI) | Totals not selected | |
| 1.1 ARB (any dose) | 1 | Mean Difference (Random, 95% CI) | 0.0 [0.0, 0.0] | |
| 1.2 ARB (high‐dose versus placebo) | 2 | Mean Difference (Random, 95% CI) | 0.0 [0.0, 0.0] | |
| 1.3 ARB (medium‐dose versus placebo) | 1 | Mean Difference (Random, 95% CI) | 0.0 [0.0, 0.0] | |
| 1.4 ARB (low‐dose versus placebo) | 2 | Mean Difference (Random, 95% CI) | 0.0 [0.0, 0.0] | |
| 1.5 BB (any dose) | 1 | Mean Difference (Random, 95% CI) | 0.0 [0.0, 0.0] | |
| 1.6 BB (high‐dose versus placebo) | 1 | Mean Difference (Random, 95% CI) | 0.0 [0.0, 0.0] | |
| 1.7 BB (medium‐dose versus placebo) | 1 | Mean Difference (Random, 95% CI) | 0.0 [0.0, 0.0] | |
| 1.8 BB (low‐dose versus placebo) | 1 | Mean Difference (Random, 95% CI) | 0.0 [0.0, 0.0] | |
| 1.9 CCB (any dose) | 1 | Mean Difference (Random, 95% CI) | 0.0 [0.0, 0.0] | |
| 1.10 CCB (high‐dose versus placebo) | 1 | Mean Difference (Random, 95% CI) | 0.0 [0.0, 0.0] | |
| 1.11 CCB (medium‐dose versus placebo) | 1 | Mean Difference (Random, 95% CI) | 0.0 [0.0, 0.0] | |
| 1.12 CCB (low‐dose versus placebo) | 1 | Mean Difference (Random, 95% CI) | 0.0 [0.0, 0.0] | |
| 1.13 BB/thiazide combination (any dose) versus placebo | 1 | Mean Difference (Random, 95% CI) | 0.0 [0.0, 0.0] | |
| 2 Diastolic blood pressure Show forest plot | 5 | Mean Difference (Random, 95% CI) | Totals not selected | |
| 2.1 ARB (any dose) | 1 | Mean Difference (Random, 95% CI) | 0.0 [0.0, 0.0] | |
| 2.2 ARB (high‐dose versus placebo) | 2 | Mean Difference (Random, 95% CI) | 0.0 [0.0, 0.0] | |
| 2.3 ARB (medium‐dose versus placebo) | 1 | Mean Difference (Random, 95% CI) | 0.0 [0.0, 0.0] | |
| 2.4 ARB (low‐dose versus placebo) | 2 | Mean Difference (Random, 95% CI) | 0.0 [0.0, 0.0] | |
| 2.5 BB (any dose) | 1 | Mean Difference (Random, 95% CI) | 0.0 [0.0, 0.0] | |
| 2.6 BB (high‐dose versus placebo) | 1 | Mean Difference (Random, 95% CI) | 0.0 [0.0, 0.0] | |
| 2.7 BB (medium‐dose versus placebo) | 1 | Mean Difference (Random, 95% CI) | 0.0 [0.0, 0.0] | |
| 2.8 BB (low‐dose versus placebo) | 1 | Mean Difference (Random, 95% CI) | 0.0 [0.0, 0.0] | |
| 2.9 CCB (any dose) | 1 | Mean Difference (Random, 95% CI) | 0.0 [0.0, 0.0] | |
| 2.10 CCB (high‐dose versus placebo) | 1 | Mean Difference (Random, 95% CI) | 0.0 [0.0, 0.0] | |
| 2.11 CCB (medium‐dose versus placebo) | 1 | Mean Difference (Random, 95% CI) | 0.0 [0.0, 0.0] | |
| 2.12 CCB (low‐dose versus placebo) | 1 | Mean Difference (Random, 95% CI) | 0.0 [0.0, 0.0] | |
| 2.13 BB/thiazide diuretic (any dose) | 1 | Mean Difference (Random, 95% CI) | 0.0 [0.0, 0.0] | |
| Outcome or subgroup title | No. of studies | No. of participants | Statistical method | Effect size |
| 1 Systolic blood pressure Show forest plot | 12 | Mean Difference (IV, Random, 95% CI) | Subtotals only | |
| 1.1 ARB (high‐ versus low‐dose), age ≥ 6 years | 6 | 837 | Mean Difference (IV, Random, 95% CI) | ‐4.16 [‐5.47, ‐2.86] |
| 1.2 ARB (high‐ versus medium‐dose), age ≥ 6 years | 3 | 397 | Mean Difference (IV, Random, 95% CI) | ‐0.46 [‐2.44, 1.53] |
| 1.3 ARB (medium‐ versus low‐dose), age ≥ 6 years | 3 | 401 | Mean Difference (IV, Random, 95% CI) | ‐3.13 [‐5.43, ‐0.83] |
| 1.4 ARB (high‐ versus low‐dose), age < 6 years | 2 | 133 | Mean Difference (IV, Random, 95% CI) | ‐3.01 [‐8.79, 2.76] |
| 1.5 ARB (high‐ versus medium‐dose), age < 6 years | 2 | 117 | Mean Difference (IV, Random, 95% CI) | ‐1.76 [‐4.80, 1.29] |
| 1.6 ARB (medium‐ versus low‐dose), age < 6 years | 2 | 116 | Mean Difference (IV, Random, 95% CI) | ‐1.32 [‐4.54, 1.90] |
| 1.7 ACEI (high‐ versus low‐dose) | 3 | 323 | Mean Difference (IV, Random, 95% CI) | ‐5.20 [‐10.46, 0.06] |
| 1.8 ACEI (high‐ versus medium‐dose) | 3 | 326 | Mean Difference (IV, Random, 95% CI) | ‐2.72 [‐5.83, 0.40] |
| 1.9 ACEI (medium‐ versus low‐dose) | 3 | 275 | Mean Difference (IV, Random, 95% CI) | ‐2.01 [‐6.07, 2.05] |
| 1.10 CCB (high‐ versus low‐dose) | 1 | 268 | Mean Difference (IV, Random, 95% CI) | ‐1.70 [‐4.43, 1.03] |
| 2 Diastolic blood pressure Show forest plot | 12 | Mean Difference (IV, Random, 95% CI) | Subtotals only | |
| 2.1 ARB (high‐ versus low‐dose), age ≥ 6 years | 6 | 837 | Mean Difference (IV, Random, 95% CI) | ‐3.48 [‐5.00, ‐1.95] |
| 2.2 ARB (high‐ versus medium‐dose), age ≥ 6 years | 3 | 397 | Mean Difference (IV, Random, 95% CI) | ‐0.59 [‐2.49, 1.32] |
| 2.3 ARB (medium‐ versus low‐dose), age ≥ 6 years | 3 | 401 | Mean Difference (IV, Random, 95% CI) | ‐3.04 [‐5.67, ‐0.40] |
| 2.4 ARB (high‐ versus low‐dose), age < 6 years | 2 | 133 | Mean Difference (IV, Random, 95% CI) | ‐2.85 [‐8.63, 2.92] |
| 2.5 ARB (high‐ versus medium‐dose), age < 6 years | 2 | 117 | Mean Difference (IV, Random, 95% CI) | ‐0.56 [‐4.42, 3.29] |
| 2.6 ARB (medium‐ versus low‐dose), age < 6 years | 2 | 116 | Mean Difference (IV, Random, 95% CI) | ‐1.31 [‐3.74, 1.12] |
| 2.7 ACEI (high‐ versus low‐dose) | 3 | 323 | Mean Difference (IV, Random, 95% CI) | ‐5.81 [‐11.87, 0.26] |
| 2.8 ACEI (high‐ versus medium‐dose) | 3 | 326 | Mean Difference (IV, Random, 95% CI) | ‐4.31 [‐8.59, ‐0.03] |
| 2.9 ACEI (medium‐ versus low‐dose) | 3 | 275 | Mean Difference (IV, Random, 95% CI) | ‐0.46 [‐2.19, 1.27] |
| 2.10 CCB (high‐ versus low‐dose) | 1 | 268 | Mean Difference (IV, Random, 95% CI) | ‐0.70 [‐2.69, 1.29] |