Intervenciones farmacológicas para la hipertensión en niños
Resumen
Antecedentes
La hipertensión es un factor de riesgo principal de accidente cerebrovascular, arteriopatía coronaria y daño renal en adultos. Faltan datos sobre las secuelas a largo plazo de la hipertensión persistente en niños, pero se sabe que los niños con hipertensión tienen pruebas de daño de órganos diana y están en riesgo de hipertensión hasta la edad adulta. Actualmente está subiendo la prevalencia de la hipertensión en niños, con más probabilidad debido a un ascenso concurrente en las tasas de obesidad. En niños con hipertensión, las medidas no farmacológicas a menudo se recomiendan como tratamiento de primera línea, pero una proporción significativa de niños, con el tiempo, requerirá tratamiento farmacológico para reducir la presión arterial, especialmente los que presentan pruebas de daño de órganos diana en el momento de presentación o durante el seguimiento. No se realizó con anterioridad una revisión sistemática de los efectos de los antihipertensivos en niños.
Objetivos
Determinar los efectos relacionados con la dosis de diferentes clases de fármacos antihipertensivos en los casos en que la monoterapia se comparó con el placebo; el tratamiento de combinación se comparó con el placebo o con una única medicación; o en las comparaciones de diversas dosis dentro de la misma clase, en la presión arterial sistólica o diastólica (o ambas) en niños con hipertensión.
Métodos de búsqueda
Se hicieron búsquedas en el registro especializado del Grupo Cochrane de Hipertensión (Cochrane Hypertension Group), Registro Cochrane Central de Ensayos Controlados (Cochrane Central Register of Controlled Trials) (CENTRAL) (2013, número 9), Ovid MEDLINE (1946 hasta octubre 2013), Ovid EMBASE (1974 hasta octubre 2013) y en citas bibliográficas.
Criterios de selección
Los criterios de selección fueron deliberadamente amplios debido a que hay pocos ensayos clínicos en niños. Se incluyeron ensayos controlados aleatorios (ECA) de al menos dos semanas de duración que compararon los antihipertensivos como monoterapia o tratamiento de combinación con el placebo u otra medicación, o que compararon diferentes dosis de la misma medicación, en niños con hipertensión. La hipertensión se definió como una presión arterial promedio (sobre la base de un mínimo de tres lecturas) sistólica o diastólica (o ambas) en el percentil 95 o más para la edad, la altura y el sexo.
Obtención y análisis de los datos
Dos autores seleccionaron de forma independiente los estudios pertinentes, extrajeron los datos y evaluaron el riesgo de sesgo. Se resumieron los datos, siempre que fue posible, mediante un modelo de efectos aleatorios. La evaluación formal de heterogeneidad no fue posible debido a que los datos eran insuficientes.
Resultados principales
Un total de 21 ensayos evaluaron los antihipertensivos de diversas clases de fármacos en 3454 niños hipertensos con períodos de seguimiento que variaron de tres a 24 semanas.Hubo cinco ECA que compararon un fármaco antihipertensivo directamente con el placebo; 12 ensayos de búsqueda de dosis, dos ensayos que compararon los bloqueadores de los canales de calcio con antagonistas de los receptores de angiotensina; un ensayo que comparó un alfabloqueante de acción central con un diurético; y un ensayo que comparó un inhibidor de la enzima convertidora de angiotensina con un antagonista de los receptores de angiotensina. No se identificó ningún ensayo aleatorio que evaluara la efectividad de los fármacos antihipertensivos en el daño de los órganos diana. Los ensayos eran de calidad variable y la mayoría fueron financiados por compañías farmacéuticas.
Entre los antagonistas de los receptores de la angiotensina, el candesartán (un ensayo, n = 240) en comparación con el placebo, redujo la presión arterial sistólica en 6,50 mmHg (intervalo de confianza [IC] del 95%: ‐9,44 a ‐3,56) y la presión arterial diastólica en 5,50 mmHg (IC del 95%: ‐9,62 a ‐1,38) (pruebas de baja calidad). Una alta dosis de telmisartán (un ensayo, n = 76) en comparación con el placebo redujo la presión arterial sistólica en ‐8,50 (IC del 95%: ‐13,79 a ‐3,21) pero no la presión arterial diastólica (‐4,80; IC del 95%: ‐9,50 a 0,10) (pruebas de baja calidad). Cuando se comparan los betabloqueantes (metoprolol, un ensayo, n = 140) con el placebo, la presión arterial sistólica se reduce significativamente en 4,20 mmHg (IC del 95%: ‐8,12 a ‐0,28), pero no la presión arterial diastólica (‐3,20 mmHg, IC del 95%: ‐7,12 a 0,72) (pruebas de baja calidad). Cuando se compara la combinación de betabloqueante y diurético (bisoprolol/hidroclorotiazida, un ensayo, n = 94) con el placebo, no se reduce significativamente la presión arterial sistólica (‐4,0 mmHg, IC del 95%: ‐8,99 a ‐0,19) pero tuvo un efecto en la presión arterial diastólica (‐4,50 mmHg, IC del 95%: ‐8,26 a ‐0,74) (pruebas de baja calidad). Los bloqueadores de los canales de calcio (felodipina de liberación prolongada, un ensayo, n = 133) no fueron efectivos para reducir la presión arterial sistólica (‐0,62 mmHg, IC del 95%: ‐2,97 a 1,73) o la presión arterial diastólica (‐1,86 mmHg, IC del 95%: ‐5,23 a 1,51) en comparación con el placebo. Además, no hubo ninguna dosis‐respuesta coherente observada en ninguna de las clases de fármacos. Los eventos adversos asociados a los antihipertensivos fueron principalmente leves e incluyeron cefaleas, mareos e infecciones de las vías respiratorias superiores.
Conclusiones de los autores
En términos generales, hay datos dispersos que informan la administración de antihipertensivos en niños, y los resultados presentados se limitan a la presión arterial y no al daño de órganos diana. Se dispone de un número suficiente de datos para el candesartán, y existen pruebas de baja calidad de un efecto de disminución moderada en la presión arterial. No se encontraron pruebas de una relación de dosis‐respuesta coherente para aumentar la dosis de los antagonistas de los receptores de la angiotensina, los bloqueadores de los canales de calcio o los antagonistas de la enzima convertidora de angiotensina. Todos los agentes parecen seguros, al menos a corto plazo.
PICO
Resumen en términos sencillos
Fármacos para la hipertensión en niños
La hipertensión (presión arterial elevada) aumenta el riesgo de cardiopatía, accidente cerebrovascular e insuficiencia renal. La prevalencia de la hipertensión en los niños está aumentando. Una proporción significativa de niños con hipertensión requiere medicación para reducir la presión arterial y el uso de fármacos aumentó significativamente durante los últimos años.
Esta revisión sistemática incluyó 21 ensayos con 3454 niños y evaluó diferentes fármacos para disminuir la presión arterial en niños con hipertensión. Estas pruebas se actualizaron a octubre de 2013. La mayoría de los ensayos fueron de duración muy corta con un promedio de siete semanas. Los estudios fueron de calidad variable y en su mayoría financiados por la industria. No todos los estudios compararon el efecto de la medicación en la disminución de la presión arterial con un placebo. Sólo se evaluaron unas pocas clases de fármacos comúnmente prescritos, y la mayoría tuvo un efecto moderado en la presión arterial, pero no se sabe si estos datos mejoran los resultados a largo plazo para los niños. Las dosis mayores de la medicación no dieron lugar a una mayor reducción de la presión arterial. Todos los fármacos estudiados eran seguros para su uso, al menos a corto plazo.
Authors' conclusions
Summary of findings
| Antihypertensive drug class compared to placebo for hypertension in children: systolic blood pressure reduction | ||||
| Patient or population: children (from 1 to 18 years of age) with hypertension from primary or secondary causes | ||||
| Outcomes | Magnitude of reduction in systolic blood pressuremmHg in treatment group minus placebo response Mean difference with 95% CI | No of participants | Quality of the evidence | Comments |
| Angiotensin receptor blocker (any dose) Mean duration of 4 weeks | ‐6.50 (‐9.44 to ‐3.56) | 240 | ⊕⊝⊝⊝ | Refer 1 , 2 , 4 and 5 below. |
| Beta‐blocker (any dose) | ‐4.20 (‐8.12 to ‐0.28) | 140 | ⊕⊝⊝⊝ Very low | Refer 1 to 5 below. |
| Calcium channel blocker (any dose) | ‐0.62 (‐2.97 to 1.73) | 133 | ⊕⊝⊝⊝ | Refer 1 to 5 below. |
| Beta‐blocker/thiazide combination (any dose) Mean duration of 10 weeks | ‐4.40 (‐8.99 to 0.19) | 94 | ⊕⊝⊝⊝ | Refer 1 to 5 below. |
| *The basis for the assumed risk (e.g. the median control group risk across studies) is provided in footnotes. The corresponding risk (and its 95% confidence interval) is based on the assumed risk in the comparison group and the relative effect of the intervention (and its 95% CI). | ||||
| GRADE Working Group grades of evidence Comments: 1. Evidence based on only one study. 2. “Industry‐funded study. Industry‐funded studies are at risk of over‐estimating effect size.” 3. “Wide confidence interval.” 4. “High risk of publication bias.” 5. “Unclear method of randomisation and allocation concealment”. | ||||
| Antihypertensive drug class compared to placebo for hypertension in children: diastolic blood pressure reduction | ||||
| Patient or population: children (from 1 to 18 years of age) with hypertension from primary or secondary causes | ||||
| Outcomes | Magnitude of reduction in diastolic blood pressure mmHg in treatment group minus placebo response Mean difference with 95% CI | No of participants | Quality of the evidence | Comments |
| Angiotensin receptor blocker (any dose) Mean duration of 4 weeks | ‐5.50 (‐9.62 to ‐1.38) | 240 | ⊕⊝⊝⊝ | Refer to 1, 2, 4 and 5 below. |
| Beta‐blocker (any dose) | ‐3.20 (‐7.12 to 0.72) | 140 | ⊕⊝⊝⊝ | Refer to 1 to 5 below. |
| Calcium channel blocker (any dose) | ‐1.86 (‐5.23 to 1.51) | 133 | ⊕⊝⊝⊝ | Refer to 1 to 5 below. |
| Beta‐blocker/thiazide combination (any dose) Mean duration of 10 weeks | ‐4.5 (‐8.26 to ‐0.74) | 94 | ⊕⊝⊝⊝ | Refer to 1 to 5 below. |
| *The basis for the assumed risk (e.g. the median control group risk across studies) is provided in footnotes. The corresponding risk (and its 95% confidence interval) is based on the assumed risk in the comparison group and the relative effect of the intervention (and its 95% CI). | ||||
| GRADE Working Group grades of evidence Comments: 1. Evidence based on only one study. 2. “Industry‐funded study. Industry‐funded studies are at risk of over‐estimating effect size.” 3. “Wide confidence interval.” 4. “High risk of publication bias.” 5. “Unclear method of randomisation and allocation concealment”. | ||||
| Angiotensin receptor blocker for hypertension in children: dose response in systolic blood pressure | ||||
| Patient or population: children (from 1 to 18 years of age) with hypertension from primary or secondary causes | ||||
| Outcomes | Magnitude of reduction in systolic blood pressure mmHg in treatment group at various dose comparisons Mean difference with 95% CI | No of participants | Quality of the evidence | Comments |
| Angiotensin receptor blocker >/= 6 years | ||||
| Angiotensin receptor blocker (high‐ versus low‐dose) | ‐4.16 (‐5.47 to ‐2.86) | 418 (5 studies) | ⊕⊕⊝⊝ | Refer to 1 and 3 below. |
| Angiotensin receptor blocker (high‐ versus medium‐dose) | ‐0.46 (‐2.44 to 1.53) | 237 (3 studies) | ⊕⊝⊝⊝ | Refer to 1 to 3 below. |
| Angiotensin receptor blocker (medium‐ versus low‐dose) | ‐3.13 (‐5.43 to ‐0.83) | 160 (3 studies) | ⊕⊝⊝⊝ | Refer to 1 and 3 below. |
| Angiotensin receptor blocker < 6 years | ||||
| Angiotensin receptor blocker (high‐ versus low‐dose) | ‐3.01 (‐8.79 to 2.76) | 67 (2 studies) | ⊕⊝⊝⊝ Very Low | Refer to 1 to 3 below. |
| Angiotensin receptor blocker (high‐ versus medium‐dose) | ‐1.76 (‐4.80 to 1.29) | 67 (2 studies) | ⊕⊝⊝⊝ Very Low | Refer to 1 to 3 below. |
| Angiotensin receptor blocker (medium‐ versus low‐dose) | ‐1.32 (‐4.54 to 1.90) | 50 (2 studies) | ⊕⊝⊝⊝ Very Low | Refer to 1 to 3 below. |
| *The basis for the assumed risk (e.g. the median control group risk across studies) is provided in footnotes. The corresponding risk (and its 95% confidence interval) is based on the assumed risk in the comparison group and the relative effect of the intervention (and its 95% CI). | ||||
| GRADE Working Group grades of evidence Comments: 1. “Industry‐funded study. Industry‐funded studies are at risk of over‐estimating effect size.” 2. “Wide confidence interval.” 3. “Unclear method of randomisation and allocation concealment in some studies”. | ||||
| Angiotensin receptor blocker for hypertension in children: dose response in diastolic blood pressure | ||||
| Patient or population: children (from 1 to 18 years of age) with hypertension from primary or secondary causes | ||||
| Outcomes | Magnitude of reduction in diastolic blood pressuremmHg in treatment group at various dose comparisons Mean difference with 95% CI | No of participants | Quality of the evidence | Comments |
| Angiotensin receptor blocker >/= 6 years | ||||
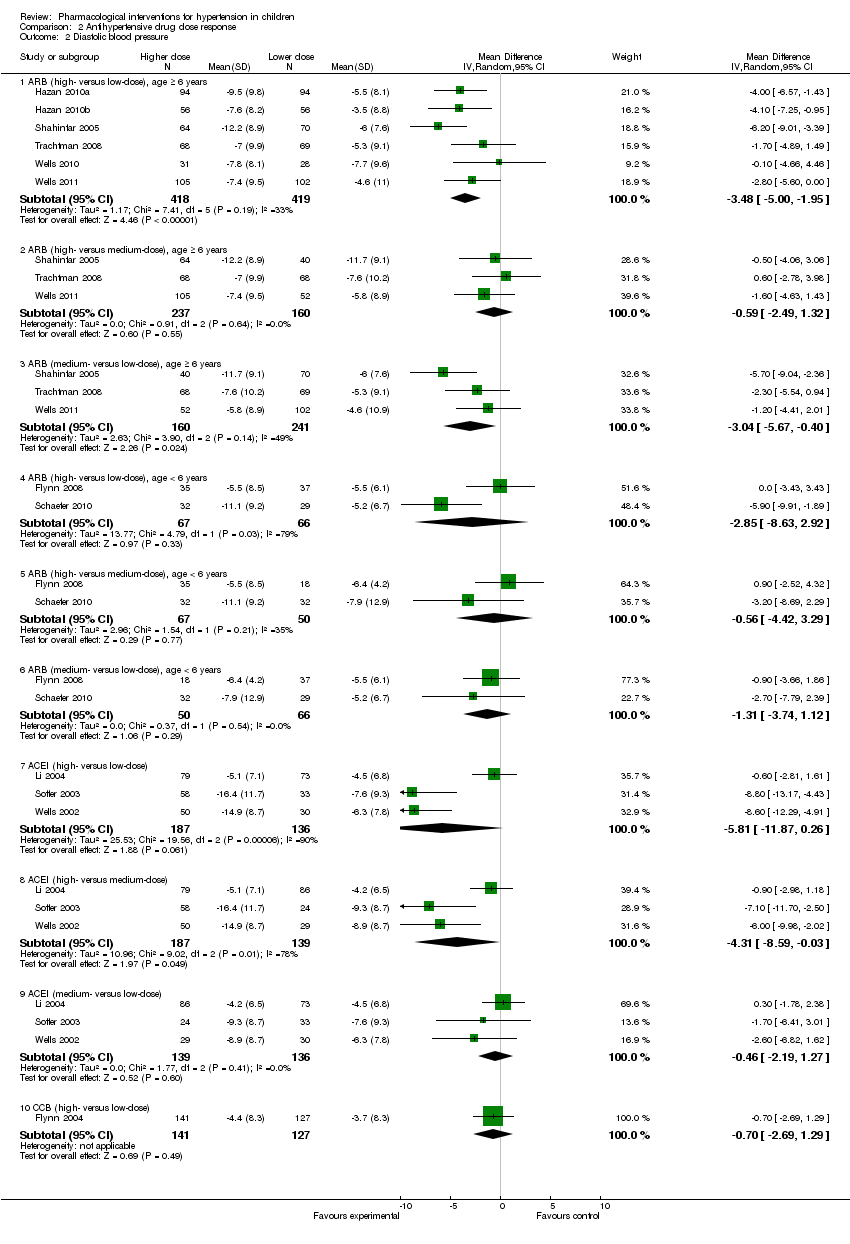
| High‐ versus low‐dose | ‐3.48 (‐5.00 to ‐1.95) | 418 (5 studies) | ⊕⊕⊝⊝ | Evidence based on 5 reasonable quality studies. Refer to comments 1 and 3. |
| High‐ versus medium‐dose | ‐0.59 (‐2.49 to 1.32) | 237 (3 studies) | ⊕⊝⊝⊝ | Refer to comments 1 to 3. |
| Medium‐ versus low‐dose | ‐3.04 (‐5.67to ‐0.40) | 160 (3 studies) | ⊕⊝⊝⊝ | Refer to comments 1 and 3. |
| Angiotensin receptor blocker < 6 years | ||||
| High‐ versus low‐dose | ‐2.85 (‐8.63 to 2.92) | 67 (2 studies) | ⊕⊝⊝⊝ Very low | Refer to comments 1 to 3. |
| High‐ versus medium‐dose | ‐0.56 (‐4.42 to 3.29) | 67 (2 studies) | ⊕⊝⊝⊝ Very low | Refer to comments 1 to 3. |
| Medium‐ versus low‐dose | ‐1.31 (‐3.74 to 1.12) | 50 (2 studies) | ⊕⊝⊝⊝ Very low | Refer to comments 1 to 3. |
| *The basis for the assumed risk (e.g. the median control group risk across studies) is provided in footnotes. The corresponding risk (and its 95% confidence interval) is based on the assumed risk in the comparison group and the relative effect of the intervention (and its 95% CI). | ||||
| GRADE Working Group grades of evidence Comments: 1. “Industry‐funded study. Industry‐funded studies are at risk of over‐estimating effect size.” 2. “Wide confidence interval.” 3. “Unclear method of randomisation and allocation concealment in some studies”. | ||||
| Angiotensin converting enzyme inhibitor for hypertension in children: dose response in systolic blood pressure | ||||
| Patient or population: children (from 1 to 18 years of age) with hypertension from primary or secondary causes | ||||
| Outcomes | Magnitude of reduction in systolic blood pressure mmHg in treatment group at various dose comparisons Mean difference with 95% CI | No of participants | Quality of the evidence | Comments |
| Angiotensin‐converting enzyme inhibitor | ||||
| High‐ versus low‐dose | ‐5.20 (‐10.46 to 0.06) | 187 (3 studies) | ⊕⊝⊝⊝ Very Low | Refer to 1 to 3 below. |
| High‐ versus medium‐ dose | ‐2.72 (‐5.83 to 0.40) | 187 (3 studies) | ⊕⊝⊝⊝ Very Low | Refer to 1 to 3 below. |
| Medium‐ versus low‐dose | ‐2.01 (‐6.07 to 2.05) | 139 (3 studies) | ⊕⊝⊝⊝ Very Low | Refer to 1 to 3 below. |
| *The basis for the assumed risk (e.g. the median control group risk across studies) is provided in footnotes. The corresponding risk (and its 95% confidence interval) is based on the assumed risk in the comparison group and the relative effect of the intervention (and its 95% CI). | ||||
| GRADE Working Group grades of evidence Comments: 1. “Industry‐funded study. Industry‐funded studies are at risk of over‐estimating effect size.” 2. “Wide confidence interval.” 3. “Unclear method of randomisation and allocation concealment in some studies”. | ||||
| Angiotensin converting enzyme inhibitor for hypertension in children: dose response in diastolic blood pressure | ||||
| Patient or population: children (from 1 to 18 years of age) with hypertension from primary or secondary causes | ||||
| Outcomes | Magnitude of reduction in diastolic blood pressuremmHg in treatment group at various dose comparisons Mean difference with 95% CI | No of participants | Quality of the evidence | Comments |
| High‐ versus low‐dose | ‐5.81 (‐11.87 to 0.26) | 187 (3 studies) | ⊕⊝⊝⊝ Very Low | Refer comments 1 to 3. |
| High‐ versus medium‐dose | ‐4.31 (‐8.59 to ‐0.03) | 187 (3 studies) | ⊕⊝⊝⊝ Very Low | Refer comments 1 to 3. |
| Medium‐ versus low‐dose | ‐0.46 (‐2.19 to 1.27) | 139 (3 studies) | ⊕⊝⊝⊝ Very Low | Refer comments 1 to 3. |
| *The basis for the assumed risk (e.g. the median control group risk across studies) is provided in footnotes. The corresponding risk (and its 95% confidence interval) is based on the assumed risk in the comparison group and the relative effect of the intervention (and its 95% CI). | ||||
| GRADE Working Group grades of evidence Comments: 1. “Industry‐funded study. Industry‐funded studies are at risk of over‐estimating effect size.” 2. “Wide confidence interval.” 3. “Unclear method of randomisation and allocation concealment in some studies”. | ||||
| Calcium channel blocker for hypertension in children: dose response in systolic and diastolic blood pressure | ||||
| Patient or population: children (from 1 to 18 years of age) with hypertension from primary or secondary causes | ||||
| Outcomes | Magnitude of reduction in systolic blood pressure mmHg in treatment group at various dose comparisons Mean difference with 95% CI | No of participants | Quality of the evidence | Comments |
| High vs low dose Systolic blood pressure | ‐1.7 (‐4.43 to 1.03) | 141 (1 study) | ⊕⊝⊝⊝ Very Low | Refer to 1 to 5 below. |
| High vs low dose Diastolic blood pressure | ‐0.70 (‐2.63 to 1.29) | 141 (1 study) | ⊕⊝⊝⊝ Very Low | Refer comments from 1 to 5. Only 2 doses were studied. Dose was not based on child's weight. |
| *The basis for the assumed risk (e.g. the median control group risk across studies) is provided in footnotes. The corresponding risk (and its 95% confidence interval) is based on the assumed risk in the comparison group and the relative effect of the intervention (and its 95% CI). | ||||
| GRADE Working Group grades of evidence Comments: 1. Evidence based on only one study. 2. “Industry‐funded study. Industry‐funded studies are at risk of over‐estimating effect size.” 3. “Wide confidence interval.” 4. “High risk of publication bias.” 5. “Unclear method of randomisation and allocation concealment”. | ||||
Background
Description of the condition
Hypertension is a major risk factor for cardiovascular disease and increases the risk of myocardial infarction, stroke, congestive heart failure, peripheral vascular disease and end‐stage renal disease in adults (Chobanian 2003). In children, hypertension is defined as an average systolic or diastolic blood pressure (or both) that is on the 95th percentile or above for age, gender and height on at least three separate occasions (National High Blood Pressure Group 2004). Average systolic or diastolic blood pressure levels that are at or above the 90th percentile but below the 95th percentile have been designated as pre‐hypertension (National High Blood Pressure Group 2004). The prevalence of paediatric pre‐hypertension and hypertension is approximately 10% and 4%, respectively (Din‐Dzietham 2007) and is rising. This is probably due to the increased prevalence of obesity and overweight globally (Bovet 2006; Din‐Dzietham 2007; Ogden 2006).
The natural history of hypertension in children is relatively uncertain, compared with that in adulthood. Overt cardiovascular events such as stroke and acute myocardial syndromes are rare in the majority of hypertensive children. Consequently, recent publications have focused on markers of hypertensive end organ damage including left ventricular mass index, increased carotid intima‐media thickness, hypertensive retinopathy and early renal injury (Assadi 2007; Daniels 1991; Laird 1981; Lande 2006; McNiece 2007; Sorof 2003).
The National High Blood Pressure Education Program Working group on High Blood Pressure in Children and Adolescents (The Fourth Report) has provided guidelines for the diagnosis, evaluation and treatment of hypertension) (National High Blood Pressure Group 2004). Non‐pharmacological measures including weight reduction, regular physical activity and dietary modification have been recommended as first‐line therapy for children with primary hypertension. These conservative measures have been shown to reduce blood pressure by 1 to 3 mmHg (Lipszyc 2011). Comprehensive programmes incorporating therapeutic lifestyle changes can be successful in reducing weight and elevated blood pressure (Couch 2008; Denzer 2004; Lipszyc 2011). However, due to the variable success of non‐pharmacological measures, a significant proportion of children still require antihypertensive medications (Liberman 2009). The indications for pharmacological intervention include secondary hypertension due to conditions such as renal artery stenosis, hypertension in children with established end organ damage or symptomatic hypertension, and failure of non‐pharmacological measures.
Why it is important to do this review
A systematic review of randomised controlled trials evaluating the benefits and harms of antihypertensive agents currently in use in children, compared to placebo or active comparators, has not been performed. The information derived from this review will assist physicians caring for children with hypertension in their decision‐making regarding the choice and dose of medication.
Objectives
Primary objectives
To determine the dose‐related effects of different classes of antihypertensive medications, as monotherapy compared to placebo; as combination therapy compared to placebo or a single medication; or in comparisons of various doses within the same class, on systolic or diastolic blood pressure (or both) in children with hypertension.
Secondary objectives
-
To determine the effect of different classes of antihypertensive medications on target end organ disease, such as left ventricular hypertrophy, cardiac function, nephropathy and retinopathy.
-
To determine the adverse events leading to medication withdrawal and adverse biochemical effects of antihypertensive drug therapy on serum potassium, uric acid, creatinine, glucose and lipid profile.
-
To determine the adherence with different antihypertensive medications measured by self report, a pill count method or any other method used in the trial.
Methods
Criteria for considering studies for this review
Types of studies
Only randomised controlled trials (including either parallel‐group or cross‐over study designs) of different classes of antihypertensive agents or differing doses among a drug class in children with hypertension, with a minimum two‐week follow‐up, were eligible for inclusion.
Types of participants
Inclusion criteria
Trials with children (from one to 18 years of age) with hypertension from primary or secondary causes, such as chronic kidney disease, were included. Hypertension was defined as an average systolic or diastolic blood pressure (or both) that is on the 95th percentile or above for age, gender and height on at least three separate occasions.
Exclusion criteria
We specifically excluded trials which included secondary hypertension associated with a kidney transplant, nephrotic syndrome treated with calcineurin inhibitors or high‐dose steroids, children with malignant hypertension or children needing perioperative control of blood pressure.
Types of interventions
All pharmacological interventions were potentially eligible. Interventions which we considered included:
-
blood pressure‐lowering medications versus placebo;
-
combination drugs versus placebo;
-
combination drugs versus a single medication;
-
comparison between different doses of same antihypertensive medications versus placebo;
-
comparison of two different classes of antihypertensive medications (either as an indirect comparison of each drug with placebo or a direct comparison, if one trial used two drugs from two different classes with a placebo control group as well);
-
comparison of two different medications within the same antihypertensive class (either as an indirect comparison of each drug within the same drug class with placebo or a direct comparison if one trial used two drugs from the same class with a placebo control group as well).
Types of outcome measures
Primary outcomes
-
Change in office measurement of systolic blood pressure.
-
Change in office measurement of diastolic blood pressure.
-
Change in 24‐hour ambulatory blood pressure monitoring (ABPM) of systolic blood pressure.
-
Change in 24‐hour ambulatory blood pressure monitoring (ABPM) of diastolic blood pressure.
Secondary outcomes
-
Change in night time dipping and blood pressure load on ABPM.
-
Regression of left ventricular hypertrophy or left ventricular wall thickness.
-
Effect on progression of chronic kidney disease or kidney failure or proteinuria or albuminuria.
-
Change in retinopathy.
-
Change in heart rate, cardiac output and systemic vascular resistance as measured by standardised bio‐impedance methods.
-
Change in levels of serum creatinine, serum potassium, serum uric acid, blood glucose, serum cholesterol and triglycerides.
-
The number of medication withdrawals due to adverse events.
-
Average per cent adherence to medications during the trial as reported in the trials.
Search methods for identification of studies
We searched the Database of Abstracts of Reviews of Effectiveness (DARE) and the Cochrane Database of Systematic Reviews for related reviews.
We searched the Cochrane Hypertension Group Specialised Register, the Cochrane Central Register of Controlled Trials (CENTRAL) (2013, Issue 9), Ovid MEDLINE (1946 to October 2013), Ovid EMBASE (1974 to October 2013) and ClinicalTrials.gov for primary studies.
We searched the electronic databases using a strategy combining a variation of the Cochrane Highly Sensitive Search Strategy for identifying randomised trials in MEDLINE: sensitivity‐maximising version (2008 revision) with selected MeSH and free‐text terms relating to children and hypertension. We used no language restrictions. We translated the MEDLINE search strategy (Appendix 1) for EMBASE (Appendix 2), CENTRAL (Appendix 3) and the Hypertension Group Specialised Register (Appendix 4) using the appropriate controlled vocabulary as applicable.
The Hypertension Group Specialised Register contains over 22,000 randomised controlled trials identified from searches of MEDLINE, EMBASE, AGRICOLA, Allied and Complementary Medicine (AMED), BIOSIS, CAB Abstracts, CINAHL, Food Science and Technology Abstracts (FSTA), Global Health, International Pharmaceutical Abstracts (IPA), ISI Web of Science, LILACS, ProQuest Dissertations and Theses, and Scirus.
We also searched the following other sources:
-
International Clinical Trials Registry Platform (WHO ICTRP);
-
OpenSIGLE (System for Information on Grey Literature in Europe);
-
reference lists of nephrology textbooks, review articles and all papers and relevant reviews identified.
We also:
-
contacted authors of relevant papers regarding any further published or unpublished work;
-
contacted authors of trials reporting incomplete information to provide the missing information;
-
searched ISI Web of Science for papers which cite studies included in the review.
Data collection and analysis
Selection of studies
We performed the initial search of all databases to identify citations with potential relevance. Two review authors (SC and DL) initially screened abstracts and excluded articles whose titles or abstracts (or both) were clearly irrelevant. We retrieved the full text of the remaining articles. We searched the bibliographies of pertinent articles, reviews and texts for additional citations. SC and DL independently assessed the eligibility of the trials using a trial selection form. There were no major disagreements. Any minor differences in opinion regarding study inclusion were resolved after discussion with RP.
Data extraction and management
SC and DL extracted data independently using a standardised template.
Assessment of risk of bias in included studies
We assessed risk of bias using the standard Cochrane 'Risk of bias' tool (Higgins 2011).
Measures of treatment effect
The position of the patient during blood pressure measurement may affect the blood pressure‐lowering effect. When blood pressure measurements were available in more than one position, the sitting blood pressures were the first preference. In order not to lose valuable data, if blood pressures were taken in any other position (lying or standing), we collected data from that position. We reported on the mean difference of the drug compared to placebo. However, in trials with no placebo, we compared the mean change among various doses (and termed these changes non‐placebo corrected).
Dealing with missing data
In case of missing information in the included studies, we made efforts to contact investigators by e‐mail to obtain this. We were able to get missing information for the Hazan 2010a, Hazan 2010b, Li 2004 and Trachtman 2008 studies and this has been included in the study results.
Assessment of heterogeneity
We assessed heterogeneity using the Chi2 test and the I2 statistic.
Data synthesis
We used the random‐effects model to obtain summary statistics for estimates of effect. We carried out data synthesis and analysis using the Cochrane Review Manager Software, RevMan 5.2 (RevMan 2012). We combined data for changes in blood pressure (systolic and diastolic) using the mean difference (MD) or the standardised mean difference (SMD) if different scales were used.
Subgroup analysis and investigation of heterogeneity
We had planned to investigate age, gender, pubertal status, primary versus secondary cause of hypertension, ethnicity and weight as sources of heterogeneity using subgroup analysis and meta‐regression but this was not possible because of insufficient data.
Results
Description of studies
See: Characteristics of included studies; Characteristics of excluded studies.
Results of the search
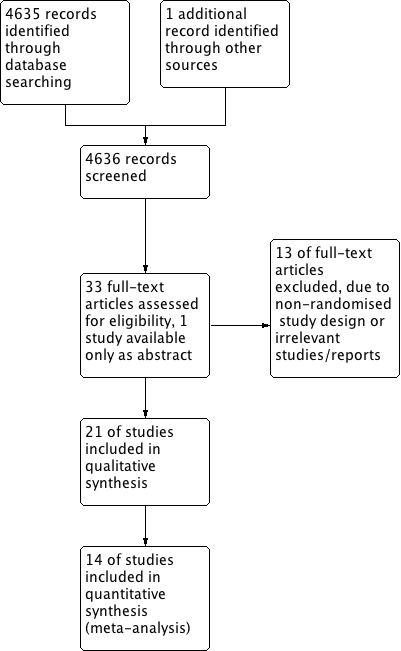
The search strategy identified 4635 citations, with another study identified from a reference list search of retrieved studies. We screened a total of 4636 abstracts and titles electronically and excluded 4602 abstracts as they did not fulfil the inclusion criteria (Figure 1). Of the 33 articles obtained for a full‐text review, 20 RCTs met the inclusion criteria and were included in the systematic review. One more included study was available only as an abstract. Hazan 2010a and Hazan 2010b (one study with stratification) included two cohorts (cohort A, 62% white; cohort B, 100% black). Cohort A was termed Hazan 2010a and Cohort B was termed Hazan 2010b for the purpose of the analysis in this review. Some of the reasons for exclusion were: non‐randomised nature of the study, experimental nature of the therapy, participants not meeting the inclusion criteria, unavailability of important details such as the number of patients per group and the dose of antihypertensive used. Reasons for excluding each trial are listed in the Characteristics of excluded studies table.

Study flow diagram.
Included studies
We included 21 studies (one with two cohorts shown as two reports): Batisky 2007; BMS 2005; Falkner 1983; Flynn 2004; Flynn 2008; Gartenmann 2003; Hazan 2010a; Hazan 2010b; Li 2004; Li 2010; Schaefer 2010; Schaefer 2011; Shahinfar 2005; Soffer 2003; Sorof 2002; Trachtman 2003; Trachtman 2008; Webb 2010; Webb 2013; Wells 2002; Wells 2010; Wells 2011.
Trial designs were variable. Only five trials directly compared an antihypertensive drug to placebo in a parallel study design. The majority of the remaining trials used a design in which an initial screening/washout phase was followed by an active drug phase during which all children were treated with different doses of the same drug (phase one). This was immediately followed by a placebo withdrawal phase (phase two) during which study participants were re‐randomised to either continue on the same dose of the study drug or receive a placebo. The carry‐over effect of the study drug from phase one to phase two could not be ruled out as there was no intervening washout phase. Thus, only data from phase one were included in the analyses.
Risk of bias in included studies
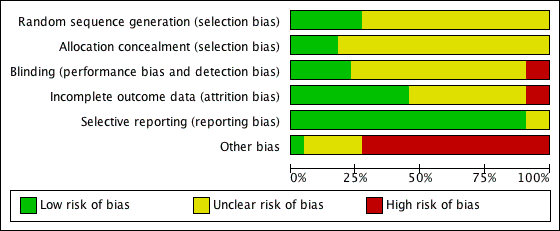
Overall risk of bias across all included studies is displayed in Figure 2. The risk of bias for each included study is displayed in Figure 3. Trial quality was variable. Information regarding adequate sequence generation was only available in 30% of studies and description of allocation concealment was only available in 15%. Only 55% of trials reported the results for all of the pre‐defined outcomes.

'Risk of bias' graph: review authors' judgements about each methodological quality item presented as percentages across all included studies.

'Risk of bias' summary: review authors' judgements about each risk of bias item for each included study.
Effects of interventions
See: Summary of findings for the main comparison Antihypertensive drug class compared to placebo for hypertension in children: systolic blood pressure reduction; Summary of findings 2 Antihypertensive drug class compared to placebo for hypertension in children: diastolic blood pressure reduction; Summary of findings 3 Angiotensin receptor blocker for hypertension in children: dose response in systolic blood pressure; Summary of findings 4 Angiotensin receptor blocker for hypertension in children: dose response in diastolic blood pressure; Summary of findings 5 Angiotensin converting enzyme inhibitor for hypertension in children: dose response in systolic blood pressure; Summary of findings 6 Angiotensin converting enzyme inhibitor for hypertension in children: dose response in diastolic blood pressure; Summary of findings 7 Calcium channel blocker for hypertension in children: dose response in systolic and diastolic blood pressure
Effect on blood pressure
The included studies used either auscultatory or oscillometric methods to measure blood pressure throughout the study. One of the included studies (Schaefer 2011) used an ambulatory blood pressure monitor (ABPM) in a subset of patients.
Antihypertensive drug versus placebo
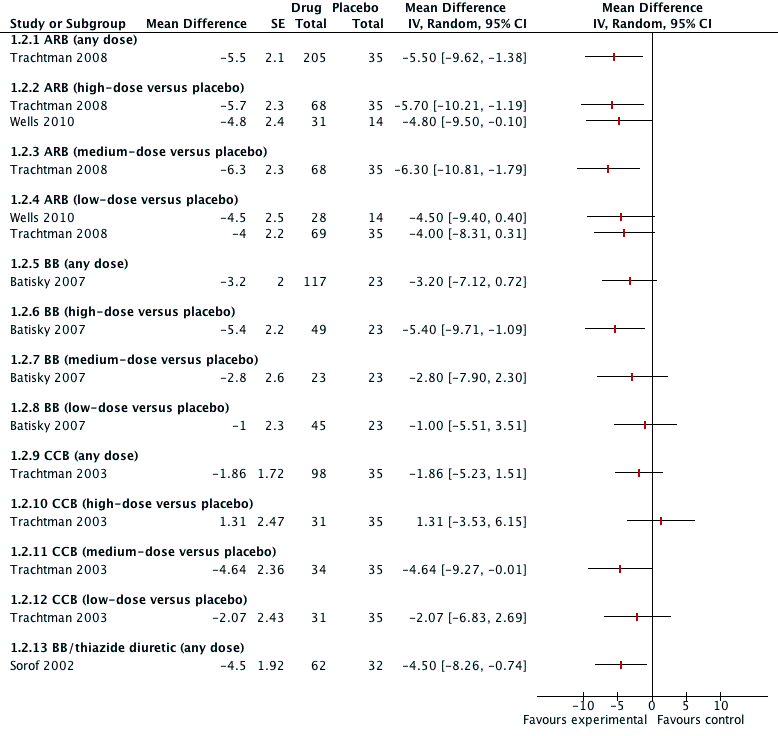
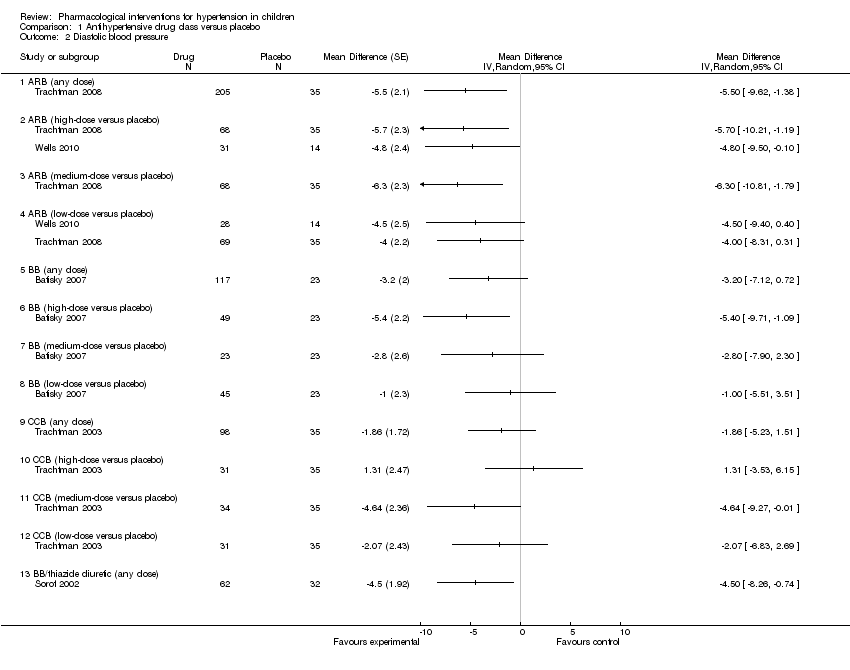
Five of the included trials compared an antihypertensive agent directly with placebo (Batisky 2007; Sorof 2002; Trachtman 2003; Trachtman 2008; Wells 2010). The five different drugs studied included: candesartan 0.05 mg/kg/day to 0.4 mg/kg/day (Trachtman 2008); telmisartan 1 to 2 mg/kg/day (Wells 2010); extended‐release metoprolol 0.2 mg/kg to 2.0 mg/kg (Batisky 2007); a combination drug comprising bisoprolol and hydrochlorothiazide (bisoprolol either 2.5 mg or 10 mg in combination with hydrochlorothiazide 6.25 mg) (Sorof 2002); and extended‐release felodipine in either a 2.5 mg, 5 mg or 10 mg dose (Trachtman 2003). See Analysis 1.1 (Figure 4); Analysis 1.2 (Figure 5); Table 1. There were no trials comparing an angiotensin‐converting enzyme inhibitor directly to a placebo. Candesartan (one trial, n = 240), when compared to placebo, reduced systolic blood pressure by 6.50 mmHg (95% confidence interval (CI) ‐9.44 to ‐3.56) and diastolic blood pressure by 5.50 mmHg (95% CI ‐9.62 to ‐1.38) (low‐quality evidence). High dose telmisartan (one trial, n = 76), when compared to placebo, reduced systolic blood pressure by ‐8.50 (95% CI ‐13.79 to ‐3.21) but not diastolic blood pressure (‐4.80, 95% CI ‐9.50 to 0.10) (low‐quality evidence). Metoprolol, when compared with placebo (one trial, n = 140), significantly reduced systolic blood pressure by 4.20 mmHg (95% CI ‐8.12 to ‐0.28) but not diastolic blood pressure (‐3.20 mmHg 95% CI ‐7.12 to 0.72) (low‐quality evidence). Bisoprolol/hydrochlorothiazide combination, compared with placebo (one trial, n = 94), resulted in a significant reduction in systolic blood pressure (‐4.50 mmHg, 95% CI ‐8.26 to ‐0.74) but did have an effect on diastolic blood pressure (‐4.50 mmHg, 95% CI ‐8.26 to ‐0.74) (low‐quality evidence). Extended‐release felodipine (one trial, n = 133) was not effective in reducing systolic blood pressure (‐0.62 mmHg, 95% CI ‐2.97 to 1.73) or diastolic blood pressure (‐1.86 mmHg, 95% CI ‐5.23 to 1.51) when compared with placebo.

Forest plot of comparison: 1 Antihypertensive drug class versus placebo, outcome: 1.1 Systolic blood pressure.

Forest plot of comparison: 1 Antihypertensive drug class versus placebo, outcome: 1.2 Diastolic blood pressure.
| Study | n | Systolic blood pressure: | SD | 95% CI | Diastolic blood pressure: | SD | 95% CI | |
| Angiotensin receptor blocker | ||||||||
| Trachtman 2008 (candesartan) | ||||||||
| Low (0.05 mg/kg) | 69 | ‐8.50 | 8.00 | ‐10.39 to ‐6.61 | ‐5.30 | 9.1 | ‐7.45 to ‐3.15 | |
| Medium (0.2 mg/kg) | 68 | ‐10.80 | 9.60 | ‐13.08 to ‐8.52 | ‐7.60 | 10.2 | ‐10.02 to ‐5.18 | |
| High (0.4 mg/kg) | 68 | ‐11.30 | 10.80 | ‐13.87 to ‐8.73 | ‐7.00 | 9.9 | ‐9.35 to ‐4.65 | |
| Placebo | 35 | ‐3.80 | 7.80 | ‐6.38 to ‐1.22 | ‐1.30 | 11.5 | ‐5.11 to 2.51 | |
| Wells 2010 (telmisartan) | ||||||||
| Low (1 mg/kg) | 28 | ‐9.00 | 7.80 | ‐6.10 to ‐11.90 | ‐7.70 | 9.60 | ‐4.10 to ‐11.30 | |
| High (2 mg/kg) | 31 | ‐13.00 | 8.70 | ‐9.90 to ‐16.10 | ‐7.80 | 8.10 | ‐4.90 to ‐10.70 | |
| Placebo | 14 | ‐4.70 | 10.70 | +0.90 to ‐10.30 | ‐2.90 | 7.60 | +1.10 to ‐6.90 | |
| Beta‐blocker | ||||||||
| Batisky 2007 (metoprolol) | ||||||||
| Low (0.2 mg/kg) | 45 | ‐5.20 | 8.70 | ‐7.70 to ‐2.60 | ‐3.10 | 8.90 | ‐5.70 to ‐0.50 | |
| Medium (1 mg/kg) | 23 | ‐7.70 | 8.60 | ‐11.30 to ‐4.00 | ‐4.90 | 8.90 | ‐8.60 to ‐1.30 | |
| High (2 mg/kg) | 49 | ‐6.30 | 9.00 | ‐8.70 to ‐3.80 | ‐7.50 | 8.90 | ‐10.00 to ‐5.00 | |
| Placebo | 23 | ‐1.90 | 8.90 | ‐5.50 to 1.80 | ‐2.10 | 8.80 | ‐5.70 to 1.50 | |
| Combination | ||||||||
| Sorof 2002 (bisoprolol/hydrochlorothiazide) | ||||||||
| Bisoprolol 10 mg/hydrochlorothiazide 6.25 mg | 62 | ‐9.30 | 11.81 | ‐12.24 to ‐6.36 | ‐7.20 | 9.45 | ‐9.55 to ‐4.85 | |
| Placebo | 32 | ‐4.90 | 10.18 | ‐8.43 to ‐1.37 | ‐2.70 | 8.49 | ‐5.64 to 0.24 | |
| Calcium channel blocker | ||||||||
| Trachtman 2003 (felodipine extended‐release) | Placebo corrected | Placebo corrected | ||||||
| Low (2.5 mg) | 33 | ‐0.71 | 11.99 | ‐4.80 to 3.38 | ‐2.07 | 13.94 | ‐6.82 to 2.69 | |
| Medium (5 mg) | 34 | ‐0.06 | 11.80 | ‐4.60 to 3.33 | ‐4.64 | 13.79 | ‐9.18 to 0.09 | |
| High (10 mg) | 31 | ‐1.13 | 11.86 | ‐5.30 to 3.05 | +1.31 | 13.73 | ‐3.56 to 6.11 | |
| CI: confidence interval; SD: standard deviation. All doses mentioned are: per day | ||||||||
Calcium channel blocker versus placebo, dose response
One of the included trials compared the different doses (2.5 mg, 5 mg and 10 mg once daily) of extended‐release felodipine with a placebo and found no significant dose response relationship (Trachtman 2003) (Analysis 1.1 ‐ Figure 4; Analysis 1.2 ‐ Figure 5; Table 1).
Angiotensin receptor blockers, dose response, with or without a placebo control
Nine of the included trials examined different angiotensin receptor blockers, such as losartan (Shahinfar 2005; Webb 2013), candesartan (Schaefer 2010; Trachtman 2008), valsartan (Flynn 2008; Wells 2011), olmesartan (Hazan 2010a; Hazan 2010b), telmisartan (Wells 2010) and irbesartan (BMS 2005) (Table 2). Only unpublished data were available for one study (BMS 2005). Another study was only available as an abstract (Webb 2013).
| Study | n | Systolic blood pressure: | SD | 95% CI | Diastolic blood pressure: | SD | 95% CI |
| ≥ 6 years of age | |||||||
| Shahinfar 2005 (losartan) | |||||||
| Low (0.07 mg/kg) | 70 | ‐4.40 | 7.60 | ‐6.20 to ‐2.60 | ‐6.00 | 7.60 | ‐7.80 to ‐4.20 |
| Medium (0.75 mg/kg) | 40 | ‐10.00 | 9.10 | ‐12.90 to ‐7.10 | ‐11.70 | 9.10 | ‐14.60 to ‐8.80 |
| High (1.44 mg/kg) | 64 | ‐8.60 | 9.50 | ‐11.00 to ‐6.30 | ‐12.20 | 8.90 | ‐14.40 to ‐10.00 |
| Wells 2011 (valsartan) | |||||||
| Low (0.4 mg/kg) | 102 | ‐7.90 | 10.40 | ‐9.92 to ‐5.88 | ‐4.60 | 11.00 | ‐6.72 to ‐2.48 |
| Medium (1.3 mg/kg) | 52 | ‐9.60 | 9.10 | ‐12.07 to ‐7.13 | ‐5.80 | 8.90 | ‐8.22 to ‐3.38 |
| High (2.7 mg/kg) | 105 | ‐11.50 | 11.20 | ‐13.64 to ‐9.36 | ‐7.40 | 9.50 | ‐9.22 to ‐5.58 |
| Hazan 2010a* (olmesartan) | |||||||
| Low (2.5/5 mg) | 95 | ‐7.80 | 9.18 | ‐9.66 to ‐5.94 | ‐5.50 | 8.06 | ‐7.15 to ‐3.89 |
| High (20/40 mg) | 95 | ‐12.60 | 10.15 | ‐14.65 to ‐10.55 | ‐9.50 | 9.76 | ‐11.47 to ‐7.53 |
| Hazan 2010b* (olmesartan) | |||||||
| Low (2.5/5 mg) | 56 | ‐4.70 | 11.48 | ‐7.71 to ‐1.69 | ‐3.50 | 8.84 | ‐1.18 to ‐5.82 |
| High (20/40 mg) | 56 | ‐10.70 | 9.26 | ‐13.13 to ‐8.27 | ‐7.60 | 8.17 | ‐5.46 to ‐9.74 |
| BMS 2005 (irbesartan) | |||||||
| Low (0.5 mg/kg) | 106 | ‐11.7 | ‐ | ‐ | ‐3.80 | ‐ | ‐ |
| Medium (1.5 mg/kg) | 106 | ‐9.30 | ‐ | ‐ | ‐3.20 | ‐ | ‐ |
| High (4.5 mg/kg) | 106 | ‐13.30 | ‐ | ‐ | ‐6.60 | ‐ | ‐ |
| < 6 years of age | |||||||
| Schaefer 2010 (candesartan) | |||||||
| Low (0.05 mg/kg) | 29 | ‐6.00 | 9.40 | ‐9.42 to ‐2.58 | ‐5.20 | 6.70 | ‐7.64 to ‐2.76 |
| Medium (0.2 mg/kg) | 32 | ‐8.90 | 9.20 | ‐12.09 to ‐5.71 | ‐7.90 | 12.90 | ‐12.37 to ‐3.43 |
| High (0.4 mg/kg) | 32 | ‐12.10 | 8.30 | ‐14.98 to ‐9.22 | ‐11.10 | 9.20 | ‐14.29 to ‐7.91 |
| Flynn 2008 (valsartan) | |||||||
| Low (5/10 mg) | 37 | ‐8.40 | 8.44 | ‐11.12 to ‐5.68 | ‐5.50 | 6.06 | ‐7.45 to ‐3.55 |
| Medium (20/40 mg) | 18 | ‐8.30 | 7.63 | ‐11.82 to ‐4.78 | ‐6.40 | 4.23 | ‐8.35 to ‐4.45 |
| High (40/80 mg) | 35 | ‐8.60 | 7.55 | ‐11.10 to ‐6.10 | ‐5.50 | 8.47 | ‐8.31 to ‐2.69 |
| Webb 2013 (losartan) | |||||||
| Low (0.1 mg/kg) | 33 | ‐7.30 | ‐ | ‐ | ‐8.20 | ‐ | ‐ |
| Medium (0.3 mg/kg) | 34 | ‐7.60 | ‐ | ‐ | ‐5.10 | ‐ | ‐ |
| High (0.7 mg/kg) | 32 | ‐6.70 | ‐ | ‐ | ‐6.70 | ‐ | ‐ |
| *Hazan 2010 study stratified study population into 2 cohorts (cohort A, 62% white; cohort B, 100% black). Cohort A was termed Hazan 2010a and Cohort B was termed Hazan 2010b. All doses mentioned are per day. CI: confidence interval; SD: standard deviation | |||||||
The six trials in children older than six years of age reported a non‐placebo corrected dose response in systolic and diastolic blood pressure. Changes in mean sitting systolic and diastolic blood pressure in the low‐, medium‐ and high‐dose groups of the different angiotensin receptor blockers are summarised in Table 2.
On pooling data from these six trials, there was a significant dose response of angiotensin receptor blockers when comparing the high‐ versus low‐dose groups for systolic (‐4.2 mmHg, 95% confidence interval (CI) ‐5.6 to ‐2.9) and diastolic blood pressure (‐3.5 mmHg, 95% CI ‐5.0 to ‐2.0). Similarly there was a significant dose effect apparent in the medium‐ versus low‐dose groups in systolic (‐3.1 mmHg, 95% CI ‐5.4 to ‐0.8) and in diastolic blood pressure (‐3.0, 95% CI ‐5.7 to ‐0.4). There was, however, no significant dose effect in the high‐ versus medium‐dose groups in systolic (‐0.5 mmHg, 95% CI ‐2.4 to 1.5) or in diastolic blood pressure (‐0.6 mmHg, 95% CI ‐2.5 to 1.3) (Analysis 2.1 ‐ Figure 6; Analysis 2.2 ‐ Figure 7) .

Forest plot of comparison: 2 Drug different doses, outcome: 2.1 SBP.

Forest plot of comparison: 2 Drug different doses, outcome: 2.2 DBP.
Three trials of angiotensin receptor blockers in children less than six years old reported a non‐placebo corrected dose response in systolic and diastolic blood pressure (Flynn 2008; Schaefer 2010; Webb 2013). The doses of angiotensin receptor blockers used were: valsartan 0.4 to 3.4 mg/kg/day, candesartan 0.05 to 0.4 mg/kg/day and losartan 0.1 to 0.7 mg/kg/day
Changes in mean sitting systolic and diastolic blood pressure in the low‐, medium‐ and high‐dose groups of valsartan, candesartan and losartan are summarised in (Analysis 2.1; Analysis 2.2; Table 2). On pooling the data from the two trials of angiotensin receptor blockers in younger children, no significant dose effect was apparent for systolic and diastolic blood pressure (Analysis 2.1 ‐ Figure 6; Analysis 2.2 ‐ Figure 7) . One study could not be pooled as no standard deviations (SD) were available (Webb 2013).
Angiotensin‐converting enzyme inhibitor, dose response, no placebo control
Three of the included trials examined the dose response relationships of three different angiotensin‐converting enzyme inhibitors, namely enalapril (Wells 2002), fosinopril (Li 2004) and lisinopril (Soffer 2003). The enalapril and lisinopril trials had a similar dose response design with the primary endpoint of change in diastolic blood pressure. These two studies used the study drug in a suspension form with doses ranging from 0.08 mg/kg/day up to 0.6 mg/kg/day (Wells 2002; Soffer 2003). The fosinopril study used a tablet form of the drug and the doses ranged between 0.1 mg/kg/day and 0.6 mg/kg/day. The primary endpoint of the fosinopril study was the change in systolic blood pressure from baseline (Li 2004). All three angiotensin‐converting enzyme inhibitors resulted in significant lowering of mean sitting systolic and diastolic blood pressure in the low‐, medium‐ and high‐dose groups compared to baseline but did not always show a dose response with higher doses (Analysis 2.1 ‐ Figure 6; Analysis 2.2 ‐ Figure 7; Table 3).
| Study | n | Systolic blood pressure: | SD | 95% CI | Diastolic blood pressure: | SD | 95% CI |
| Angiotensin‐converting enzyme inhibitors | |||||||
| Wells 2002 (enalapril) | |||||||
| Low (0.02 mg/kg) | 30 | ‐7.10 | 9.30 | ‐10.60 to ‐3.60 | ‐6.30 | 7.80 | ‐9.20 to ‐3.40 |
| Medium (0.08 mg/kg) | 29 | ‐6.60 | 10.10 | ‐10.40 to ‐2.80 | ‐8.90 | 8.70 | ‐12.20 to ‐5.60 |
| High (0.58 mg/kg) | 50 | ‐12.50 | 11.70 | ‐15.80 to ‐9.20 | ‐14.90 | 8.70 | ‐17.40 to ‐12.40 |
| Li 2004 (fosinopril) | |||||||
| Low (0.1 mg/kg) | 73 | ‐10.90 | 10.25 | ‐13.20 to ‐8.60 | ‐4.50 | 6.84 | ‐6.00 to ‐3.00 |
| Medium (0.3 mg/kg) | 86 | ‐11.30 | 10.25 | ‐13.40 to ‐9.10 | ‐4.20 | 6.49 | ‐5.70 to ‐2.80 |
| High (0.6 mg/kg) | 79 | ‐11.90 | 9.78 | ‐14.20 to ‐9.70 | ‐5.10 | 7.11 | ‐6.60 to ‐3.60 |
| Soffer 2003 (lisinopril) | |||||||
| Low (0.02 mg/kg) | 33 | ‐5.40 | 9.90 | ‐9.00 to ‐1.90 | ‐7.60 | 9.30 | ‐10.90 to ‐4.30 |
| Medium (0.07 mg/kg) | 24 | ‐12.10 | 9.10 | ‐16.00 to ‐8.30 | ‐9.30 | 8.70 | ‐13.00 to ‐5.70 |
| High (0.61 mg/kg) | 58 | ‐15.20 | 12.10 | ‐18.40 to ‐12.00 | ‐16.40 | 11.70 | ‐19.50 to 13.30 |
| Selective aldosterone receptor blocker | |||||||
| Li 2011 (eplerenone) | |||||||
| Low (25 mg) | 58 | ‐7.66 | ‐ | ‐ | ‐3.80 | ‐ | ‐ |
| Medium (50 mg) | 62 | ‐7.84 | ‐ | ‐ | ‐2.70 | ‐ | ‐ |
| High (100 mg) | 184 | ‐7.99 | ‐ | ‐ | ‐3.05 | ‐ | ‐ |
| Calcium channel blocker | |||||||
| Flynn 2004 (amlodipine) | |||||||
| Low (2.5 mg) | 127 | ‐7.3 | 11.4 | ‐9.3 to ‐5.3 | ‐3.7 | 8.3 | ‐5.1 to ‐2.3 |
| High (5 mg) | 141 | ‐9.0 | 11.4 | ‐10.9 to ‐7.1 | ‐4.4 | 8.3 | ‐5.8 to ‐3.0 |
| *Angiotensin receptor blocker versus angiotensin‐converting enzyme inhibitor | |||||||
| Schaefer 2011 | |||||||
| Valsartan (80/160/320 mg) | 148 | ‐15.40 | ‐ | ‐ | ‐9.40 | ‐ | ‐ |
| Enalapril (10/20/40 mg) | 148 | ‐14.10 | ‐ | ‐ | ‐8.50 | ‐ | ‐ |
| Calcium channel blockers versus angiotensin receptor blockers | |||||||
| Webb 2010 (amlodipine versuslosartan) | |||||||
| Amlodipine (0.05 to 0.2 mg/kg) | 30 | ‐0.10 | ‐ | ‐ | ‐0.80 | ‐ | ‐ |
| Losartan (0.7 to 1.4mg/kg) | 30 | ‐5.50 | ‐ | ‐ | ‐3.40 | ‐ | ‐ |
| Gartenmann 2003 (amlodipine versusirbesartan) | Median change from baseline | Range | Median change from baseline | Range | |||
| Amlodipine (20 to 40 kg: 5 to 10 mg; > 40 kg: 10 to 20 mg) | 11 | 12.00 | 10.00 to 14.00 | 7.00 | 5.00 to 10.00 | ||
| Irbesartan (20 to 40 kg: 75 to 150 mg; > 40 kg: 150 to 300 mg) | 13 | 13.00 | 9 to 16 | 9.00 | 7.00 to 11.00 | ||
| Alpha blocker versus diuretic, Falkner 1981 (clonidine versus hydrochlorothiazide) | |||||||
| Clonidine | Mean BP | SD | Mean BP | SD | |||
| Pre | 15 | 146 | 16.00 | 138 to 154 | 96 | 6.00 | 93 to 99 |
| Low (0.1 mg twice) | 136 | 13.00 | 129 to 143 | 89 | 8.00 | 85 to 93 | |
| High (0.2 mg twice) | 136 | 8.00 | 132 to 140 | 88 | 5.00 | 85 to 91 | |
| Hydrochlorothiazide | |||||||
| Pre | 15 | 145 | 6.00 | 142 to 148 | 97 | 8.00 | 93 to 101 |
| Low (25 mg twice) | 139 | 10.00 | 134 to 144 | 94 | 6.00 | 91 to 97 | |
| High (50 mg twice) | 135 | 11.00 | 129 to 141 | 93 | 8.00 | 89 to 97 | |
| All doses mentioned are per day | |||||||
BP: blood pressure; CI: confidence interval; SD: standard deviation
Angiotensin‐converting enzyme inhibitor versus angiotensin receptor blocker
One of the included trials compared an angiotensin‐converting enzyme inhibitor with an angiotensin receptor blocker in 296 children aged six to 17 years (Schaefer 2011). The study compared enalapril (≥ 18 to < 35 kg, 10 mg; ≥ 35 to < 80 kg, 20 mg; ≥ 80 to ≤ 160 kg, 40 mg) with valsartan (≥18 to < 35 kg, 80 mg; ≥ 35 to < 80 kg, 160 mg; ≥ 80 to ≤ 160 kg, 320 mg) for a period of 12 weeks. Both drugs were equally effective in reducing blood pressure compared to baseline with a mean systolic/diastolic blood pressure reduction of ‐15.4/‐9.4 mmHg for valsartan compared to ‐14.1/‐8.5 mmHg for enalapril (Table 3). Among the subset of patients who had ABPM done (n = 56), valsartan resulted in a greater reduction in mean 24‐hour systolic blood pressure (valsartan ‐9.8 mmHg versus enalapril ‐7.2 mmHg; P = 0.03). Limited data were presented for this trial, including a lack of standard deviations or standard errors, preventing the calculation of confidence intervals.
Calcium channel blockers, dose response, no placebo control
One of the included trials assessed the antihypertensive efficacy of amlodipine (Flynn 2004). The study compared two different doses of amlodipine in a phase lasting four weeks, followed by an additional four‐week placebo withdrawal phase. The data from the first four‐week phase were included in this review. The dose response was not significant for either systolic or diastolic blood pressure (Analysis 2.1 ‐ Figure 6; Analysis 2.2 ‐ Figure 7; Table 3).
Calcium channel blocker versus angiotensin receptor blockers
Two of the included trials compared calcium channel blockers with angiotensin receptor blockers. One trial compared amlodipine (median dose 0.19 to 0.33 mg/kg/day) with irbesartan (median dose 2.9 to 4.8 mg/kg/day) (Gartenmann 2003), while the other compared amlodipine 0.1 to 0.2 mg/kg/day and losartan 0.7 to 1.4 mg/kg/day (Webb 2010).
In the trial comparing amlodipine with irbesartan, both drugs were equally effective in reducing blood pressure compared to baseline (Table 3). The trial comparing amlodipine with losartan found a mean change in systolic blood pressure compared to baseline of ‐0.1 mmHg and ‐5.5 mmHg, respectively. When compared with baseline, treatment with losartan led to a decrease in diastolic blood pressure by 3.8 mmHg. However, there was an increase of 0.8 mmHg (SD 12.4) in the amlodipine group (Table 3). Confidence intervals were not available for this trial as standard deviations/standard errors for the change in blood pressures were not reported (Webb 2010).
Selective aldosterone antagonist, dose response, no placebo control
There was only one trial of eplerenone, a competitive aldosterone antagonist (Li 2010). The study compared three different doses (25 mg, 50 mg and 100 mg/day) of eplerenone in phase A which lasted for six weeks, followed by an additional four‐week placebo withdrawal phase. The data from first six weeks were included in the review (Table 3). There was a mean reduction in systolic blood pressure compared to a baseline of ‐7.7 mmHg, ‐7.8 and ‐8.0 in the low‐, medium‐ and high‐dose groups, respectively. There was a mean reduction in diastolic blood pressure compared to a baseline of ‐3.8 mmHg, 2.7 mmHg and 3.1 mmHg in the low‐, medium‐ and high‐dose group, respectively. Confidence intervals were not available for this trial as standard deviations were not reported.
Alpha blocker versus diuretic, no placebo control
One of the included trials compared clonidine, a centrally acting alpha blocker, with hydrochlorothiazide, a diuretic (Falkner 1983). Active therapy was initiated at a low dose for the first 12 weeks (low‐dose period, clonidine 0.1 mg twice daily and hydrochlorothiazide 25 mg twice daily) and increased to a high dose (clonidine 0.2 mg twice daily and hydrochlorothiazide 50 mg twice daily) if blood pressure goals were not achieved. Both clonidine and hydrochlorothiazide effectively reduced systolic and diastolic blood pressure (P < 0.05) (Table 3).
Progression of chronic kidney disease
None of the included trials reported the effect of blood pressure control on the progression of chronic kidney disease alone.
Adverse drug effects
The adverse events associated with the antihypertensive agents were mostly minor and occurred in approximately 3% to 40% of all patients studied (Table 4). The most common adverse events included headaches, dizziness and upper respiratory infections.
| Drugs | Common side effects | Less common side effects |
| Angiotensin‐converting enzyme inhibitor | Headache (20.1%), nasopharyngitis (9.6%), cough (9.1%) with fosinopril Dizziness was the most common side effect in the enalapril study (4 patients, followed by cough (3 patients) and headache (2 patients). No angioedema reported in any of the 3 trials | Low‐dose lisinopril ‐ 1 patient developed leucopenia and another patient had elevated creatinine. High‐dose lisinopril: 1 patient developed hyperkalaemia and another had elevated creatinine In the fosinopril study: elevated creatinine was the most frequent lab abnormality (drug versus placebo 8.9% versus 4.1%). All elevations were transient and did not exceed the upper limit of normal None of the patients in the enalapril study experienced renal failure or hyperkalaemia |
| Angiotensin receptor blocker in > 6 years | Headache was reported in 33.2% of children in the valsartan study and in 5.4% to 14.7% of children in the olmesartan study The most common side effects in the candesartan trial were headache, upper respiratory infection, dizziness, cough and sore throat The olmesartan study reported headache (7.4%) and pharyngo‐laryngeal pain (6.3%) in the low‐dose group and headache (14.7%) and dizziness (9.5%) in the high‐dose group among the mixed racial cohort. Among the black patients, headache (5.4%) in the low‐dose and headache (8.9%) and toothache (3.6%) in high‐dose group were reported | In the valsartan study, 10% of patients had elevated creatinine and 4% patients had hyperkalaemia at some point during the study In the candesartan trial, 8 patients discontinued treatment. The reasons for discontinuation were hypotension, arm fracture, dizziness, headache, low white cell count and progression of underlying renal disease (2 patients) 2 patients in the mixed racial group in the olmesartan study discontinued treatment (1 patient because of hypertension and other due to hypoaesthesia) |
| Angiotensin receptor blocker < 6 years | Angiotensin receptor blocker was well tolerated in this age group with a low incidence of side effects and no adverse effect on growth | 2 significant adverse events were reported in the candesartan study (Schaefer 2010). 1 event was a death related to acute on chronic renal failure provoked by diarrhoea‐induced hypovolaemia and the second event was a vaso‐occlusive event which occurred in a child with nephrotic syndrome. The authors report that both events were not directly attributed to angiotensin receptor blocker use 1 participant each had pruritus and rash, decreased appetite and blurred vision in phase 1 of the valsartan study. In phase 2, 1 patient had headache and 1 hypertriglyceridaemia |
| Beta‐blocker | Headache (30%), upper respiratory infection (10%) and cough (19%) in the metoprolol study | Fatigue (9%) and dizziness (6%). 5 patients discontinued the metoprolol study in the open‐label period because of an adverse event (1 patient each for fatigue, nightmares, anxiety, dizziness and asthma) |
| Beta‐blocker + diuretic | No significant adverse effects reported |
|
| Calcium channel blocker | Headache (33%), respiratory infection (12%) and nausea (10%) were the common adverse events among children on extended‐release felodipine | Pedal oedema was noted in 2% of patients in the felodipine study and in ˜3.1% to 4.3% patients on amlodipine |
| Centrally acting α blocker versus diuretic | 14 of the 15 hydrochlorothiazide‐treated participants had a reduction in serum potassium. Symptomatic hypokalaemia in 4 participants requiring potassium supplementation in the hydrochlorothiazide group | Drowsiness and dry mouth in 1 patient on clonidine |
Six trials tested the safety of angiotensin receptor blockers in six to 16‐year olds (BMS 2005; Hazan 2010a; Hazan 2010b; Schaefer 2011; Shahinfar 2005; Trachtman 2008; Wells 2010; Wells 2011). Two of these trials had an extended 52‐week, open‐label phase after the short randomised phase (Trachtman 2008; Wells 2011).
Angiotensin receptor blockers were well tolerated with headache being the most commonly observed adverse event, affecting up to a third of participants. In the valsartan dose response study, 10% of patients had elevated creatinine and 4% of patients had hyperkalaemia at some point during the study (Wells 2011). Gastroenteritis (one patient) and hyperkalaemia (one patient) were the two serious adverse events considered to be related to valsartan (Wells 2011). In the patient with hyperkalaemia, serum potassium returned to normal two days after valsartan was discontinued (Wells 2011). In another trial comparing valsartan with enalapril, a total of seven patients (4.6%) in the valsartan group discontinued treatment because of adverse effects (Schaefer 2011). The reasons for discontinuation were nausea in two patients and arrhythmia, dehydration, dizziness, headache, vomiting and hyperkalaemia in one patient each. In the candesartan trial, three patients discontinued treatment in the dose‐ranging phase and five during the open‐label phase due to adverse events (Trachtman 2008). These adverse events included hypotension, arm fracture, dizziness, headache, low white blood cell count and progression of underlying renal disease (two patients) (Trachtman 2008).
The most common clinical adverse events reported in the losartan study were headache and upper respiratory tract infection (Shahinfar 2005). Only one patient discontinued the study because of a drug‐related clinical adverse event, namely mild reversible hypotension. Increased serum creatinine was reported in one patient in the medium‐dose group and hyperkalaemia was reported in one patient in the low‐dose group (Shahinfar 2005).
Most of the adverse events reported in the olmesartan study were mild to moderate in intensity, with more adverse events reported among non‐black patients compared to black patients (Hazan 2010a; Hazan 2010b). The most common adverse events were headache, pharyngo‐laryngeal pain and toothache. One patient discontinued treatment in the low‐dose group due to moderate hypoaesthesia, possibly related to drug therapy. Haematology, serum chemistry and urine analysis did not change significantly from baseline (Hazan 2010a; Hazan 2010b).
Three trials tested the safety of angiotensin receptor blockers (candesartan, losartan and valsartan) in children under six years old (Flynn 2008; Schaefer 2010; Webb 2013). The candesartan study was of four weeks duration whereas the valsartan study had a four‐week double‐blind phase followed by a 52‐week open‐label phase. Both studies reported that angiotensin receptor blockers were well tolerated in this age group with a low incidence of side effects and no adverse effect on growth. The candesartan trial reported two significant adverse events. One event was a death related to acute on chronic renal failure provoked by diarrhoea‐induced hypovolaemia and the second event was a vaso‐occlusive event which occurred in a child with nephrotic syndrome (Schaefer 2010). The authors report that both events were not directly attributed to angiotensin receptor blocker medication use.
Four trials tested the short‐term safety of angiotensin‐converting enzyme inhibitors in children aged six to 16 years (Li 2004; Schaefer 2011; Soffer 2003; Wells 2002). One study using fosinopril reported the incidence of drug‐related cough as 9.1% during the 52‐week long open‐label phase (Li 2004). None of the patients receiving lisinopril and only one out of 110 patients receiving enalapril were reported to have drug‐related cough (Soffer 2003; Wells 2002). In the valsartan versus enalapril trial, the incidence of serious adverse effects was low (1.7%) and similar in both groups (Schaefer 2011). Headache, cough and nasopharyngitis were the most common adverse events. There was no discontinuation secondary to adverse events in the enalapril group.
No cases of angioedema were reported in these four angiotensin‐converting enzyme inhibitor trials. Small increases in serum creatinine and blood urea nitrogen were observed but renal failure was not reported in any of the four trials. Importantly, the biochemical changes with angiotensin‐converting enzyme inhibitors, including hyperkalaemia and rise in creatinine, were usually transient and did not lead to discontinuation of treatment in most cases.
One trial examined the effect of the novel aldosterone antagonist eplerenone in four to 16‐year old children and reported adverse events in 50% or less of the participants (Li 2010). Most of these were of a mild nature and included headache and upper respiratory infections. Four children discontinued treatment, three of which were considered treatment‐related (hypotension, hypertension and fatigue). Serious adverse events were reported in eight (2.6%) of the children and included diarrhoea, sleep apnoea, syncope, pericarditis, pneumonia, arthritis, sepsis and pleural effusion. None of these events were considered related to the study drug. Eosinophilia was noted in 13% to 17% of children. The majority of these children had abnormal readings at baseline and were from developing countries where parasitic diseases may have a role to play.
Headache (33%), respiratory infection (12%) and nausea (10%) were the common adverse events among children on extended‐release felodipine (Trachtman 2003). Pedal oedema was noted in 2% of patients in the felodipine study and in ˜3.1% to 4.3% patients on amlodipine (Flynn 2004; Trachtman 2003). There were no serious biochemical abnormalities reported with calcium channel blockers.
In the study using extended‐release metoprolol, no significant adverse events were noted during the initial double‐blind, four‐week period (Batisky 2007). As expected, the mean heart rate was slowed by extended‐release metoprolol (maximum mean change ‐6.5 beats per minute at 1.0 mg/kg). The most common adverse events noted during the open‐label, 52‐week follow‐up were headache (30%), upper respiratory infection (10%), cough (19%), fatigue (9%) and dizziness (6%). Five patients discontinued the study during this period because of an adverse event such as fatigue, nightmares, anxiety, dizziness or asthma. With the beta‐blocker/thiazide combination, no significant drug‐related adverse events were noted compared to placebo (Sorof 2002). A drop in serum potassium levels was seen in 14/15 participants receiving hydrochlorothiazide (Falkner 1983). Four of these required potassium supplementation.
Adherence
Information on compliance was available for only seven of the 21 trials (30%), with four reported in the publication (Batisky 2007; Trachtman 2003) and three received via personal communication (Hazan 2010a; Hazan 2010b; Li 2004; Trachtman 2008). Information regarding compliance was gathered by pill count or volume of suspension remaining. Compliance was reported to be over 80% in these trials. Compliance was reported to be equal across all dose groups in Batisky 2007 and Li 2004. One study reported higher compliance (94%) in the placebo group compared to the felodipine treatment groups (84% to 91%) (Trachtman 2003). This was a negative study with multiple design issues and differential compliance may have contributed to the negative result. Similarly, compliance was higher in the placebo group (97%) compared to the active treatment group (93%) in Trachtman 2008. In the Hazan 2010 study, compliance was better among the mixed racial group population compared to the black population. In the mixed racial group (Hazan 2010a), compliance was 94% or more, whereas in the black cohort (Hazan 2010b) compliance was 85% or more for both dose groups (low‐ and high‐dose olmesartan), respectively.
Discussion
Summary of main results
Twenty‐one trials evaluated antihypertensive medications of various drug classes in a total of 3454 hypertensive children, with short periods of follow‐up ranging from three to 24 weeks (mean 7.2 weeks).
Drugs blocking the renin‐angiotensin system, calcium channel blockers, beta‐blockers, alpha blockers and diuretics are widely used forthe management of hypertension in children but there have been few trials (n = 5) comparing the antihypertensive agent directly against placebo. The majority of the remaining studies were dose‐finding and included three trials of angiotensin‐converting enzyme inhibitors (lisinopril, enalapril and fosinopril), seven trials of angiotensin receptor blockers (valsartan, candesartan, losartan, irbesartan and olmesartan), one trial of a calcium channel blocker (amlodipine) and one trial which used a selective aldosterone antagonist, eplerenone. Four trials compared different classes of antihypertensive medications: two compared calcium channel blockers to angiotensin receptor blockers, one compared a centrally acting alpha blocker with a diuretic and one compared an angiotensin‐converting enzyme inhibitor with an angiotensin receptor blocker.
We report that the use of candesartan led to a significant reduction in systolic (mean difference ‐6.50 mmHg, 95% CI ‐9.44 to ‐3.56) and diastolic blood pressure (mean difference ‐5.50 mmHg, 95% CI ‐9.62 to ‐1.38) when compared to a placebo. High dose telmisartan reduced systolic (mean difference ‐8.5, 95% CI ‐13.79 to ‐3.21) but not diastolic blood pressure (‐4.80, 95% CI ‐9.50 to 0.10). There was no consistent dose response relationship, however, escalating doses of angiotensin receptor blockers are consistent with pharmacokinetic studies demonstrating a flattening of the dose response curve at higher doses in adults (Taddei 2011). Absence of an expected linear dose response could also have resulted from trial design issues such as the use of small dose ranges. Three trials assessed angiotensin receptor blockers in children under six years and demonstrated that angiotensin receptor blockers were modestly effective in reducing systolic and diastolic blood pressure and generally well tolerated in young children.
Angiotensin‐converting enzyme inhibitors demonstrated a good reduction in systolic and diastolic blood pressure compared to baseline, although a consistent dose response relationship was again not evident when pooling the data. Absence of an expected linear dose response relationship may be due to a number of issues including trial design, with a narrow range of medication dosing among the three groups, imprecise mg/kg dosing, targeting systolic versus diastolic hypertension and relatively small sample sizes. Additionally, the pharmacokinetics of younger children may require more frequent or higher doses based on metabolism and dosing regimens were not specifically different than the reported adult regimens (Benjamin 2008).
Beta‐blockers are also commonly prescribed antihypertensive medications for children with known cardiac conditions and they are also used in neonatal intensive care units. However, they are not typically prescribed as first‐line agents for lowering blood pressure in those with primary or secondary hypertension. The drugs primarily reduce blood pressure by dampening beta effects such as lowering heart rate, decreasing sympathetic overactivity and vasodilatation. All effects are also beneficial in those with obesity, obstructive sleep apnoea and in children with cardiac disease. There is also a significant benefit of carvedilol in children with heart failure (Flynn 2011). We found very limited data, however, on their antihypertensive efficacy and safety in children. Only one study used a beta‐1 selective agent such as metoprolol (Batisky 2007). Metoprolol reduced systolic blood pressure by ˜4 mmHg but not diastolic blood pressure compared to placebo. In the beta‐blocker/thiazide (bisoprolol/hydrochlorothiazide) trial (Sorof 2002), the combination drug did not significantly reduce systolic blood pressure. It did significantly lower diastolic blood pressure by ˜4.5 mmHg. The efficacy of beta‐blockers in children is less than in adults which may reflect the concerns of increasing doses to effectively cause beta blockade and reduce the heart rate. Heart rate was reduced and medication was not escalated to achieve lower heart rates with adequate blockade. In addition, the small sample size and short duration of studies may have resulted in negative results. For example, in the metoprolol study only 49 children were assigned to the high‐dose group (2 mg/kg/day) and the full dose was achieved only for two weeks even though it was a four‐week study. Additionally, the combination beta‐blocker/thiazide study had a high drop‐out rate of 27% limiting the data for blood pressure changes. Only 25 patients in this study were escalated to the highest dose levels and did demonstrate a linear dose response. The authors also analysed the response based on the severity of initial hypertension and reported better response in those with severe hypertension at enrolment (systolic or diastolic blood pressure 5 mmHg or more above the 95th centile).
Even though calcium channel blockers are very commonly prescribed antihypertensive agents in paediatric patients, the evidence for their blood pressure‐lowering efficacy is limited. The blood pressure‐lowering efficacy of extended‐release felodipine was tested in one trial, and it failed to demonstrate a clinically significant reduction in either systolic or diastolic blood pressure (Trachtman 2003). In the amlodipine dose response trial, there was also no significant dose response for either systolic or diastolic blood pressure. The lack of blood pressure‐lowering response with calcium channel blockers, despite the widespread clinical use of these medications, could reflect the individual trial designs and potential methodological issues in the trials presented. For example, the patients on the extended‐release felodipine were only exposed to the highest dose of 10 mg for one week. There was also differential compliance in different dose groups which could impact on the overall decline in blood pressure from baseline to follow‐up. Patient selection included patients with both systolic and diastolic hypertension; however, only diastolic pressures were included in the primary endpoint. This may have under‐powered the study to demonstrate the antihypertensive efficacy of extended‐release felodipine in diastolic blood pressure reduction as more patients had elevated systolic blood pressure at study entry. The amlodipine study only had two dose groups of 2.5 and 5 mg so the dose range was very small to compare differences in effect. Additionally, this study did not use individual participant‐based dosing but gave all participants in the low‐dose arm 2.5 mg and all participants in the higher‐dose arm 5 mg, leading to inappropriate weight‐based dosing (Benjamin 2008).
There were very few studies which measured end organ damage outcomes such as proteinuria. Only two of the included studies reported the effect of angiotensin‐converting enzyme inhibitor/angiotensin receptor blockers on proteinuria (Schaefer 2010; Webb 2010), which were effective in reducing this. None of the included trials reported other surrogate markers of outcome such as the change in left ventricular hypertrophy, change in retinopathy or change in cardiac output, and systemic vascular resistance as measured by standardised bio‐impedance methods.
The ESCAPE trial (effect of strict blood pressure control and angiotensin‐converting enzyme inhibition on the progression of chronic renal failure in paediatric patients) did not fit the inclusion criteria of this review of the primary effect of the medication. It deserves a mention, however, since this is the only study to date which has looked at the impact of blood pressure control on the progression of kidney disease in children aged three to 18 years old with glomerular filtration rates (GFRs) of 15 to 80 ml/minute over a five‐year period (Wühl 2009). In this study, patients were randomly assigned to intensified blood pressure control (with a target 24‐hour mean arterial pressure below the 50th percentile) or to conventional blood pressure control (mean arterial pressure in the 50th to 95th percentile) using ramipril (6 mg/m2 body surface area/day) and additional medications to keep the blood pressure at target. A total of 385 children were randomised to the two groups. Fewer patients in the intensified control arm than in the conventional group reached the primary endpoint of a 50% decline in GFR or progression to end‐stage renal disease (29.9% versus 41.7%; hazard ratio = 0.65; 95% CI 0.44 to 0.94). This study demonstrated that the intensified blood pressure control is required to reduce end organ damage and, also, that it would take on average three medications to achieve the controlled blood pressure. We speculate that the amount of blood pressure reduction may be a more important determinant of improved outcomes in hypertensive children rather than the choice of antihypertensive agent per se. It has been shown in adult trials that better blood pressure control results in better risk reduction irrespective of drug class (ALLHAT 2002; Hansson 1999; Hansson 2000). Therefore it may be useful to compare the long‐term efficacy of different classes of drugs in reducing end organ damage using surrogate outcomes such as carotid intimal medial thickness, left ventricular hypertrophy, retinopathy and renal disease progression in hypertensive children.
Quality of the evidence
The main limitation of this review is the small number of trials conducted in children that could be included. Some studies were of sub‐optimal study quality and only a few compared a drug directly with placebo. Additionally, many of these studies were of short duration and there was paucity of data regarding the impact of blood pressure control on target organ damage. Furthermore, only one of the included studies used ABPM to guide therapy in the treatment arms in a subset of children (Schaefer 2011).
The results of the analyses are not robust enough to provide firm recommendations for first‐line agents in children with hypertension from primary or secondary causes. There is a suggestion, however, that those medications that act through the renin‐angiotensin pathway may lower blood pressure more than other pharmacological interventions.
Study flow diagram.
'Risk of bias' graph: review authors' judgements about each methodological quality item presented as percentages across all included studies.

'Risk of bias' summary: review authors' judgements about each risk of bias item for each included study.

Forest plot of comparison: 1 Antihypertensive drug class versus placebo, outcome: 1.1 Systolic blood pressure.
Forest plot of comparison: 1 Antihypertensive drug class versus placebo, outcome: 1.2 Diastolic blood pressure.

Forest plot of comparison: 2 Drug different doses, outcome: 2.1 SBP.

Forest plot of comparison: 2 Drug different doses, outcome: 2.2 DBP.

Comparison 1 Antihypertensive drug class versus placebo, Outcome 1 Systolic blood pressure.
Comparison 1 Antihypertensive drug class versus placebo, Outcome 2 Diastolic blood pressure.

Comparison 2 Antihypertensive drug dose response, Outcome 1 Systolic blood pressure.
Comparison 2 Antihypertensive drug dose response, Outcome 2 Diastolic blood pressure.
| Antihypertensive drug class compared to placebo for hypertension in children: systolic blood pressure reduction | ||||
| Patient or population: children (from 1 to 18 years of age) with hypertension from primary or secondary causes | ||||
| Outcomes | Magnitude of reduction in systolic blood pressuremmHg in treatment group minus placebo response Mean difference with 95% CI | No of participants | Quality of the evidence | Comments |
| Angiotensin receptor blocker (any dose) Mean duration of 4 weeks | ‐6.50 (‐9.44 to ‐3.56) | 240 | ⊕⊝⊝⊝ | Refer 1 , 2 , 4 and 5 below. |
| Beta‐blocker (any dose) | ‐4.20 (‐8.12 to ‐0.28) | 140 | ⊕⊝⊝⊝ Very low | Refer 1 to 5 below. |
| Calcium channel blocker (any dose) | ‐0.62 (‐2.97 to 1.73) | 133 | ⊕⊝⊝⊝ | Refer 1 to 5 below. |
| Beta‐blocker/thiazide combination (any dose) Mean duration of 10 weeks | ‐4.40 (‐8.99 to 0.19) | 94 | ⊕⊝⊝⊝ | Refer 1 to 5 below. |
| *The basis for the assumed risk (e.g. the median control group risk across studies) is provided in footnotes. The corresponding risk (and its 95% confidence interval) is based on the assumed risk in the comparison group and the relative effect of the intervention (and its 95% CI). | ||||
| GRADE Working Group grades of evidence Comments: 1. Evidence based on only one study. 2. “Industry‐funded study. Industry‐funded studies are at risk of over‐estimating effect size.” 3. “Wide confidence interval.” 4. “High risk of publication bias.” 5. “Unclear method of randomisation and allocation concealment”. | ||||
| Antihypertensive drug class compared to placebo for hypertension in children: diastolic blood pressure reduction | ||||
| Patient or population: children (from 1 to 18 years of age) with hypertension from primary or secondary causes | ||||
| Outcomes | Magnitude of reduction in diastolic blood pressure mmHg in treatment group minus placebo response Mean difference with 95% CI | No of participants | Quality of the evidence | Comments |
| Angiotensin receptor blocker (any dose) Mean duration of 4 weeks | ‐5.50 (‐9.62 to ‐1.38) | 240 | ⊕⊝⊝⊝ | Refer to 1, 2, 4 and 5 below. |
| Beta‐blocker (any dose) | ‐3.20 (‐7.12 to 0.72) | 140 | ⊕⊝⊝⊝ | Refer to 1 to 5 below. |
| Calcium channel blocker (any dose) | ‐1.86 (‐5.23 to 1.51) | 133 | ⊕⊝⊝⊝ | Refer to 1 to 5 below. |
| Beta‐blocker/thiazide combination (any dose) Mean duration of 10 weeks | ‐4.5 (‐8.26 to ‐0.74) | 94 | ⊕⊝⊝⊝ | Refer to 1 to 5 below. |
| *The basis for the assumed risk (e.g. the median control group risk across studies) is provided in footnotes. The corresponding risk (and its 95% confidence interval) is based on the assumed risk in the comparison group and the relative effect of the intervention (and its 95% CI). | ||||
| GRADE Working Group grades of evidence Comments: 1. Evidence based on only one study. 2. “Industry‐funded study. Industry‐funded studies are at risk of over‐estimating effect size.” 3. “Wide confidence interval.” 4. “High risk of publication bias.” 5. “Unclear method of randomisation and allocation concealment”. | ||||
| Angiotensin receptor blocker for hypertension in children: dose response in systolic blood pressure | ||||
| Patient or population: children (from 1 to 18 years of age) with hypertension from primary or secondary causes | ||||
| Outcomes | Magnitude of reduction in systolic blood pressure mmHg in treatment group at various dose comparisons Mean difference with 95% CI | No of participants | Quality of the evidence | Comments |
| Angiotensin receptor blocker >/= 6 years | ||||
| Angiotensin receptor blocker (high‐ versus low‐dose) | ‐4.16 (‐5.47 to ‐2.86) | 418 (5 studies) | ⊕⊕⊝⊝ | Refer to 1 and 3 below. |
| Angiotensin receptor blocker (high‐ versus medium‐dose) | ‐0.46 (‐2.44 to 1.53) | 237 (3 studies) | ⊕⊝⊝⊝ | Refer to 1 to 3 below. |
| Angiotensin receptor blocker (medium‐ versus low‐dose) | ‐3.13 (‐5.43 to ‐0.83) | 160 (3 studies) | ⊕⊝⊝⊝ | Refer to 1 and 3 below. |
| Angiotensin receptor blocker < 6 years | ||||
| Angiotensin receptor blocker (high‐ versus low‐dose) | ‐3.01 (‐8.79 to 2.76) | 67 (2 studies) | ⊕⊝⊝⊝ Very Low | Refer to 1 to 3 below. |
| Angiotensin receptor blocker (high‐ versus medium‐dose) | ‐1.76 (‐4.80 to 1.29) | 67 (2 studies) | ⊕⊝⊝⊝ Very Low | Refer to 1 to 3 below. |
| Angiotensin receptor blocker (medium‐ versus low‐dose) | ‐1.32 (‐4.54 to 1.90) | 50 (2 studies) | ⊕⊝⊝⊝ Very Low | Refer to 1 to 3 below. |
| *The basis for the assumed risk (e.g. the median control group risk across studies) is provided in footnotes. The corresponding risk (and its 95% confidence interval) is based on the assumed risk in the comparison group and the relative effect of the intervention (and its 95% CI). | ||||
| GRADE Working Group grades of evidence Comments: 1. “Industry‐funded study. Industry‐funded studies are at risk of over‐estimating effect size.” 2. “Wide confidence interval.” 3. “Unclear method of randomisation and allocation concealment in some studies”. | ||||
| Angiotensin receptor blocker for hypertension in children: dose response in diastolic blood pressure | ||||
| Patient or population: children (from 1 to 18 years of age) with hypertension from primary or secondary causes | ||||
| Outcomes | Magnitude of reduction in diastolic blood pressuremmHg in treatment group at various dose comparisons Mean difference with 95% CI | No of participants | Quality of the evidence | Comments |
| Angiotensin receptor blocker >/= 6 years | ||||
| High‐ versus low‐dose | ‐3.48 (‐5.00 to ‐1.95) | 418 (5 studies) | ⊕⊕⊝⊝ | Evidence based on 5 reasonable quality studies. Refer to comments 1 and 3. |
| High‐ versus medium‐dose | ‐0.59 (‐2.49 to 1.32) | 237 (3 studies) | ⊕⊝⊝⊝ | Refer to comments 1 to 3. |
| Medium‐ versus low‐dose | ‐3.04 (‐5.67to ‐0.40) | 160 (3 studies) | ⊕⊝⊝⊝ | Refer to comments 1 and 3. |
| Angiotensin receptor blocker < 6 years | ||||
| High‐ versus low‐dose | ‐2.85 (‐8.63 to 2.92) | 67 (2 studies) | ⊕⊝⊝⊝ Very low | Refer to comments 1 to 3. |
| High‐ versus medium‐dose | ‐0.56 (‐4.42 to 3.29) | 67 (2 studies) | ⊕⊝⊝⊝ Very low | Refer to comments 1 to 3. |
| Medium‐ versus low‐dose | ‐1.31 (‐3.74 to 1.12) | 50 (2 studies) | ⊕⊝⊝⊝ Very low | Refer to comments 1 to 3. |
| *The basis for the assumed risk (e.g. the median control group risk across studies) is provided in footnotes. The corresponding risk (and its 95% confidence interval) is based on the assumed risk in the comparison group and the relative effect of the intervention (and its 95% CI). | ||||
| GRADE Working Group grades of evidence Comments: 1. “Industry‐funded study. Industry‐funded studies are at risk of over‐estimating effect size.” 2. “Wide confidence interval.” 3. “Unclear method of randomisation and allocation concealment in some studies”. | ||||
| Angiotensin converting enzyme inhibitor for hypertension in children: dose response in systolic blood pressure | ||||
| Patient or population: children (from 1 to 18 years of age) with hypertension from primary or secondary causes | ||||
| Outcomes | Magnitude of reduction in systolic blood pressure mmHg in treatment group at various dose comparisons Mean difference with 95% CI | No of participants | Quality of the evidence | Comments |
| Angiotensin‐converting enzyme inhibitor | ||||
| High‐ versus low‐dose | ‐5.20 (‐10.46 to 0.06) | 187 (3 studies) | ⊕⊝⊝⊝ Very Low | Refer to 1 to 3 below. |
| High‐ versus medium‐ dose | ‐2.72 (‐5.83 to 0.40) | 187 (3 studies) | ⊕⊝⊝⊝ Very Low | Refer to 1 to 3 below. |
| Medium‐ versus low‐dose | ‐2.01 (‐6.07 to 2.05) | 139 (3 studies) | ⊕⊝⊝⊝ Very Low | Refer to 1 to 3 below. |
| *The basis for the assumed risk (e.g. the median control group risk across studies) is provided in footnotes. The corresponding risk (and its 95% confidence interval) is based on the assumed risk in the comparison group and the relative effect of the intervention (and its 95% CI). | ||||
| GRADE Working Group grades of evidence Comments: 1. “Industry‐funded study. Industry‐funded studies are at risk of over‐estimating effect size.” 2. “Wide confidence interval.” 3. “Unclear method of randomisation and allocation concealment in some studies”. | ||||
| Angiotensin converting enzyme inhibitor for hypertension in children: dose response in diastolic blood pressure | ||||
| Patient or population: children (from 1 to 18 years of age) with hypertension from primary or secondary causes | ||||
| Outcomes | Magnitude of reduction in diastolic blood pressuremmHg in treatment group at various dose comparisons Mean difference with 95% CI | No of participants | Quality of the evidence | Comments |
| High‐ versus low‐dose | ‐5.81 (‐11.87 to 0.26) | 187 (3 studies) | ⊕⊝⊝⊝ Very Low | Refer comments 1 to 3. |
| High‐ versus medium‐dose | ‐4.31 (‐8.59 to ‐0.03) | 187 (3 studies) | ⊕⊝⊝⊝ Very Low | Refer comments 1 to 3. |
| Medium‐ versus low‐dose | ‐0.46 (‐2.19 to 1.27) | 139 (3 studies) | ⊕⊝⊝⊝ Very Low | Refer comments 1 to 3. |
| *The basis for the assumed risk (e.g. the median control group risk across studies) is provided in footnotes. The corresponding risk (and its 95% confidence interval) is based on the assumed risk in the comparison group and the relative effect of the intervention (and its 95% CI). | ||||
| GRADE Working Group grades of evidence Comments: 1. “Industry‐funded study. Industry‐funded studies are at risk of over‐estimating effect size.” 2. “Wide confidence interval.” 3. “Unclear method of randomisation and allocation concealment in some studies”. | ||||
| Calcium channel blocker for hypertension in children: dose response in systolic and diastolic blood pressure | ||||
| Patient or population: children (from 1 to 18 years of age) with hypertension from primary or secondary causes | ||||
| Outcomes | Magnitude of reduction in systolic blood pressure mmHg in treatment group at various dose comparisons Mean difference with 95% CI | No of participants | Quality of the evidence | Comments |
| High vs low dose Systolic blood pressure | ‐1.7 (‐4.43 to 1.03) | 141 (1 study) | ⊕⊝⊝⊝ Very Low | Refer to 1 to 5 below. |
| High vs low dose Diastolic blood pressure | ‐0.70 (‐2.63 to 1.29) | 141 (1 study) | ⊕⊝⊝⊝ Very Low | Refer comments from 1 to 5. Only 2 doses were studied. Dose was not based on child's weight. |
| *The basis for the assumed risk (e.g. the median control group risk across studies) is provided in footnotes. The corresponding risk (and its 95% confidence interval) is based on the assumed risk in the comparison group and the relative effect of the intervention (and its 95% CI). | ||||
| GRADE Working Group grades of evidence Comments: 1. Evidence based on only one study. 2. “Industry‐funded study. Industry‐funded studies are at risk of over‐estimating effect size.” 3. “Wide confidence interval.” 4. “High risk of publication bias.” 5. “Unclear method of randomisation and allocation concealment”. | ||||
| Study | n | Systolic blood pressure: | SD | 95% CI | Diastolic blood pressure: | SD | 95% CI | |
| Angiotensin receptor blocker | ||||||||
| Trachtman 2008 (candesartan) | ||||||||
| Low (0.05 mg/kg) | 69 | ‐8.50 | 8.00 | ‐10.39 to ‐6.61 | ‐5.30 | 9.1 | ‐7.45 to ‐3.15 | |
| Medium (0.2 mg/kg) | 68 | ‐10.80 | 9.60 | ‐13.08 to ‐8.52 | ‐7.60 | 10.2 | ‐10.02 to ‐5.18 | |
| High (0.4 mg/kg) | 68 | ‐11.30 | 10.80 | ‐13.87 to ‐8.73 | ‐7.00 | 9.9 | ‐9.35 to ‐4.65 | |
| Placebo | 35 | ‐3.80 | 7.80 | ‐6.38 to ‐1.22 | ‐1.30 | 11.5 | ‐5.11 to 2.51 | |
| Wells 2010 (telmisartan) | ||||||||
| Low (1 mg/kg) | 28 | ‐9.00 | 7.80 | ‐6.10 to ‐11.90 | ‐7.70 | 9.60 | ‐4.10 to ‐11.30 | |
| High (2 mg/kg) | 31 | ‐13.00 | 8.70 | ‐9.90 to ‐16.10 | ‐7.80 | 8.10 | ‐4.90 to ‐10.70 | |
| Placebo | 14 | ‐4.70 | 10.70 | +0.90 to ‐10.30 | ‐2.90 | 7.60 | +1.10 to ‐6.90 | |
| Beta‐blocker | ||||||||
| Batisky 2007 (metoprolol) | ||||||||
| Low (0.2 mg/kg) | 45 | ‐5.20 | 8.70 | ‐7.70 to ‐2.60 | ‐3.10 | 8.90 | ‐5.70 to ‐0.50 | |
| Medium (1 mg/kg) | 23 | ‐7.70 | 8.60 | ‐11.30 to ‐4.00 | ‐4.90 | 8.90 | ‐8.60 to ‐1.30 | |
| High (2 mg/kg) | 49 | ‐6.30 | 9.00 | ‐8.70 to ‐3.80 | ‐7.50 | 8.90 | ‐10.00 to ‐5.00 | |
| Placebo | 23 | ‐1.90 | 8.90 | ‐5.50 to 1.80 | ‐2.10 | 8.80 | ‐5.70 to 1.50 | |
| Combination | ||||||||
| Sorof 2002 (bisoprolol/hydrochlorothiazide) | ||||||||
| Bisoprolol 10 mg/hydrochlorothiazide 6.25 mg | 62 | ‐9.30 | 11.81 | ‐12.24 to ‐6.36 | ‐7.20 | 9.45 | ‐9.55 to ‐4.85 | |
| Placebo | 32 | ‐4.90 | 10.18 | ‐8.43 to ‐1.37 | ‐2.70 | 8.49 | ‐5.64 to 0.24 | |
| Calcium channel blocker | ||||||||
| Trachtman 2003 (felodipine extended‐release) | Placebo corrected | Placebo corrected | ||||||
| Low (2.5 mg) | 33 | ‐0.71 | 11.99 | ‐4.80 to 3.38 | ‐2.07 | 13.94 | ‐6.82 to 2.69 | |
| Medium (5 mg) | 34 | ‐0.06 | 11.80 | ‐4.60 to 3.33 | ‐4.64 | 13.79 | ‐9.18 to 0.09 | |
| High (10 mg) | 31 | ‐1.13 | 11.86 | ‐5.30 to 3.05 | +1.31 | 13.73 | ‐3.56 to 6.11 | |
| CI: confidence interval; SD: standard deviation. All doses mentioned are: per day | ||||||||
| Study | n | Systolic blood pressure: | SD | 95% CI | Diastolic blood pressure: | SD | 95% CI |
| ≥ 6 years of age | |||||||
| Shahinfar 2005 (losartan) | |||||||
| Low (0.07 mg/kg) | 70 | ‐4.40 | 7.60 | ‐6.20 to ‐2.60 | ‐6.00 | 7.60 | ‐7.80 to ‐4.20 |
| Medium (0.75 mg/kg) | 40 | ‐10.00 | 9.10 | ‐12.90 to ‐7.10 | ‐11.70 | 9.10 | ‐14.60 to ‐8.80 |
| High (1.44 mg/kg) | 64 | ‐8.60 | 9.50 | ‐11.00 to ‐6.30 | ‐12.20 | 8.90 | ‐14.40 to ‐10.00 |
| Wells 2011 (valsartan) | |||||||
| Low (0.4 mg/kg) | 102 | ‐7.90 | 10.40 | ‐9.92 to ‐5.88 | ‐4.60 | 11.00 | ‐6.72 to ‐2.48 |
| Medium (1.3 mg/kg) | 52 | ‐9.60 | 9.10 | ‐12.07 to ‐7.13 | ‐5.80 | 8.90 | ‐8.22 to ‐3.38 |
| High (2.7 mg/kg) | 105 | ‐11.50 | 11.20 | ‐13.64 to ‐9.36 | ‐7.40 | 9.50 | ‐9.22 to ‐5.58 |
| Hazan 2010a* (olmesartan) | |||||||
| Low (2.5/5 mg) | 95 | ‐7.80 | 9.18 | ‐9.66 to ‐5.94 | ‐5.50 | 8.06 | ‐7.15 to ‐3.89 |
| High (20/40 mg) | 95 | ‐12.60 | 10.15 | ‐14.65 to ‐10.55 | ‐9.50 | 9.76 | ‐11.47 to ‐7.53 |
| Hazan 2010b* (olmesartan) | |||||||
| Low (2.5/5 mg) | 56 | ‐4.70 | 11.48 | ‐7.71 to ‐1.69 | ‐3.50 | 8.84 | ‐1.18 to ‐5.82 |
| High (20/40 mg) | 56 | ‐10.70 | 9.26 | ‐13.13 to ‐8.27 | ‐7.60 | 8.17 | ‐5.46 to ‐9.74 |
| BMS 2005 (irbesartan) | |||||||
| Low (0.5 mg/kg) | 106 | ‐11.7 | ‐ | ‐ | ‐3.80 | ‐ | ‐ |
| Medium (1.5 mg/kg) | 106 | ‐9.30 | ‐ | ‐ | ‐3.20 | ‐ | ‐ |
| High (4.5 mg/kg) | 106 | ‐13.30 | ‐ | ‐ | ‐6.60 | ‐ | ‐ |
| < 6 years of age | |||||||
| Schaefer 2010 (candesartan) | |||||||
| Low (0.05 mg/kg) | 29 | ‐6.00 | 9.40 | ‐9.42 to ‐2.58 | ‐5.20 | 6.70 | ‐7.64 to ‐2.76 |
| Medium (0.2 mg/kg) | 32 | ‐8.90 | 9.20 | ‐12.09 to ‐5.71 | ‐7.90 | 12.90 | ‐12.37 to ‐3.43 |
| High (0.4 mg/kg) | 32 | ‐12.10 | 8.30 | ‐14.98 to ‐9.22 | ‐11.10 | 9.20 | ‐14.29 to ‐7.91 |
| Flynn 2008 (valsartan) | |||||||
| Low (5/10 mg) | 37 | ‐8.40 | 8.44 | ‐11.12 to ‐5.68 | ‐5.50 | 6.06 | ‐7.45 to ‐3.55 |
| Medium (20/40 mg) | 18 | ‐8.30 | 7.63 | ‐11.82 to ‐4.78 | ‐6.40 | 4.23 | ‐8.35 to ‐4.45 |
| High (40/80 mg) | 35 | ‐8.60 | 7.55 | ‐11.10 to ‐6.10 | ‐5.50 | 8.47 | ‐8.31 to ‐2.69 |
| Webb 2013 (losartan) | |||||||
| Low (0.1 mg/kg) | 33 | ‐7.30 | ‐ | ‐ | ‐8.20 | ‐ | ‐ |
| Medium (0.3 mg/kg) | 34 | ‐7.60 | ‐ | ‐ | ‐5.10 | ‐ | ‐ |
| High (0.7 mg/kg) | 32 | ‐6.70 | ‐ | ‐ | ‐6.70 | ‐ | ‐ |
| *Hazan 2010 study stratified study population into 2 cohorts (cohort A, 62% white; cohort B, 100% black). Cohort A was termed Hazan 2010a and Cohort B was termed Hazan 2010b. All doses mentioned are per day. CI: confidence interval; SD: standard deviation | |||||||
| Study | n | Systolic blood pressure: | SD | 95% CI | Diastolic blood pressure: | SD | 95% CI |
| Angiotensin‐converting enzyme inhibitors | |||||||
| Wells 2002 (enalapril) | |||||||
| Low (0.02 mg/kg) | 30 | ‐7.10 | 9.30 | ‐10.60 to ‐3.60 | ‐6.30 | 7.80 | ‐9.20 to ‐3.40 |
| Medium (0.08 mg/kg) | 29 | ‐6.60 | 10.10 | ‐10.40 to ‐2.80 | ‐8.90 | 8.70 | ‐12.20 to ‐5.60 |
| High (0.58 mg/kg) | 50 | ‐12.50 | 11.70 | ‐15.80 to ‐9.20 | ‐14.90 | 8.70 | ‐17.40 to ‐12.40 |
| Li 2004 (fosinopril) | |||||||
| Low (0.1 mg/kg) | 73 | ‐10.90 | 10.25 | ‐13.20 to ‐8.60 | ‐4.50 | 6.84 | ‐6.00 to ‐3.00 |
| Medium (0.3 mg/kg) | 86 | ‐11.30 | 10.25 | ‐13.40 to ‐9.10 | ‐4.20 | 6.49 | ‐5.70 to ‐2.80 |
| High (0.6 mg/kg) | 79 | ‐11.90 | 9.78 | ‐14.20 to ‐9.70 | ‐5.10 | 7.11 | ‐6.60 to ‐3.60 |
| Soffer 2003 (lisinopril) | |||||||
| Low (0.02 mg/kg) | 33 | ‐5.40 | 9.90 | ‐9.00 to ‐1.90 | ‐7.60 | 9.30 | ‐10.90 to ‐4.30 |
| Medium (0.07 mg/kg) | 24 | ‐12.10 | 9.10 | ‐16.00 to ‐8.30 | ‐9.30 | 8.70 | ‐13.00 to ‐5.70 |
| High (0.61 mg/kg) | 58 | ‐15.20 | 12.10 | ‐18.40 to ‐12.00 | ‐16.40 | 11.70 | ‐19.50 to 13.30 |
| Selective aldosterone receptor blocker | |||||||
| Li 2011 (eplerenone) | |||||||
| Low (25 mg) | 58 | ‐7.66 | ‐ | ‐ | ‐3.80 | ‐ | ‐ |
| Medium (50 mg) | 62 | ‐7.84 | ‐ | ‐ | ‐2.70 | ‐ | ‐ |
| High (100 mg) | 184 | ‐7.99 | ‐ | ‐ | ‐3.05 | ‐ | ‐ |
| Calcium channel blocker | |||||||
| Flynn 2004 (amlodipine) | |||||||
| Low (2.5 mg) | 127 | ‐7.3 | 11.4 | ‐9.3 to ‐5.3 | ‐3.7 | 8.3 | ‐5.1 to ‐2.3 |
| High (5 mg) | 141 | ‐9.0 | 11.4 | ‐10.9 to ‐7.1 | ‐4.4 | 8.3 | ‐5.8 to ‐3.0 |
| *Angiotensin receptor blocker versus angiotensin‐converting enzyme inhibitor | |||||||
| Schaefer 2011 | |||||||
| Valsartan (80/160/320 mg) | 148 | ‐15.40 | ‐ | ‐ | ‐9.40 | ‐ | ‐ |
| Enalapril (10/20/40 mg) | 148 | ‐14.10 | ‐ | ‐ | ‐8.50 | ‐ | ‐ |
| Calcium channel blockers versus angiotensin receptor blockers | |||||||
| Webb 2010 (amlodipine versuslosartan) | |||||||
| Amlodipine (0.05 to 0.2 mg/kg) | 30 | ‐0.10 | ‐ | ‐ | ‐0.80 | ‐ | ‐ |
| Losartan (0.7 to 1.4mg/kg) | 30 | ‐5.50 | ‐ | ‐ | ‐3.40 | ‐ | ‐ |
| Gartenmann 2003 (amlodipine versusirbesartan) | Median change from baseline | Range | Median change from baseline | Range | |||
| Amlodipine (20 to 40 kg: 5 to 10 mg; > 40 kg: 10 to 20 mg) | 11 | 12.00 | 10.00 to 14.00 | 7.00 | 5.00 to 10.00 | ||
| Irbesartan (20 to 40 kg: 75 to 150 mg; > 40 kg: 150 to 300 mg) | 13 | 13.00 | 9 to 16 | 9.00 | 7.00 to 11.00 | ||
| Alpha blocker versus diuretic, Falkner 1981 (clonidine versus hydrochlorothiazide) | |||||||
| Clonidine | Mean BP | SD | Mean BP | SD | |||
| Pre | 15 | 146 | 16.00 | 138 to 154 | 96 | 6.00 | 93 to 99 |
| Low (0.1 mg twice) | 136 | 13.00 | 129 to 143 | 89 | 8.00 | 85 to 93 | |
| High (0.2 mg twice) | 136 | 8.00 | 132 to 140 | 88 | 5.00 | 85 to 91 | |
| Hydrochlorothiazide | |||||||
| Pre | 15 | 145 | 6.00 | 142 to 148 | 97 | 8.00 | 93 to 101 |
| Low (25 mg twice) | 139 | 10.00 | 134 to 144 | 94 | 6.00 | 91 to 97 | |
| High (50 mg twice) | 135 | 11.00 | 129 to 141 | 93 | 8.00 | 89 to 97 | |
| All doses mentioned are per day | |||||||
| BP: blood pressure; CI: confidence interval; SD: standard deviation | |||||||
| Drugs | Common side effects | Less common side effects |
| Angiotensin‐converting enzyme inhibitor | Headache (20.1%), nasopharyngitis (9.6%), cough (9.1%) with fosinopril Dizziness was the most common side effect in the enalapril study (4 patients, followed by cough (3 patients) and headache (2 patients). No angioedema reported in any of the 3 trials | Low‐dose lisinopril ‐ 1 patient developed leucopenia and another patient had elevated creatinine. High‐dose lisinopril: 1 patient developed hyperkalaemia and another had elevated creatinine In the fosinopril study: elevated creatinine was the most frequent lab abnormality (drug versus placebo 8.9% versus 4.1%). All elevations were transient and did not exceed the upper limit of normal None of the patients in the enalapril study experienced renal failure or hyperkalaemia |
| Angiotensin receptor blocker in > 6 years | Headache was reported in 33.2% of children in the valsartan study and in 5.4% to 14.7% of children in the olmesartan study The most common side effects in the candesartan trial were headache, upper respiratory infection, dizziness, cough and sore throat The olmesartan study reported headache (7.4%) and pharyngo‐laryngeal pain (6.3%) in the low‐dose group and headache (14.7%) and dizziness (9.5%) in the high‐dose group among the mixed racial cohort. Among the black patients, headache (5.4%) in the low‐dose and headache (8.9%) and toothache (3.6%) in high‐dose group were reported | In the valsartan study, 10% of patients had elevated creatinine and 4% patients had hyperkalaemia at some point during the study In the candesartan trial, 8 patients discontinued treatment. The reasons for discontinuation were hypotension, arm fracture, dizziness, headache, low white cell count and progression of underlying renal disease (2 patients) 2 patients in the mixed racial group in the olmesartan study discontinued treatment (1 patient because of hypertension and other due to hypoaesthesia) |
| Angiotensin receptor blocker < 6 years | Angiotensin receptor blocker was well tolerated in this age group with a low incidence of side effects and no adverse effect on growth | 2 significant adverse events were reported in the candesartan study (Schaefer 2010). 1 event was a death related to acute on chronic renal failure provoked by diarrhoea‐induced hypovolaemia and the second event was a vaso‐occlusive event which occurred in a child with nephrotic syndrome. The authors report that both events were not directly attributed to angiotensin receptor blocker use 1 participant each had pruritus and rash, decreased appetite and blurred vision in phase 1 of the valsartan study. In phase 2, 1 patient had headache and 1 hypertriglyceridaemia |
| Beta‐blocker | Headache (30%), upper respiratory infection (10%) and cough (19%) in the metoprolol study | Fatigue (9%) and dizziness (6%). 5 patients discontinued the metoprolol study in the open‐label period because of an adverse event (1 patient each for fatigue, nightmares, anxiety, dizziness and asthma) |
| Beta‐blocker + diuretic | No significant adverse effects reported |
|
| Calcium channel blocker | Headache (33%), respiratory infection (12%) and nausea (10%) were the common adverse events among children on extended‐release felodipine | Pedal oedema was noted in 2% of patients in the felodipine study and in ˜3.1% to 4.3% patients on amlodipine |
| Centrally acting α blocker versus diuretic | 14 of the 15 hydrochlorothiazide‐treated participants had a reduction in serum potassium. Symptomatic hypokalaemia in 4 participants requiring potassium supplementation in the hydrochlorothiazide group | Drowsiness and dry mouth in 1 patient on clonidine |
| Outcome or subgroup title | No. of studies | No. of participants | Statistical method | Effect size |
| 1 Systolic blood pressure Show forest plot | 5 | Mean Difference (Random, 95% CI) | Totals not selected | |
| 1.1 ARB (any dose) | 1 | Mean Difference (Random, 95% CI) | 0.0 [0.0, 0.0] | |
| 1.2 ARB (high‐dose versus placebo) | 2 | Mean Difference (Random, 95% CI) | 0.0 [0.0, 0.0] | |
| 1.3 ARB (medium‐dose versus placebo) | 1 | Mean Difference (Random, 95% CI) | 0.0 [0.0, 0.0] | |
| 1.4 ARB (low‐dose versus placebo) | 2 | Mean Difference (Random, 95% CI) | 0.0 [0.0, 0.0] | |
| 1.5 BB (any dose) | 1 | Mean Difference (Random, 95% CI) | 0.0 [0.0, 0.0] | |
| 1.6 BB (high‐dose versus placebo) | 1 | Mean Difference (Random, 95% CI) | 0.0 [0.0, 0.0] | |
| 1.7 BB (medium‐dose versus placebo) | 1 | Mean Difference (Random, 95% CI) | 0.0 [0.0, 0.0] | |
| 1.8 BB (low‐dose versus placebo) | 1 | Mean Difference (Random, 95% CI) | 0.0 [0.0, 0.0] | |
| 1.9 CCB (any dose) | 1 | Mean Difference (Random, 95% CI) | 0.0 [0.0, 0.0] | |
| 1.10 CCB (high‐dose versus placebo) | 1 | Mean Difference (Random, 95% CI) | 0.0 [0.0, 0.0] | |
| 1.11 CCB (medium‐dose versus placebo) | 1 | Mean Difference (Random, 95% CI) | 0.0 [0.0, 0.0] | |
| 1.12 CCB (low‐dose versus placebo) | 1 | Mean Difference (Random, 95% CI) | 0.0 [0.0, 0.0] | |
| 1.13 BB/thiazide combination (any dose) versus placebo | 1 | Mean Difference (Random, 95% CI) | 0.0 [0.0, 0.0] | |
| 2 Diastolic blood pressure Show forest plot | 5 | Mean Difference (Random, 95% CI) | Totals not selected | |
| 2.1 ARB (any dose) | 1 | Mean Difference (Random, 95% CI) | 0.0 [0.0, 0.0] | |
| 2.2 ARB (high‐dose versus placebo) | 2 | Mean Difference (Random, 95% CI) | 0.0 [0.0, 0.0] | |
| 2.3 ARB (medium‐dose versus placebo) | 1 | Mean Difference (Random, 95% CI) | 0.0 [0.0, 0.0] | |
| 2.4 ARB (low‐dose versus placebo) | 2 | Mean Difference (Random, 95% CI) | 0.0 [0.0, 0.0] | |
| 2.5 BB (any dose) | 1 | Mean Difference (Random, 95% CI) | 0.0 [0.0, 0.0] | |
| 2.6 BB (high‐dose versus placebo) | 1 | Mean Difference (Random, 95% CI) | 0.0 [0.0, 0.0] | |
| 2.7 BB (medium‐dose versus placebo) | 1 | Mean Difference (Random, 95% CI) | 0.0 [0.0, 0.0] | |
| 2.8 BB (low‐dose versus placebo) | 1 | Mean Difference (Random, 95% CI) | 0.0 [0.0, 0.0] | |
| 2.9 CCB (any dose) | 1 | Mean Difference (Random, 95% CI) | 0.0 [0.0, 0.0] | |
| 2.10 CCB (high‐dose versus placebo) | 1 | Mean Difference (Random, 95% CI) | 0.0 [0.0, 0.0] | |
| 2.11 CCB (medium‐dose versus placebo) | 1 | Mean Difference (Random, 95% CI) | 0.0 [0.0, 0.0] | |
| 2.12 CCB (low‐dose versus placebo) | 1 | Mean Difference (Random, 95% CI) | 0.0 [0.0, 0.0] | |
| 2.13 BB/thiazide diuretic (any dose) | 1 | Mean Difference (Random, 95% CI) | 0.0 [0.0, 0.0] | |
| Outcome or subgroup title | No. of studies | No. of participants | Statistical method | Effect size |
| 1 Systolic blood pressure Show forest plot | 12 | Mean Difference (IV, Random, 95% CI) | Subtotals only | |
| 1.1 ARB (high‐ versus low‐dose), age ≥ 6 years | 6 | 837 | Mean Difference (IV, Random, 95% CI) | ‐4.16 [‐5.47, ‐2.86] |
| 1.2 ARB (high‐ versus medium‐dose), age ≥ 6 years | 3 | 397 | Mean Difference (IV, Random, 95% CI) | ‐0.46 [‐2.44, 1.53] |
| 1.3 ARB (medium‐ versus low‐dose), age ≥ 6 years | 3 | 401 | Mean Difference (IV, Random, 95% CI) | ‐3.13 [‐5.43, ‐0.83] |
| 1.4 ARB (high‐ versus low‐dose), age < 6 years | 2 | 133 | Mean Difference (IV, Random, 95% CI) | ‐3.01 [‐8.79, 2.76] |
| 1.5 ARB (high‐ versus medium‐dose), age < 6 years | 2 | 117 | Mean Difference (IV, Random, 95% CI) | ‐1.76 [‐4.80, 1.29] |
| 1.6 ARB (medium‐ versus low‐dose), age < 6 years | 2 | 116 | Mean Difference (IV, Random, 95% CI) | ‐1.32 [‐4.54, 1.90] |
| 1.7 ACEI (high‐ versus low‐dose) | 3 | 323 | Mean Difference (IV, Random, 95% CI) | ‐5.20 [‐10.46, 0.06] |
| 1.8 ACEI (high‐ versus medium‐dose) | 3 | 326 | Mean Difference (IV, Random, 95% CI) | ‐2.72 [‐5.83, 0.40] |
| 1.9 ACEI (medium‐ versus low‐dose) | 3 | 275 | Mean Difference (IV, Random, 95% CI) | ‐2.01 [‐6.07, 2.05] |
| 1.10 CCB (high‐ versus low‐dose) | 1 | 268 | Mean Difference (IV, Random, 95% CI) | ‐1.70 [‐4.43, 1.03] |
| 2 Diastolic blood pressure Show forest plot | 12 | Mean Difference (IV, Random, 95% CI) | Subtotals only | |
| 2.1 ARB (high‐ versus low‐dose), age ≥ 6 years | 6 | 837 | Mean Difference (IV, Random, 95% CI) | ‐3.48 [‐5.00, ‐1.95] |
| 2.2 ARB (high‐ versus medium‐dose), age ≥ 6 years | 3 | 397 | Mean Difference (IV, Random, 95% CI) | ‐0.59 [‐2.49, 1.32] |
| 2.3 ARB (medium‐ versus low‐dose), age ≥ 6 years | 3 | 401 | Mean Difference (IV, Random, 95% CI) | ‐3.04 [‐5.67, ‐0.40] |
| 2.4 ARB (high‐ versus low‐dose), age < 6 years | 2 | 133 | Mean Difference (IV, Random, 95% CI) | ‐2.85 [‐8.63, 2.92] |
| 2.5 ARB (high‐ versus medium‐dose), age < 6 years | 2 | 117 | Mean Difference (IV, Random, 95% CI) | ‐0.56 [‐4.42, 3.29] |
| 2.6 ARB (medium‐ versus low‐dose), age < 6 years | 2 | 116 | Mean Difference (IV, Random, 95% CI) | ‐1.31 [‐3.74, 1.12] |
| 2.7 ACEI (high‐ versus low‐dose) | 3 | 323 | Mean Difference (IV, Random, 95% CI) | ‐5.81 [‐11.87, 0.26] |
| 2.8 ACEI (high‐ versus medium‐dose) | 3 | 326 | Mean Difference (IV, Random, 95% CI) | ‐4.31 [‐8.59, ‐0.03] |
| 2.9 ACEI (medium‐ versus low‐dose) | 3 | 275 | Mean Difference (IV, Random, 95% CI) | ‐0.46 [‐2.19, 1.27] |
| 2.10 CCB (high‐ versus low‐dose) | 1 | 268 | Mean Difference (IV, Random, 95% CI) | ‐0.70 [‐2.69, 1.29] |