Contenido relacionado
Revisiones y protocolos relacionados
Roderick P Venekamp, Matthew J Thompson, Gail Hayward, Carl J Heneghan, Chris B Del Mar, Rafael Perera, Paul P Glasziou, Maroeska M Rovers | 25 marzo 2014
Respati W Ranakusuma, Yupitri Pitoyo, Eka D Safitri, Sarah Thorning, Elaine M Beller, Sudigdo Sastroasmoro, Chris B Del Mar | 15 marzo 2018
Joline L.H. de Sévaux, Roger AMJ Damoiseaux, Alma C van de Pol, Vittoria Lutje, Alastair D Hay, Paul Little, Anne GM Schilder, Roderick P Venekamp | 18 agosto 2023
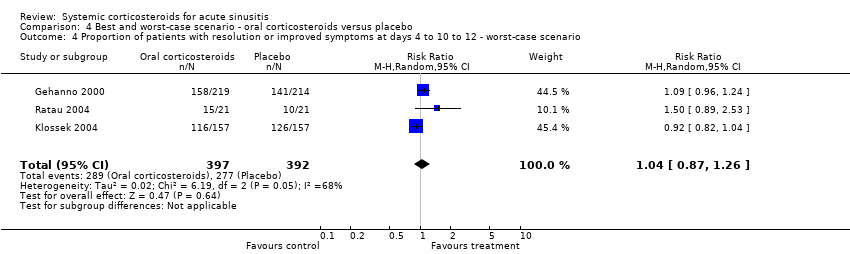
Anneli Ahovuo‐Saloranta, Ulla‐Maija Rautakorpi, Oleg V Borisenko, Helena Liira, John W Williams Jr, Marjukka Mäkelä | 16 octubre 2015
Marieke B Lemiengre, Mieke L van Driel, Dan Merenstein, Helena Liira, Marjukka Mäkelä, An IM De Sutter | 10 septiembre 2018
Anat Stern, Keren Skalsky, Tomer Avni, Elena Carrara, Leonard Leibovici, Mical Paul | 13 diciembre 2017
Jane Fisher, Adam Linder, Maria Grazia Calevo, Peter Bentzer | 23 noviembre 2021
Anca Zalmanovici Trestioreanu, Ankur Barua, Barak Pertzov | 11 mayo 2018
Matthijs C Brouwer, Peter McIntyre, Kameshwar Prasad, Diederik van de Beek | 12 septiembre 2015
Peter S Morris, Amanda J Leach | 23 abril 2008
Respuestas clínicas Cochrane
Misbah Keen | 12 diciembre 2012