Quimio(radio)terapia perioperatoria versus cirugía primaria para el adenocarcinoma resecable del estómago, la unión gastroesofágica y el esófago inferior
Appendices
Appendix 1. MEDLINE search strategy
1 exp drug therapy/
2 chemotherap$.tw.
3 modality therap$.tw.
4 combined modality therapy/ or neoadjuvant therapy/ or photochemotherapy/
5 Antineoplastic Combined Chemotherapy Protocols/
6 exp Antineoplastic Agents/
7 antineoplastic$.tw.
8 (neoadjuvant adj5 chemo$).tw.
9 (adjuvant adj5 chemo$).tw.
10 ((preoperative or postoperative or perioperative) adj5 chemo$).tw.
11 ((pre‐operative or post‐operative or peri‐operative) adj5 chemo$).tw.
12 or/1‐11
13 exp Adenocarcinoma/
14 adenocarcinoma$.tw.
15 13 or 14
16 exp Esophagus/
17 Esophagogastric Junction/
18 (gastroesophag$ adj3 junction$).tw.
19 (gastro‐esophag$ adj3 junction$).tw.
20 oesophago‐gastric junction$.tw.
21 esophago‐gastric junction$.tw.
22 (gastrooesophag$ adj3 junction$).tw.
23 (gastro‐oesophag$ adj3 junction$).tw.
24 oesophagogastric junction$.tw.
25 esophagogastric junction$.tw.
26 Stomach/
27 or/16‐26
28 15 and 27
29 exp Stomach Neoplasms/
30 exp Esophageal Neoplasms/
31 (esophag$ adj5 neoplas$).tw.
32 (oesophag$ adj5 neoplas$).tw.
33 (esophag$ adj5 cancer$).tw.
34 (oesophag$ adj5 cancer$).tw.
35 (esophag$ adj5 carcin$).tw.
36 (oesophag$ adj5 carcin$).tw.
37 (esophag$ adj5 tumo$).tw.
38 (oesophag$ adj5 tumo$).tw.
39 (esophag$ adj5 metasta$).tw.
40 (oesophag$ adj5 metasta$).tw.
41 (esophag$ adj5 malig$).tw.
42 (oesophag$ adj5 malig$).tw.
43 (esophag$ adj5 adenocarcinoma$).tw.
44 (oesophag$ adj5 adenocarcinoma$).tw.
45 (stomach adj5 neoplas$).tw.
46 (stomach adj5 adenocarcinoma$).tw.
47 (stomach adj5 cancer$).tw.
48 (stomach adj5 carcin$).tw.
49 (stomach adj5 tumo$).tw.
50 (stomach adj5 metasta$).tw.
51 (stomach adj5 malig$).tw.
52 (gastric adj5 neoplas$).tw.
53 (gastric adj5 adenocarcinoma$).tw.
54 (gastric adj5 cancer$).tw.
55 (gastric adj5 carcin$).tw.
56 (gastric adj5 tumo$).tw.
57 (gastric adj5 metasta$).tw.
58 (gastric adj5 malig$).tw.
59 or/29‐58
60 28 or 59
61 resect$.tw.
62 surg$.tw.
63 surgery/
64 opera$.tw.
65 Esophagectomy/
66 Gastrectomy/
67 Gastrectomy.tw.
68 Esophagectomy.tw.
69 or/61‐68
70 60 and 69
71 12 and 70
72 randomized controlled trial.pt.
73 controlled clinical trial.pt.
74 randomized.ab.
75 placebo.ab.
76 drug therapy.fs.
77 randomly.ab.
78 trial.ab.
79 groups.ab.
80 or/72‐79
81 humans.sh.
82 80 and 81
83 71 and 82
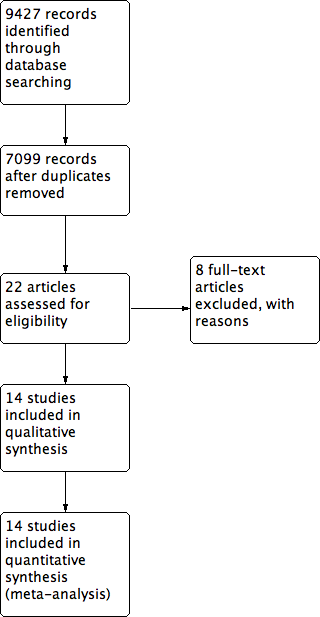
Study flow diagram.

'Risk of bias' summary: review authors' judgments about each risk of bias item for each included study.

'Risk of bias' graph: review authors' judgments about each risk of bias item presented as percentages across all included studies.
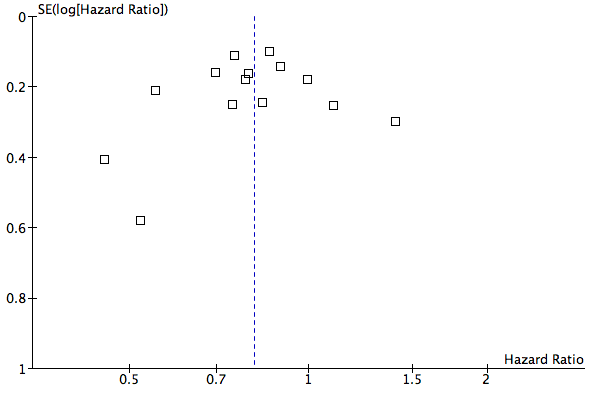
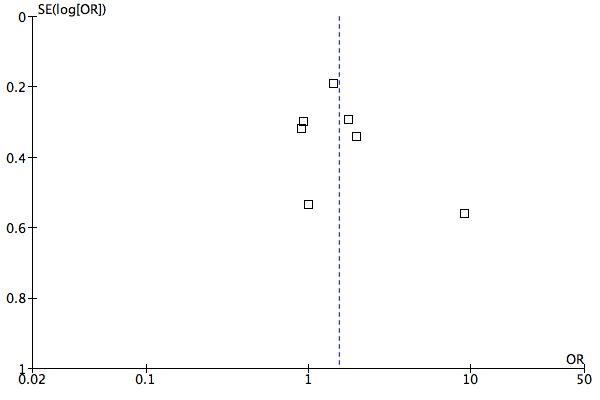
Funnel plot of comparison: 1 Overall survival, outcome: 1.1 Hazard ratio plot for overall survival.
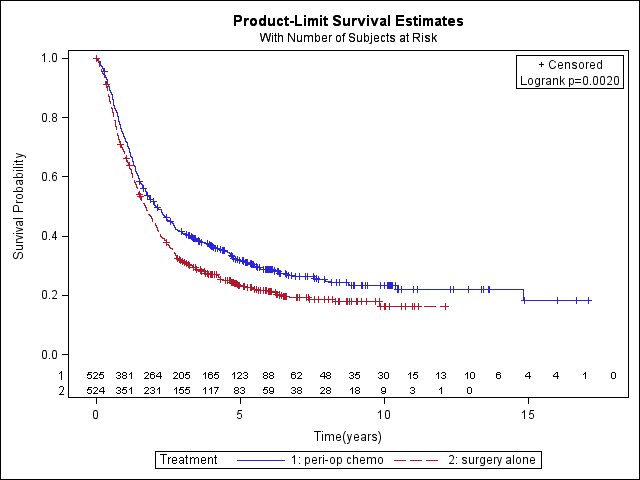
Simple (non‐stratified) overall survival curves of perioperative chemotherapy plus surgery versus surgery alone (perioperative chemo: 372 events, 525 total; surgery alone: 405 events, 524 total; hazard ratio 0.80, 95% CI 0.69 to 0.93).
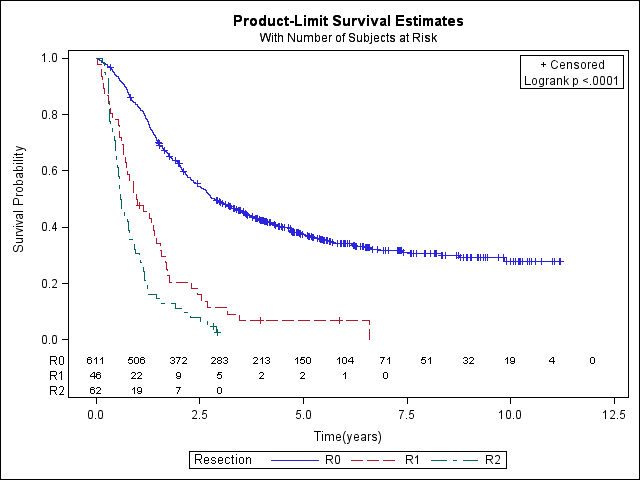
Overall survival curves by type of resection: 719 patients with R0, R1 or R2, 99 patients not resected or missing (R0: 390 events, 611 total; R1: 43 events, 46 total; R2: 60 events, 62 total).

Hazard ratio with 95% confidence interval for perioperative chemo(radio)therapy versus surgery alone for age in 5‐year increments.

Funnel plot of comparison: 2 Disease‐free survival (landmark time 6 months), outcome: 2.1 Hazard ratio plot for disease‐free survival (landmark time 6 months).

Funnel plot of comparison: 3 Presence of tumor‐free resection margin, outcome: 3.1 Odds ratio plot for tumor‐free resection margin.
Funnel plot of comparison: 4 Tumor stage at resection, outcome: 4.1 Odds ratio plot for tumor stage T0/T1/T2.

Funnel plot of comparison: 4 Tumor stage at resection, outcome: 4.2 Odds ratio plot for nodal status N0.

Funnel plot of comparison: 6 Postoperative morbidity, outcome: 6.1 Risk difference plot for postoperative morbidity.
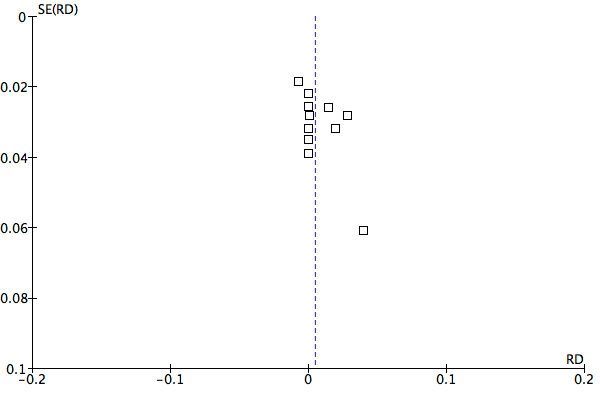
Funnel plot of comparison: 7 Postoperative mortality, outcome: 7.1 Risk difference plot for postoperative mortality.
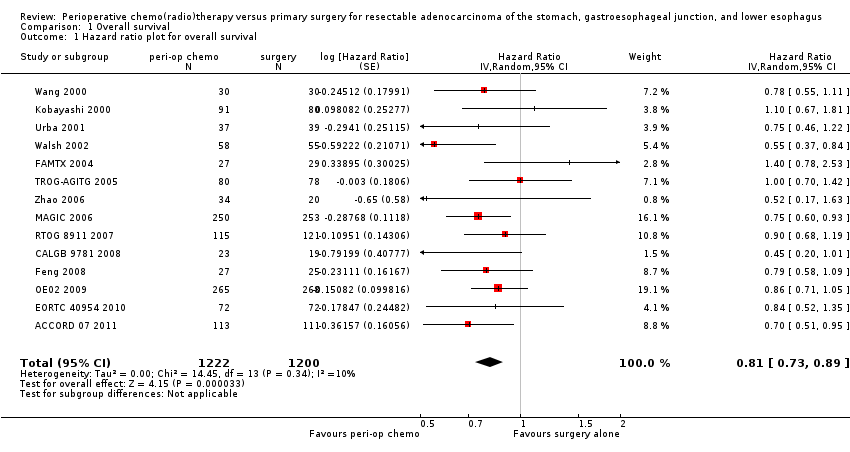
Comparison 1 Overall survival, Outcome 1 Hazard ratio plot for overall survival.

Comparison 1 Overall survival, Outcome 2 Hazard ratio plot for overall survival by type of data.

Comparison 1 Overall survival, Outcome 3 Hazard ratio plot for overall survival by tumor site.

Comparison 1 Overall survival, Outcome 4 Interaction treatment‐tumor site (only IPD).

Comparison 1 Overall survival, Outcome 5 Hazard ratio plot for overall survival by chemo‐/radiotherapy.

Comparison 1 Overall survival, Outcome 6 Hazard ratio plot for overall survival by timing of regimen.
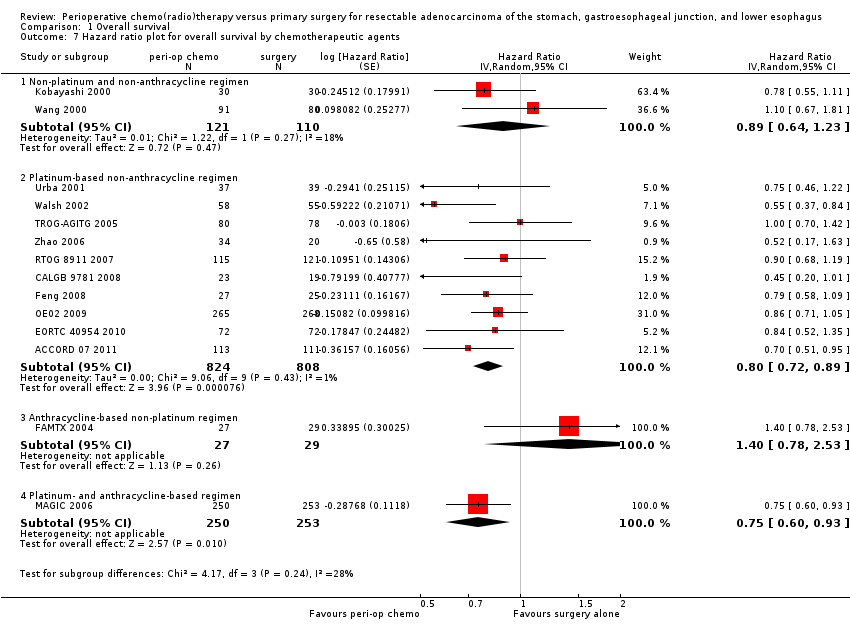
Comparison 1 Overall survival, Outcome 7 Hazard ratio plot for overall survival by chemotherapeutic agents.

Comparison 1 Overall survival, Outcome 8 Hazard ratio plot for overall survival by performance status (only IPD).

Comparison 1 Overall survival, Outcome 9 Interaction treatment‐performance status (only IPD).

Comparison 1 Overall survival, Outcome 10 Hazard ratio plot for overall survival by age (only IPD).

Comparison 1 Overall survival, Outcome 11 Interaction treatment‐age (only IPD).

Comparison 1 Overall survival, Outcome 12 Hazard ratio plot for overall survival by sex (only IPD).

Comparison 1 Overall survival, Outcome 13 Interaction treatment‐sex (only IPD).

Comparison 1 Overall survival, Outcome 14 Hazard ratio plot for overall survival by pretreatment T class (only IPD).
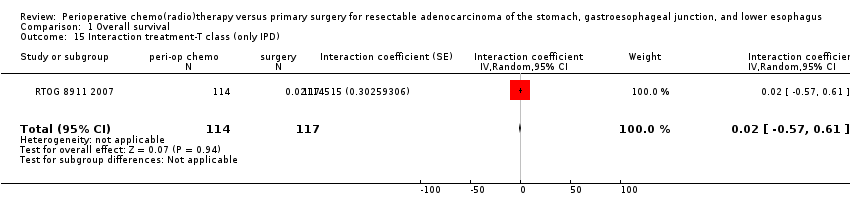
Comparison 1 Overall survival, Outcome 15 Interaction treatment‐T class (only IPD).

Comparison 1 Overall survival, Outcome 16 Hazard ratio plot for overall survival by pretreatment N class (only IPD).
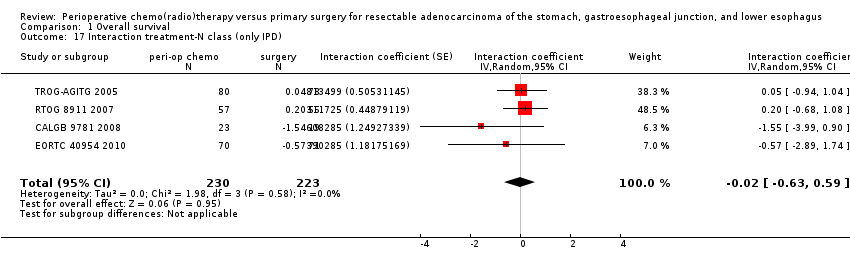
Comparison 1 Overall survival, Outcome 17 Interaction treatment‐N class (only IPD).

Comparison 2 Disease‐free survival (landmark time 6 months), Outcome 1 Hazard ratio plot for disease‐free survival (landmark time 6 months).

Comparison 3 Presence of tumor‐free resection margin, Outcome 1 Odds ratio plot for tumor‐free resection margin.

Comparison 4 Tumor stage at resection, Outcome 1 Odds ratio plot for tumor stage T0/T1/T2.
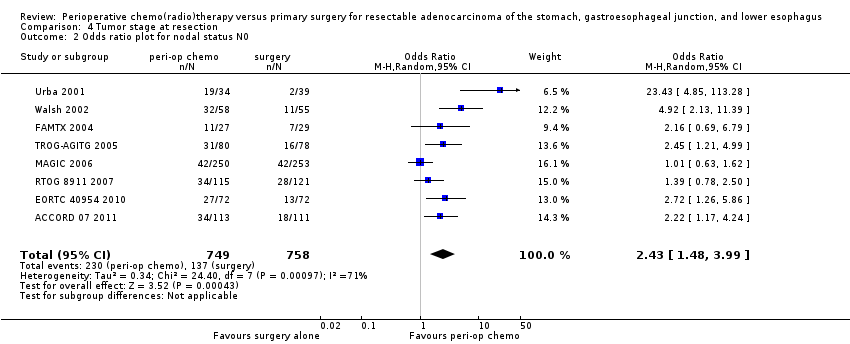
Comparison 4 Tumor stage at resection, Outcome 2 Odds ratio plot for nodal status N0.
| Study | |
| ACCORD 07 2011 | 62/109 ˜ 0.57 |
| CALGB 9781 2008 | In publication: population with mixed histology, no stratified data available; in IPD: no data on toxicity available |
| EORTC 40954 2010 | No data available |
| FAMTX 2004 | 41/27 ˜ 1.52 |
| Feng 2008 | No data on grade of toxicity available |
| Kobayashi 2000 | "No complications were noted in the operative period related to preoperative dosage of 5'DFUR" |
| MAGIC 2006 | 330/237 who started treatment ˜1.39 |
| OE02 2009 | No data available |
| RTOG 8911 2007 | 225/115 ˜ 1.96 |
| TROG‐AGITG 2005 | In publication: population with mixed histology, no stratified data available; in IPD: no data on toxicity available |
| Urba 2001 | In publication: population with mixed histology, no stratified data available; in IPD: no data on toxicity available |
| Walsh 2002 | 9/58 ˜ 0.16 |
| Wang 2000 | No data available |
| Zhao 2006 | No data available |
Comparison 5 Safety of perioperative chemotherapy regimen, Outcome 1 Number of grade 3/4 toxicities per patient.

Comparison 6 Postoperative morbidity, Outcome 1 Risk difference plot for postoperative morbidity.

Comparison 7 Postoperative mortality, Outcome 1 Risk difference plot for postoperative mortality.
| Perioperative chemotherapy compared to primary surgery for resectable adenocarcinoma of the stomach, gastroesophageal junction, and lower esophagus | ||||||
| Patient or population: resectable adenocarcinoma of the stomach, gastroesophageal junction, and lower esophagus | ||||||
| Outcomes | Illustrative comparative risks* (95% CI) | Relative effect | No of participants | Quality of the evidence | Comments | |
| Assumed risk | Corresponding risk | |||||
| Primary surgery | Perioperative chemotherapy | |||||
| Overall survival among all patients | Moderate | HR 0.81 | 2422 | ⊕⊕⊕⊕ | ||
| Disease‐free survival (landmark time 6 months) | Moderate | HR 0.84 | 931 | ⊕⊕⊕⊕ | ||
| Overall survival by type of data ‐ Individual patient data | Moderate | HR 0.80 | 1049 | ⊕⊕⊕⊕ | ||
| Overall survival by type of data ‐ Aggregated data | Moderate | HR 0.81 | 1373 | ⊕⊕⊕⊝ | ||
| Overall survival by tumor site ‐ Esophagus | Moderate | HR 0.87 | 473 | ⊕⊕⊕⊕ | ||
| Overall survival by tumor site ‐ GE junction | Moderate | HR 0.69 | 470 | ⊕⊕⊕⊕ | ||
| Overall survival by tumor site ‐ Stomach | Moderate | HR 0.94 | 828 | ⊕⊕⊕⊕ | ||
| *The basis for the assumed risk (e.g. the median control group risk across studies) is provided in footnotes. The corresponding risk (and its 95% confidence interval) is based on the assumed risk in the comparison group and the relative effect of the intervention (and its 95% CI). | ||||||
| GRADE Working Group grades of evidence | ||||||
| 1Four out of the six studies included in this analysis have a high overall risk of bias. | ||||||
| Perioperative chemotherapy compared to primary surgery for resectable adenocarcinoma of the stomach, gastroesophageal junction, and lower esophagus | ||||||
| Patient or population: resectable adenocarcinoma of the stomach, gastroesophageal junction, and lower esophagus | ||||||
| Outcomes | Illustrative comparative risks* (95% CI) | Relative effect | No of participants | Quality of the evidence | Comments | |
| Assumed risk | Corresponding risk | |||||
| Primary surgery | Perioperative chemotherapy | |||||
| Overall survival by chemo‐/radiotherapy ‐ Chemotherapy only | Moderate | HR 0.83 | 2033 | ⊕⊕⊕⊕ | ||
| Overall survival by chemo‐/radiotherapy ‐ Chemoradiotherapy | Moderate | HR 0.70 | 389 | ⊕⊕⊕⊝ | ||
| Presence of tumor‐free resection margin | 67 per 100 | 75 per 100 | OR 1.42 | 1665 | ⊕⊕⊕⊝ | |
| Tumor stage at resection (T0 to T2 vs T3 to T4) | 34 per 100 | 44 per 100 | OR 1.53 | 1410 | ⊕⊕⊕⊝ | |
| Tumor stage at resection (N0 vs N+) | 18 per 100 | 35 per 100 | OR 2.43 | 1507 | ⊕⊕⊝⊝ | |
| Postoperative morbidity | 30 per 100 | 31 per 100 | See comment | 1397 | ⊕⊕⊕⊕ | Risks were calculated from pooled risk differences: RD 0.01 (‐0.03 to 0.05) |
| Postoperative mortality | 3 per 100 | 4 per 100 | See comment | 1606 | ⊕⊕⊕⊝ | Risks were calculated from pooled risk differences:RD 0.00 (‐0.01 to 0.02) |
| *The basis for the assumed risk (e.g. the median control group risk across studies) is provided in footnotes. The corresponding risk (and its 95% confidence interval) is based on the assumed risk in the comparison group and the relative effect of the intervention (and its 95% CI). | ||||||
| GRADE Working Group grades of evidence | ||||||
| 1Heterogeneous trial results. | ||||||
| Trial ID | Median potential follow‐up time in years (95% confidence interval) |
| Urba 2001 | 9.9 (6.3 to 10.3) |
| Walsh 2002 | 13.6 (12.2 to 16.1) |
| FAMTX 2004 | 9.7 (8.3 to 10.2) |
| TROG‐AGITG 2005 | 5.2 (4.4 to 6.1) |
| RTOG 8911 2007 | 8.9 (8.1 to 9.9) |
| CALGB 9781 2008 | 6.1 (5.5 to 6.3) |
| EORTC 40954 2010 | 4.4 (4.0 to 4.9) |
| ACCORD 07 2011 | 5.7 (5.1 to 6.6) |
| *Follow‐up time calculated according to Schemper 1996. | |
| Adjustment | Number of patients | HR (95% CI)) | P value |
| For tumor site | 931 (326 esophagus, 352 GE junction, 253 stomach) | 0.82 (0.70 to 0.96) | 0.0117 |
| For cT stage | 417 (152 T0/1/2, 265 T3/4) | 0.83 (0.65 to 1.06) | 0.1258 |
| For cN stage | 453 (250 N0, 203 N1/2/3) | 0.90 (0.71 to 1.13) | 0.3361 |
| For performance status | 846 (595 PS 0, 251 PS 1/2/higher) | 0.86 (0.73 to 1.01) | 0.0651 |
| For age | 1049 (median 62, minimum 23, maximum 80) | 0.81 (0.70 to 0.93) | 0.0031 |
| For gender | 1049 (870 male, 179 female) | 0.80 (0.69 to 0.92) | 0.0015 |
| CI: confidence interval; GE: gastroesophageal; PS: performance status | |||
| Variable | Number of patients | Univariable HR (95% CI) | Multivariable β (SE) | Multivariable HR (95% CI) | Multivariable P value |
| Treatment arm (chemotherapy only vs surgery alone) | 324 chemotherapy only, 80 chemoradiotherapy, 400 surgery alone | 0.85 (0.70 to 1.03) | ‐0.16 (0.09) | 0.86 | 0.0972 |
| Treatment arm (chemoradiotherapy vs surgery alone)** | 1.02 (0.72 to 1.45) | ‐0.01 (0.18) | 0.99 (0.69 to 1.40) | 0.9351 | |
| Tumor site (esophagus vs stomach) | 321 esophagus, | 2.28 (1.60 to 3.26) | 0.80 (0.18) | 2.23 | < 0.0001 |
| Tumor site (GE junction vs stomach) | 1.82 (1.35 to 2.46) | 0.56 (0.15) | 1.75 (1.29 to 2.37) | 0.0003 | |
| Performance status (0 vs 1/2) | 565 PS 0, | 0.74 (0.62 to 0.89) | ‐0.30 (0.09) | 0.74 (0.62 to 0.89) | 0.0010 |
| Age (continuous variable) | Median 61, | 1.01 (1.00 to 1.01) | 0.01 (0.00) | 1.01 (1.00 to 1.03) | 0.0124 |
| Gender (male vs female) | 667 male, | 1.26 (0.99 to 1.60) | 0.11 (0.12) | 1.12 (0.87 to 1.43) | 0.3757 |
| *ACCORD 07 2011; EORTC 40954 2010; FAMTX 2004; RTOG 8911 2007; TROG‐AGITG 2005 **The group 'chemoradiotherapy' includes 80 patients from one single trial (TROG‐AGITG 2005) GE: gastroesophageal; PS: performance status | |||||
| Outcome or subgroup title | No. of studies | No. of participants | Statistical method | Effect size |
| 1 Hazard ratio plot for overall survival Show forest plot | 14 | 2422 | Hazard Ratio (Random, 95% CI) | 0.81 [0.73, 0.89] |
| 2 Hazard ratio plot for overall survival by type of data Show forest plot | 14 | Hazard Ratio (Random, 95% CI) | Subtotals only | |
| 2.1 Individual patient data | 8 | 1049 | Hazard Ratio (Random, 95% CI) | 0.80 [0.66, 0.97] |
| 2.2 Aggregated data | 6 | 1373 | Hazard Ratio (Random, 95% CI) | 0.81 [0.72, 0.92] |
| 3 Hazard ratio plot for overall survival by tumor site Show forest plot | 11 | Hazard Ratio (Random, 95% CI) | Subtotals only | |
| 3.1 Esophagus | 5 | 473 | Hazard Ratio (Random, 95% CI) | 0.87 [0.73, 1.05] |
| 3.2 GE junction | 6 | 470 | Hazard Ratio (Random, 95% CI) | 0.69 [0.54, 0.87] |
| 3.3 Stomach | 7 | 828 | Hazard Ratio (Random, 95% CI) | 0.94 [0.82, 1.06] |
| 4 Interaction treatment‐tumor site (only IPD) Show forest plot | 4 | 717 | Interaction coefficient (Random, 95% CI) | 0.00 [‐0.38, 0.38] |
| 5 Hazard ratio plot for overall survival by chemo‐/radiotherapy Show forest plot | 14 | Hazard Ratio (Random, 95% CI) | Subtotals only | |
| 5.1 Chemotherapy only | 10 | 2033 | Hazard Ratio (Random, 95% CI) | 0.83 [0.75, 0.91] |
| 5.2 Chemoradiotherapy | 4 | 389 | Hazard Ratio (Random, 95% CI) | 0.70 [0.50, 0.99] |
| 6 Hazard ratio plot for overall survival by timing of regimen Show forest plot | 14 | Hazard Ratio (Random, 95% CI) | Subtotals only | |
| 6.1 Preoperative regimen | 9 | 1236 | Hazard Ratio (Random, 95% CI) | 0.81 [0.68, 0.95] |
| 6.2 Preoperative and postoperative combined regimen | 5 | 1186 | Hazard Ratio (Random, 95% CI) | 0.80 [0.70, 0.91] |
| 7 Hazard ratio plot for overall survival by chemotherapeutic agents Show forest plot | 14 | Hazard Ratio (Random, 95% CI) | Subtotals only | |
| 7.1 Non‐platinum and non‐anthracycline regimen | 2 | 231 | Hazard Ratio (Random, 95% CI) | 0.89 [0.64, 1.23] |
| 7.2 Platinum‐based non‐anthracycline regimen | 10 | 1632 | Hazard Ratio (Random, 95% CI) | 0.80 [0.72, 0.89] |
| 7.3 Anthracycline‐based non‐platinum regimen | 1 | 56 | Hazard Ratio (Random, 95% CI) | 1.40 [0.78, 2.53] |
| 7.4 Platinum‐ and anthracycline‐based regimen | 1 | 503 | Hazard Ratio (Random, 95% CI) | 0.75 [0.60, 0.93] |
| 8 Hazard ratio plot for overall survival by performance status (only IPD) Show forest plot | 6 | Hazard Ratio (Random, 95% CI) | Totals not selected | |
| 8.1 Performance status 0 | 6 | Hazard Ratio (Random, 95% CI) | 0.0 [0.0, 0.0] | |
| 8.2 Performance status 1 | 6 | Hazard Ratio (Random, 95% CI) | 0.0 [0.0, 0.0] | |
| 9 Interaction treatment‐performance status (only IPD) Show forest plot | 6 | 841 | Interaction coefficient (Random, 95% CI) | 0.34 [‐0.03, 0.71] |
| 10 Hazard ratio plot for overall survival by age (only IPD) Show forest plot | 8 | Hazard Ratio (Random, 95% CI) | Totals not selected | |
| 10.1 < 65 years | 8 | Hazard Ratio (Random, 95% CI) | 0.0 [0.0, 0.0] | |
| 10.2 65 to 75 years | 8 | Hazard Ratio (Random, 95% CI) | 0.0 [0.0, 0.0] | |
| 11 Interaction treatment‐age (only IPD) Show forest plot | 8 | 1032 | Interaction coefficient (Random, 95% CI) | ‐0.07 [‐0.40, 0.26] |
| 12 Hazard ratio plot for overall survival by sex (only IPD) Show forest plot | 8 | Hazard Ratio (Random, 95% CI) | Totals not selected | |
| 12.1 Male | 8 | Hazard Ratio (Random, 95% CI) | 0.0 [0.0, 0.0] | |
| 12.2 Female | 8 | Hazard Ratio (Random, 95% CI) | 0.0 [0.0, 0.0] | |
| 13 Interaction treatment‐sex (only IPD) Show forest plot | 6 | 849 | Interaction coefficient (Random, 95% CI) | ‐0.18 [‐0.59, 0.23] |
| 14 Hazard ratio plot for overall survival by pretreatment T class (only IPD) Show forest plot | 3 | Hazard Ratio (Random, 95% CI) | Totals not selected | |
| 14.1 T stage 0/1/2 | 3 | Hazard Ratio (Random, 95% CI) | 0.0 [0.0, 0.0] | |
| 14.2 T stage 3/4 | 3 | Hazard Ratio (Random, 95% CI) | 0.0 [0.0, 0.0] | |
| 15 Interaction treatment‐T class (only IPD) Show forest plot | 1 | 231 | Interaction coefficient (Random, 95% CI) | 0.02 [‐0.57, 0.61] |
| 16 Hazard ratio plot for overall survival by pretreatment N class (only IPD) Show forest plot | 4 | Hazard Ratio (Random, 95% CI) | Totals not selected | |
| 16.1 N stage 0 | 4 | Hazard Ratio (Random, 95% CI) | 0.0 [0.0, 0.0] | |
| 16.2 N stage 1/2/3 | 4 | Hazard Ratio (Random, 95% CI) | 0.0 [0.0, 0.0] | |
| 17 Interaction treatment‐N class (only IPD) Show forest plot | 4 | 453 | Interaction coefficient (Random, 95% CI) | ‐0.02 [‐0.63, 0.59] |
| Outcome or subgroup title | No. of studies | No. of participants | Statistical method | Effect size |
| 1 Hazard ratio plot for disease‐free survival (landmark time 6 months) Show forest plot | 7 | 931 | Hazard Ratio (Random, 95% CI) | 0.84 [0.69, 1.01] |
| Outcome or subgroup title | No. of studies | No. of participants | Statistical method | Effect size |
| 1 Odds ratio plot for tumor‐free resection margin Show forest plot | 10 | 1665 | Odds Ratio (M‐H, Random, 95% CI) | 1.42 [0.97, 2.06] |
| Outcome or subgroup title | No. of studies | No. of participants | Statistical method | Effect size |
| 1 Odds ratio plot for tumor stage T0/T1/T2 Show forest plot | 7 | 1410 | Odds Ratio (M‐H, Random, 95% CI) | 1.53 [1.02, 2.31] |
| 2 Odds ratio plot for nodal status N0 Show forest plot | 8 | 1507 | Odds Ratio (M‐H, Random, 95% CI) | 2.43 [1.48, 3.99] |
| Outcome or subgroup title | No. of studies | No. of participants | Statistical method | Effect size |
| 1 Number of grade 3/4 toxicities per patient Show forest plot | Other data | No numeric data | ||
| Outcome or subgroup title | No. of studies | No. of participants | Statistical method | Effect size |
| 1 Risk difference plot for postoperative morbidity Show forest plot | 9 | 1397 | Risk Difference (M‐H, Random, 95% CI) | 0.01 [‐0.03, 0.05] |
| Outcome or subgroup title | No. of studies | No. of participants | Statistical method | Effect size |
| 1 Risk difference plot for postoperative mortality Show forest plot | 11 | 1606 | Risk Difference (M‐H, Random, 95% CI) | 0.00 [‐0.01, 0.02] |