Amiodarona versus otras intervenciones farmacológicas para la prevención de la muerte súbita cardíaca
Información
- DOI:
- https://doi.org/10.1002/14651858.CD008093.pub2Copiar DOI

- Base de datos:
-
- Cochrane Database of Systematic Reviews
- Versión publicada:
-
- 08 diciembre 2015see what's new
- Tipo:
-
- Intervention
- Etapa:
-
- Review
- Grupo Editorial Cochrane:
-
Grupo Cochrane de Corazón
- Copyright:
-
- Copyright © 2015 The Cochrane Collaboration. Published by John Wiley & Sons, Ltd.
Cifras del artículo
Altmetric:
Citado por:
Autores
Contributions of authors
Searching for trials: JCC/FL/GR
Handsearching: JCC/FB
Obtaining copies of trials: JCC
Selecting which trials to include (2 + 1 arbiter): JCC/RC + LML
Extracting data from trials (2 people): JCC/RC
Entering data into RevMan: RC/GR
Carrying out the analysis: RC/JCC/GR
Interpreting the analysis: JCC/RC/GR/LML
Drafting the final review: JCC/RC/FB/FL/GR/LML
Updating the review: JCC/RC
Sources of support
Internal sources
-
No sources of support provided
External sources
-
Proyecto FONIS SA11I2195 2011, Chile
The main authors won a grant from the National Comission for Scientific and Technological Investigation (CONICYT)
Declarations of interest
Juan Carlos Claro declares having received funding from a grant (FONIS (Fondo Nacional de Investigación y Desarrollo en Salud) project SA11l2195). This project was presented to CONICYT (Comisión Nacional de Investigación Científica y Tecnológica) in the year 2008 in order to receive some funding while carrying out the review, as the Government understood the research question addressed a pertinent issue for low‐ and middle‐income countries like Chile.
Luz M Letelier declares having received a clinical research grant from FONIS (Fondo Nacional de Investigación y Desarrollo en Salud).
Roberto Candia: none known.
Gabriel Rada: none known.
Fernando Baraona: none known.
Francisco Larrondo: none known.
Acknowledgements
The authors would like to acknowledge the invaluable help of the following collaborators who helped to translate articles from different languages: Kensuke Takaoka (Japanese), Marina Karanikolos (Russian), Taixiang Wu (Chinese), Nicole Martin (German) and Annie Tremp (French).
Version history
| Published | Title | Stage | Authors | Version |
| 2015 Dec 08 | Amiodarone versus other pharmacological interventions for prevention of sudden cardiac death | Review | Juan Carlos Claro, Roberto Candia, Gabriel Rada, Fernando Baraona, Francisco Larrondo, Luz M Letelier | |
| 2009 Oct 07 | Amiodarone versus other pharmacological interventions for prevention of sudden cardiac death | Protocol | Juan Carlos Claro, Roberto Candia, Gabriel Rada, Francisco Larrondo, Fernando Baraona, Luz M Letelier | |
Differences between protocol and review
We initially defined reduced LVEF as < 35%. However, we included studies with LVEF as low as 30%. A number of primary studies included participants with that LVEF, and we were not able to obtain individual patient data regarding solely those with LVEF < 35%.
We had initially stated that we would include participants with previous myocardial infarction (> 30 days prior to study). However, not a single study in the primary prevention setting included post‐MI participants of over 30 days. All of the studies included participants from 24 h post‐MI onwards. We thought that due to amiodarone pharmacodynamics, it would take more than three weeks to obtain plateau plasma levels, so the effect of amiodarone would not be apparent until the first month.
We did not plan to include Summary of Findings tables and GRADE assessment in the review at protocol stage but have done so in the review.
Keywords
MeSH
Medical Subject Headings (MeSH) Keywords
Medical Subject Headings Check Words
Adult; Humans;
PICO
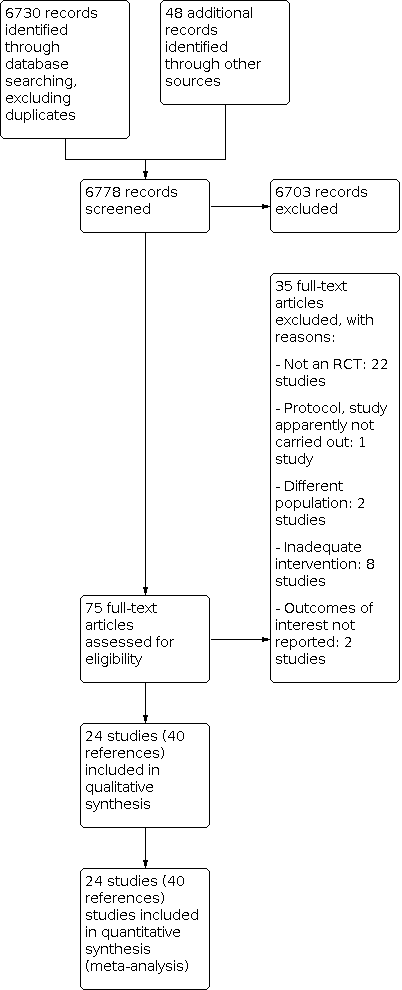
Study flow diagram.

Risk of bias graph: review authors' judgements about each risk of bias item presented as percentages across all included studies.

Risk of bias summary: review authors' judgements about each risk of bias item for each included study.

Funnel plot of comparison: 1 Amiodarone versus placebo or no treatment for primary prevention, outcome: 1.1 Sudden cardiac death.

Funnel plot of comparison: 1 Amiodarone versus placebo or no treatment for primary prevention, outcome: 1.2 Cardiac mortality.

Funnel plot of comparison: 1 Amiodarone versus placebo or no treatment for primary prevention, outcome: 1.3 All‐cause mortality.

Comparison 1: Amiodarone versus placebo or no treatment for primary prevention, Outcome 1: Sudden cardiac death

Comparison 1: Amiodarone versus placebo or no treatment for primary prevention, Outcome 2: Cardiac mortality

Comparison 1: Amiodarone versus placebo or no treatment for primary prevention, Outcome 3: All‐cause mortality

Comparison 1: Amiodarone versus placebo or no treatment for primary prevention, Outcome 4: Sudden cardiac death subgroup post‐ AMI patients

Comparison 1: Amiodarone versus placebo or no treatment for primary prevention, Outcome 5: Sudden cardiac death subgroup heart failure

Comparison 1: Amiodarone versus placebo or no treatment for primary prevention, Outcome 6: All‐cause mortality subgroup post‐AMI

Comparison 1: Amiodarone versus placebo or no treatment for primary prevention, Outcome 7: All‐cause mortality subgroup heart failure

Comparison 2: Amiodarone versus other antiarrhythmics for primary prevention, Outcome 1: Sudden cardiac death

Comparison 2: Amiodarone versus other antiarrhythmics for primary prevention, Outcome 2: Cardiac mortality

Comparison 2: Amiodarone versus other antiarrhythmics for primary prevention, Outcome 3: All‐cause mortality

Comparison 3: Amiodarone versus beta‐blockers for primary prevention, Outcome 1: Sudden cardiac death

Comparison 3: Amiodarone versus beta‐blockers for primary prevention, Outcome 2: Cardiac mortality

Comparison 3: Amiodarone versus beta‐blockers for primary prevention, Outcome 3: All‐cause mortality

Comparison 4: Amiodarone versus placebo or no treatment for secondary prevention, Outcome 1: Sudden cardiac death

Comparison 4: Amiodarone versus placebo or no treatment for secondary prevention, Outcome 2: All‐cause mortality

Comparison 5: Amiodarone versus other antiarrhythmics for secondary prevention, Outcome 1: Sudden cardiac death

Comparison 5: Amiodarone versus other antiarrhythmics for secondary prevention, Outcome 2: Cardiac mortality

Comparison 5: Amiodarone versus other antiarrhythmics for secondary prevention, Outcome 3: All‐cause mortality

Comparison 5: Amiodarone versus other antiarrhythmics for secondary prevention, Outcome 4: Sudden cardiac death subgroup with ICD

Comparison 5: Amiodarone versus other antiarrhythmics for secondary prevention, Outcome 5: Sudden cardiac death subgroup without ICD

Comparison 5: Amiodarone versus other antiarrhythmics for secondary prevention, Outcome 6: All‐cause mortality subgroup with ICD

Comparison 5: Amiodarone versus other antiarrhythmics for secondary prevention, Outcome 7: All‐cause mortality subgroup without ICD

Comparison 6: Amiodarone versus beta‐blockers for secondary prevention, Outcome 1: Sudden cardiac death

Comparison 6: Amiodarone versus beta‐blockers for secondary prevention, Outcome 2: All‐cause mortality

Comparison 7: Amiodarone versus sotalol for secondary prevention, Outcome 1: Sudden cardiac death

Comparison 7: Amiodarone versus sotalol for secondary prevention, Outcome 2: Cardiac mortality

Comparison 7: Amiodarone versus sotalol for secondary prevention, Outcome 3: All‐cause mortality

Comparison 8: Amiodarone and quality of life, Outcome 1: Quality of life (DASI at 30 months)

Comparison 8: Amiodarone and quality of life, Outcome 2: Quality of life (MHI‐5 at 30 months)

Comparison 9: Amiodarone versus placebo (adverse effects), Outcome 1: Hyperthyroidism

Comparison 9: Amiodarone versus placebo (adverse effects), Outcome 2: Hypothyroidism

Comparison 9: Amiodarone versus placebo (adverse effects), Outcome 3: Pulmonary

Comparison 9: Amiodarone versus placebo (adverse effects), Outcome 4: Discontinuation

Comparison 10: Amiodarone versus other antiarrhythmics (adverse effects), Outcome 1: Hyperthyroidism

Comparison 10: Amiodarone versus other antiarrhythmics (adverse effects), Outcome 2: Hypothyroidism

Comparison 10: Amiodarone versus other antiarrhythmics (adverse effects), Outcome 3: Pulmonary

Comparison 10: Amiodarone versus other antiarrhythmics (adverse effects), Outcome 4: Discontinuation

Comparison 11: Amiodarone versus no treatment (adverse effects), Outcome 1: Hyperthyroidism

Comparison 11: Amiodarone versus no treatment (adverse effects), Outcome 2: Hypothyroidism

Comparison 11: Amiodarone versus no treatment (adverse effects), Outcome 3: Pulmonary
| Amiodarone versus placebo or no treatment for primary prevention | |||||
| Patient or population: participants with high risk of sudden cardiac death (primary prevention) | |||||
| Outcomes | Illustrative comparative risks* (95% CI) | Relative effect | No of participants | Quality of the evidence | |
|---|---|---|---|---|---|
| Assumed risk | Corresponding risk | ||||
| Placebo or no treatment | Amiodarone | ||||
| Sudden cardiac death | Study population | RR 0.76 | 8383 | ⊕⊕⊝⊝ | |
| 91 per 1000 | 70 per 1000 | ||||
| Moderate | |||||
| 114 per 1000 | 87 per 1000 | ||||
| All‐cause mortality | Study population | RR 0.88 | 8383 | ⊕⊕⊝⊝ | |
| 203 per 1000 | 178 per 1000 | ||||
| Moderate | |||||
| 190 per 1000 | 167 per 1000 | ||||
| *The basis for the assumed risk (e.g. the median control group risk across studies) is provided in footnotes. The corresponding risk (and its 95% confidence interval) is based on the assumed risk in the comparison group and the relative effect of the intervention (and its 95% CI). | |||||
| GRADE Working Group grades of evidence | |||||
| aRandomisation and allocation concealment methods not clear or not adequate in 10/16 studies, including studies with more weight. | |||||
| Amiodarone versus beta blockers | |||||
| Patient or population: beta blockers | |||||
| Outcomes | Illustrative comparative risks* (95% CI) | Relative effect | No of participants | Quality of the evidence | |
|---|---|---|---|---|---|
| Assumed risk | Corresponding risk | ||||
| Control | Amiodarone | ||||
| Sudden cardiac death | Study population | RR 0.37 | 342 | ⊕⊕⊝⊝ | |
| 56 per 1000 | 21 per 1000 | ||||
| Moderate | |||||
| 45 per 1000 | 17 per 1000 | ||||
| All‐cause mortality | Study population | RR 0.27 | 342 | ⊕⊕⊝⊝ | |
| 101 per 1000 | 27 per 1000 | ||||
| Moderate | |||||
| 76 per 1000 | 21 per 1000 | ||||
| *The basis for the assumed risk (e.g. the median control group risk across studies) is provided in footnotes. The corresponding risk (and its 95% confidence interval) is based on the assumed risk in the comparison group and the relative effect of the intervention (and its 95% CI). | |||||
| GRADE Working Group grades of evidence | |||||
| aBoth studies had serious limitations, including lack of blinding for participants and unclear generation of random sequence and allocation concealment. | |||||
| Amiodarone versus other antiarrhythmics for high risk of sudden cardiac death (primary prevention) | |||||
| Patient or population: participants with high risk of sudden cardiac death (primary prevention) | |||||
| Outcomes | Illustrative comparative risks* (95% CI) | Relative effect | No of participants | Quality of the evidence | |
|---|---|---|---|---|---|
| Assumed risk | Corresponding risk | ||||
| Other antiarrhythmics | Amiodarone | ||||
| Sudden cardiac death | Study population | RR 0.44 | 540 | ⊕⊕⊕⊝ | |
| 65 per 1000 | 28 per 1000 | ||||
| All‐cause mortality | Study population | RR 0.37 | 540 | ⊕⊕⊕⊝ | |
| 100 per 1000 | 37 per 1000 | ||||
| *The basis for the assumed risk (e.g. the median control group risk across studies) is provided in footnotes. The corresponding risk (and its 95% confidence interval) is based on the assumed risk in the comparison group and the relative effect of the intervention (and its 95% CI). | |||||
| GRADE Working Group grades of evidence | |||||
| aAll studies had serious limitations, including lack of blinding for participants and unclear allocation concealment. | |||||
| Amiodarone compared to placebo or no treatment for high risk of sudden cardiac death (secondary prevention) | |||||
| Patient or population: participants with high risk of sudden cardiac death (secondary prevention) | |||||
| Outcomes | Illustrative comparative risks* (95% CI) | Relative effect | No of participants | Quality of the evidence | |
|---|---|---|---|---|---|
| Assumed risk | Corresponding risk | ||||
| Placebo or no treatment | Amiodarone | ||||
| Sudden cardiac death | Study population | RR 4.32 | 440 | ⊕⊝⊝⊝ | |
| 8 per 1000 | 35 per 1000 | ||||
| All‐cause mortality | Study population | RR 3.05 | 440 | ⊕⊝⊝⊝ | |
| 32 per 1000 | 99 per 1000 | ||||
| Moderate | |||||
| 35 per 1000 | 107 per 1000 | ||||
| *The basis for the assumed risk (e.g. the median control group risk across studies) is provided in footnotes. The corresponding risk (and its 95% confidence interval) is based on the assumed risk in the comparison group and the relative effect of the intervention (and its 95% CI). | |||||
| GRADE Working Group grades of evidence | |||||
| aVery serious imprecision: quality of the evidence was downgraded two levels because the CI was very wide and includes both important risks and benefits, and because there was a very low number of events. | |||||
| Amiodarone versus other antiarrhythmics for high risk of sudden cardiac death (secondary prevention) | |||||
| Patient or population: participants with high risk of sudden cardiac death (secondary prevention) | |||||
| Outcomes | Illustrative comparative risks* (95% CI) | Relative effect | No of participants | Quality of the evidence | |
|---|---|---|---|---|---|
| Assumed risk | Corresponding risk | ||||
| Other antiarrhythmics | Amiodarone | ||||
| Sudden cardiac death | Study population | RR 1.40 | 839 | ⊕⊝⊝⊝ | |
| 99 per 1000 | 138 per 1000 | ||||
| All‐cause mortality | Study population | RR 1.03 | 898 | ⊕⊕⊝⊝ | |
| 193 per 1000 | 198 per 1000 | ||||
| *The basis for the assumed risk (e.g. the median control group risk across studies) is provided in footnotes. The corresponding risk (and its 95% confidence interval) is based on the assumed risk in the comparison group and the relative effect of the intervention (and its 95% CI). | |||||
| GRADE Working Group grades of evidence | |||||
| aAll studies had serious limitations, including 4/5 not blinded for participants. | |||||
| Amiodarone compared to beta blockers for high risk of sudden cardiac death (secondary prevention) | |||||
| Patient or population: participants with high risk of sudden cardiac death (secondary prevention) | |||||
| Outcomes | Illustrative comparative risks* (95% CI) | Relative effect | No of Participants | Quality of the evidence | |
|---|---|---|---|---|---|
| Assumed risk | Corresponding risk | ||||
| Beta blockers | Amiodarone | ||||
| Sudden cardiac death | Study population | RR 0.84 | 189 | ⊕⊝⊝⊝ | |
| 351 per 1000 | 294 per 1000 | ||||
| All‐cause mortality | Study population | RR 0.96 | 189 | ⊕⊝⊝⊝ | |
| 454 per 1000 | 435 per 1000 | ||||
| *The basis for the assumed risk (e.g. the median control group risk across studies) is provided in footnotes. The corresponding risk (and its 95% confidence interval) is based on the assumed risk in the comparison group and the relative effect of the intervention (and its 95% CI). | |||||
| GRADE Working Group grades of evidence | |||||
| aThe only study has serious limitations, including lack of blinding for participants. | |||||
| Amiodarone versus sotalol for high risk of sudden cardiac death (secondary prevention) | |||||
| Patient or population: participants with high risk of sudden cardiac death (secondary prevention) | |||||
| Outcomes | Illustrative comparative risks* (95% CI) | Relative effect | No of Participants | Quality of the evidence | |
|---|---|---|---|---|---|
| Assumed risk | Corresponding risk | ||||
| Sotalol | Amiodarone | ||||
| Sudden cardiac death | Study population | RR 2.87 | 45 | ⊕⊝⊝⊝ | |
| 45 per 1000 | 130 per 1000 | ||||
| All‐cause mortality | Study population | RR 1.08 | 104 | ⊕⊝⊝⊝ | |
| 137 per 1000 | 148 per 1000 | ||||
| Moderate | |||||
| 132 per 1000 | 143 per 1000 | ||||
| *The basis for the assumed risk (e.g. the median control group risk across studies) is provided in footnotes. The corresponding risk (and its 95% confidence interval) is based on the assumed risk in the comparison group and the relative effect of the intervention (and its 95% CI). | |||||
| GRADE Working Group grades of evidence | |||||
| aThe only study has serious limitations, including lack of blinding for participants. | |||||
| Outcome or subgroup title | No. of studies | No. of participants | Statistical method | Effect size |
| 1.1 Sudden cardiac death Show forest plot | 17 | 8383 | Risk Ratio (M‐H, Random, 95% CI) | 0.76 [0.66, 0.88] |
| 1.2 Cardiac mortality Show forest plot | 17 | 8383 | Risk Ratio (M‐H, Random, 95% CI) | 0.86 [0.77, 0.96] |
| 1.3 All‐cause mortality Show forest plot | 17 | 8383 | Risk Ratio (M‐H, Random, 95% CI) | 0.88 [0.78, 1.00] |
| 1.4 Sudden cardiac death subgroup post‐ AMI patients Show forest plot | 6 | 3377 | Risk Ratio (M‐H, Random, 95% CI) | 0.65 [0.46, 0.91] |
| 1.5 Sudden cardiac death subgroup heart failure Show forest plot | 11 | 5006 | Risk Ratio (M‐H, Random, 95% CI) | 0.79 [0.67, 0.93] |
| 1.6 All‐cause mortality subgroup post‐AMI Show forest plot | 6 | 3377 | Risk Ratio (M‐H, Random, 95% CI) | 0.84 [0.61, 1.16] |
| 1.7 All‐cause mortality subgroup heart failure Show forest plot | 11 | 5006 | Risk Ratio (M‐H, Random, 95% CI) | 0.90 [0.80, 1.01] |
| Outcome or subgroup title | No. of studies | No. of participants | Statistical method | Effect size |
| 2.1 Sudden cardiac death Show forest plot | 3 | 540 | Risk Ratio (M‐H, Random, 95% CI) | 0.44 [0.19, 1.00] |
| 2.2 Cardiac mortality Show forest plot | 3 | 540 | Risk Ratio (M‐H, Random, 95% CI) | 0.41 [0.20, 0.86] |
| 2.3 All‐cause mortality Show forest plot | 3 | 540 | Risk Ratio (M‐H, Random, 95% CI) | 0.37 [0.18, 0.76] |
| Outcome or subgroup title | No. of studies | No. of participants | Statistical method | Effect size |
| 3.1 Sudden cardiac death Show forest plot | 2 | 342 | Risk Ratio (M‐H, Random, 95% CI) | 0.37 [0.11, 1.22] |
| 3.2 Cardiac mortality Show forest plot | 2 | 342 | Risk Ratio (M‐H, Random, 95% CI) | 0.31 [0.11, 0.84] |
| 3.3 All‐cause mortality Show forest plot | 2 | 342 | Risk Ratio (M‐H, Random, 95% CI) | 0.27 [0.10, 0.75] |
| Outcome or subgroup title | No. of studies | No. of participants | Statistical method | Effect size |
| 4.1 Sudden cardiac death Show forest plot | 2 | 440 | Risk Ratio (M‐H, Random, 95% CI) | 4.32 [0.87, 21.49] |
| 4.2 All‐cause mortality Show forest plot | 2 | 440 | Risk Ratio (M‐H, Random, 95% CI) | 3.05 [1.33, 7.01] |
| Outcome or subgroup title | No. of studies | No. of participants | Statistical method | Effect size |
| 5.1 Sudden cardiac death Show forest plot | 4 | 839 | Risk Ratio (M‐H, Random, 95% CI) | 1.40 [0.56, 3.52] |
| 5.2 Cardiac mortality Show forest plot | 2 | 273 | Risk Ratio (M‐H, Random, 95% CI) | 0.77 [0.49, 1.21] |
| 5.3 All‐cause mortality Show forest plot | 5 | 898 | Risk Ratio (M‐H, Random, 95% CI) | 1.03 [0.75, 1.42] |
| 5.4 Sudden cardiac death subgroup with ICD Show forest plot | 1 | 377 | Risk Ratio (M‐H, Random, 95% CI) | 24.45 [2.79, 214.59] |
| 5.5 Sudden cardiac death subgroup without ICD Show forest plot | 2 | 234 | Risk Ratio (M‐H, Random, 95% CI) | 0.96 [0.45, 2.05] |
| 5.6 All‐cause mortality subgroup with ICD Show forest plot | 1 | 377 | Risk Ratio (M‐H, Random, 95% CI) | 1.96 [0.98, 3.93] |
| 5.7 All‐cause mortality subgroup without ICD Show forest plot | 3 | 293 | Risk Ratio (M‐H, Random, 95% CI) | 0.97 [0.72, 1.31] |
| Outcome or subgroup title | No. of studies | No. of participants | Statistical method | Effect size |
| 6.1 Sudden cardiac death Show forest plot | 1 | 189 | Risk Ratio (M‐H, Random, 95% CI) | 0.84 [0.55, 1.27] |
| 6.2 All‐cause mortality Show forest plot | 1 | 189 | Risk Ratio (M‐H, Random, 95% CI) | 0.96 [0.70, 1.32] |
| Outcome or subgroup title | No. of studies | No. of participants | Statistical method | Effect size |
| 7.1 Sudden cardiac death Show forest plot | 1 | 45 | Risk Ratio (M‐H, Random, 95% CI) | 2.87 [0.32, 25.55] |
| 7.2 Cardiac mortality Show forest plot | 1 | 45 | Risk Ratio (M‐H, Random, 95% CI) | 1.43 [0.26, 7.78] |
| 7.3 All‐cause mortality Show forest plot | 2 | 104 | Risk Ratio (M‐H, Random, 95% CI) | 1.08 [0.41, 2.83] |
| Outcome or subgroup title | No. of studies | No. of participants | Statistical method | Effect size |
| 8.1 Quality of life (DASI at 30 months) Show forest plot | 1 | 1160 | Mean Difference (IV, Random, 95% CI) | 1.20 [‐0.56, 2.96] |
| 8.2 Quality of life (MHI‐5 at 30 months) Show forest plot | 1 | 1124 | Mean Difference (IV, Random, 95% CI) | 2.20 [‐0.26, 4.66] |
| Outcome or subgroup title | No. of studies | No. of participants | Statistical method | Effect size |
| 9.1 Hyperthyroidism Show forest plot | 8 | 5972 | Risk Ratio (M‐H, Random, 95% CI) | 4.14 [1.54, 11.17] |
| 9.2 Hypothyroidism Show forest plot | 8 | 4008 | Risk Ratio (M‐H, Random, 95% CI) | 6.13 [2.46, 15.28] |
| 9.3 Pulmonary Show forest plot | 12 | 5924 | Risk Ratio (M‐H, Random, 95% CI) | 1.66 [1.15, 2.40] |
| 9.4 Discontinuation Show forest plot | 13 | 7616 | Risk Ratio (M‐H, Random, 95% CI) | 1.45 [1.26, 1.67] |
| Outcome or subgroup title | No. of studies | No. of participants | Statistical method | Effect size |
| 10.1 Hyperthyroidism Show forest plot | 3 | 514 | Risk Ratio (M‐H, Random, 95% CI) | 7.43 [1.33, 41.57] |
| 10.2 Hypothyroidism Show forest plot | 4 | 886 | Risk Ratio (M‐H, Random, 95% CI) | 7.77 [1.85, 32.68] |
| 10.3 Pulmonary Show forest plot | 6 | 1296 | Risk Ratio (M‐H, Random, 95% CI) | 2.30 [0.36, 14.67] |
| 10.4 Discontinuation Show forest plot | 8 | 1438 | Risk Ratio (M‐H, Random, 95% CI) | 1.06 [0.84, 1.33] |
| Outcome or subgroup title | No. of studies | No. of participants | Statistical method | Effect size |
| 11.1 Hyperthyroidism Show forest plot | 3 | 414 | Risk Ratio (M‐H, Random, 95% CI) | 4.97 [0.60, 41.16] |
| 11.2 Hypothyroidism Show forest plot | 3 | 414 | Risk Ratio (M‐H, Random, 95% CI) | 12.82 [0.73, 225.33] |
| 11.3 Pulmonary Show forest plot | 2 | 405 | Risk Ratio (M‐H, Random, 95% CI) | 14.79 [0.85, 256.43] |