மலேரியா பரவுவதைத் தடுக்க முட்டைப் புழுக்களை உண்கின்ற மீன்
Appendices
Appendix 1. Search methods: detailed search strategies
| Search set | CIDG SRa | CENTRAL | MEDLINE | Embase | LILACS | CAB ABSTRACTS |
| 1 | mosquito* | mosquito* | mosquito* | mosquito$ | mosquito$ | mosquito* |
| 2 | control* OR breeding* OR lar va* Or predat* | control* OR breeding* OR larva* OR predat* | control* OR breeding* OR larva* OR predat* | control$ OR breeding$ OR larva$ Or predat$ | control$ OR breeding$ OR larva$ OR predat$ | control* OR breeding* OR larva* Or predat* |
| 3 | 1 and 2 | 1 and 2 | PEST CONTROL, BIOLOGICAL | VECTOR CONTROL | 1 and 2 | 1 and 2 |
| 4 | (fish* or frog*) | MOSQUITO CONTROL/METHODS | 2 OR 3 | 2 OR 3 | (fish$ OR frog$) | (fish* or frog*) |
| 5 | larvivorous | 3 or 4 | 1 AND 4 | 1 AND 4 | larvivorous | larvivorous |
| 6 | 4 or 5 | (fish* OR frog*) | MOSQUITO CONTROL/METHODS | (fish$ OR frog$) | 4 or 5 | “Gambusia” OR “Poecilia” OR “Aphanius” OR “Oreochromis” OR “Tilapia” OR “Aplocheilus” OR “Cyprimus” OR “Ctenopharyngodon” OR “Rasbora” OR “Aphyocypris” |
| 7 | 3 and 6 | larvivorous | 5 OR 6 | larvivorous | 3 and 6 | 4 or 5 or 6 |
| 8 | — | 6 OR 7 | (fish* OR frog*) | “Gambusia” OR “Poecilia” OR “Aphanius” OR “Oreochromis” OR “Tilapia” OR “Aplocheilus” OR “Cyprimus” OR “Ctenopharyngodon” OR “Rasbora” OR “Aphyocypris” | — | 3 and 7 |
| 9 | — | 5 and 8 | larvivorous | 6 or 7 or 8 | — | — |
| 10 | — | — | “Gambusia” OR “Poecilia” OR “Aphanius” OR “Oreochromis” OR “Tilapia” OR “Aplocheilus” OR “Cyprimus” OR “Ctenopharyngodon” OR “Rasbora” OR “Aphyocypris”
| 5 and 9 | — | — |
| 11 | — | — | 8 OR 9 OR 10 | — | — | — |
| 12 | — | — | 7 AND 11 | — | — | — |
aCochrane Infectious Diseases Group Specialized Register.
Appendix 2. Descriptive analysis of included studies
None of the included studies reported on cases of malaria, EIR, or the density of adult vector mosquitoes. Therefore, we did not find any direct evidence that this intervention impacts malaria transmission. We performed a descriptive analysis of the 14 included studies that examined the effect of fish stocking on immature anopheline mosquito presence or density, or both. We analysed the studies by the habitat type that study authors introduced for the larvivorous fish. Nine studies evaluated larvivorous fish in localized water bodies (including wells, domestic water containers, fishponds and pools, and riverbed pools created after dam construction), four studies used rice field plots, and two studies used water canals; see Table 2.
Section 1: localized water bodies
Wells
Two studies from India evaluated larviciding in wells (Sitaraman 1976; Menon 1978).
Sitaraman and colleagues introduced fish (100 Poecilia reticulata) to 10 wells and maintained four wells as controls. The authors measured An. stephensi larval and pupal densities by taking five dips per well every four days until 28 days' post‐intervention. They measured baseline values immediately before the introduction of larvivorous fish to the 10 wells. We examined the raw data reported by the authors for evidence of an effect of larvivorous fish on the immature An. stephensi population.
Baseline values in the control (four wells) and intervention groups (10 wells) were comparable before fish were introduced (assuming that these were the numerical totals across the 10 intervention and four control wells; Table 1a). In the intervention wells, immature mosquito numbers decreased rapidly after fish were introduced. This decrease in immature mosquito numbers was greater than in the control group. The study authors did not detect any immature mosquitoes in the 10 wells at four days' follow‐up. They measured only 15 larvae at 24 days' post‐intervention and 40 larvae at 28 days' post‐intervention. At 28 days, the immature mosquito numbers (L1 to L4 stages) increased, and the study authors introduced fish into the control wells.
Sitaraman and colleagues released 50 fish per well into 12 wells, with five wells in the same ward serving as controls, and followed immature mosquito numbers for 22 days (Table 2a). A dramatic drop in larvae from daily dips (50 per well) was seen early, with a 69% reduction in larvae and an 82% reduction in pupae by day 2; no such change was seen in the control wells. However, recovery of relatively immature larvae (L1 and L2 instars) was relatively rapid and baseline values were restored by day 10; although recovery of mature larvae (L3 and L4) was slower and less complete, with mean density still 60% lower than baseline after three weeks (Table 1, page 317 of the paper).
With high fish stocking levels, larvae are eliminated in the first four days in wells but reappeared at lower levels from day 24 onwards. With lower stocking levels, there was a partial effect for two weeks only, with rebound.
Table 1a.Sitaraman 1976: An. stephensi immature numbers before and after introduction of fish (100 guppies per well)
| Intervention | Immature stages | Pre‐intervention | Follow‐up (days) | ||
| 4 | 24 | 28 | |||
| Control (4 wells) | L1 + L2 L3 + L4 Pupae | 296 346 44 | 236 254 64 | 94 36 24 | 240 156 16 |
| Intervention (10 wells) | L1 + L2 L3 + L4 Pupae | 890 960 205 | 0 0 0 | 15 0 0 | 40 0 0 |
Table 2a.Sitaraman 1976: An. stephensi immature numbers before and after introduction of fish (50 guppies per well)
| Intervention | Immature stages | Pre‐intervention | Follow‐up (days) | ||
| 4 | 16 | 22 | |||
| Control (5 wells) | L1 + L2 L3 + L4 Pupae | 275 330 40 | 455 255 40 | 525 245 30 | 300 255 40 |
| Intervention (12 wells) | L1 + L2 L3 + L4 Pupae | 384 546 102 | 156 156 84 | 498 204 42 | 486 222 48 |
In a second study from India, Menon and colleagues introduced Gambusia or Aplocheilus fish to 3438 wells but kept 317 wells as controls. In intervention sites, if they found mosquito larvae, they stocked with 50 fish per well; if no larvae were present, they stocked with 20 fish per well. They measured An. stephensi larval density at baseline and monthly for four months.
The proportion of wells with larvae was greater in the intervention group (32.8%) than in the control group (7.7%) at baseline (Table 3a). At follow‐up, the proportion of wells with larvae dropped markedly in the intervention arm (less than 1%) but not in the control arm. In the control group, percentage of wells with larvae increased to a maximum of 9.6% during follow‐up.
This study appeared to provide evidence of a larvicidal effect of fish in wells using relatively high stocking levels.
Table 3a.Menon 1978: percentage of wells with An. stephensi larvae in wells immediately before and after introduction of fish
| Intervention | Pre‐intervention (%) | Follow‐up (months) | ||
| 1 | 2 | 4 | ||
| Control | 7.7 | 8.0 | 8.6 | 9.6 |
| Intervention | 32.8 | 0.97 | 0.49 | 0.47 |
Domestic water containers
Three studies examined larviciding in domestic water containers (Fletcher 1992; Haq 2013; Sabatinelli 1991). In Ethiopia, Fletcher and colleagues introduced fish to wells, barrels, cisterns, and washbasins. In Gujarat State, India, Haq and colleagues added fish to water storage containers, such as cement tanks including underground tanks, kothi (big mud pots), and barrels. On the Comoro Islands, located off the south‐east coast of Africa, Sabatinelli and colleagues introduced fish to ablution basins and tanks.
Fletcher 1992 introduced Aphanius dispar to 60 domestic water containers and kept 51 water containers as controls. They measured the Anopheles culicifacies adanensis larval population using a standard dipping procedure pre‐intervention and then either every two weeks (May to August 1987) or monthly for 11 months. Control and intervention values were identical at baseline (0%). Sites allocated to the fish intervention had fewer An. culicifacies adanensis larvae at one year post‐intervention compared with control sites (see Table 4a).
Fish introduction appears to prevent an increase in the number of domestic water container sites with larvae compared with controls up to 11 months' follow‐up.
Table 4a.Fletcher 1992: percentage of sites with An. culicifacies adanensis larvae before and after introduction of fish
| Intervention | Pre‐intervention (percentage of sites) | Follow‐up (months) | |||
| 1 | 4 | 7 | 11 | ||
| Control | 0 | 0 | 2.0 | 13.7 | 4.2 |
| Intervention | 0 | 0 | 0.9 | 0 | 0 |
Haq 2013 added A. dispar to 295 water containers in the intervention village and monitored 30 of these containers, and monitored 25 containers in the control village. The study authors measured the An. stephensi larval and pupal population from trial initiation in December 2010 for 12 months (up to November 2011) using a standard dipping procedure taking the mean of three dips at weekly intervals for four weeks followed by fortnightly. The study authors only reported data as % reduction in immature density of L3 and L4 larvae plus pupae of An. stephensi at day 0, 7, 15, and every 15 days thereafter. The percentage reduction was greater than 60% for all time points, even up to one year post‐intervention (see Table 5a).
Table 5a:Haq 2013: percentage reduction in L3‐L4 larvae and pupae of An. stephensi after introduction of fish
| Outcome | Follow‐up (months) | ||||
| Baseline | 1 | 4 | 7 | 12 | |
| % reduction in An. stephensi L3‐L4 larvae and pupae | 0 | 94.39 | 97.14 | 100 | 96.08 |
Sabatinelli 1991 introduced P. reticulata to domestic water containers in Hantsambou village (59 ablution basins sites in November 1987, total number of sites not specified) and kept 20 ablution basins in Bandamadji village as control sites. They measured the percentage of containers positive for An. gambiae larvae by examining the surface and bottom of containers (at least 15 cm in diameter) in both intervention and control groups four times during the 11 months' follow‐up. Control and intervention values were identical at baseline. At follow‐up, the proportion of sites positive for An. gambiae larvae decreased at fish‐treated sites but not at control sites (see Table 6a).
This study appeared to show fish that reduce the number of domestic wash basins with larvae when added to these sites for up to 11 months.
Table 6a.Sabatinelli 1991: percentage of sites with An. gambiae larvae before and after introduction of fish
| Intervention | Pre‐intervention (% of sites) | Follow‐up (months) | ||
| 1 | 5 | 11 | ||
| Control | 40 | 75 | 45 | 50 |
| Intervention | 41 | 7 | 1 | 8 |
Fishponds and pools
Two studies based in Kenya examined the use of larvivorous fish in ponds (Howard 2007; Imbahale 2011a).
Howard and colleagues compared two intervention ponds and one control pond, all located within 150 m of each other. They measured the number of immature An. gambiae and An. funestus mosquitoes by taking larval dips five to seven days per week. We explored the evidence for an effect, if any, in three ways: we made a simple description of trends in the graph; we extracted data carefully from the graph; and we examined the authors' analysis.
Trends in the graph: the authors provided a detailed graph showing An. gambiae immature populations over time in the three ponds. They used a 15‐week baseline period before the fish were introduced into two of the three ponds. The control pond had much lower densities of An. gambiae immatures in the baseline period, with none present in the first 1.5 months; then followed a gradual increase in density month by month over the intervention period, with wide week‐by‐week and, at certain time points day‐by‐day, variations. At six months' post‐intervention, larvae numbers peaked and the authors introduced fish to the control pond.
For the first intervention pond, densities were much higher than for the control pond at baseline. When fish were introduced, the density remained low, or possibly attenuated. For the second intervention pond, the intervention did not appear to be associated with any substantive visual pattern of reduction in density, although it could be argued that some attenuation was evident in the first five months. Thus, critical appraisal of Figure 2 in Howard 2007 indicated increasing immatures in the control pond but did not provide convincing evidence of substantial and sustained decline in the two intervention ponds.
Extracting data from the graph: we took fixed time points before and after the intervention. Table 7a shows these data, which we estimated using a ruler against the y axis. We chose the one‐ and three‐month time points as standard normal values. We did not include the end time point of the experiment ‐ when the study authors introduced fish to the control pond ‐ as this will introduce bias as it is defined by an increase in larvae. Our analysis below supported evidence of reduction in the immature An. gambiae population in the first intervention pond but not in the second intervention pond.
Table 7a.Howard 2007: An. gambiae immatures in three ponds before and after the introduction of fish
| Intervention | Pre‐intervention (months) | Follow‐up (months) | ||
| 3 | 1 | 1 | 3 | |
| Control pond | 0 | 7 | 7 | 4 |
| First intervention pond1 | 3 | 7 | 0 | 0 |
| Second intervention pond2 | 2 | 4 | 2 | 2 |
1Referred to as pond C within Howard 2007 study.
2Referred to as pond D within Howard 2007 study.
Authors' analysis: the authors used Mulla's formula to calculate percentage reduction in An. gambiae and An. funestus immatures, with estimates of 95.8% reduction in An. gambiae immatures in intervention pond 1 and 94.1% for intervention pond 2; and similar high reductions for An. funestus (98.3% in intervention pond 1, 97.5% in intervention pond 2). However, Mulla's formula depends on rates in the control arm, in which an increase in immature numbers was clearly seen over time. Therefore, one interpretation of these data is that fish are effective; the other is that these large effects are the result of particular ecological changes happening in the control pond.
This study appeared to provide limited evidence of a possible larvicidal effect of fish in ponds.
For the Imbahale 2011a study, refer to the water canals section below.
Riverbed pools below dams
Two studies in Sri Lanka evaluated fish introduced to riverbeds pools located below dams (Kusumawathie 2008a; Kusumawathie 2008b).
In the Kusumawathie 2008a study, authors introduced P. reticulata to 29 riverbed pools below Kotmale dam and used 31 pools as controls. They measured the number of immature Anopheles using a 100 mL larval dipper at a frequency of six dips per m² at baseline (day before fish were introduced) and up to 120 days' follow‐up. Control and intervention groups had similar baseline values. At follow‐up, the intervention group had greater reductions than the control group for the outcomes of percentage of pools with Anopheles larvae, mean number of larvae per pool, and mean number of larvae per 100 dips (Table 8a).
This study appears to provide evidence of a larvicidal effect of fish in riverbed pools below dams sustained up to four months.
Table 8a.Kusumawathie 2008a: mean percentage of pools with Anopheles larvae, mean number of larvae per pool, and mean number of larvae per 100 dips before and after introduction of larvivorous fish
| Outcome | Intervention | Pre‐intervention | Follow‐up |
| Percentage of pools with Anopheles larvae | Control Intervention | 100 100 | 31.03 0 |
| Mean number of larvae per pool | Control Intervention | 3.03 3.17 | 0.52 0 |
| Mean number of larvae per 100 dips | Control Intervention | 114.63 109.52 | 20 0 |
In the second study (Kusumawathie 2008b), Kusumawathie and colleagues introduced P. reticulata to all riverbed pools in Laxapana and Kotmale 1 study sites. They used riverbed pools in Kotmale 2 and Nilambe as control sites. They measured immature Anopheles densities using a 100 mL larval dipper at a frequency of six dips per m² for one year pre‐intervention and one year post‐intervention. Baseline values at control and intervention sites were similar for the outcomes percentage pools with Anopheles larvae and mean number of larvae per 100 dips, but not for mean number of larvae per 100 pools. At follow‐up, the riverbed pools stocked with fish had larger reductions in terms of presence and density of larvae (Table 9a).
This study indicated a partial effect of fish on presence and density of larvae in riverbed pools below dams for up to one year.
Table 9a.Kusumawathie 2008b: mean percentage of pools with Anopheles larvae, mean number of larvae per 100 pools, and mean number of larvae per 100 dips before and after introduction of larvivorous fish
| Outcome | Intervention | Pre‐intervention | Follow‐up |
| Percentage of pools with Anopheles larvae | Control Intervention | 15.95 17.39 | 12.52 5.79 |
| Mean number of larvae per 100 pools | Control Intervention | 28.78 142.94 | 27.44 11.25 |
| Mean number of larvae per 100 dips | Control Intervention | 8.52 11.84 | 9.02 3.4 |
Section 2: rice field plots
Five studies evaluated fish introduced to rice fields: one in Central Java (Nalim 1988), two in South Korea (Kim 2002; Yu 1989), and two in Tajikistan (RTDC 2008; Zvantsov 2008).
In Central Java, Nalim and colleagues stocked 23.9 ha of rice fields with P. reticulata and Cyprinus carpio fish. They did not specify the size of the control area or the total number of control and intervention field plots. Using 80 emergence traps randomly located in the treated and control areas, they reported the numbers of Anopheles aconitus, Anopheles barbirostris, and Anopheles annularis newly emerged adult mosquitoes collected/m²/day (trap area = 0.25 m²) over six years. Effects were mixed, with some evidence of an impact of fish on An. aconitus and An. annularis, but not on An. barbirostris (Table 10a).
This study indicates a partial effect of fish on the density of newly emerged An. aconitus and An. annularis, but not An. barbirostris, in rice field plots below dams for up to six years.
Table 10a.Nalim 1988: mean number of adult mosquitoes collected per m²per day
| Species | Intervention | Year | ||
| 1 | 3 | 6 | ||
| An. aconitus1 | Control Intervention | 2.4 3.35 | 4.2 0.2 | 1.2 0.01 |
| An. barbirostris1 | Control Intervention | 7.6 6.0 | 6.0 4.7 | 3.2 2.9 |
| An. annularis1 | Control Intervention | 3.0 3.35 | 4.2 1.13 | 2.2 0.7 |
1We discarded two years of data (1982, 1983), as the study authors reported that the control area was sprayed with fenitrothion (a phosphorothioate (organophosphate) insecticide) at the end of 1982.
In the South Korean study, Kim and colleagues introduced three slightly different interventions to three rice field plots measuring about 300 m² to 600 m² (Kim 2002). They compared these with a control area of three rice field plots of similar size. They introduced either Tilapia mossambicus and Aplocheilus latipes (treatment A) or Aphyocypris chinensis and Tilapia mossambicus (treatment B and treatment C) to rice field plots and took two dips, with between two and four replicates per rice field, every two weeks, to examine the mean number of An. sinensis larvae.
We extracted data for specific time points before and after the intervention. The study authors used a six‐week baseline period for treatments B and C but no baseline for treatment A before the fish were introduced into two plots.
The results provided a robust controlled before‐and‐after study (treatments B and C), with four time points in the control period (Table 11a). Baseline measurements appeared similar at control and intervention sites. In the control group and for treatments B and C, the number of An. sinensis larvae was higher at two weeks' pre‐intervention than at six weeks' pre‐intervention. After fish were introduced to the intervention sites, the An. sinensis larval population in the control group was the same at two weeks' follow‐up but decreased at six weeks' follow‐up. Larvae were clearly reduced at the two sites where fish were introduced.
The study also afforded a controlled time series comparison between the control group and a third intervention site, where the fish were introduced at the start of observations (treatment A; Table 12a). The number of An. sinensis larvae increased between one week' and five weeks' follow‐up at both control and intervention sites. However, the number of larvae decreased by 13 weeks' follow‐up at both control and intervention sites. This shows a mean difference in larvae density between control and intervention over the entire period of observation. However, these data were weaker, as no baseline density was noted in the intervention arm, and any difference from the control could be due to chance.
This study appeared to provide limited evidence of a possible larvicidal effect of fish on An. sinensis larvae in rice field plots.
Table 11a. Kim 2002: An. sinensis larvae at control (three plots) and intervention sites (two plots) before and after introduction of fish
| Intervention | Pre‐intervention (weeks) | Follow‐up (weeks) | ||
| 6 | 2 | 2 | 6 | |
| Control | 2.0 | 4.5 | 4.5 | 2.5 |
| Treatment B | 2.5 | 3.5 | 2.25 | 0.4 |
| Treatment C | 1.75 | 4.13 | 2.25 | 0.38 |
Table 12a.Kim 2002: An. sinensis larvae at control plots (three plots) and at an intervention plot (one plot) after introduction of fish
| Intervention | Follow‐up (weeks) | |||
| 1 | 5 | 9 | 13 | |
| Control | 2.0 | 4.5 | 4.5 | 2.5 |
| Treatment A | 1.25 | 2.5 | 2.0 | 0.5 |
In South Korea, Yu and colleagues compared ponds treated with two species of fish (A. latipes and Tilapia mossambicus), one species alone (A. latipes), and a control group (Yu 1989). The researchers selected six plots, 45 m² in size and 0.3 m in depth, located within a confined rice field of 1000 m². They randomly assigned two plots to each treatment group. They took measurements of the An. sinensis larval population every week, using a 500 mL dipper (two to four dips per rice field plot) or a nylon net (eight to 10 sweepings per sample).
The study authors monitored the An. sinensis larval population for eight weeks before they introduced fish, and pre‐intervention values were comparable between sites. In the first two intervention plots, they introduced one fish species: at four weeks, larvae had increased against baseline in both control and intervention ponds, but the size of the increase was smaller in the one‐fish intervention pond (7.00 compared with 16.00, 56% lower; Table 13a).
In the next two intervention plots, they introduced two fish species, and follow‐up at four and seven weeks showed considerably lower values in the two‐fish intervention pond than in the control pond (4.21 compared with 16.13, 74% lower; Table 13a).
This study provided some evidence that larvivorous fish can constrain the rapid increases in larvae populations seen in untreated ponds.
Table 13a.Yu 1989: mean number of An. sinensis larvae in ponds before intervention and after introduction of fish
| Intervention | Pre‐intervention1 | Follow‐up (weeks) | |
| 4 | 7 | ||
| Control | 4.56 | 16.0 | 16.13 |
| 1 fish species | 4.19 | 7.00 | Bacteria introduced |
| 2 fish species | 4.50 | 4.87 | 4.21 |
1We recalculated the mean pre‐intervention values that the study authors reported in control and intervention groups, as the study authors incorrectly reported these values.
In Tajikistan, RTDC 2008 compared two rice field sites treated with Gambusia affinis compared with two control sites. The study authors did not state the size of the plots and how treatment was assigned to the sites. They sampled the immature Anopheles population and G. affinis population every 10 or 11 days using a standard net of 20 cm diameter, which was held to 0.5 m in one direction and then taken in the opposite direction. The net contents were rinsed and the number of fish, and mosquito larvae and pupae counted. Five such samples gave the number of fish and the immature mosquitoes/m².
The study authors did not report any baseline data. They monitored the immature Anopheles population up to either 41 (Vakhsh district site Kirov 2) or 40 days (Bokhta district site of Saidov (Table 14a). The number of immature Anopheles mosquitoes were comparable in both control sites over this time period, and a decrease in the number of immature of Anopheles mosquitoes was observed in the intervention sites.
This study appeared to provide limited evidence of a larvicidal effect of G. affinis fish on immature Anophelesmosquitoes in rice field plots.
Table 14a.RTDC 2008: number of immature Anopheles mosquitoes after introduction of fish
| Intervention | Follow‐up (days) | ||||
| 0 | 10 | 20/21 | 30/31 | 40/41 | |
| Control (Vakhsh district) | 30 | 38 | 40 | 41 | 43 |
| Intervention (Vakhsh district) | 36 | 20 | 8 | 3 | 2 |
| Control (Bokhta district) | 34 | 38 | 38 | 41 | 44 |
| Intervention (Bokhta district) | 42 | 25 | 6 | 3 | 1 |
The authors of Zvantsov 2008 examined the effect of introduction of either G. affinis or P. reticulata to rice field plots in two districts with established rice production: Farkhor (Kizilpakhtachi village) and Shaartuz (Birlyash village). In each rice field nine checks were used: three filled with P. reticulata, three filled with G. affinis, and three served as controls. For this study, each rice check measured 3 m × 3 m, and checks treated with the different species of fish were arranged in a chequer board pattern. Fish were released into the rice checks at the rate of five pregnant females/m², i.e. 45 females per 3 m × 3 m check at day 0. Fish were restocked at day 38 or 39 in both sites, but it is unclear whether P. reticulata alone was restocked due to poor survival or both P. reticulata and G. affinis were restocked. The study authors reported the mean value of younger larvae and of older larvae per m².
Mean baseline data, measured immediately before introduction of fish, was comparable in the control and intervention checks in Shaartuz (Birlyash village). In Farkhor district (Kizilpakhtachi village), mean baseline values reported were lower in the control checks than in the intervention checks. The study authors monitored the immature Anopheles population up to 62 (Birlyash village) or 65 days (Kizilpakhtachi village) after introduction of fish. The number of immature Anopheles mosquitoes decreased in both intervention sites using G. affinis and in one site using P. reticulata (Kizilpakhtachi village) (Table 15a; Table 16a). However, in Shaartuz district (Birlyash village), a partial effect was noted using P. reticulata with rebound above baseline levels (Table 15a).
This study provided some evidence of a larvicidal effect of G. affinis fish on immature Anopheles mosquitoes in rice field plots. With P. reticulata, there was some evidence of a larvicidal effect in one district and a partial effect in one district with rebound.
Table 15a.Zvantsov 2008: density of younger and older anopheline larvae after introduction of fish in Shaartuz district (Birlyash village)
| Intervention | Larvae | Follow‐up (days) | ||||
| 0 | 10 | 33 | 48 | 62 | ||
| Control | Younger | 6 | 8 | 17 | 28 | 30 |
| Older | 4 | 3 | 7 | 12 | 14 | |
| G. affinis | Younger | 8 | 3 | 3 | 1 | 0 |
| Older | 5 | 2 | 0 | 0 | 0 | |
| P. reticulata | Younger | 7 | 5 | 15 | 16 | 20 |
| Older | 4 | 1 | 4 | 5 | 10 | |
Table 16a.Zvantsov 2008: density of younger and older anopheline larvae after introduction of fish in Farkhor district (Kizilpakhtachi village)
| Intervention | Larvae | Follow‐up (days) | ||||
| 0 | 14 | 29 | 44 | 65 | ||
| Control | Younger | 3 | 10 | 11 | 16 | 17 |
| Older | 1 | 2 | 7 | 4 | 7 | |
| G. affinis | Younger | 9 | 2 | 7 | 0 | 2 |
| Older | 6 | 1 | 2 | 0 | 0 | |
| P. reticulata | Younger | 7 | 1 | 7 | 0 | 2 |
| Older | 4 | 1 | 2 | 0 | 2 | |
Section 3: water canals
Two studies introduced fish to irrigation canals ‐ one in Kenya (Imbahale 2011a) and one in Sudan (Mahmoud 1985).
In Kenya, Imbahale and colleagues compared the effects of G. affinis introduced to ponds or water canals versus control sites. The water sources were discrete; 18 ponds were 1 m² in size and 1 m depth, and 12 canals were 15 m² in size and 0.3 m in depth. For ponds, the authors evaluated the effects of single stocking and multiple stocking of fish by measuring An. gambiae s. l. larvae twice a week for 13 weeks; and for canals, they compared controls with a single stocking of fish. The study authors divided outcomes by younger larvae (L1 and L2) and older larvae (L3 and L4), and reported estimated marginal mean values. No difference was demonstrated between control and intervention groups at follow‐up, apart from the fact that the numbers of older larvae were smaller in the canal intervention group (Table 17a).
This study provided some evidence of an effect of larvivorous fish up to 13 weeks in water canals but not in ponds.
Table 17a.Imbahale 2011a: estimated marginal mean values of immature anopheline numbers after introduction of fish
| Intervention | Follow‐up | ||
| Younger larvae (L1 and L2)1 | Older larvae (L3 and L4)1 | ||
| Ponds | Control | 2.667 (2.217 to 3.117) | 0.758 (0.551 to 0.964) |
| Fish (stocked once) | 2.667 (2.217 to 3.117) | 0.964 (0.757 to 1.170) | |
| Fish (multiple stocking) | 3.067 (2.604 to 3.505) | 0.903 (0.697 to 1.109) | |
| Canal | Control | 3.417 (2.896 to 3.937) | 1.177 (0.974 to 1.380) |
| Fish (stocked once) | 1.906 (1.386 to 2.427) | 0.547 (0.344 to 0.750) | |
1The study authors reported the estimated marginal mean ± 95% confidence interval (CI).
In Sudan, Mahmoud and colleagues introduced G. affinis to Gezira irrigation canals (4 km to 10 km in length, 2 m in width, 1 m in depth). They used 20 canals in the intervention group and five canals in the control group. In intervention canals, they released fish at 1 km intervals. They measured the density of a late larval stage of Anopheles arabiensis (L4) larvae in both intervention and control canals by performing larval dips at two spots per kilometre in each canal, reporting means by month from weekly dipping of 10 dips per spot for 14 months.
No baseline was provided, but An. arabiensis density was less in intervention canals for two months (five months' and six months' post‐intervention) just before and at the beginning of the dry season (Table 18a). Larval densities dropped in both intervention and control groups in the dry season (seven months' post‐intervention) and at the end of the rainy season (13 months' post‐intervention). Fish numbers failed to increase after the rainy season and during the last six months of the study. According to the authors, control of the flow of water from large to branch canals by gates deprived the fish of free movement. Also, during the rainy season, rainwater pools act as suitable larval sites for An. arabiensis.
Introducing larvivorous fish appeared to partly constrain An. arabiensis larval density increases at the beginning of the dry season.
Table 18a.Mahmoud 1985:density of An. arabiensis L4 larvae after introduction of fish
| Intervention | Follow‐up (months) | |||
| 3 | 5 | 7 | 13 | |
| Control | 42 | 153 | 7 | 125 |
| Intervention | 25 | 24 | 1 | 124 |

Larvivorous fish for preventing malaria transmission: conceptual framework.

Experimental designs that have been used to attempt to evaluate the impact of fish on the larvae of vectors in malaria‐endemic countries. In this figure, we depicted either two or six sample time points (shown by the arrows) as examples. Studies may sample at more time points, or at fewer time points in the case of time series studies.
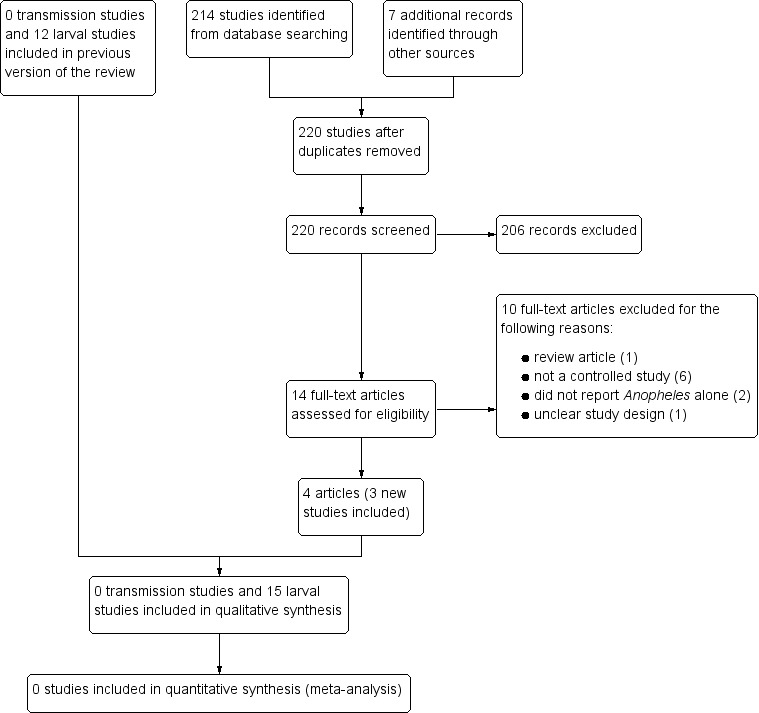
Study flow diagram
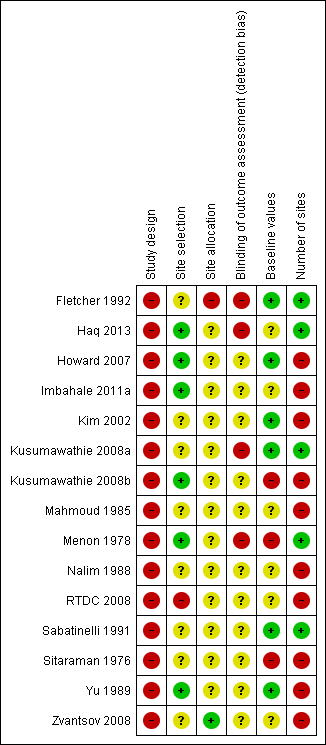
'Risk of bias' summary: review authors' judgements about each 'Risk of bias' item for each included study

'Risk of bias' graph: review authors' judgements about each 'Risk of bias' item presented as percentages across all included studies
| Larvivorous fish for preventing malaria transmission | ||||||
| Patient or population: people living in malaria‐endemic areas Settings: malaria‐endemic areas Intervention: larvivorous fish Control: no larvivorous fish | ||||||
| Outcomes | Illustrative comparative risks* (95% CI) | Relative effect | Number of studies | Certainty of the evidence | Comments | |
| Assumed risk | Corresponding risk | |||||
| Control | Larvivorous fish | |||||
| Effects on malaria transmission | ||||||
| Clinical malaria (incidence) | — | — | — | 0 | — | No studies |
| Entomological inoculation rate | — | — | — | 0 | — | No studies |
| Density of adult malaria vectors | — | — | — | 0 | — | No studies |
| Effects on larvae at potential mosquito larval sites | ||||||
| Density of immature vector stages in water bodies Quasi‐experimental studies | — | — | Not pooled. Variable effects reported. | 12 | ⊕⊝⊝⊝ Very low1‐9 | No clear evidence whether or not larvivorous fish reduce the density of immature anopheline mosquitoes in water bodies. |
| Larval sites positive for immature vector stages Quasi‐experimental studies | — | — | Not pooled Positive effects reported | 5 | ⊕⊕⊝⊝ Low1,2,10‐12 | Larvivorous fish may reduce the number of larval sites positive for immature anopheline mosquitoes. |
| *The basis for the assumed risk (for example, the median control group risk across studies) is provided in footnotes. The corresponding risk (and its 95% CI) is based on the assumed risk in the comparison group and the relative effect of the intervention (and its 95% CI). | ||||||
| GRADE Working Group grades of evidence. | ||||||
| 1Downgraded by two: the included studies were non‐randomized controlled trials. | ||||||
| Risk of bias factor | Risk of bias | ||
| High | Low | Unclear | |
| 1. Study design | Non‐RCT | RCT | Not clearly reported or not reported |
| 2. Site selection | Method of selection of sites within study area not described | Method of selection of sites within study area described | Not clearly reported or not reported |
| 3. Site allocation | Allocation of treatment not performed by random allocation | Allocation of treatment performed by random allocation | Not clearly reported or not reported |
| 4. Blinding of assessors | Not blinded | Blinded | Not clearly reported or not reported |
| 5. Baseline values comparable between sites | Not comparable | Comparable | Not clearly reported or not reported |
| 6. Number of sites | May be inadequate (5 to < 20 sites per group) Probably inadequate (< 5 sites per group or number of sites unknown) | Adequate number of sites (≥ 20 sites per group) | Not clearly reported or not reported |
| Abbreviations: RCT: randomized controlled trial. | |||
| Group | Site type | Study | Sites stocked | Unstocked | Site size | |
| Surface area | Depth | |||||
| Localized water bodies1 | Wells | 3402 to 3438 | 317 | Not stated | Not stated | |
| 10 | 4 | 1.5 m² | 1.5 to 2.5 m | |||
| Domestic water containers | 68 | 60 | Not stated | Not stated | ||
| 295 (30 monitored) | 25 monitored | Not stated | Not stated | |||
| 1205 | 20 | Not stated | Not stated | |||
| Fishponds and man‐made pools | 2 | 1 | 72 m² to 128 m² | Not stated | ||
| 25 | 5 | Mean 1 m² | 1 m | |||
| Riverbed pools below dams | 29 | 31 | 0.25 to 1 m² | < 1 m | ||
| 2 areas. Number of sites unknown | 2 areas. Number of sites unknown | Not stated | Not stated | |||
| Rice field plots | 3 | 1 | 300 m² to 600 m² | Not stated | ||
| Not specified | Not specified | 23.9 ha in total | Not stated | |||
| 2 | 2 | Not stated | Not stated | |||
| 4 | 2 | 45 m³ | 0.01 m | |||
| 2 areas, with 6 checks8 in 1 paddy field per area (3 checks treated with Gambusia affinis, 3 checks treated with Poecilia reticulata) | 2 areas. 3 checks in 1 paddy field per area | Each paddy field had 9 checks, and each check was 3 m × 3 m | Not stated | |||
| Water canals | 25 | 5 | Mean 15 m² | 0.3 m | ||
| 20 | 5 | 4 km to 10 km × 2 m wide | 1 m | |||
| 1Included wells, domestic water containers, fishponds and man‐made pools, and riverbed pools below dams. | ||||||
| Study | Fish species introduced | Stocking density | Type of site | Size of site | Size (maturity) of fish | Sex ratio male: female | Time of year fish introduced | Restocked |
| Aphanius dispar | 5 fish per barrel, 10 fish per cistern, 20 fish per well, 60 fish per washbasin; later, 10 fish per barrel and 40 fish per well | Domestic water containers | Not stated | Not stated | Not stated | February | Yes | |
| A. dispar | 10 to 25 fish per tank or container, depending on the container size | Domestic water containers | Not stated | Not stated | Not stated | November to December | No | |
| Oreochromis niloticus | 2 fish per m² pond surface area | Abandoned fishponds | 104 m² (pond A), 128 m² (pond C), 72 m² (pond D) | 1 to 2 months old | Not stated | January | No | |
| G. affinis | Total number based on feeding rate of 4 mosquito fish per 60 mosquito larvae per day | Man‐made pools or water canals | Pools (mean 1 m × 1 m × 1 m deep) or water canals (15 m × 1 m × 0.3 m deep) | 4 cm to 7 cm | Not stated | February | No (treatment arm: ponds fish once). Yes, every 2 weeks (treatment arms: pond fish only or water canal fish only). | |
| (1) A. latipes with T. m. niloticus. (2) Aphyocypris chinensis + T. m. niloticus. | (1) 1 pair T. m. niloticus/10 m² water surface + 0.8 A. latipes/m² water surface. (2) 1 A. chinensis/m² + 2 T. m. niloticus/10 m². | Rice fields. | Rice fields (1) 500 m², (2) 300 m², or 600 m². | Not stated. | Not stated. | June. | No. | |
| P. reticulata. | 5 fish/m² surface area. | Riverbed pools below dams. | 0.25 to 1 m² surface area and < 1 m depth. | Not stated. | 2:3 | May. | No. | |
| P. reticulata | 5 fish/m² surface area | Riverbed pools below dams | Not stated | Not stated | 2:3 | August | Yes | |
| G. holbrooki | Unclear. Authors stated a total of 8000 to 12,000 fish per canal depending on length and 1000 fish | Canals | 1 m depth, 2 m width, 4 to 10 km length | Not stated | Not stated | October | Yes | |
| G. affinis and A. blockii | 20 fish per negative well, 50 fish per positive well | Wells | Not stated | Not stated | Not stated | January | Yes | |
| P. reticulata and C. carpio | 9 C. carpio/10 m² and 2 P. reticulata/m² | Rice fields | 23.9 ha in total, but size of individual ponds not specified | Not stated | Not stated | Not stated | Yes | |
| G. affinis | Not clearly stated; study authors reported from 2 to 3 fish/m² (1st timepoint) up to 15 to 18 fish/m² (Vakhsh, Kirov 2) or 18 to 20 fish/m² (Bokhtarskiy, Sadov 3 districts) | Rice fields | Not stated | Not stated | Not stated | Not stated | Not clearly indicated | |
| P. reticulata | 3 to 5 fish/m3 | Domestic water containers | Size of domestic water containers (ablution basins and tanks) not clearly indicated | Not stated | Not stated | November | Not clearly indicated | |
| P. reticulata | Either 50 or 100 fish per well | Wells | 1.5 to 2.5 m depth, average square area 1.5 m² | Not stated | Not stated | Not stated | No | |
| A. latipes and T. m. niloticus | 2 A. latipes/m² and 2 T. m. niloticus/10 m² or 2 A. latipes/m² only | Rice fields | Each plot was 10 × 15 × 0.3 m, depth 10 cm | Not stated | Not stated | June | No | |
| G. affinis orP. reticulata | 5 pregnant females/m² (total of 45 females per 3 m × 3 m check) | Rice fields | Each paddy field had 9 checks, and each check was 3 m × 3 m | Only stated as adult and pregnant | Not stated | June to August | Yes, but unclear whether P. reticulata alone or both P. reticulata and G. affinis. Graphs indicated that both species of fish could have been introduced twice, but text stated, "Because of the problem of using guppies as larviphages, related to their much worse survival rate in the native conditions in Tajikistan than the survival rate of gambezi (which can safely be regarded as a representative of the local ichthyofauna), it was necessary to re‐release guppies into the rice checks." |
| Study ID | Pupae numbers reported | Distance between sites | Other larvivorous species present | Vegetation cleared |
| Recorded but not reported | < 1 km | Not reported | Not reported | |
| Only % reduction of L3 to L4 larvae and pupae combined reported | 13 km | Not reported | Not reported | |
| Only larvae and pupae combined reported | < 1 km | Not reported | Three ponds cleared of vegetation on a weekly basis | |
| Not reported | Not reported | Not reported | Not reported | |
| Not reported | < 1 km | Not reported for control site. For treatment site, no other larvivorous fish found. | Herbivorous fish Tilapia mossambicus niloticus used at intervention but not control sites | |
| Recorded but not reported | < 1 km | Not reported | Not reported | |
| Not reported | Not reported | Not reported | Not reported | |
| Not reported | Not reported | Not reported | Not reported | |
| Not reported | Not reported | Not reported | Not reported | |
| Not reported | Not reported | Not reported | Not reported | |
| Yes | Not reported | Not reported | Not reported | |
| Not reported | 3 km | Not reported | Not reported | |
| Yes | Not reported | Not reported | Not reported | |
| Not reported | < 1 km | Not reported | Herbivorous fish T. m. niloticus used in 1 study arm only | |
| Recorded but only larvae reported | Intervention and control in same paddy field in each site | Assessed, but not reported | Not clearly reported |
| Site type | Study | Intervention | Outcome | Result | |
| Localized water bodies | Wells | Intervention: Gambusia or Aplocheilus fish to 3438 wells; 50 fish per well if anopheline larvae present; 20 fish per well if no larvae present Control: 317 wells | Percentage of sites with An. stephensi larvae up to 4 months' follow‐up | Study appeared to provide evidence of a larvicidal effect of fish in wells using relatively high fish stocking levels. | |
| 100P. reticulata per well Intervention: 10 wells Control: 4 wells 50P. reticulata per well Intervention: 12 wells Control: 5 wells | A. stephensi larval and pupal densities up to 28 days (100 fish per well) or 22 days (50 fish per well) | At high fish stocking levels, larvae were eliminated in the first 4 days in wells but reappeared at lower levels from day 24 onwards. With lower fish stocking levels, there was a partial effect for 2 weeks only, with rebound. | |||
| Wells and domestic water containers | Intervention: Aphanius dispar (60 sites) Control: 51 sites | Percentage of sites with An. culicifacies adanensis larvae up to 11 months' follow‐up | Study provided evidence that fish introduction prevents an increase in the number of domestic water container sites with larvae compared with control up to 11 months' follow‐up. | ||
| Intervention: A. dispar (295 water containers, of which 30 were monitored) Control: 25 containers | Percentage reduction in An. stephensi L3‐L4 larvae and pupae up to 12 months' follow‐up | Study appeared to provide evidence that fish introduction reduces the number of L3‐L4 larvae and pupae in domestic water containers compared with control up to 12 months' follow‐up. | |||
| Intervention: P. reticulata fish (59 sites in November 1987, total number of sites not specified) Control: 20 ablution basins | Percentage of containers positive for An. gambiae larvae for 11 months' follow‐up | Study appeared to show that fish reduce the number of domestic wash basins with larvae when added to these sites for up to 11 months. | |||
| Fishponds and pools | Intervention: Oreochromis niloticus fish (2 ponds) Control: 1 pond | Number of immature An. gambiae and An. funestus mosquitoes for 5 months' follow‐up | Based on trends in the study authors' graph, data that we extracted from the graph, and the study authors' analysis, this study appeared to provide limited evidence of a possible larvicidal effect of fish in ponds. | ||
| See the water canals section below. | |||||
| Riverbed pools below dams | Intervention: P. reticulata (29 riverbed pools) Control: 31 pools | Percentage of pools with Anopheles larvae, mean number of Anopheles larvae per pool, and mean number of Anopheles larvae per 100 dips up to 120 days' follow‐up | At follow‐up, the intervention group had greater reductions than the control group for the outcomes of percentage of pools with Anopheles larvae, mean number of larvae per pool, and mean number of larvae per 100 dips. | ||
| Intervention: P. reticulata to all riverbed pools in Laxapana and Kotmale (1 study site) Control: all riverbed pools in Kotmale 2 and Nilambe | Percentage of pools with Anopheles larvae, mean number of Anopheles larvae per pool, and mean number of Anopheles larvae per 100 dips up to 1 year follow‐up | At follow‐up, riverbed pools stocked with fish had larger reductions in terms of presence and density of larvae. | |||
| Rice field plots | Intervention: Tilapia mossambicus and A. latipes (treatment A, 1 rice field plot) or A. chinensis and Tilapia mossambicus (treatment B and treatment C, 1 rice field plot each) Control: 3 rice field plots of similar size | Number of An. sinensis larvae up to 13 weeks' (treatment A) or 7 weeks' (treatment B and C) follow‐up | In the control group and with treatments B and C, the number of An. sinensis larvae was higher at 2 weeks' pre‐intervention than at 6 weeks' pre‐intervention. At 2 weeks' follow‐up, the An. sinensis larval population in the control group was the same as at 2 weeks' pre‐intervention, but decreased at 6 weeks' follow‐up. Larvae were clearly reduced at the 2 sites where fish were introduced. For treatment A, the number of An. sinensis larvae increased between one week' and five weeks' follow‐up at both control and intervention sites. However, the number of larvae decreased by 13 weeks' follow‐up at both control and intervention sites. This shows a mean difference in larvae density between control and intervention over the entire period of observation. However, these data were weaker, as no baseline density was noted in the intervention arm, and any difference from the control could be due to chance. | ||
| Intervention: 23.9 ha of rice fields with P. reticulata and C. carpio fish Control: did not specify the size of the control area used Total numbers of control and Intervention field plots not specified | Number of An. aconitus, An. barbirostris, and An. annularis newly emerged adult mosquitoes collected/m²/day (trap area = 0.25 m²) up to 6 years' follow‐up | Effects were mixed, with some indication of an effect of fish on An. aconitus and An. annularis, but not on An. barbirostris. | |||
| Intervention: 2 rice field plots treated with G. affinis fish Control: 2 rice field plots | Number of Anopheles larvae and pupae up to 40 or 41 days' follow‐up | Study appeared to provide evidence of a larvicidal effect of fish in rice field plots up to 40/41 days' follow‐up. | |||
| Intervention: 2 plots treated with 2 species of fish (A. latipes and Tilapia mossambicus), 2 plots treated with 1 species alone (A. latipes) Control: 2 plots | Number of An. sinensis larvae up to 4 weeks' (1 fish) or 7 weeks' (2 fish) follow‐up | At 4 weeks, larvae had increased against baseline in both control and intervention plots, but the size of the increase was lower in the 2 plots treated with 1 species. Follow‐up at 4 weeks and 7 weeks showed considerably lower values in the 2 plots treated with 2 species than in the control. | |||
| 2 areas, 1 rice field per area Intervention: per rice field, 3 checks treated with G. affinis, and 3 treated with P. reticulata Control: 3 untreated checks per rice field (a rice check is a square or rectangular area of a paddy field created by low, narrow banks of earth (dykes) that serve to divide the paddy field into manageable areas and to control the flow of water) | Density of "younger" or "older" Anopheles larvae per m² up to 62 days' (Birlyash village) or 65 days' (Kizilpakhtachi village) follow‐up | Based on data that we extracted from the study authors' graphs, this study appears to provide limited evidence of a possible larvicidal effect of G. affinis fish in the rice field plots of both areas studied. P. reticulata reduced the larval density to similar levels as G. affinis in 1 district, but the effect was less sustained compared to G. affinis in the Shaartuz district, Birlyash village. | |||
| Water canals | Ponds Intervention: single (6 ponds) and multiple stocking of G. affinis (6 ponds) Control: 6 ponds Canals Intervention: G. affinis (6 canals) Control: 6 canals | Estimated marginal mean values of younger (L1 and L2) and older (L3 and L4) An. gambiae s.l. larvae up to 13 weeks' follow‐up | No difference between control and intervention groups at follow‐up, apart from the numbers of older larvae were lower in the canal intervention group. | ||
| Intervention: 20 canals treated with G. holbrooki Control: 5 canals | Density of a late larval stage of An. arabiensis (L4) up to 13 months' follow‐up | An. arabiensis density was lower in intervention canals for 2 months (5 months' and 6 months' post‐intervention) just before and at the beginning of the dry season. Larval densities dropped in both intervention and control groups in the dry season (7 months' post‐intervention) and at the end of the rainy season (13 months' post‐intervention). Fish numbers did not increase after the rainy season and during the last 6 months of the study. According to the authors, control of the flow of water from large to branch canals by gates deprived the fish of free movement. In addition, during the rainy season, rainwater pools act as suitable larval habitats for An. arabiensis. | |||