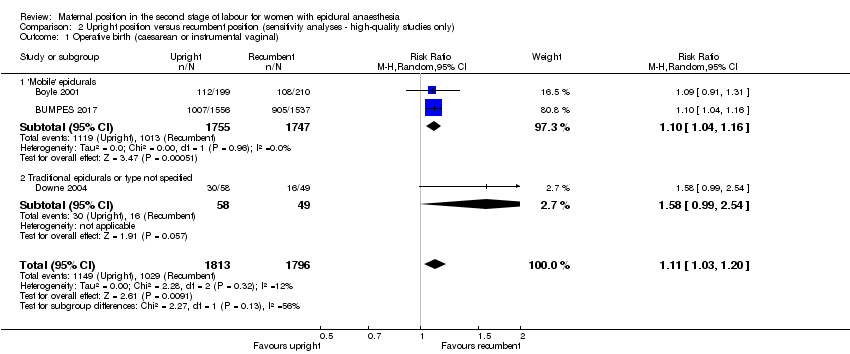
| 1 Operative birth (caesarean or instrumental vaginal) Show forest plot | 8 | 4316 | Risk Ratio (M‐H, Random, 95% CI) | 0.86 [0.70, 1.07] |
|
| 1.1 'Mobile' epidurals | 4 | 3783 | Risk Ratio (M‐H, Random, 95% CI) | 1.04 [0.90, 1.20] |
| 1.2 Traditional epidurals or type not specified | 4 | 533 | Risk Ratio (M‐H, Random, 95% CI) | 0.77 [0.48, 1.25] |
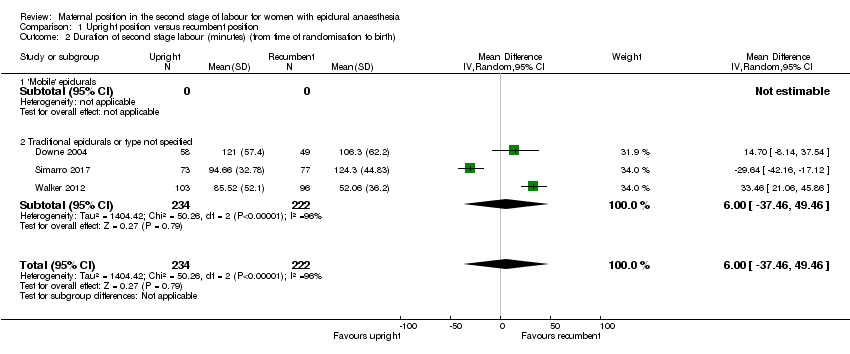
| 2 Duration of second stage labour (minutes) (from time of randomisation to birth) Show forest plot | 3 | 456 | Mean Difference (IV, Random, 95% CI) | 6.00 [‐37.46, 49.46] |
|
| 2.1 'Mobile' epidurals | 0 | 0 | Mean Difference (IV, Random, 95% CI) | 0.0 [0.0, 0.0] |
| 2.2 Traditional epidurals or type not specified | 3 | 456 | Mean Difference (IV, Random, 95% CI) | 6.00 [‐37.46, 49.46] |
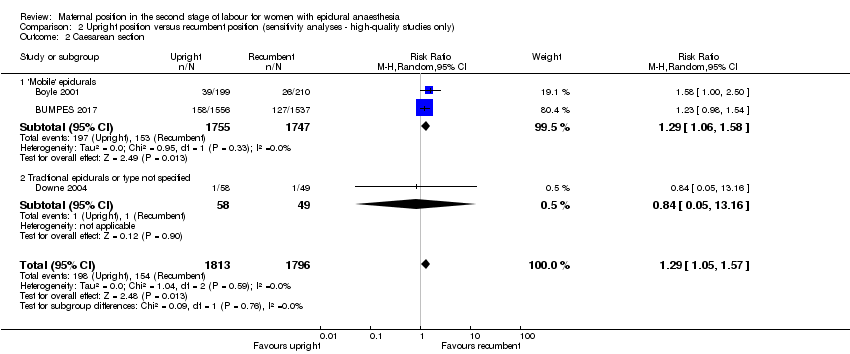
| 3 Caesarean section Show forest plot | 8 | 4316 | Risk Ratio (M‐H, Random, 95% CI) | 0.94 [0.61, 1.46] |
|
| 3.1 'Mobile' epidurals | 4 | 3783 | Risk Ratio (M‐H, Random, 95% CI) | 1.14 [0.78, 1.67] |
| 3.2 Tradtional epidurals or type not specified | 4 | 533 | Risk Ratio (M‐H, Random, 95% CI) | 0.41 [0.15, 1.16] |
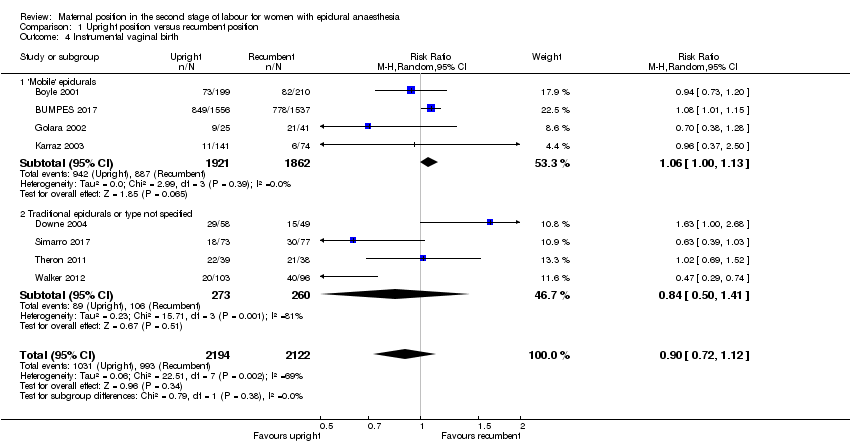
| 4 Instrumental vaginal birth Show forest plot | 8 | 4316 | Risk Ratio (M‐H, Random, 95% CI) | 0.90 [0.72, 1.12] |
|
| 4.1 'Mobile' epidurals | 4 | 3783 | Risk Ratio (M‐H, Random, 95% CI) | 1.06 [1.00, 1.13] |
| 4.2 Traditional epidurals or type not specified | 4 | 533 | Risk Ratio (M‐H, Random, 95% CI) | 0.84 [0.50, 1.41] |
| 5 Trauma to birth canal requiring suturing Show forest plot | 3 | 3266 | Risk Ratio (M‐H, Random, 95% CI) | 1.00 [0.89, 1.13] |
|
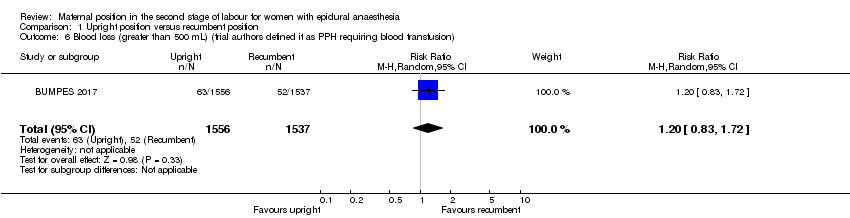
| 6 Blood loss (greater than 500 mL) (trial authors defined it as PPH requiring blood transfusion) Show forest plot | 1 | 3093 | Risk Ratio (M‐H, Random, 95% CI) | 1.20 [0.83, 1.72] |
|
| 7 Prolonged second stage, defined as pushing for more than 60 minutes (trial authors report 'duration of pushing phase' in minutes Show forest plot | 1 | 199 | Mean Difference (IV, Random, 95% CI) | ‐16.37 [‐24.55, ‐8.19] |
|
| 8 Maternal experience and satisfaction of labour Show forest plot | 1 | | Risk Ratio (M‐H, Random, 95% CI) | Subtotals only |
|
| 8.1 Satisfaction with overall childbirth experience (strongly agree & agree) | 1 | 2373 | Risk Ratio (M‐H, Random, 95% CI) | 0.95 [0.92, 0.99] |
| 8.2 Involved in making decisions (strongly agree & agree) | 1 | 2373 | Risk Ratio (M‐H, Random, 95% CI) | 0.98 [0.96, 1.00] |
| 8.3 Treated with respect by all staff (strongly agree & agree) | 1 | 2373 | Risk Ratio (M‐H, Random, 95% CI) | 0.99 [0.98, 1.01] |
| 8.4 Expectations for labour & birth were met (strongly agree & agree) | 1 | 2373 | Risk Ratio (M‐H, Random, 95% CI) | 0.99 [0.93, 1.05] |
| 8.5 Felt safe at all times (strongly agree & agree) | 1 | 2373 | Risk Ratio (M‐H, Random, 95% CI) | 0.99 [0.97, 1.02] |
| 8.6 Good communication from staff (strongly agree & agree) | 1 | 2373 | Risk Ratio (M‐H, Random, 95% CI) | 1.00 [0.98, 1.02] |
| 8.7 Felt in control (strongly agree & agree) | 1 | 2373 | Risk Ratio (M‐H, Random, 95% CI) | 1.00 [0.95, 1.06] |
| 8.8 Able to move as much as wanted (strongly agree & agree) | 1 | 2373 | Risk Ratio (M‐H, Random, 95% CI) | 0.93 [0.86, 1.01] |
| 8.9 Satisfied with position before pushing (strongly agree & agree) | 1 | 2373 | Risk Ratio (M‐H, Random, 95% CI) | 1.02 [0.98, 1.05] |
| 8.10 Satisfied with position while pushing (strongly agree & agree) | 1 | 2373 | Risk Ratio (M‐H, Random, 95% CI) | 1.01 [0.98, 1.04] |
| 8.11 Satisfied with labour pain relief (strongly agree & agree) | 1 | 2373 | Risk Ratio (M‐H, Random, 95% CI) | 0.99 [0.97, 1.02] |
| 9 Abnormal fetal heart rate patterns, requiring intervention Show forest plot | 1 | 107 | Risk Ratio (M‐H, Random, 95% CI) | 1.69 [0.32, 8.84] |
|
| 10 Apgar score less than seven at five minutes Show forest plot | 1 | 199 | Risk Ratio (M‐H, Random, 95% CI) | 0.0 [0.0, 0.0] |
|
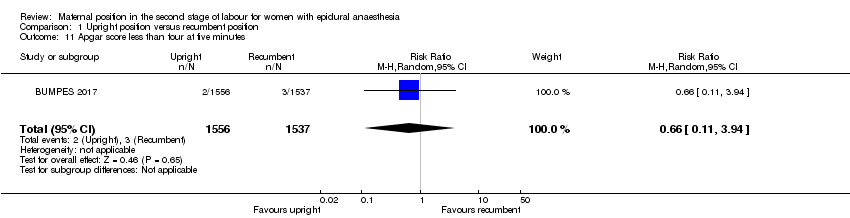
| 11 Apgar score less than four at five minutes Show forest plot | 1 | 3093 | Risk Ratio (M‐H, Random, 95% CI) | 0.66 [0.11, 3.94] |
|
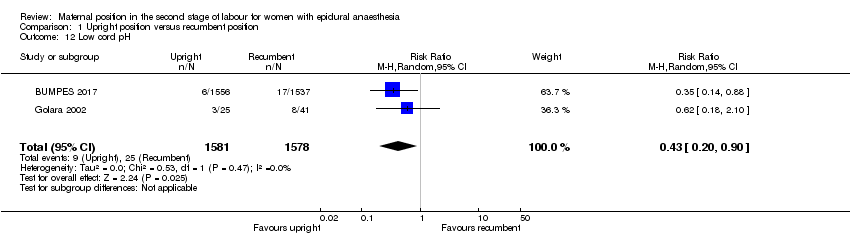
| 12 Low cord pH Show forest plot | 2 | 3159 | Risk Ratio (M‐H, Random, 95% CI) | 0.43 [0.20, 0.90] |
|
| 13 Admission to neonatal intensive care unit Show forest plot | 1 | 66 | Risk Ratio (M‐H, Random, 95% CI) | 0.54 [0.02, 12.73] |
|
| 14 Need for ventilation (trial authors report 'intubation') Show forest plot | 1 | 3093 | Risk Ratio (M‐H, Random, 95% CI) | 0.74 [0.26, 2.13] |
|
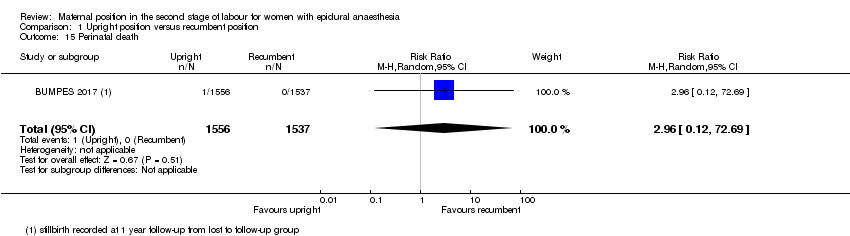
| 15 Perinatal death Show forest plot | 1 | 3093 | Risk Ratio (M‐H, Random, 95% CI) | 2.96 [0.12, 72.69] |
|