Canto como terapia complementaria para niños y adultos con fibrosis quística
Información
- DOI:
- https://doi.org/10.1002/14651858.CD008036.pub3Copiar DOI

- Base de datos:
-
- Cochrane Database of Systematic Reviews
- Versión publicada:
-
- 10 junio 2014see what's new
- Tipo:
-
- Intervention
- Etapa:
-
- Review
- Grupo Editorial Cochrane:
-
Grupo Cochrane de Fibrosis quística y enfermedades genéticas
- Copyright:
-
- Copyright © 2015 The Cochrane Collaboration. Published by John Wiley & Sons, Ltd.
Cifras del artículo
Altmetric:
Citado por:
Autores
Contributions of authors
| Protocol stage: draft the protocol | JY Irons, AB Chang, DT Kenny |
| Review stage: select which trials to include (2 + 1 arbiter) | JY Irons, AB Chang + DT Kenny |
| Review stage: draft the final review | JY Irons, AB Chang, DT Kenny |
| Update stage: update the review | JY Irons, AB Chang, P Petocz |
Sources of support
Internal sources
-
No sources of support supplied
External sources
-
NHMRC, Australia.
AC is supported by an NHMRC practitioner fellowship (grant number 545216)
Declarations of interest
The authors of the original review have conducted the only trial included in this review ‐ a randomised controlled trial with inpatients with CF. Clinical trial registration (ACTRN 12609000471280).
Acknowledgements
The review authors wish to thank Nikki Jahnke and the Cochrane Cystic Fibrosis and Genetic Disorders Review Group for their support.
Version history
| Published | Title | Stage | Authors | Version |
| 2019 Jul 12 | Singing as an adjunct therapy for children and adults with cystic fibrosis | Review | J. Yoon Irons, Peter Petocz, Dianna Theadora Kenny, Anne B Chang | |
| 2016 Sep 15 | Singing as an adjunct therapy for children and adults with cystic fibrosis | Review | J. Yoon Irons, Peter Petocz, Dianna Theadora Kenny, Anne B Chang | |
| 2014 Jun 10 | Singing as an adjunct therapy for children and adults with cystic fibrosis | Review | J. Yoon Irons, Peter Petocz, Dianna Theadora Kenny, Anne B Chang | |
| 2010 May 12 | Singing for children and adults with cystic fibrosis | Review | Jung Yoon Irons, Dianna Theadora Kenny, Anne B Chang | |
| 2009 Oct 07 | Singing for children and adults with cystic fibrosis | Protocol | Jung Yoon Irons, Dianna Theadora Kenny, Anne B Chang | |
Differences between protocol and review
In a post hoc change, the authors considered that reporting the differences (change scores) from baseline to post‐intervention or follow up, or both, in the outcome measures to be appropriate in this review.
In order to assess possible adverse effects from both treatment and control interventions "Adverse effects of the intervention" has been changed into "Adverse effects".
Keywords
MeSH
Medical Subject Headings (MeSH) Keywords
Medical Subject Headings Check Words
Adolescent; Adult; Child; Humans;
PICO

Study flow diagram.

Risk of bias summary: review authors' judgements about each risk of bias item for each included study.

Comparison 1 Respiratory muscle strength tests, Outcome 1 Change in maximal inspiratory pressure (cm H2O).

Comparison 1 Respiratory muscle strength tests, Outcome 2 Change in maximal expiratory pressure (cm H2O).
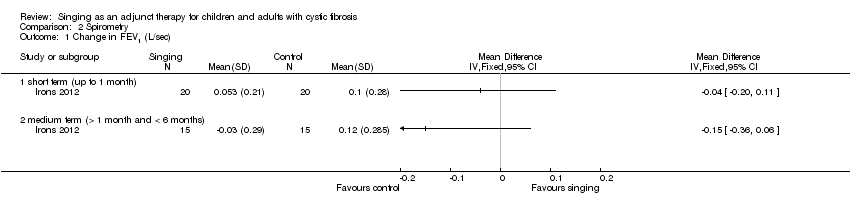
Comparison 2 Spirometry, Outcome 1 Change in FEV1 (L/sec).

Comparison 2 Spirometry, Outcome 2 Change in FVC (L).

Comparison 2 Spirometry, Outcome 3 Change in FEF25‐75% (L).
| Term | Explanation |
| cough peak flow | highest expiratory flow generated during a forced cough manoeuvre, measured in litre per second |
| visual analogue scale | a response scale commonly used in questionnaires, to indicate levels of agreement or disagreement to a statement on a continuous line, e.g. strongly disagree, disagree, agree, strongly agree |
| Domain | Time | Treatment group medians (IQR) | Statistical significance in change from baseline | Control group medians (IQR) | Statistical significance in change from baseline |
| Physical | baseline | 80.50 (54.1 to 88.88) | 72.21 (56.94 to 88.80) | ||
| post‐intervention | 83.30 (62.48 to 93.74) | 83.30 (51.39 to 95.46) | |||
| follow up | 83.30 (70.8 to 95.83) | 91.66 (75.00 to 100.00) | |||
| Emotional | baseline | 81.65 (71.46 to 87.50) | 84.97 (60.63 to 92.88) | ||
| post‐intervention | 83.30 (73.73 to 92.91) | P = 0.031 | 80.00 (64.58 to 91.65) | ||
| follow up | 75.00 (66.60 to 91.60) | 83.30 (66.66 to 100.00) | |||
| Social | baseline | 71.42 (57.10 to 79.76) | 71.80 (61.90 to 85.70) | ||
| post‐intervention | 71.81 (62.48 to 83.30) | 66.60 (54.50 to 76.17) | P = 0.044 | ||
| follow up | 71.42 (66.6 to 85.71) | 72.20 (52.38 to 90.47) | |||
| Body image | baseline | 83.29 (66.62 to 100.00) | 77.77 (69.42 to 100.00) | ||
| post‐intervention | 94.44 (66.66 to 100.00) | 83.25 (66.66 to 97.22) | |||
| follow up | 100.00 (66.60 to 100.00) | 88.80 (77.70 to 100.00) | |||
| Eating | baseline | 100.00 (55.55 to 100.00) | 100.00 (66.62 to 100.00) | ||
| post‐intervention | 88.88 (66.60 to 100.00) | 83.29 (66.62 to 100.00) | |||
| follow up | 88.88 (66.60 to 100.00) | 100.00 (88.80 to 100.00) | |||
| Treatment burden | baseline | 66.63 (55.50 to 77.77) | 61.08 (47.21 to 77.70) | ||
| post‐intervention | 77.74 (66.62 to 97.20) | P = 0.014 | 66.60 (44.44 to 94.44) | P = 0.026 | |
| follow up | 77.70 (55.50 to 100.00) | P = 0.031 | 66.60 (44.40 to 77.77) | ||
| Respiratory symptoms | baseline | 66.60 (52.08 to 77.03) | 58.30 (50.00 to 2.92) | ||
| post‐intervention | 80.54 (75.00 to 88.80) | P = 0.001 | 79.15 (60.38 to 87.43) | P = 0.002 | |
| follow up | 83.30 (72.20 to 91.66) | P = 0.016 | 83.30 (66.60 to 88.80) | P = 0.013 | |
| Digestion | baseline | 83.33 (66.62 to 100.00) | 94.40 (66.60 to 100.00) | ||
| post‐intervention | 100.00 (88.88 to 100.00) | P = 0.024 | 100.00 (66.62 to 100.00) | ||
| follow up | 100.00 (88.80 to 100.00) | 100.00 (66.66 to 100.00) | |||
| Vitality | baseline | 45.80 (33.32 to 54.17) | 49.95 (33.32 to 64.55) | ||
| post‐intervention | 41.63 (33.30 to 66.62) | 66.65 (45.83 to 91.60) | P = 0.043 | ||
| follow up | 50.00 (41.67 to 58.33) | 75.00 (49.95 to 85.40) | |||
| Health perception | baseline | 61.05 (38.86 to 80.50) | 44.42 (30.53 to 80.48) | ||
| post‐intervention | 61.05 (47.18 to 83.28) | 77.70 (61.06 to 100.00) | |||
| follow up | 55.50 (33.31 to 83.29) | 88.80 (58.32 to 94.40) | |||
| Role | baseline | 58.33 (47.90 to 77.08) | 62.47 (54.13 to 87.48) | ||
| post‐intervention | 58.30 (39.53 to 66.62) | 66.63 (58.30 to 77.08) | |||
| follow up | 75.00 (58.33 to 75.00) | 83.30 (49.95 to 95.83) | |||
| Weight | baseline | 100.00 (0.00 to 100.00) | 33.30 (24.98 to 50.00) | ||
| post‐intervention | 100.00 (24.98 to 100.00) | 66.60 (33.32 to 100.00) | |||
| follow up | 100.00 (0.00 to 100.00) | 66.60 (33.31 to 100.00) | |||
| IQR: inter‐quartile range | |||||
| Outcome or subgroup title | No. of studies | No. of participants | Statistical method | Effect size |
| 1 Change in maximal inspiratory pressure (cm H2O) Show forest plot | 1 | Mean Difference (IV, Fixed, 95% CI) | Totals not selected | |
| 1.1 short term (up to 1 month) | 1 | Mean Difference (IV, Fixed, 95% CI) | 0.0 [0.0, 0.0] | |
| 1.2 medium term (> 1 month and < 6 months) | 1 | Mean Difference (IV, Fixed, 95% CI) | 0.0 [0.0, 0.0] | |
| 2 Change in maximal expiratory pressure (cm H2O) Show forest plot | 1 | Mean Difference (IV, Fixed, 95% CI) | Totals not selected | |
| 2.1 short term (up to 1 month) | 1 | Mean Difference (IV, Fixed, 95% CI) | 0.0 [0.0, 0.0] | |
| 2.2 medium term (> 1 month and < 6 months) | 1 | Mean Difference (IV, Fixed, 95% CI) | 0.0 [0.0, 0.0] | |
| Outcome or subgroup title | No. of studies | No. of participants | Statistical method | Effect size |
| 1 Change in FEV1 (L/sec) Show forest plot | 1 | Mean Difference (IV, Fixed, 95% CI) | Totals not selected | |
| 1.1 short term (up to 1 month) | 1 | Mean Difference (IV, Fixed, 95% CI) | 0.0 [0.0, 0.0] | |
| 1.2 medium term (> 1 month and < 6 months) | 1 | Mean Difference (IV, Fixed, 95% CI) | 0.0 [0.0, 0.0] | |
| 2 Change in FVC (L) Show forest plot | 1 | Mean Difference (IV, Fixed, 95% CI) | Totals not selected | |
| 2.1 short term (up to 1 month) | 1 | Mean Difference (IV, Fixed, 95% CI) | 0.0 [0.0, 0.0] | |
| 2.2 medium term (> 1 month and < 6 months) | 1 | Mean Difference (IV, Fixed, 95% CI) | 0.0 [0.0, 0.0] | |
| 3 Change in FEF25‐75% (L) Show forest plot | 1 | Mean Difference (IV, Fixed, 95% CI) | Totals not selected | |
| 3.1 short term (up to 1 month) | 1 | Mean Difference (IV, Fixed, 95% CI) | 0.0 [0.0, 0.0] | |
| 3.2 medium term (> 1 month and < 6 months) | 1 | Mean Difference (IV, Fixed, 95% CI) | 0.0 [0.0, 0.0] | |