嚢胞性線維症小児患者および成人患者に対する補助療法としての歌唱
アブストラクト
背景
嚢胞性線維症は、主要臓器に影響を及ぼす遺伝性疾患で、生命を脅かす疾患である。嚢胞性線維症の管理には、気道クリアランス・テクニック、膵酵素やその他の薬剤を含む多面的な日常の治療計画が含まれる。過去の研究により、この集中治療の遵守は特に青年で良くないとわかっている。この疾患の本質および結果、また治療の過酷な要求により、嚢胞性線維症患者の多くでQOLは不良である。事例報告により、歌うことは全呼吸器系の適正な運動にもなり、QOLを高める感情的表現の手段にもなると示唆されている。
目的
小児患者および成人患者のQOL、病的状態、呼吸筋力、肺機能に対する、標準治療の補助療法として歌うことの効果を評価すること。
検索方法
Group’s Cystic Fibrosis Trials Register と Cochrane Central Register of Controlled Trialsを検索した。最新の検索日:2014年3月31日
連携する主要な補完的データベースおよび臨床試験登録簿も検索した。加えて、関連性のある学会紀要と雑誌をハンドサーチした。最新の検索日:2012年5月24日
選択基準
嚢胞性線維症患者を対象とした歌うこと(補助的介入として)を対照介入(例えば、コンピューターゲームをする、工作活動をする)または歌なしと比べるランダム化比較試験。
データ収集と分析
検索結果を、事前に規定した選択基準に対して再調査した。解析用に適格な試験が1件のみ得られた。
主な結果
対象となったのは小規模研究が1件のみのため、メタアナリシスを実施することはできなかった。この含まれた研究は、オーストラリアの小児病院2ヵ所で実施された並行ランダム化比較研究であった。この研究では、入院中の嚢胞性線維症小児患者(平均年齢11.6歳、男性が35%)のQOLおよび呼吸筋力に対する歌うプログラムの効果を評価した。歌群は8回の個人的な歌のセッションを受け、対照群はコンピューターゲームや映画鑑賞などの好みのレクリエーション活動に参加した。この研究には被験者数が少ないこと(51例)と、脱落率が高いこと(21%)による限界があった。
介入後または追跡調査時点で群間に有意差はなかったが、歌群にも対照群にも治療終了までにQOL質問票Cystic Fibrosis Questionnaire‐Revisedのいくつかの領域(例えば、感情的、社会的、活力の領域)において群内の統計学的に有意な増加があった。呼吸筋力の指標として、追跡調査時(介入後6~12週)の最大呼気圧は歌群のほうが高く、平均差25.80(95%信頼区間5.94~45.66)であった。介入後または追跡調査時のどちらにおいても、その他の呼吸機能パラメータ(最大吸気圧、肺活量測定)のいずれにも群間で有意差はなかった。
著者の結論
嚢胞性線維症患者を対象として、歌うことのQOLまたは呼吸パラメータに対する効果を判定するにはエビデンスが不十分であった。しかし、嚢胞性線維症のための医療以外の治療への関心は高まりつつあり、研究者らはこの高価ではない治療法が呼吸機能および心理社会的健康状態に及ぼす影響を将来さらに調査することを強く望む可能性がある。
PICO
一般語訳
嚢胞性線維症成人患者および小児患者における肺機能およびQOLに対する歌うことの効果
嚢胞性線維症患者には、気道粘膜が異常に厚いために肺感染症のリスクがある。そのため気道クリアランスは嚢胞性線維症管理の重要な部分である。増加しつつある事例報告により、嚢胞性線維症患者において歌うことは肺機能を助け、QOLを強化すると示唆されている。Cochrane Cystic Fibrosis and Genetic Disorders Groupの標準的検索法を用いて試験を検索し、その他の関連性のあるデータベースや出版物を幅広く検索した。
1件の小規模研究では、入院中の嚢胞性線維症小児患者のQOLおよび肺機能に対する歌うことの効果を評価していた。この研究では、歌うことをコンピューターゲームをする、映画を観るなどのその他の身体を使わない余暇活動と比べた。この含まれた研究には、参加者が少数であること(参加者51例のみ)と脱落率が高いこと(21%)による限界があった。この研究では、呼吸筋力、QOL、肺機能検査に対する歌うことの影響を評価した。1時点において、最大呼気圧(呼吸筋力の代替測定値)において歌うことが勝る有意差が見出された。しかし、歌う群も対照群も一部のQOLの測定値に改善を示し、その他の肺機能測定値には差が報告されなかった。歌うことが嚢胞性線維症患者における臨床的アウトカムを改善できると示唆するエビデンスは現在十分ではない。嚢胞性線維症患者にとっての歌うことの効果を評価するためには、頑健な方法を用いた研究が将来必要である。
Authors' conclusions
Background
Description of the condition
Cystic fibrosis (CF) is a genetically inherited life‐threatening condition that affects major organs, such as the lungs, pancreas, liver and kidneys. Individuals with CF produce abnormally excessive thick mucus in the airways, which makes them more susceptible to lung diseases. Repeated infections in the airways lead to irreversible lung damage (Phelan 1994).
The management of CF involves a multifaceted daily treatment regimen that usually includes airway clearance techniques, physical exercise, pancreatic enzymes and other medications, as well as hospital admissions. Such an intensive treatment regimen may have a negative psychosocial impact on children and adolescents (Glasscoe 2008), particularly on adolescents (D'Auria 2000). Previous studies have found that individuals with CF may have poor quality of life (QoL) (Quittner 2008).
Description of the intervention
For individuals with CF, the respiratory muscles play an important role in maintaining lung health (Reid 2008; Sawyer 1993). Respiratory muscle strength is vital for airway clearance techniques, as it helps to generate effective cough to expectorate secretion (Chang 2006; Widdicombe 2006). Respiratory muscle function also affects exercise capacity in people with CF (Enright 2004), and greater levels of exercise capacity are correlated with lower levels of mortality (Nixon 1992). To improve respiratory muscle function in CF, conventional treatment uses inspiratory muscle training (IMT) devices. Some research has shown that an IMT program can improve respiratory muscle function in children (Sawyer 1993); however, a recent systematic review detected only weak evidence that conventional IMT devices were beneficial (Reid 2008). Using an IMT device can also be seen as another chore for individuals with CF, given the complexity of the daily treatment regimen. In contrast, a singing intervention may provide an enjoyable activity which would also have therapeutic benefits.
The dome‐shaped diaphragm is a primary inspiratory muscle, and separates the thorax from the abdomen (Titze 1994). The diaphragm flattens as it contracts, and expands the thorax, thus increasing air intake by increasing lung volume (Leanderson 1987; Leanderson 1988). Sundberg found that singing requires greater use of vital lung capacity than normal speech, due to the longer phrases contained in songs (Sundberg 1987). Singers, therefore, need to use their lung capacity efficiently in order to sustain long phrases while singing. Classical singers use almost 100% of their vital lung capacity at the beginning of long phrases, so that extra breaths are not necessary (Sundberg 1987). Although not all trained singers use identical breathing behaviours, opera singers have been found to have highly consistent breathing strategy and greater movement of the rib cage and abdomen while singing (Thomasson 1999).
Anecdotal reports suggest that singing may be beneficial for people with chronic respiratory diseases (Elliott 2009; NHS Choices 2011; Stacy 2002).
Current literature suggests that singing interventions based on diaphragmatic breathing can improve or maintain the respiratory muscle functions in people with chronic obstructive pulmonary disease (COPD) (Bonilha 2009), multiple sclerosis (Wiens 1999) and Parkinson’s disease (Di Benedetto 2009). In these studies, the respiratory muscle strength (using maximal inspiratory pressure (MIP) and maximal expiratory pressure (MEP)) were measured as the indicators reflecting changes in the respiratory muscle strength attributed to the singing intervention.
Singing can also reduce fear, anxiety and pain perception and improve mood (Kenny 2004; Unwin 2002). Further, singing can provide not only health benefits but also enjoyment. Studies found that when singing or music were part of a breathing exercise, participants with asthma demonstrated better treatment compliance due to greater enjoyment, which enhanced their motivation (Fukuda 2000; Lipawen 2000).
Additionally, a number of anecdotal reports attest to the benefits of singing in enhancing the quality of life (QoL) of people with chronic lung diseases (Stacy 2002). Studies investigating the effects of a singing or music program on the lung health and QoL of people with COPD (Bonilha 2009; Lord 2010), emphysema (Engen 2005) and asthma (Wade 2002) indicate that singing can be an enjoyable, low‐cost and low‐risk intervention, which supports lung health and enhances QoL.
How the intervention might work
Studies show that singing requires a regulation of exhaled air flow and promotes the use of vital capacity to the fullest possible extent (Collyer 2009;Sundberg 1987). Similar to other airway clearance techniques, such as the active cycle of breathing technique (Robinson 2010), singing promotes good posture (relaxed neck and shoulders), control of breathing, and thoracic expansion. Furthermore, singing does not require a device or an assistant, and can provide some necessary enjoyment to reduce treatment burden and reinforce further training (Raskin 2009).
A singing intervention can be carried out in a one‐to‐one or in a group setting, and should be conducted in a non‐judgmental and supportive environment. The program needs to be of sufficient length and intensity to allow participants to master the diaphragmatic breathing technique. This can vary from individual to individual, depending on their age, background, illness severity, past experience with singing and music as well as the relationship between the singing facilitator and the patient. A study of people with emphysema (over 60 years of age) indicated that at least two half‐hour sessions are necessary for participants to learn the diaphragmatic breathing method correctly (Engen 2005).
Why it is important to do this review
A recent Cochrane systematic review identified very few research studies on non‐medical interventions in the field of CF (Glasscoe 2008). Despite progress in medical treatment for CF, psychological therapies to improve emotional well‐being have been limited (Elgudin 2004). To date, CF treatment has been dominated by rigorous medical treatments. Although essential, this may also reflect a disease‐oriented view, in which only the physical symptoms are treated. A single medical treatment may be unable to provide the care and management required to improve all aspects of QoL in people living with CF. A multidisciplinary treatment regimen may be effective in meeting the complex needs of individuals with CF. Research in health psychology supports this view and provides strong evidence that numerous factors influence both illness and well‐being (Bernard 1994; Knight 1998). These should be taken into account when providing a health service which aims to optimise both medical and psycho‐social health outcomes.
Singing is a relatively inexpensive adjunct intervention which can potentially enhance QoL and provide enjoyable and effective exercise for the respiratory system of people with CF.
This is an update of a previous version of this review (Irons 2010).
Objectives
To evaluate the effects of singing as an adjunct therapy to standard treatment on QoL, respiratory muscle strength, pulmonary function and morbidity of children and adults with CF.
Methods
Criteria for considering studies for this review
Types of studies
Randomised or quasi‐randomised controlled trials.
Types of participants
People with CF, of any age, diagnosed on the basis of sweat testing or genotype analysis.
Types of interventions
All types of singing intervention that included diaphragmatic breathing, which were carried out in a group or one‐to‐one setting, facilitated by singing instructors or teachers, voice coaches or trainers, or music therapists, for a minimum of two half‐hour sessions. Studies comparing singing with a control group that did not involve the activation of the respiratory muscles were to be considered (for example, playing computer games or doing craft activities). Studies using non face‐to‐face delivery format, such as DVD or CD were not considered as these formats could not address some important issues such as how to use the voice in a healthy way while singing, and to obtain immediate feedback on singing practice, posture and breathing technique. Further, individual or group singing sessions can also be adjusted to the levels of singers, which is hard to achieve through media, such as DVD or CD.
Types of outcome measures
Primary outcomes
-
QoL measured by validated instruments, e.g. Cystic Fibrosis Questionnaire‐Revised (CFQ‐R) (Quittner 2009), St. George's Respiratory Questionnaire (Jones 1991), Pediatric Quality of Life InventoryTM (PedsQLTM) (Varni 1999)
-
Respiratory muscle function
-
maximal inspiratory pressure (MIP)
-
maximal expiratory pressure (MEP)
-
cough peak flow (Table 1)
-
| Term | Explanation |
| cough peak flow | highest expiratory flow generated during a forced cough manoeuvre, measured in litre per second |
| visual analogue scale | a response scale commonly used in questionnaires, to indicate levels of agreement or disagreement to a statement on a continuous line, e.g. strongly disagree, disagree, agree, strongly agree |
Secondary outcomes
-
Other subjective scores (e.g. cough diary using Likert scales or visual analogue scales (Table 1) measuring subjective assessment of interference of cough)
-
Spirometry
-
forced expiratory volume in one second (FEV1)
-
forced vital capacity (FVC)
-
forced mid‐expiratory flow rate (FEF25‐75%)
-
-
Number of participants experiencing adverse effects (e.g. coughing up blood and difficulty in breathing)
-
Respiratory exacerbations
-
total number of hospitalised days
-
total number of symptomatic days
-
number of participants with respiratory exacerbations
-
-
Adherence to other CF treatments (e.g. measured by a diary, self‐evaluation checklist)
-
Psychological assessments measuring self‐efficacy, depression and anxiety
Search methods for identification of studies
There were no language or publication restrictions.
Electronic searches
We searched the Group's Cystic Fibrosis Trials Register for relevant trials using the terms: 'cystic fibrosis' AND 'singing'.
The Cystic Fibrosis Trials Register is compiled from electronic searches of the Cochrane Central Register of Controlled Trials (CENTRAL) (updated each new issue of The Cochrane Library), quarterly searches of MEDLINE, a search of Embase to 1995 and the prospective handsearching of two journals ‐ Pediatric Pulmonology and the Journal of Cystic Fibrosis. Unpublished work is identified by searching the abstract books of three major cystic fibrosis conferences: the International Cystic Fibrosis Conference; the European Cystic Fibrosis Conference and the North American Cystic Fibrosis Conference. For full details of all searching activities for the register, please see the relevant sections of the Cystic Fibrosis and Genetic Disorders Group Module.
Date of search: 31 March 2014.
We also searched the following sources; please see the appendices for details of search terms and dates:
-
Allied and Complementary Database AMED (1985 to 2012) (Appendix 1);
-
PsycINFO (1872 to 2012) (Appendix 2);
-
CINAHL (all years to present) (Appendix 3);
-
Dissertation Abstracts International (late 1960 to 2012) (Appendix 4);
-
www.clinicaltrials.gov (all years to 2012) (Appendix 5);
-
Music therapy research database (all years to 24/09/2009) (Appendix 6);
-
National Research Register (NRR) Archive (2000 to 2012) (Appendix 7).
Note: the Music Therapy Research Database has been inactive so there was no new search for the 2012 update.
Searching other resources
We searched other relevant publications, including hand searching of music or singing or music therapy journals.
| Journal | Date searched |
| Nordic Journal of Music Therapy (2003 ‐ 2012; Vol 21 (Issue 1)) | 24/05/2012 |
| Australian Journal of Music Therapy (1996 ‐ 2011; Vol 22) | 24/05/2012 |
| The New Zealand Journal of Music Therapy (1987 ‐ 2012) | 24/05/2012 |
| The British Journal of Music therapy (1987 ‐ 2011) | 24/05/2012 |
| Musiktherapeutische Umschau (German Music Therapy Journal) (2000 ‐ 2011) | 24/05/2012 |
Further, we have contacted experts (singing or music therapy‐related researchers and singing facilitators or teachers) in this area and on receipt of written communication from the authors of trials, would have included these in the review as necessary.
Data collection and analysis
Selection of studies
Two authors (JYI, AC) independently assessed studies for inclusion in the review based on the inclusion criteria stated above. If there was any disagreement in this process, they would have consulted with the third author (DK) and resolved by discussion.
Data extraction and management
Two authors (JYI, AC) independently extracted data from the eligible study on to a standard data extraction form. One author (JYI) entered the data into RevMan for analysis (RevMan 2011) and AC checked the entered data.
The authors reviewed the study that satisfied the inclusion criteria and recorded the following information: study setting, year of study, source of funding, participants recruitment details (including number of eligible people), inclusion and exclusion criteria, other symptoms, randomisation and allocation concealment method, numbers of participants randomised, blinding (masking) of participants, care providers and outcome assessors, duration of intervention, previous singing training, co‐interventions, numbers of participants not followed up, reasons for withdrawals from study protocol (clinical, side‐effects, refusal and other), details on side‐effects of therapy, and whether intention‐to‐treat analyses were conducted. The authors extracted data on the outcomes described previously at three points: short term (at less than one month), medium term (over one month and up to six months), and longer term (over six months and up to one year and annually thereafter). If in future updates of this review, the authors include further studies and if necessary, they planned to contact the study authors for any missing information.
In a post hoc change, the authors considered that reporting the differences (change scores) from baseline to post‐intervention or follow up, or both, in the outcome measures to be appropriate in this review.
Assessment of risk of bias in included studies
Two review authors independently assessed the risk of bias of the included study using the 'Risk of Bias' tool as described in Chapter 8 of the Cochrane Handbook for Systematic Reviews of Interventions (Higgins 2011).
Generation of the allocation sequence
The authors assessed the study for the generation of allocation sequence as follows:
-
low risk of bias, if methods of randomisation include using a random number table, computer‐generated lists or similar methods;
-
unclear risk of bias, if the trial was described as randomised, but no description of the methods used to allocate participants to treatment group was described;
-
high risk of bias, if methods of randomisation include alternation, the use of case record numbers, dates of birth or day of the week, and any procedure that was entirely transparent before allocation.
Allocation concealment
The authors assessed whether allocation was adequately concealed, to prevent both participants and investigators from foreseeing assignment:
-
low risk of bias, if the allocation of participants involved a central independent unit, on‐site locked computer, identically appearing numbered drug bottles or containers prepared by an independent pharmacist or investigator, or sealed opaque envelopes;
-
unclear risk of bias, if the method used to conceal the allocation was not described;
-
high risk of bias, if the allocation sequence was known to the investigators who assigned participants, for example it was based on day of admission or case record number.
Blinding (or masking)
Due to the nature of the intervention, it is impossible to blind participants. The authors assessed the included study as to whether the outcome assessors were blinded to treatment allocation (low risk of bias); unclear whether they were blinded (unclear risk of bias); or not blinded to treatment (high risk of bias).
Follow up
The authors graded the study as to whether numbers of and reasons for dropouts and withdrawals in all intervention groups were described; or whether it was specified that there were no dropouts or withdrawals:
-
low risk of bias, if reasons for dropouts and withdrawals described;
-
unclear risk of bias, if insufficient or selective reporting of dropouts and withdrawals;
-
high risk of bias, if not reporting reasons for dropouts and withdrawals likely to be related to true outcome.
Selective outcome reporting
The authors tried to identify and report on any selective reporting in the included study, by comparing the study protocol with the final published paper. If in future the authors include further studies, for which the protocols are not available, the authors will compare the 'Methods' and 'Results' sections of the published study. Authors will make risk of bias judgements as follows:
-
low risk of bias, if all outcomes reported as being measured were reported;
-
unclear risk of bias, if it was unclear whether all measured outcomes were reported;
-
high risk of bias, if not all outcomes that were measured were reported.
Other potential sources of bias
The authors tried to identify any other sources of bias not reported elsewhere in the review and assessed their potential for putting the study results at risk of bias.
Measures of treatment effect
If the authors had identified more than one study, they would have undertaken an initial qualitative comparison of all the individually analysed studies to examine whether pooling of results (meta‐analysis) was reasonable. This would have taken into account differences in study populations, inclusion and exclusion criteria, interventions and outcome assessment. The results from studies that met the inclusion criteria and that report any of the outcomes of interest would have been included in the subsequent meta‐analyses.
For the dichotomous outcome variables of each individual study, the authors planned to calculate the odds ratio (OR) and 95% confidence intervals (CIs) using intention to treat analysis. The authors used the Cochrane statistical package RevMan 5.1 (RevMan 2011). If the authors include more studies in future, they will calculate the numbers needed to treat (NNT) from the pooled OR and its 95% CI applied to a specified baseline risk (from the control group) using an online calculator (Cates 2003).
For continuous outcomes, the authors calculated the mean difference (MD) and 95% CIs using RevMan 5.1 (RevMan 2011) using 'as treated' approach. If, in future, studies report outcomes using different measurement scales, the authors will calculate the standardised mean difference.
Unit of analysis issues
Cross‐over trials are not appropriate for this intervention and thus the authors planned to only include data from the first arm of any cross‐over studies.
Dealing with missing data
The authors would have requested further information from the primary investigators where appropriate.
Assessment of heterogeneity
If more than one study were available, the authors planned to describe heterogeneity between the study results and test this to see if it reached statistical significance using the chi2 test. The authors would have considered heterogeneity to be significant if the P value was less than 0.10 (Higgins 2011). The authors also planned to present the I² statistic, which quantifies the inconsistency of the results of the studies as described in Chapter 9 of the Cochrane Handbook for Systematic Reviews of Interventions (Higgins 2011), and would have defined heterogeneity as low if less than 25%, moderate if the value was between 25% and 75%, and high if the value was over 75% (Higgins 2003).
Assessment of reporting biases
If the combination of data and a meta‐analysis (with at least 10 studies) had been possible, the authors would have assessed publication bias using a funnel plot.
Data synthesis
The authors calculated the summary OR and mean differences with 95% CIs using a fixed‐effect model. They would have used a random‐effects model if they had concerns about statistical heterogeneity, i.e. when there was at least moderate heterogeneity as defined above using the I² statistic, where I² is at least 50%.
The authors planned only to combine 'Other subjective scores' (see Secondary outcomes), if they deemed it clinically appropriate.
Subgroup analysis and investigation of heterogeneity
If the authors had been able to include sufficient studies in the review and it was appropriate, they planned the following a priori sub‐group analyses:
-
children (under 18 years old) versus adults;
-
severity of CF (based on FEV1% predicted, where over 80% is classified as mild; 50% to 79% is classified as moderate; 30% to 49% is classified as severe; and less than 30% is classified as very severe);
-
type of singing intervention (e.g. individual or group singing, length of follow up);
-
intervention conducted during an acute exacerbation versus stable state.
Sensitivity analysis
The authors also planned sensitivity analyses to assess the impact of the potentially important factors on the overall outcomes, if there were sufficient studies (n = 10):
-
variation in the inclusion criteria (e.g. studies conducted during exacerbations versus stable state, duration of intervention);
-
risk of bias in the included studies (selection, performance, detection, attrition and reporting bias);
-
analysis using random‐effects model (to assess heterogeneity).
Results
Description of studies
Results of the search
Two authors (JYI and AC) undertook initial screening of the abstracts of these studies. Since the 2009 review, an additional 156 potential studies were identified; a total of 17 papers were reviewed for detailed assessment. Of these, none fulfilled the inclusion criteria; hence in the current review four studies are listed in the Characteristics of excluded studies table. The Irons study, previously listed as ongoing in the original review, has since been completed, and been added as the sole included study (Irons 2012). A study flow diagram is shown in the figures (Figure 1).

Study flow diagram.
Included studies
The included study was a dual‐centre (both in Australia), parallel, randomised controlled study, which included hospitalised children and adolescents (aged 7 to 17 years) with a pulmonary exacerbation (Irons 2012). A total of 51 young people were randomly assigned to either a singing group or a control group participating in non‐physical recreational activities. The singing group participated in eight individual singing lessons during hospitalisation over a period of approximately two weeks; these lessons consisted of:
-
exercises to develop the desired posture for singing;
-
diaphragmatic breathing exercises;
-
vocal warm‐ups; and
-
singing using the diaphragmatic technique.
Children in the control group participated in their preferred non‐physical recreational activities (e.g. playing computer games or watching movies) for the same period of time. Outcome measures included CFQ‐R (QoL), MIP, MEP and spirometry (FEV1, FVC, FEF25‐75%). These were reported at post‐intervention (approximately two weeks from baseline) and follow up (six to eight weeks post‐intervention). In addition, for the post‐intervention period a singing diary, which consisted of six simple daily tasks for six weeks, was given to the participants in the singing group only in order to encourage their singing activities at home. The participants of the control group were encouraged to perform their usual CF management at home.
Only 40 participants (20 for each group) were included in analysis at post‐intervention and 30 (15 for each group) at follow up.
Excluded studies
A total of four studies were excluded (Grasso 2000; Kaak 2011; Reichardt 2011; Roux 2007). One music therapy study used pre‐recorded music as an adjunct to regular chest physiotherapy for toddlers with CF (under 24 months old) and their caregivers; however, singing was not explored in this study (Grasso 2000). Another study investigated the effects of listening to Bach's Magnificat (a religious choral work) on 40 adults with pneumonia or acute bronchitis; again singing (as opposed to listening to music) was not part of the intervention in this study (Roux 2007). Two further studies, both in German, were excluded: one investigated the effects of playing the didgeridoo (as opposed to singing) with people with CF (Kaak 2011); and the remaining study reported the benefits of a singing program (Hustifex® ‐ Brummer®) based on observations; however the program was designed for patients with chronic obstructive pulmonary disease and not CF (Reichardt 2011).
Risk of bias in included studies
An overview of our judgement of the risk of bias in the included study is presented in the figures (Figure 2).

Risk of bias summary: review authors' judgements about each risk of bias item for each included study.
Allocation
The randomisation sequence was computer‐generated by a person external to the study; thus there is a low risk of bias (Irons 2012). Allocation was concealed by using opaque stickers on a randomisation list, and again the risk of bias is low (Irons 2012).
Blinding
Due to the nature of intervention, blinding was not possible for either patients or clinicians, leading to a high risk of bias. In addition, the researcher who collected the QoL data was not blinded to the intervention allocation, leading to a high risk of bias for these outcomes. However, the respiratory scientists who collected data for all lung function tests were blinded to participants' allocation. This factor gave a low risk of bias due to blinding for outcome assessors for these outcomes (Irons 2012).
Incomplete outcome data
The attrition rate was high, which may represent a bias; however, there were similar dropout rates in both groups (Irons 2012). The authors judged there to be an high risk of bias for this domain.
Selective reporting
The study was considered at low risk of bias for reporting bias. The study reported all outcomes according to their protocol in line with the record on the Australian New Zealand Clinical Trials Registry. The authors also reported all time‐points (baseline, post‐intervention, follow up) as planned (Irons 2012).
Other potential sources of bias
There may have been a selection bias, as people with a previous positive experience of singing may have been more likely to agree to enrol in a singing study (high risk of bias).
The paper did not report the sample size calculation. Study authors reported that the calculation was based on power of 90% (at 5% significance) for a MD (standard deviation (SD)) of 10 (10) cm H2O in MIP between groups (Irons 2012). This estimated a required sample size of 23 participants per group.
Effects of interventions
Primary outcomes
1. QoL
There were no significant differences between the two groups at either post‐intervention or follow up. Although there were some within‐group statistically significant increases in some domains for treatment and control groups (e.g. emotional, social and vitality) between baseline and post‐intervention assessment, as presented in the additional tables (Table 2).
| Domain | Time | Treatment group medians (IQR) | Statistical significance in change from baseline | Control group medians (IQR) | Statistical significance in change from baseline |
| Physical | baseline | 80.50 (54.1 to 88.88) | 72.21 (56.94 to 88.80) | ||
| post‐intervention | 83.30 (62.48 to 93.74) | 83.30 (51.39 to 95.46) | |||
| follow up | 83.30 (70.8 to 95.83) | 91.66 (75.00 to 100.00) | |||
| Emotional | baseline | 81.65 (71.46 to 87.50) | 84.97 (60.63 to 92.88) | ||
| post‐intervention | 83.30 (73.73 to 92.91) | P = 0.031 | 80.00 (64.58 to 91.65) | ||
| follow up | 75.00 (66.60 to 91.60) | 83.30 (66.66 to 100.00) | |||
| Social | baseline | 71.42 (57.10 to 79.76) | 71.80 (61.90 to 85.70) | ||
| post‐intervention | 71.81 (62.48 to 83.30) | 66.60 (54.50 to 76.17) | P = 0.044 | ||
| follow up | 71.42 (66.6 to 85.71) | 72.20 (52.38 to 90.47) | |||
| Body image | baseline | 83.29 (66.62 to 100.00) | 77.77 (69.42 to 100.00) | ||
| post‐intervention | 94.44 (66.66 to 100.00) | 83.25 (66.66 to 97.22) | |||
| follow up | 100.00 (66.60 to 100.00) | 88.80 (77.70 to 100.00) | |||
| Eating | baseline | 100.00 (55.55 to 100.00) | 100.00 (66.62 to 100.00) | ||
| post‐intervention | 88.88 (66.60 to 100.00) | 83.29 (66.62 to 100.00) | |||
| follow up | 88.88 (66.60 to 100.00) | 100.00 (88.80 to 100.00) | |||
| Treatment burden | baseline | 66.63 (55.50 to 77.77) | 61.08 (47.21 to 77.70) | ||
| post‐intervention | 77.74 (66.62 to 97.20) | P = 0.014 | 66.60 (44.44 to 94.44) | P = 0.026 | |
| follow up | 77.70 (55.50 to 100.00) | P = 0.031 | 66.60 (44.40 to 77.77) | ||
| Respiratory symptoms | baseline | 66.60 (52.08 to 77.03) | 58.30 (50.00 to 2.92) | ||
| post‐intervention | 80.54 (75.00 to 88.80) | P = 0.001 | 79.15 (60.38 to 87.43) | P = 0.002 | |
| follow up | 83.30 (72.20 to 91.66) | P = 0.016 | 83.30 (66.60 to 88.80) | P = 0.013 | |
| Digestion | baseline | 83.33 (66.62 to 100.00) | 94.40 (66.60 to 100.00) | ||
| post‐intervention | 100.00 (88.88 to 100.00) | P = 0.024 | 100.00 (66.62 to 100.00) | ||
| follow up | 100.00 (88.80 to 100.00) | 100.00 (66.66 to 100.00) | |||
| Vitality | baseline | 45.80 (33.32 to 54.17) | 49.95 (33.32 to 64.55) | ||
| post‐intervention | 41.63 (33.30 to 66.62) | 66.65 (45.83 to 91.60) | P = 0.043 | ||
| follow up | 50.00 (41.67 to 58.33) | 75.00 (49.95 to 85.40) | |||
| Health perception | baseline | 61.05 (38.86 to 80.50) | 44.42 (30.53 to 80.48) | ||
| post‐intervention | 61.05 (47.18 to 83.28) | 77.70 (61.06 to 100.00) | |||
| follow up | 55.50 (33.31 to 83.29) | 88.80 (58.32 to 94.40) | |||
| Role | baseline | 58.33 (47.90 to 77.08) | 62.47 (54.13 to 87.48) | ||
| post‐intervention | 58.30 (39.53 to 66.62) | 66.63 (58.30 to 77.08) | |||
| follow up | 75.00 (58.33 to 75.00) | 83.30 (49.95 to 95.83) | |||
| Weight | baseline | 100.00 (0.00 to 100.00) | 33.30 (24.98 to 50.00) | ||
| post‐intervention | 100.00 (24.98 to 100.00) | 66.60 (33.32 to 100.00) | |||
| follow up | 100.00 (0.00 to 100.00) | 66.60 (33.31 to 100.00) |
IQR: inter‐quartile range
Investigators assessed QoL using the CFQ‐R questionnaire which has 12 different domains, some of which apply only for adolescents (from 14 years of age) (Quittner 2009). The data from 40 participants in these 12 domains were partially skewed, and thus non‐parametric tests (Wilcoxon signed‐rank) were performed for the original analysis. We present medians and IQR at baseline, post‐intervention and follow up in the additional tables (Table 2), since it would be inappropriate to analyse the means and SD of the QoL data from the included study (Irons 2012). Post‐intervention assessment took place after eight sessions (i.e. on average, between 10 and 14 days from baseline). Follow‐up assessment took place six to eight weeks after the post‐intervention time‐point. There were 40 participants included in the analysis from baseline to post‐intervention, while 30 were included for follow‐up analysis. Four domains (vitality, health perception, role and weight) apply only for adolescents (between14 and 17 years of age). For these domains, data from six adolescents from each group were included for the post‐intervention analysis and from five adolescents for the follow‐up analysis.
2. Respiratory muscle function
a. MIP
There were no statistically significant differences between the singing and control groups at either post‐intervention, MD 6.00 (95% CI ‐1.67 to 13.67); or follow up, MD 4.40 (95% CI ‐9.36 to 18.16) (Analysis 1.1).
b. MEP
There were no statistically significant differences between the singing and control groups at post‐intervention, MD 3.05 (95% CI ‐12.43 to 18.53). However, statistical significance in the mean difference was detected at follow up favouring the singing group, MD 25.80 (95% CI 5.94 to 45.66) (Analysis 1.2).
c. Cough peak flow
This outcome was not reported.
Secondary outcomes
1. Other subjective scores
Other subjective scores (e.g. cough diary using Likert scales or visual analogue scales measuring subjective assessment of interference of cough) were not reported.
2. Spirometry
a. FEV1
There were no statistically significant differences between the two groups at either post‐intervention, MD ‐0.04 (95% CI ‐0.20 to 0.11); or follow up, MD ‐0.15 (95% CI ‐0.36 to 0.06) (Analysis 2.1).
b. FVC
There were no statistically significant differences between the two groups at either post‐intervention, MD ‐0.10 (95% CI ‐0.25 to 0.06); or follow up, MD ‐0.11 (95% CI ‐0.29 to 0.07) (Analysis 2.2).
c. FEF25‐75%
There were no statistically significant differences between the two groups at either post‐intervention, MD ‐0.03 (95% CI ‐0.39 to 0.33); or follow up, MD ‐0.29 (95% CI ‐0.81 to 0.24) (Analysis 2.3).
3. Number of participants experiencing adverse effects
Irons reported that no adverse effects were observed in the singing group; adverse events for the control group were not reported in the paper.
4. Respiratory exacerbations
a. total number of hospitalised days
This outcome was not reported.
b. total number of symptomatic days
This outcome was not reported.
c. number of participants with respiratory exacerbations
This outcome was not reported.
6. Adherence to other CF treatments
This outcome was not reported.
7. Psychological assessments measuring self‐efficacy, depression and anxiety
This outcome was not reported.
Discussion
Summary of main results
In this update, only one small study conducted by three of the review authors has been included (Irons 2012). At follow up, a statistically significant improvement in MEP favouring the singing group was found, MD 25.80 (95% CI 5.94 to 45.66); however there were no differences in other lung function parameters and both groups experienced improvements in a number of QoL domains. At follow up, only the singing group continued with any form of the intervention; although singing sessions did not continue as they had in the hospital, participants were asked to keep a diary of six simple singing tasks for six to eight weeks following hospital discharge.
Overall completeness and applicability of evidence
There is insufficient evidence to make a judgement on the efficacy of singing for people with CF. The single included study was limited by the small sample size, high attrition rate and the limited applicability of MIP and MEP (Irons 2012). There is no guideline on the minimal clinically important difference in MIP and MEP for children and adolescents with CF; and the normal range of MIP and MEP is reported to be wide (Domenech‐Clar 2003). Therefore, the result should be interpreted with caution.
Quality of the evidence
The quality of the evidence is currently low due to the small sample size, high attrition rate of participants and the non‐blinded assessment of QoL measures.
Potential biases in the review process
The authors sought to limit potential biases through extensive searches and attempts to identify all relevant studies. As already declared in the protocol, authors of the included study are also authors of this review.
Agreements and disagreements with other studies or reviews
The results of the included study (Irons 2012) were similar to those of previous singing studies in other chronic respiratory conditions (Bonilha 2009; Lord 2010), in multiple sclerosis (MS) (Wiens 1999) and in Parkinson’s Disease (Di Benedetto 2009). While CF is a different condition to these other chronic illnesses, there are similarities with regard to the disease impact on QoL, the characteristics of the obstructive lung disease, the respiratory symptoms (difficulty in breathing, breathlessness), and the nature of the chronic conditions. For example, patients with chronic obstructive pulmonary disorder (COPD) demonstrated increased respiratory muscle strength measured by MEP (mean change from baseline to post‐intervention 3.0 H2O cm; P = 0.05) after 24 weekly singing sessions (Bonilha 2009). Another study in patients with COPD found that 12 bi‐weekly group singing sessions reduced anxiety and depression and enhanced general well‐being (Lord 2010). Also, a 12‐week singing intervention in patients with MS improved MEP (mean change from baseline to post‐intervention 2.8 H2O cm; P > 0.05) (Wiens 1999), and a 13‐week singing program in people with Parkinson’s Disease helped to improve MIP (mean change from baseline to post‐intervention 7.4 H2O cm; P = 0.02) and MEP (mean change from baseline to post‐intervention 21 H2O cm; P = 0.01) (Di Benedetto 2009).
The included study demonstrated a mean (SD) improvement of 12.1 (7.8) H2O cm in MIP scores from baseline to post‐intervention in the singing group; the mean (SD) increase of 6.1 (14.5) H2O cm seen in the control arm was less, but the difference between groups was not statistically significant (Irons 2012). Neverthless, the increase in MIP in the included study was a greater improvement than in other studies on singing as an intervention (Bonilha 2009; Di Benedetto 2009; Wiens 1999), although the numbers cannot be compared directly given the differences between other conditions (COPD, Parkinson's Disease and MS) and CF. The magnitude of the increase in MIP in the Irons study is similar to that seen with a conventional inspiratory muscle training method for 10 weeks during a stable period, a study of which reported an increase in mean MIP post‐intervention of 14 H2O cm (Sawyer 1993).
In relation to the QoL results from the Irons study, participants in both the singing and control groups showed similar improvements in respiratory symptoms and treatment burden domains at post‐intervention (Irons 2012). Only the singing group continued to have a reduced treatment burden at follow up as they had continued their singing activities at home after discharge. In addition, the control group improved in the social and vitality domains, and the singing group in the emotional and digestion domains of the CFQ‐R. Both groups' improvements in some QoL domains may be due to the standard medical treatment they received as inpatients or the fact that they were discharged from hospital, or a combination of both. It was not possible for this study design to assess the impact of singing independent of this standard treatment. In summary, without sufficient data, the effect of a singing intervention on QoL for people with CF cannot be confirmed and more studies are needed to assess possible health benefits, in light of other studies which have indicated a positive impact of singing on QoL (Bonilha 2009; Engen 2005; Kenny 2004; Lord 2010; Lord 2012; Unwin 2002; Wiens 1999).

Study flow diagram.

Risk of bias summary: review authors' judgements about each risk of bias item for each included study.

Comparison 1 Respiratory muscle strength tests, Outcome 1 Change in maximal inspiratory pressure (cm H2O).

Comparison 1 Respiratory muscle strength tests, Outcome 2 Change in maximal expiratory pressure (cm H2O).
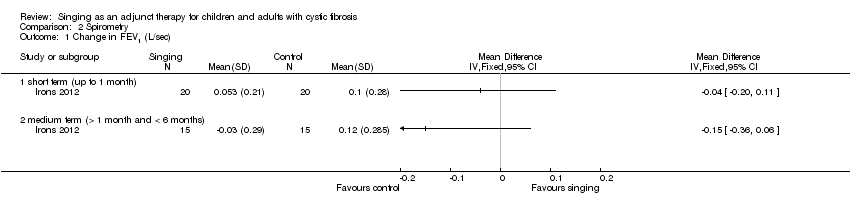
Comparison 2 Spirometry, Outcome 1 Change in FEV1 (L/sec).

Comparison 2 Spirometry, Outcome 2 Change in FVC (L).

Comparison 2 Spirometry, Outcome 3 Change in FEF25‐75% (L).
| Term | Explanation |
| cough peak flow | highest expiratory flow generated during a forced cough manoeuvre, measured in litre per second |
| visual analogue scale | a response scale commonly used in questionnaires, to indicate levels of agreement or disagreement to a statement on a continuous line, e.g. strongly disagree, disagree, agree, strongly agree |
| Domain | Time | Treatment group medians (IQR) | Statistical significance in change from baseline | Control group medians (IQR) | Statistical significance in change from baseline |
| Physical | baseline | 80.50 (54.1 to 88.88) | 72.21 (56.94 to 88.80) | ||
| post‐intervention | 83.30 (62.48 to 93.74) | 83.30 (51.39 to 95.46) | |||
| follow up | 83.30 (70.8 to 95.83) | 91.66 (75.00 to 100.00) | |||
| Emotional | baseline | 81.65 (71.46 to 87.50) | 84.97 (60.63 to 92.88) | ||
| post‐intervention | 83.30 (73.73 to 92.91) | P = 0.031 | 80.00 (64.58 to 91.65) | ||
| follow up | 75.00 (66.60 to 91.60) | 83.30 (66.66 to 100.00) | |||
| Social | baseline | 71.42 (57.10 to 79.76) | 71.80 (61.90 to 85.70) | ||
| post‐intervention | 71.81 (62.48 to 83.30) | 66.60 (54.50 to 76.17) | P = 0.044 | ||
| follow up | 71.42 (66.6 to 85.71) | 72.20 (52.38 to 90.47) | |||
| Body image | baseline | 83.29 (66.62 to 100.00) | 77.77 (69.42 to 100.00) | ||
| post‐intervention | 94.44 (66.66 to 100.00) | 83.25 (66.66 to 97.22) | |||
| follow up | 100.00 (66.60 to 100.00) | 88.80 (77.70 to 100.00) | |||
| Eating | baseline | 100.00 (55.55 to 100.00) | 100.00 (66.62 to 100.00) | ||
| post‐intervention | 88.88 (66.60 to 100.00) | 83.29 (66.62 to 100.00) | |||
| follow up | 88.88 (66.60 to 100.00) | 100.00 (88.80 to 100.00) | |||
| Treatment burden | baseline | 66.63 (55.50 to 77.77) | 61.08 (47.21 to 77.70) | ||
| post‐intervention | 77.74 (66.62 to 97.20) | P = 0.014 | 66.60 (44.44 to 94.44) | P = 0.026 | |
| follow up | 77.70 (55.50 to 100.00) | P = 0.031 | 66.60 (44.40 to 77.77) | ||
| Respiratory symptoms | baseline | 66.60 (52.08 to 77.03) | 58.30 (50.00 to 2.92) | ||
| post‐intervention | 80.54 (75.00 to 88.80) | P = 0.001 | 79.15 (60.38 to 87.43) | P = 0.002 | |
| follow up | 83.30 (72.20 to 91.66) | P = 0.016 | 83.30 (66.60 to 88.80) | P = 0.013 | |
| Digestion | baseline | 83.33 (66.62 to 100.00) | 94.40 (66.60 to 100.00) | ||
| post‐intervention | 100.00 (88.88 to 100.00) | P = 0.024 | 100.00 (66.62 to 100.00) | ||
| follow up | 100.00 (88.80 to 100.00) | 100.00 (66.66 to 100.00) | |||
| Vitality | baseline | 45.80 (33.32 to 54.17) | 49.95 (33.32 to 64.55) | ||
| post‐intervention | 41.63 (33.30 to 66.62) | 66.65 (45.83 to 91.60) | P = 0.043 | ||
| follow up | 50.00 (41.67 to 58.33) | 75.00 (49.95 to 85.40) | |||
| Health perception | baseline | 61.05 (38.86 to 80.50) | 44.42 (30.53 to 80.48) | ||
| post‐intervention | 61.05 (47.18 to 83.28) | 77.70 (61.06 to 100.00) | |||
| follow up | 55.50 (33.31 to 83.29) | 88.80 (58.32 to 94.40) | |||
| Role | baseline | 58.33 (47.90 to 77.08) | 62.47 (54.13 to 87.48) | ||
| post‐intervention | 58.30 (39.53 to 66.62) | 66.63 (58.30 to 77.08) | |||
| follow up | 75.00 (58.33 to 75.00) | 83.30 (49.95 to 95.83) | |||
| Weight | baseline | 100.00 (0.00 to 100.00) | 33.30 (24.98 to 50.00) | ||
| post‐intervention | 100.00 (24.98 to 100.00) | 66.60 (33.32 to 100.00) | |||
| follow up | 100.00 (0.00 to 100.00) | 66.60 (33.31 to 100.00) | |||
| IQR: inter‐quartile range | |||||
| Outcome or subgroup title | No. of studies | No. of participants | Statistical method | Effect size |
| 1 Change in maximal inspiratory pressure (cm H2O) Show forest plot | 1 | Mean Difference (IV, Fixed, 95% CI) | Totals not selected | |
| 1.1 short term (up to 1 month) | 1 | Mean Difference (IV, Fixed, 95% CI) | 0.0 [0.0, 0.0] | |
| 1.2 medium term (> 1 month and < 6 months) | 1 | Mean Difference (IV, Fixed, 95% CI) | 0.0 [0.0, 0.0] | |
| 2 Change in maximal expiratory pressure (cm H2O) Show forest plot | 1 | Mean Difference (IV, Fixed, 95% CI) | Totals not selected | |
| 2.1 short term (up to 1 month) | 1 | Mean Difference (IV, Fixed, 95% CI) | 0.0 [0.0, 0.0] | |
| 2.2 medium term (> 1 month and < 6 months) | 1 | Mean Difference (IV, Fixed, 95% CI) | 0.0 [0.0, 0.0] | |
| Outcome or subgroup title | No. of studies | No. of participants | Statistical method | Effect size |
| 1 Change in FEV1 (L/sec) Show forest plot | 1 | Mean Difference (IV, Fixed, 95% CI) | Totals not selected | |
| 1.1 short term (up to 1 month) | 1 | Mean Difference (IV, Fixed, 95% CI) | 0.0 [0.0, 0.0] | |
| 1.2 medium term (> 1 month and < 6 months) | 1 | Mean Difference (IV, Fixed, 95% CI) | 0.0 [0.0, 0.0] | |
| 2 Change in FVC (L) Show forest plot | 1 | Mean Difference (IV, Fixed, 95% CI) | Totals not selected | |
| 2.1 short term (up to 1 month) | 1 | Mean Difference (IV, Fixed, 95% CI) | 0.0 [0.0, 0.0] | |
| 2.2 medium term (> 1 month and < 6 months) | 1 | Mean Difference (IV, Fixed, 95% CI) | 0.0 [0.0, 0.0] | |
| 3 Change in FEF25‐75% (L) Show forest plot | 1 | Mean Difference (IV, Fixed, 95% CI) | Totals not selected | |
| 3.1 short term (up to 1 month) | 1 | Mean Difference (IV, Fixed, 95% CI) | 0.0 [0.0, 0.0] | |
| 3.2 medium term (> 1 month and < 6 months) | 1 | Mean Difference (IV, Fixed, 95% CI) | 0.0 [0.0, 0.0] | |