مقایسه رژیمهای مختلف مهارکنندههای پمپ پروتون در درمان خونریزی حاد زخم پپتیک
چکیده
پیشینه
درمان با مهارکنندههای پمپ پروتون (proton pump inhibitors; PPIs) پیامدهای بالینی را در بیماران مبتلا به خونریزی زخم پپتیک بهبود میبخشد. با این حال، دوز مطلوب و مسیر تجویز PPIها محل بحث است.
اهداف
ارزیابی اثربخشی رژیمهای مختلف PPIها در مدیریت خونریزی حاد زخم پپتیک با استفاده از شواهد حاصل از مقایسه مستقیم در کارآزماییهای تصادفیسازی و کنترل شده (randomised controlled trials; RCTs).
بهطور خاص در نظر داشتیم تا تاثیر افتراقی دوز و مسیر تجویز PPI را بر مورتالیتی، بروز خونریزی مجدد، مداخله جراحی، درمان هموستاتیک با آندوسکوپی (endoscopic haemostatic treatment; EHT) بیشتر، مدت بستری در بیمارستان، موارد نیازمند به ترانسفیوژن و عوارض جانبی ارزیابی کنیم.
روشهای جستوجو
CENTRAL (در کتابخانه کاکرین، 2010، شماره 3)؛ MEDLINE و EMBASE (از آغاز تا سپتامبر 2010) و مجموعه مقالات جلسات مهم مربوط به دستگاه گوارش (ژانویه 2000 تا سپتامبر 2010) را بدون اعمال محدودیت در زبان نگارش مقاله جستوجو کردیم. با محققان اصلی برای دریافت دادههای ازدسترفته تماس گرفته شد.
معیارهای انتخاب
RCTهایی که حداقل دو رژیم متفاوت را از PPI یکسان یا متفاوت، در بیماران مبتلا به خونریزی حاد زخم پپتیک، که به روش آندوسکوپی تشخیص داده شدند، مقایسه کردند.
گردآوری و تجزیهوتحلیل دادهها
دو نویسنده مرور بهطور مستقل از هم به انتخاب مطالعات، استخراج دادهها، و ارزیابی خطر سوگیری (bias) پرداختند. دادهها را با استفاده از روش اثرات تصادفی (random‐effect) منتل‐هنزل (Mantel‐Haenszel) سنتز کرده و متارگرسیون چند متغیره را با جایگشتهای تصادفی (random permutation) بر اساس شبیهسازی مونته کارلو (Monte Carlo) انجام دادیم. ناهمگونی را با آماره I² و تست Cochrane Q اندازهگیری کرده و سوگیری انتشار (publication bias) را با نمودارهای قیفی (funnel plots) و تست ایگر (Egger) ارزیابی کردیم. همچنین کیفیت کلی شواهد را با استفاده از رویکرد درجهبندی توصیه، ارزیابی، توسعه و ارزشیابی (Grading of Recommendations Assessment, Development and Evaluation; GRADE) ارزیابی کردیم.
نتایج اصلی
بیست و دو RCT گنجانده شدند؛ خطر سوگیری در 17 مورد بالا و در 5 مورد نامشخص بود. آنالیز اصلی شامل 13 مطالعه (1716 بیمار) بود که رژیمهای دوز «بالا» (دوز تجمعی 72 ساعته > 600 میلیگرم PPI داخل وریدی) را با دوزهای دیگر مقایسه کردند؛ هیچ ناهمگونی قابلتوجهی برای هیچ پیامد بالینی وجود نداشت. شواهدی را با کیفیت پائین پیدا کردیم که کاهش یا افزایش بالقوه مورتالیتی، خونریزی مجدد، نیاز به مداخلات جراحی یا درمان هموستاتیک با آندوسکوپی (EHT) را با رژیمهای دوز «بالا» رد نمیکرد. برای مورتالیتی، خطر نسبی (RR) تجمعی، 0.85 (95% فاصله اطمینان (CI): 0.47 تا 1.54) بود؛ تفاوت خطر (risk difference; RD) تجمعی، 0 مورد مرگومیر بیشتر در هر 100 بیمار تحت درمان با دوز «بالا» گزارش شد (95% CI؛ 1 مورد مرگومیر کمتر تا 2 مورد مرگومیر بیشتر در هر 100 بیمار درمان شده). برای خونریزی مجدد، RR تجمعی 1.27 (95% CI؛ 0.96 تا 1.67) بود؛ RD تجمعی، 2 مورد خونریزی مجدد بیشتر در هر 100 بیمار تحت درمان با دوز «بالا» بود (95% CI؛ 0 مورد کمتر تا 5 مورد خونریزی مجدد بیشتر در هر 100 بیمار درمان شده). برای مداخلات جراحی، RR تجمعی 1.33 (95% CI؛ 0.63 تا 2.77) بود؛ RD تجمعی 1 مورد مداخله جراحی بیشتر در هر 100 بیمار تحت درمان با دوز «بالا» بود (95% CI؛ 1 مداخله جراحی کمتر تا 2 مداخله جراحی بیشتر در هر 100 بیمار درمان شده). برای EHT بیشتر، RR تجمعی 1.39 (95% CI؛ 0.88 تا 2.18 بود)، RD تجمعی، 2 رویداد بیشتر در هر 100 بیمار تحت درمان با PPI با دوز «بالا» بود (95% CI؛ 1 رویداد کمتر تا 5 رویداد بیشتر در هر 100 بیمار درمان شده). شواهدی را با کیفیت متوسط پیدا کردیم که هیچ تفاوت مهمی بین دو رژیم درمانی از لحاظ طول مدت بستری در بیمارستان (تفاوت میانگین (MD): 0.26 روز؛ 95% CI؛ 0.08‐ تا 0.6 روز) یا نیاز به دریافت ترانسفیوژن خون (MD؛ 0.05 واحد؛ 95% CI؛ 0.21‐ تا 0.3 واحد) وجود ندارد. شواهد بصری و آماری مبنی بر وجود سوگیری انتشار (publication bias) «معکوس (inverse)» برای مورتالیتی وجود داشت (از دست دادن مطالعات کوچک با پیامدهای مطلوب برای دوز «بالا»)، اما نه برای پیامدهای دیگر. نتایج برای همه آنالیزهای زیر گروه (با توجه به خطر سوگیری (bias)، موقعیت جغرافیایی، مسیر تجویز برای رژیمهای درمانی با دوزی غیر از دوز «بالا»، اینفیوژن مداوم در برابر تجویز دوز بولوس برای گروه رژیمهای داخل وریدی غیر از دوز «بالا»)، آنالیزهای حساسیت (محدود به بیمارانی که EHT برای استیگماتای (stigmata) پُرخطر داشتند، استفاده از حدود آستانههای دوز متفاوت برای رژیمهای مقایسهای) و آنالیزهای تعقیبی (post hoc) (شامل تمام مطالعاتی (N = 22) که حداقل دو رژیم PPI را با دوزهای تجمعی 72 ساعته مختلف مقایسه کردند؛ محدود به آنالیزهای قبلی بیمارانی که EHT برای استیگماتای (stigmata) پُرخطر داشتند) مشابه بودند. آنالیز متارگرسیون هیچ ارتباطی آماری معنیداری را بین تاثیر درمان (برای پیامدهای مورتالیتی، خونریزی مجدد و مداخله جراحی) و سه عامل ارزیابی شده در سطح مطالعه (موقعیت جغرافیایی (آسیا در برابر غیر آسیا)، مسیر تجویز PPI (داخل وریدی در برابر خوراکی)، نسبت درون مطالعه بین دوزهای تجمعی 72 ساعته از دو رژیم درمانی PPI) نشان نداد.
نتیجهگیریهای نویسندگان
شواهد کافی برای نتیجهگیری در مورد برتری، عدم مزیت یا یکسان بودن تاثیر دوز بالای درمان PPI نسبت به دوزهای پائینتر در خونریزی زخم پپتیک وجود ندارد.
خلاصه به زبان ساده
بهترین رژیم مهارکنندههای پمپ پروتون برای زخمهای پپتیک خونریزی دهنده چه هستند؟
خونریزی ناشی از زخم معده یا دوازدهه یک مورد اورژانسی پزشکی شایع و جدی است. چنین زخمهایی معمولا در اثر مصرف داروهای ضد التهابی یا عفونت مزمن معده با باکتری به نام هلیکوباکتر پیلوری (Helicobacter pylori) ایجاد میشوند. خونریزی ناشی از این زخمها اغلب به صورت استفراغ خونی یا دفع مدفوع سیاه و قیر‐مانند مشاهده میشود. قبلا نشان داده شده بود که درمان با مهارکنندههای پمپ پروتون ((proton pump inhibitors; PPIs) ‐ داروهایی که میزان اسید معده و دوازدهه را کاهش داده و در نتیجه لخته خونی را تشکیل میدهند که خونریزی را متوقف میکند) برای این بیماران مفید است. با این حال، بهترین دوز و مسیر تجویز (خوراکی یا داخل وریدی) PPIها در این شرایط بحثبرانگیز است.
با مرور سیستماتیک تمام پژوهشهای موجود، متوجه شدیم که هنوز هم نمیتوان بهترین دوز و مسیر تجویز PPIها را تعیین کرد. نتایج ما نشان میدهند که با توجه به مرگومیرها، اپیزودهای خونریزی مجدد، جراحیهای اورژانسی و نیاز به درمانهای آندوسکوپی مکرر، مطمئن نیستیم که دوزهای داخل وریدی بالای PPIها در مقایسه با دوزهای پائین (خوراکی یا داخل وریدی)، بیشتر، کمتر یا به همان اندازه موثر هستند.
Authors' conclusions
Summary of findings
| High compared to non‐high (medium or low) dose regimen for acute peptic ulcer bleeding | ||||||
| Patient or population: patients with acute peptic ulcer bleeding | ||||||
| Outcomes | Illustrative comparative risks* (95% CI) | Relative effect | No of participants | Quality of the evidence | Comments | |
| Assumed risk | Corresponding risk | |||||
| Non‐high (medium or low) dose regimen | High | |||||
| Mortality | 3 per 100 | 3 per 100 | RR 0.85 | 1667 | ⊕⊕⊝⊝ | |
| Rebleeding | 9 per 100 | 11 per 100 | RR 1.27 | 1716 | ⊕⊕⊝⊝ | |
| Surgery | 2 per 100 | 3 per 100 | RR 1.33 | 1270 | ⊕⊕⊝⊝ | |
| Further EHT | 7 per 100 | 9 per 100 | RR 1.39 | 902 | ⊕⊕⊝⊝ | |
| Length of hospital stay | The mean length of hospital stay in the intervention group was | 1069 | ⊕⊕⊕⊝ | |||
| Blood transfusions | The mean blood transfusions in the intervention group was | 1069 | ⊕⊕⊕⊝ | |||
| *The basis for the assumed risk (e.g. the median control group risk across studies) is provided in footnotes. The corresponding risk (and its 95% confidence interval) is based on the assumed risk in the comparison group and the relative effect of the intervention (and its 95% CI). | ||||||
| GRADE Working Group grades of evidence | ||||||
| 1 Pooled risk difference. | ||||||
Background
Description of the condition
Peptic ulcer bleeding is a common medical emergency and is associated with substantial morbidity, mortality and health‐care costs (Barkun 2010b). The annual incidence of peptic ulcer bleeding in recent population‐based studies varies from 22 per 100,000 persons (van Leerdam 2003) to 57 per 100,000 persons (Lassen 2006). Approximately 3.5% of patients die during hospitalization (Targownik 2006). The mean cost of peptic ulcer bleeding is estimated to be about USD 13,680 per patient (de Leest 2004).
Description of the intervention
Proton pump inhibitor (PPI) treatment is currently part of the standard management of acute bleeding from peptic ulcer (Gralnek 2008; Leontiadis 2009).
The superior efficacy of PPIs compared to H₂‐receptor antagonists (H₂RAs) or placebo has been shown in a previous Cochrane systematic review of 24 randomized controlled trials (RCTs) comprising 4373 participants (Leontiadis 2006a). PPI treatment significantly reduced rebleeding (odds ratio (OR) 0.49; 95% confidence interval (CI) 0.37 to 0.65), surgical interventions (OR 0.61; 95% CI 0.48 to 0.78) and further endoscopic haemostatic treatment (EHT) (OR 0.32; 95% CI 0.20 to 0.51). There was no evidence of an effect of PPI treatment on all‐cause mortality rates (OR 1.01; 95% CI 0.74 to 1.40). However, PPI treatment significantly reduced mortality when the analysis was restricted to patients with the high‐risk endoscopic findings of active bleeding or a non‐bleeding visible vessel (OR 0.53; 95% CI 0.31 to 0.91), and among trials that had been conducted in Asia (OR 0.35; 95% CI 0.16 to 0.74) (Leontiadis 2006a).
How the intervention might work
In vivo studies have provided a plausible explanation as to why PPIs reduce rebleeding in patients with recent or ongoing bleeding from peptic ulcers. Hemostasis in the stomach and duodenum is antagonized by gastric acid and pepsin, which inhibit clot formation and promote lysis of previously formed clots. Plasma coagulation and platelet aggregation are compromised by 50% in the presence of gastric juice at pH 6.4. At pH 6.0, previously formed platelet aggregates break up; at pH 5.4, plasma coagulation and platelet aggregation are practically abolished; at pH 4.0, previously formed fibrin clots are dissolved (Green 1978). Such findings provided the rationale for rigorous acid suppression treatment in an attempt to maintain intragastric pH above 6.0 during the first one to three days following an episode of peptic ulcer bleeding (Leontiadis 2007b). A large number of RCTs studied the efficacy of H₂RAs (compared to placebo) in patients with peptic ulcer bleeding, but their results did not support the use of H₂RAs in this setting (Levine 2004). A Cochrane systematic review of 17 RCTs showed that PPIs significantly reduced rebleeding (OR 0.61; 95% CI 0.48 to 0.78) and need for surgical interventions (OR 0.63; 95% CI 0.49 to 0.81) compared to H₂RAs (Leontiadis 2006a).
Why it is important to do this review
Defining the lowest effective dose of PPI for patients with peptic ulcer bleeding will have important cost implications to health‐care systems and should help to optimise patient care. This has lately became even more relevant, following recent concerns about potential associations of PPI use with increased risk for a variety of negative clinical outcomes, including cardiovascular events in patients taking clopidogrel, hip fractures, pneumonia, and enteric infections, including C. difficile infection (Kwok 2012; Ngamruengphong 2011; Vakil 2009; van Boxel 2010). Although it is still uncertain if these associations are real (Chen 2012; Howden 2010; Leontiadis 2011; Leontiadis 2012; Moayyedi 2012), it would be as prudent to use PPIs in the lowest effective dose as it is to do so for all other drugs.
The role of PPI treatment prior to endoscopic diagnosis in patients presenting with presumed non‐variceal upper gastrointestinal (GI) bleeding is unclear and debatable (Sreedharan 2010), but all current treatment guidelines support the use of PPIs in patients with endoscopically diagnosed peptic ulcer bleeding (Barkun 2010a; Laine 2012; NICE 2012). However, the optimal route of administration and dose of PPIs has not been established. Some guidelines recommend high dose PPI treatment (80 mg bolus followed by 8 mg/hour for 72 hours) for patients who have undergone EHT for high risk endoscopic stigmata (Barkun 2010a; Laine 2012), while others stated that a specific recommendation regarding the preferred route of administration and dose of PPIs could not be made (NICE 2012).
The Cochrane systematic review of RCTs that compared PPIs versus H₂RAs or placebo addressed this question indirectly (Leontiadis 2006a). Among the RCTs included in that review, there was a wide variation in the PPI regimens that had been administered (Leontiadis 2006a). Regardless of the route of administration (IV or oral) and the dose (high dose, defined as 80 mg bolus followed by 8 mg/hour for 72 hours, or lower doses), PPIs significantly reduced rebleeding compared to H₂RAs or placebo. Subgroup analyses and meta‐regression did not detect any differences among different regimens of PPIs versus H₂RAs or placebo, but this cannot be interpreted as evidence of equivalence. The differential effect of high dose versus lower dose PPI treatment on mortality was even more difficult to interpret. Overall, the Cochrane review of PPIs versus H₂RAs or placebo could not answer the question on the optimal regimen of PPI.
Several RCTs that directly compared different dosing regimens of PPIs have been published recently. These trials appear to have consistently found non‐significant differences among different PPI regimens. However, it is unclear if these results indicate equivalence or merely reflect lack of power to detect real differences between regimens. A systematic review and meta‐analysis of these trials could produce more precise estimates and could also allow for assessment of the overall quality of evidence.
Objectives
To evaluate the efficacy of different regimens of PPIs in the management of acute bleeding from peptic ulcer using evidence from direct comparison RCTs.
We specifically intended to assess the differential effect of the dose and route of administration of PPI on mortality, rebleeding, surgical intervention, further EHT, length of hospital stay, transfusion requirements and adverse events.
Methods
Criteria for considering studies for this review
Types of studies
We included all RCTs that compared at least two regimens of the same or a different PPI in patients with acute bleeding from peptic ulcer, provided that they met all the following criteria:
-
concomitant therapy was applied equally to both intervention arms;
-
acute bleeding from peptic ulcer was diagnosed endoscopically;
-
for RCTs that included patients with other causes of upper GI bleeding, the data for patients with peptic ulcer bleeding had to be accessible and presented separately;
-
at least one of the following outcomes was reported: mortality, rebleeding, surgical intervention, repeat EHT, length of hospital stay, transfusion requirements or number of patients with negative outcomes (defined as total number of patients with any of rebleeding, surgery, endoscopic treatment, or death).
We included both blinded and non‐blinded RCTs.
Types of participants
Patients with acute upper GI bleeding with an endoscopically‐confirmed diagnosis of bleeding peptic ulcer. The participants were patients admitted to hospital for the bleeding episode or in‐patients who developed acute bleeding from a peptic ulcer while hospitalized for other reasons.
Types of interventions
The treatment group received a PPI (either alone or in combination with other treatment) and the control group received a different dose of PPI (either PPI alone or in combination with the same concomitant treatment administered to the other PPI group). We, therefore, only included studies in which treatment groups were treated similarly, apart from the dose of PPIs being compared.
The methods of delivery of PPI and the control treatment included both IV and oral.
We categorized the studies based on the cumulative dose of PPI received within the first 72 hours of treatment as follows:
-
"low‐dose" studies: 120 mg or less/72 hours;
-
"medium‐dose" studies: 121 to 599 mg/72 hours;
-
"high‐dose" studies: 600 mg or higher/72 hours
Our main analysis was the comparison of "high‐dose" versus other PPI regimens ("low‐dose" or "medium‐dose").
We performed a secondary analysis which compared "low dose" regimens versus other regimens of PPI ("medium‐dose" or "high‐dose").
We are aware that wherever the cut‐off points are set for defining "high" versus lower doses, they will remain arbitrary. Ideally we should have been able to evaluate the efficacy of PPIs using PPI dose as a continuous variable, rather than comparing ranges of doses among them. This led us to calculate the cumulative dose of PPI received within the first 72 hours of treatment. This variable allows assessment of the potentially modifying effect of the dose of PPI as a continuous variable by meta‐regression. However, meta‐regression provides only indirect evidence. We still had to categorize PPI doses by defining thresholds for definitions of "high" versus lower doses so as to enable meta‐analysis of head‐to‐head comparisons of different doses. We selected the first 72 hours as the time period for calculating the cumulative dose of PPI because this period is the most critical as it includes the majority of the re‐bleeding episodes (Gralnek 2008). We used two cut‐off points rather than one, so as to reduce the risk of rendering non‐evaluable the RCTs that had compared doses within the same (wide) category. The high cut‐off point of 600 mg or higher/72 hours was chosen to isolate the widely used "high‐dose" of 8 mg/hour by IV infusion following an IV bolus of 40 to 80 mg. The low cut‐off point was set at 120 mg/72 hours to isolate the lowest PPI dose that a clinician might be expected to use (i.e. 20 mg twice daily, which, for omeprazole, is twice the oral dose that is approved for other indications).
The effect of PPIs in patients with acute peptic ulcer bleeding is considered to be a class effect. Meta‐regression and subgroup analyses in a previous Cochrane review of RCTs that had compared PPIs with H₂RAs or placebo were consistent with a class effect of PPIs (Leontiadis 2006a). Standard doses of different PPIs may have quantitatively small but statistically significant differences in the degree of acid inhibition (Calvet 2005). However, these small differences are inconsistent when the PPIs are compared on a milligram basis, especially when clinical efficacy is assessed (Klok 2003; Yacyshyn 2002). For practical reasons we considered any potential differences in clinical efficacy between different PPIs to be negligible compared to the wide range of different doses of PPIs (200% to 500%) that were grouped together in each dose category.
Types of outcome measures
Primary outcomes
Death from any cause within 30 days of randomization, or at the reported time point closest to 30 days.
Secondary outcomes
-
rebleeding (as defined by original authors) within seven and 30 days of randomization;
-
surgical intervention for bleeding;
-
further endoscopic haemostatic treatment (EHT) ;
-
blood transfusion requirements;
-
length of hospital stay;
-
number of patients with negative outcomes (defined as total number of patients with any of rebleeding, surgery, further EHT or death, where it was possible to estimate those numbers from the studies without duplication);
-
adverse reactions.
Search methods for identification of studies
Electronic searches
We searched the Cochrane Central Register of Controlled Trials (CENTRAL) in The Cochrane Library 2010, Issue 3, MEDLINE, EMBASE, and Allied and Complementary Medicine Database (AMED), all from inception to September 2010. There were no language restrictions. A search strategy was constructed with a combination of subject headings and text words relating to the use of PPIs for the treatment of bleeding peptic ulcers. The standard Cochrane search strategy filter for identifying RCTs was applied. The final strategies are listed in Appendix 1, Appendix 2, and Appendix 3.
We also searched registers of controlled trials (both active and archived registers by metaRegister of Controlled Trials: www.controlled‐trials.com/mrct/) for ongoing or unpublished studies.
Searching other resources
We evaluated the reference lists from trials and review articles retrieved by electronic searching.
We also searched abstracts from the conference proceedings (January 2000 to September 2010) of:
-
American Digestive Disease Week;
-
United European Gastroenterology Week;
-
American College of Gastroenterology;
-
Canadian Digestive Diseases Week;
-
World Congress of Gastroenterology;
-
British Society of Gastroenterology.
Data collection and analysis
Selection of studies
Two reviewers (JC Claro and either J Martin or I Neumann) independently checked titles and abstracts of the references identified from the search and removed obviously irrelevant reports. We obtained the full text of all potentially relevant studies and assessed them for fulfilment of the pre‐defined inclusion criteria. A third reviewer (GI Leontiadis) acted as arbiter in case of disagreement. Finally, all inclusion and exclusion decisions were discussed and agreed upon between the lead reviewer (I Neumann) and the senior reviewer (GI Leontiadis). When duplicate publications of the same patient groups were identified, we included only the most recent version. When the published information was not sufficient to clarify study eligibility, we contacted the authors for further information.
Data extraction and management
Two reviewers (L Letelier and I Neumann) independently extracted data in pre‐designed electronic data extraction forms. A third reviewer (CW Howden) acted as an arbiter in case of disagreement. We contacted the original authors for missing data wherever necessary.
The following data were extracted where possible:
-
method of randomization;
-
criteria for patient inclusion and exclusion;
-
details of intervention including dose, route of administration, duration;
-
details of any co‐interventions including initial EHT;
-
details of post‐intervention treatment;
-
patient characteristics including mean age, age range, sex, ethnicity;
-
number of patients assigned to each treatment group;
-
number of patients with co‐morbidity per treatment group;
-
number of patients with duodenal and gastric ulcers per treatment group;
-
number of patients with each of the stigmata of recent haemorrhage (spurting, oozing, non‐bleeding visible vessel, and adherent clot) at index endoscopy per treatment group;
-
number of patients per treatment group with the following outcomes: mortality, surgical interventions, further EHT, blood transfusions; length of hospital stay, number of patients with negative outcomes (defined as total number of patients with any of rebleeding, surgery, endoscopic treatment, or death);
-
timing of outcome assessment;
-
definition of rebleeding;
-
indications for repeat endoscopy, further EHT, surgery, blood transfusions, discharge;
-
causes of death per treatment group;
-
outcomes reported by class of stigmata of haemorrhage at initial endoscopy;
-
number of patients with adverse reactions per treatment group and method used to seek for adverse reactions;
-
baseline comparability of treatment groups;
-
blinding of outcome assessor, patients and carers;
-
dropouts with reasons.
Assessment of risk of bias in included studies
We assessed risk of bias in included studies using the "Risk of bias table" which is the tool recommended by The Cochrane Collaboration (Higgins 2010). For each study we provided a description and a judgement for each one of the following domains: sequence generation, allocation sequence concealment, blinding, incomplete outcome data, selective outcome reporting and other potential sources of bias. The "Risk of bias table" was prepared by two reviewers independently (I Neumann and GI Leontiadis), with a third reviewer acting as arbiter (CW Howden).
Measures of treatment effect
We reported pooled outcomes as risk ratio (RR) with 95% CI for dichotomous outcomes, and as mean difference (MD) with 95% CI for continuous outcomes. By post hoc decision we also reported the results of the main analyses as risk differences (RD).
Unit of analysis issues
There were no unit of analysis issues. Only standard‐design RCTs were included, and each patient received only one intervention. In studies where more than two interventions had been compared (e.g. one PPI regimen versus another PPI regimen versus placebo), extra care was taken so as not to include the same patients in the meta‐analysis twice.
Dealing with missing data
We contacted the original investigators to request missing data. We analyzed only the available data and addressed the potential impact of missing data on the findings of the review.
Assessment of heterogeneity
We assessed heterogeneity statistically with the Mantel‐Haenszel Chi² test and the I² statistic. We considered heterogeneity to be statistically significant when P < 0.10 with the Mantel‐Haenszel Chi² test. We considered heterogeneity to be substantial when I² statistic > 50%.
Assessment of reporting biases
We investigated the presence of publication bias and other reporting biases visually with the use of funnel plots. In the analyses for dichotomous outcomes (mortality, rebleeding and surgical intervention rates) we also assessed publication bias statistically with the use of Egger's test (Egger 1997) performed with StatsDirect 2.7.8 (StatsDirect 2008). We based evidence of asymmetry on P < 0.10, and presented intercepts with 95% CIs.
Data synthesis
Data synthesis was performed with the Mantel‐Haenszel random‐effects method. A meta‐analysis was still to be performed, even in the presence of statistically significant heterogeneity (P < 0.10 for the Chi² test) or substantial heterogeneity (> 50% for the I² statistic), although readers are strongly advised to interpret the results with caution in the presence of heterogeneity. Reasons for heterogeneity were investigated with predetermined subgroup analyses and meta‐regression (as explained in the next section).
Subgroup analysis and investigation of heterogeneity
The influence of the following factors on the outcomes was assessed by the following a priori decided subgroup analyses:
-
Indo‐Asian population versus non‐Indo‐Asian population;
-
route of administration of PPI (oral versus IV);
-
mode of IV administration (continuous infusions versus intermittent bolus administration);
-
specific PPI used (omeprazole versus all others; pantoprazole versus all others);
-
risk of bias of primary study ("high" versus "low" or "unclear"; "low" defined as no bias for all domains, "unclear" defined as unclear risk of bias for one or more domains, "high" defined as presence of bias for one or more domains);
-
site of ulcer (gastric versus duodenal).
We had planned to use multivariable meta‐regression to assess if either the treatment effect (for mortality, rebleeding and surgical intervention) or the heterogeneity was associated with the six factors mentioned above, as well as the use of initial EHT. However, due to the limited number of included studies, we had to restrict meta‐regression analysis to the two most plausible factors (geographical location and route of PPI administration) as well as a third factor ‐ namely the ratio of the two cumulative PPI doses within each study. The decision to include the latter factor was taken after the publication of the protocol, but before the performance of meta‐regression analysis. The inclusion of within‐study dose ratio in the meta‐regression analysis aimed to assess for the presence of a dose‐response relationship.
Multivariate meta‐regression (random‐effects model, within study variance was estimated with the restricted maximum likelihood method; P values estimated with permutation test (20,000 random permutations) based on Monte Carlo simulation) was performed with Stata software 8.2. (Stata 2005).
Sensitivity analysis
We undertook the following sensitivity analyses, decided a priori:
-
the analysis of "high‐dose" studies versus other dose studies was restricted to patients with active bleeding or a non‐bleeding visible vessel at index endoscopy who received appropriate EHT at index endoscopy;
-
"medium‐dose" studies were excluded from the analysis of "high‐dose" studies versus other dose studies (resulting in a comparison of "high‐dose" versus "low‐dose" studies);
-
"low‐dose" studies were excluded from the analysis of "high‐dose" studies versus other dose studies (resulting in a comparison of "high‐dose" versus "medium‐dose" studies);
-
"high‐dose" studies were excluded from the analysis of "low‐dose" versus other dose studies (resulting in a comparison of "low‐dose" versus "medium‐dose" studies);
-
"non‐low" ("high" or "medium") dose vs "low dose" studies.
Also, by a post hoc decision, we assessed whether the conclusions were robust to the use of odds ratio (OR) as summary statistic or the use of the fixed‐effect model.
Results
Description of studies
Results of the search
We identified 1277 records (Figure 1). Of 77 studies selected for full text assessment, 22 met eligibility criteria (Andriulli 2008; Bajaj 2007; Cheng 2005; Cheng 2009; Choi 2009; Costamagna 1998; Dokas 2004; Focareta 2004; Garrido 2008; Hsu 2010; Hung 2007; Jang 2006; Lin 1997; Lin 2006; Mesihovic 2009; Oh 2007; Schonekas 1999; Sha 2001; Tsai 2009; Udd 2001; Yilmaz 2006; Yüksel 2008). These studies comprised 2388 participants in total.

Study flow diagram.
Original investigators were contacted to request additional information to clarify study eligibility or to request outcome data, where needed. One investigator (Dr. Jasmohn Bajaj) responded and provided additional information regarding their study (Bajaj 2007).
Included studies
Of the 22 trials, 13 included only patients in whom initial endoscopic haemostasis was achieved (Andriulli 2008; Costamagna 1998; Focareta 2004; Hsu 2010;Hung 2007;Jang 2006; Lin 2006; Mesihovic 2009; Oh 2007; Schonekas 1999; Sha 2001; Tsai 2009;Yüksel 2008). In two trials no patient underwent EHT (Lin 1997; Yilmaz 2006), and in the remaining seven trials, a variable proportion of the included patients achieved endoscopic haemostasis (from 32% to 95%) (Bajaj 2007; Cheng 2005; Cheng 2009; Choi 2009; Dokas 2004; Garrido 2008; Udd 2001). The location of the ulcer was variable across trials (gastric from 24% to 74%) and the bleeding stigmata were predominantly oozing (from 14% to 62%) and non‐bleeding visible vessel (from 13% to 100%). Males represented from 60% to 85% of the populations whose mean age of participants varied between 50 and 70 years For further details see Table 'Characteristics of included studies'.
The timing of outcome assessment for each study is shown in Table 1.
| Study ID | Mortality | Rebleeding | Surgery | Further endoscopic haemostatic treatment |
| Andriulli 2008 | During hospitalization | During hospitalization; 24 h; 3 d; 7 d | During hospitalization | During hospitalization |
| Bajaj 2007 | 30 d | 30 h; 4 d; 30 d | 30 d | U |
| Cheng 2005 | U | 3 d; 7 d; 14 d; 28 d | U | X |
| Cheng 2009 | U | 7 d; 28 d | X | X |
| Choi 2009 | X | 72 h; 7 d; 30 d | X | U |
| Costamagna 1998 | X | 48 h; 7 d | X | X |
| Dokas 2004 | U | U | U | X |
| Focareta 2004 | X | U | U | U |
| Garrido 2008 | U | U | U | X |
| Hsu 2010 | 14 d | 14 d | U | X |
| Hung 2007 | 30 d | 30 d | 30 d | U |
| Jang 2006 | U | 30 d | U | X |
| Lin 1997 | U | U | U | U |
| Lin 2006 | U | 24 h; 3 d; 14 d | U | U |
| Mesihovic 2009 | U | U | U | U |
| Oh 2007 | U | X | X | X |
| Schonekas 1999 | 14 d | 72 h | U | X |
| Sha 2001 | U | U | U | X |
| Tsai 2009 | 14 d; 30 d | 3 d; 14 d | 14 d; 30 d | 14 d |
| Udd 2001 | 30 d | U | U | U |
| Yilmaz 2006 | 30 d | During hospitalization; 30 d | U | During hospitalization |
| Yüksel 2008 | U | U | U | U |
U: unclear timing of outcome assessment
X: outcome not reported or not calculable
h: hours
d: days
Nineteen studies used the same type of PPI for all study groups. Of these, eight studies used omeprazole (Cheng 2005; Cheng 2009; Dokas 2004; Lin 1997; Lin 2006; Sha 2001; Udd 2001; Yilmaz 2006), 10 used pantoprazole (Bajaj 2007; Choi 2009; Garrido 2008; Hsu 2010; Hung 2007; Jang 2006; Mesihovic 2009; Oh 2007; Schonekas 1999; Yüksel 2008), one used lansoprazole (Costamagna 1998) and one allowed use of either omeprazole or pantoprazole (Andriulli 2008). The remaining two studies compared different types of PPIs: Focareta et al compared IV omeprazole with oral esomeprazole (Focareta 2004) and Tsai et al compared IV omeprazole with oral rabeprazole (Tsai 2009).
The highest dose PPI regimen that was assessed among included studies consisted of a 40 to 80 mg IV bolus followed by continuous IV infusion of 8 to 8.33 mg for 72 hours; this was used in 13 studies (Andriulli 2008; Bajaj 2007; Cheng 2005; Cheng 2009; Choi 2009; Garrido 2008; Hsu 2010; Hung 2007; Jang 2006; Schonekas 1999; Udd 2001; Yilmaz 2006; Yüksel 2008). The lowest dose regimen that was assessed among included studies was 30 mg lansoprazole IV once daily (Costamagna 1998). The highest of the two or three doses of PPI regimens that were assessed within studies was always administered IV. The lowest of the two or three doses of PPI regimens that were assessed within studies was also administered IV with the exception of four studies where it was given orally (80 mg pantoprazole twice daily (Bajaj 2007); pantoprazole 40 mg twice daily (Jang 2006); omeprazole 40 mg twice daily (Yilmaz 2006); rabeprazole 20 mg twice daily (Tsai 2009)). Within‐study dose ratio of the PPI regimen with the highest 72‐hour cumulative dose divided by the PPI regimen with the lowest 72‐hour cumulative dose ranged from 1.17 (Hsu 2010) to 10.9 (Udd 2001); mean 3.1.
Excluded studies
Of 77 studies selected for full text assessment, 55 were excluded because they were not RCTs (26), did not compare different PPI doses (18), did not report outcomes of interest (4), compared the same regimens of two different PPIs (3), were duplicates or preliminary presentations of studies already included (2), or reported aggregate data only (2).
Risk of bias in included studies
Of the 22 trials included in this review, 17 had high risk of bias (Bajaj 2007; Cheng 2009; Choi 2009; Costamagna 1998; Dokas 2004; Focareta 2004; Garrido 2008; Hsu 2010; Hung 2007; Jang 2006; Lin 1997; Lin 2006; Mesihovic 2009; Oh 2007; Schonekas 1999; Sha 2001; Tsai 2009), 5 had unclear risk of bias (Andriulli 2008; Cheng 2005; Udd 2001; Yilmaz 2006; Yüksel 2008) and none had low risk of bias. The main limitation was the lack of blinding in 16 trials (Bajaj 2007; Cheng 2009; Choi 2009; Costamagna 1998; Dokas 2004; Focareta 2004; Garrido 2008; Hsu 2010; Hung 2007; Jang 2006; Lin 1997; Lin 2006; Mesihovic 2009; Oh 2007; Sha 2001; Tsai 2009). Risk of bias is summarized in Figure 2 and Figure 3.
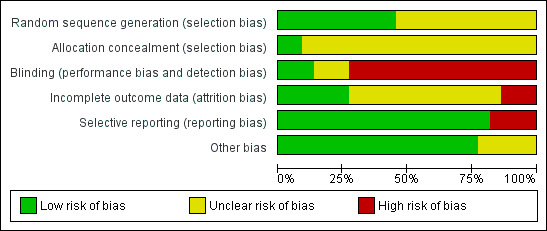
Risk of bias graph: review authors' judgements about each risk of bias item presented as percentages across all included studies.

Risk of bias summary: review authors' judgements about each risk of bias item for each included study.
Allocation
In 20 of the 22 included trials the generation or the concealment of the sequence of randomization (or both of them) were inadequately described (Andriulli 2008; Bajaj 2007; Cheng 2005; Cheng 2009; Choi 2009; Costamagna 1998; Dokas 2004; Focareta 2004; Garrido 2008; Hsu 2010; Hung 2007; Jang 2006; Lin 1997; Lin 2006; Mesihovic 2009; Oh 2007; Schonekas 1999; Sha 2001; Tsai 2009; Yüksel 2008). Therefore, we were unable to judge the potential risk of bias associated with this domain.
Blinding
Nineteen of the 22 included trials did not have enough safeguards to ensure blinding, despite having tested different administration schedules of PPI (e.g. continuous versus intermittent) (Bajaj 2007; Choi 2009; Costamagna 1998; Dokas 2004; Focareta 2004; Garrido 2008; Hsu 2010; Hung 2007; Jang 2006; Lin 1997; Lin 2006; Mesihovic 2009; Oh 2007; Schonekas 1999; Sha 2001; Tsai 2009; Yilmaz 2006; Yüksel 2008) or different durations of treatment (Cheng 2009). Only three studies had low risk of bias with regards to blinding (Andriulli 2008; Cheng 2005; Udd 1999).
Incomplete outcome data
Six of the 22 included trials were at low risk of attrition bias because (i) there were no missing outcome data, or (ii) the proportion of missing patients compared to the observed event risk was not large enough to have a clinically relevant impact on the results of the study (Andriulli 2008; Bajaj 2007; Cheng 2009; Choi 2009; Hsu 2010; Lin 2006). The proportion of missing outcome data was large enough to affect the results in three studies (Costamagna 1998; Hung 2007; Schonekas 1999). In 13 trials, there was not enough information available to judge the risk of bias associated with the missing outcome data (Cheng 2005; Dokas 2004; Focareta 2004; Garrido 2008; Jang 2006; Lin 1997; Mesihovic 2009; Oh 2007; Sha 2001; Tsai 2009; Udd 2001; Yilmaz 2006; Yüksel 2008).
Selective reporting
In four of the 22 trials, there was no report of the outcome mortality (Choi 2009; Costamagna 1998; Focareta 2004; Lin 1997).
Other potential sources of bias
We found no evidence of other sources of bias, although the information was scarce in five trials available only as abstracts (Costamagna 1998; Dokas 2004; Focareta 2004; Jang 2006; Schonekas 1999).
Effects of interventions
Main analysis
Analysis 1. Comparison of high versus non‐high (medium or low) dose regimens
In this analysis, we compared high dose regimens (cumulative dose of PPI over first 72 hours 600 mg or higher) with non‐high dose regimens that administered less than 600 mg of PPI over the first 72 hours, i.e. either medium dose (cumulative dose of PPI over first 72 hours 121 to 599 mg) or low dose (cumulative dose of PPI over first 72 hours 120 mg or less). For the studies that had compared more than two regimens of PPIs, we pooled together the groups that received treatments falling within our pre‐determined categories.
Thirteen studies comprising a total of 1728 participants compared high dose regimens with other regimens and reported at least one of the outcomes of interest of our meta‐analysis (Andriulli 2008; Bajaj 2007; Cheng 2005; Cheng 2009; Choi 2009; Garrido 2008; Hsu 2010; Hung 2007; Jang 2006; Schonekas 1999; Udd 2001; Yilmaz 2006; Yüksel 2008).
1.1. Mortality
Twelve studies comprising a total of 1667 participants compared high dose with non‐high dose regimens of PPIs and reported mortality (Andriulli 2008; Bajaj 2007; Cheng 2005; Cheng 2009; Garrido 2008; Hsu 2010; Hung 2007; Jang 2006; Schonekas 1999; Udd 2001; Yilmaz 2006; Yüksel 2008). There was no significant heterogeneity among studies (P = 0.78; I² = 0%). We found low quality evidence that did not exclude a potential reduction or increase in mortality with high dose PPI regimens; pooled RR 0.85 (95% CI 0.47 to 1.54), pooled risk difference (RD) 0 more deaths per 100 patients treated with high dose PPI (95% CI from 1 fewer to 2 more deaths per 100 treated). (Analysis 1.1).
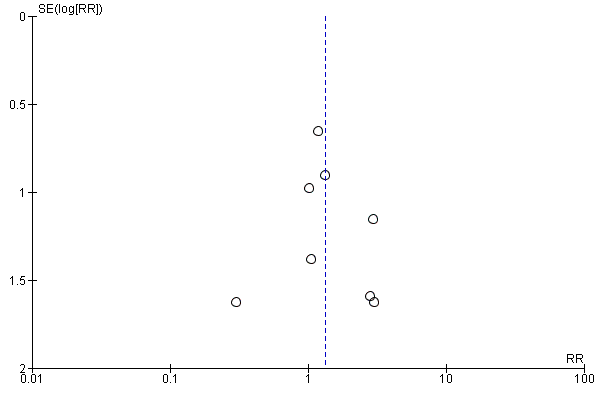
Visual inspection of the funnel plot (Figure 4) revealed slight asymmetry absence of small studies that had results in favour of high dose regimens of PPI. Egger's test was marginally statistically significant when a cut‐off P value of 0.10 was used (P = 0.098).

Funnel plot of comparison: 1 High vs. non‐high (medium or low) dose regimen, outcome: 1.1 Mortality.
1.2. Rebleeding
Thirteen studies comprising a total of 1716 participants compared high dose with non‐high dose regimens of PPIs and reported rebleeding (Andriulli 2008; Bajaj 2007; Cheng 2005; Cheng 2009; Choi 2009; Garrido 2008; Hsu 2010; Hung 2007; Jang 2006; Schonekas 1999; Udd 2001; Yilmaz 2006; Yüksel 2008). There was no significant heterogeneity among studies (P = 0.99; I² = 0%). We found low quality evidence that did not exclude a potential reduction or increase in rebleeding with high dose PPI regimens; pooled RR 1.27 (95% CI 0.96 to 1.67), pooled RD 2 more rebleeding events per 100 patients treated with high dose PPI (95% CI from 0 fewer to 5 more rebleeding events per 100 treated) (Analysis 1.2).
Visual inspection of the funnel plot (Figure 5) did not show asymmetry. Egger's test was not statistically significant (P = 0.64).

Funnel plot of comparison: 1 High vs. non‐high (medium or low) dose regimen, outcome: 1.2 Rebleeding.
1.3. Surgery
Nine studies comprising a total of 1270 participants compared high dose with non‐high dose regimens of PPIs and reported surgical intervention rates (Andriulli 2008; Bajaj 2007; Garrido 2008; Hsu 2010; Hung 2007; Jang 2006; Udd 2001; Yilmaz 2006; Yüksel 2008). There was no significant heterogeneity among studies (P = 0.96; I² = 0%). We found low quality evidence that did not exclude a potential reduction or increase in surgical interventions with high dose PPI treatment; pooled RR 1.33 (95% CI 0.63 to 2.77), pooled RD 1 more surgical intervention per 100 patients treated with high dose PPI (95% CI from 1 fewer to 2 more surgical interventions per 100 treated) (Analysis 1.3).
Visual inspection of the funnel plot (Figure 6) did not show asymmetry. Egger's test was not statistically significant (P = 0.77).
Funnel plot of comparison: 1 High vs. non‐high (medium or low) dose regimen, outcome: 1.3 Surgery.
1.4. Further endoscopic haemostatic treatment (EHT)
Six studies comprising a total of 902 participants compared high dose with non‐high dose regimens of PPIs and reported rates of EHT performed after study entry (initial EHT that was performed in some studies was not counted as an outcome in this analysis) (Andriulli 2008; Bajaj 2007; Choi 2009; Hung 2007; Udd 2001; Yüksel 2008). There was no significant heterogeneity among studies (P = 0.96; I² = 0%). We found low quality evidence that did not exclude a potential reduction or increase in further EHT in patients treated with high dose PPI; pooled RR 1.39 (95% CI 0.88 to 2.18), pooled RD 2 more applications of EHT per 100 patients treated with high dose PPI (95% CI from 1 fewer to 5 more endoscopic haemostatic treatments per 100 treated) (Analysis 1.4).
1.5. Length of hospital stay (LOS)
Six studies comprising a total of 1069 participants compared high dose with non‐high dose regimens of PPIs and reported mean LOS together with standard deviation, standard error or 95% CI for each group (Andriulli 2008; Bajaj 2007; Hsu 2010; Udd 2001; Yilmaz 2006; Yüksel 2008). There was no significant heterogeneity among studies (P = 0.70; I² = 0%). We found moderate quality evidence suggesting no important difference in LOS between the two regimens: mean difference (MD) 0.26 days (95% CI ‐0.08 to 0.6 days) (Analysis 1.5).
1.6. Blood transfusions
Six studies comprising a total of 1069 participants compared high dose with non‐high dose regimens of PPIs and reported mean blood transfusion requirements together with standard deviation, standard error or 95% CI for each group (Andriulli 2008; Bajaj 2007; Hsu 2010; Udd 2001; Yilmaz 2006; Yüksel 2008). There was no significant heterogeneity among studies (P = 0.72; I² = 0%). We found moderate quality evidence suggesting no important difference in blood transfusion requirements between the two regimens: MD 0.05 units (95% CI ‐0.21 to 0.3 units) (Analysis 1.6).
Subgroup analyses and sensitivity analyses
This is an overall description of the results from subgroup analyses and sensitivity analyses.
We found no significant heterogeneity (I² = 0%) in any subgroup or sensitivity analyses, with the exception of two post hoc analyses (those for the outcomes of LOS and blood transfusions in analysis number 13 including all studies that had compared at least two PPI regimens with different cumulative 72 hour doses).
All subgroup and sensitivity analyses (including post hoc analyses) showed results similar to the respective main analyses:
-
For the outcomes of mortality, rebleeding, surgery and repeat EHT, all showed low quality evidence that did not exclude a potential reduction or increase in outcomes with high dose PPI regimens compared to non‐high dose PPI regimens.
-
For the outcomes of LOS and blood transfusions, all subgroup analyses showed moderate quality evidence suggesting no important difference in outcomes between the two regimens.
None of the subgroup analyses suggested the presence of an interaction between the effect of the intervention and the pre‐specified variables (the test for subgroup differences was non‐significant in all subgroup analyses). However, given the small number of studies and events in some subgroups, some analyses may have been underpowered.
The results of the subgroup analyses and sensitivity analyses are summarized in Table 2.
| Analysis 2. High vs. non‐high dose regimen: Subgroup analysis according to risk of bias | |||||||
| Outcome | Subgroup | Studies | Participants | Summary statistic | Effect estimate [95% CI] | Significant heterogeneity: | Test for subgroup differences: |
| Mortality | Unclear | 5 | 1041 | RR | 1.05 [0.50, 2.20] | No (P = 0.84; I² = 0%) | P = 0.36 |
| High | 7 | 626 | RR | 0.61 [0.24, 1.52] | No (P = 0.84; I² = 0%) | ||
| Rebleeding | Unclear | 13 | 1037 | RR | 1.26 [0.89, 1.76] | No (P = 0.96; I² = 0%) | P = 0.92 |
| High | 5 | 679 | RR | 1.29 [0.80, 2.07] | No (P = 0.88; I² = 0%) | ||
| Surgery | Unclear | 4 | 944 | RR | 1.35 [0.58, 3.14] | No (P = 0.90; I² = 0%) | P = 0.94 |
| High | 5 | 326 | RR | 1.26 [0.28, 5.73] | No (P = 0.72; I² = 0%) | ||
| Further EHT | Unclear | 3 | 713 | RR | 1.39 [0.86, 2.25] | No (P = 0.91; I² = 0%) | P = 0.96 |
| High | 3 | 189 | RR | 1.35 [0.36, 5.07] | No (P = 0.64; I² = 0%) | ||
| LOS | Unclear | 4 | 924 | MD | 0.28 [‐0.07, 0.63] | No (P = 0.64; I² = 0%) | P = 0.84 |
| High | 2 | 145 | MD | 0.10 [‐1.60, 1.80] | No (P = 0.27; I² = 16%) | ||
| Blood transfusions | Unclear | 4 | 924 | MD | 0.05 [‐0.21, 0.30] | No (P = 0.42; I² = 0%) | P = 0.95 |
| High | 2 | 145 | MD | 0.10 [‐1.60, 1.80] | No (P = 0.82; I² = 0%) | ||
| Analysis 3. High vs. non‐high dose regimen: Subgroup analysis according to geographical location | |||||||
| Outcome | Subgroup | Studies | Participants | Summary statistic | Effect estimate [95% CI] | Significant heterogeneity: | Test for subgroup differences: |
| Mortality | Asian studies | 7 | 807 | RR | 0.74 [0.33, 1.68] | No (P = 0.45; I² = 0%) | P = 0.66 |
| Other | 5 | 860 | RR | 0.96 [0.43, 2.18] | No (P = 0.87; I² = 0%) | ||
| Rebleeding | Asian studies | 8 | 864 | RR | 1.24 [0.85, 1.80] | No (P = 0.95; I² = 0%) | P = 0.85 |
| Other | 5 | 852 | RR | 1.31 [0.87, 1.96] | No (P = 0.81; I² = 0%) | ||
| Surgery | Asian studies | 5 | 568 | RR | 1.12 [0.36, 3.44] | No (P = 0.79; I² = 0%) | P = 0.69 |
| Other | 4 | 702 | RR | 1.51 [0.57, 4.01] | No (P = 0.87; I² = 0%) | ||
| Further EHT | Asian studies | 3 | 261 | RR | 1.16 [0.41, 3.27] | No (P = 0.95; I² = 0%) | P = 0.71 |
| Other | 3 | 641 | RR | 1.44 [0.87, 2.39] | No (P = 0.67; I² = 0%) | ||
| LOS | Asian studies | 3 | 428 | MD | 0.10 [‐0.33, 0.54] | No (P = 0.80; I² = 0%) | P = 0.24 |
| Other | 3 | 641 | MD | 0.52 [‐0.03, 1.07] | No (P = 0.55; I² = 0%) | ||
| Blood transfusions | Asian studies | 3 | 428 | MD | ‐0.10 [‐0.45, 0.26] | No (P = 0.46; I² = 0%) | P = 0.25 |
| Other | 3 | 641 | MD | 0.20 [‐0.17, 0.57] | No (P = 1.00; I² = 0%) | ||
| Analysis 4. High vs. non‐high dose regimen: Subgroup analysis according to route of administration for the non‐high dose regimen | |||||||
| Outcome | Subgroup | Studies | Participants | Summary statistic | Effect estimate [95% CI] | Significant heterogeneity: | Test for subgroup differences: |
| Mortality | IV | 9 | 1394 | RR | 0.84 [0.45, 1.56] | No (P = 0.67; I² = 0%) | P = 0.92 |
| PO | 3 | 273 | RR | 0.92 [0.20, 4.28] | No (P = 0.40; I² = 0%) | ||
| Rebleeding | IV | 10 | 1443 | RR | 1.24 [0.93, 1.65] | No (P = 0.99; I² = 0%) | P = 0.59 |
| PO | 3 | 273 | RR | 1.64 [0.61, 4.40] | No (P = 0.56; I² = 0%) | ||
| Surgery | IV | 6 | 997 | RR | 1.26 [0.54, 2.91] | No (P = 0.89; I² = 0%) | P = 0.79 |
| PO | 3 | 273 | RR | 1.59 [0.34, 7.40] | No (P = 0.68; I² = 0%) | ||
| Further EHT | IV | 5 | 877 | RR | 1.35 [0.85, 2.13] | No (P = 0.98; I² = 0%) | P = 0.41 |
| PO | 1 | 25 | RR | 4.64 [0.25, 87.91] | No (P = 0.96; I² = 0%) | ||
| LOS | IV | 4 | 833 | MD | 0.32 [‐0.10, 0.74] | No (P = 0.57; I² = 0)% | P = 0.63 |
| PO | 2 | 236 | MD | 0.15 [‐0.43, 0.73] | No (P = 0.37; I² = 0%) | ||
| Blood transfusions | IV | 4 | 833 | MD | 0.22 [‐0.11, 0.56] | No (P = 0.97; I² = 0%) | P = 0.12 |
| PO | 2 | 236 | MD | ‐0.19 [‐0.57, 0.20] | No (P = 0.69; I² = 0%) | ||
| Analysis 5. High vs. non‐high dose regimen: Subgroup analysis according to whether in non‐high dose regimen PPI was administered as IV bolus or IV infusion | |||||||
| Outcome | Subgroup | Studies | Participants | Summary statistic | Effect estimate [95% CI] | Significant heterogeneity: | Test for subgroup differences: |
| Mortality | Bolus | 7 | 1155 | RR | 1.15 [0.53, 2.47] | No (P = 0.82; I² = 0%) | P = 0.16 |
| Infusion | 2 | 239 | RR | 0.45 [0.16, 1.32] | No (P = 0.37; I² = 0%) | ||
| Rebleeding | Bolus | 8 | 1178 | RR | 1.24 [0.86, 1.77] | No (P = 0.99; I² = 0%) | P = 0.95 |
| Infusion | 3 | 265 | RR | 1.26 [0.75, 2.13] | No (P = 0.29; I² = 12%) | ||
| Surgery | Bolus | 6 | 997 | RR | 1.26 [0.54, 2.91] | No (P = 0.89; I² = 0%) | Not applicable |
| Infusion | 0 | 0 | RR | Not estimable | Not applicable | ||
| Further EHT | Bolus | 5 | 847 | RR | 1.34 [0.85, 2.12] | No (P = 0.98; I² = 0%) | Not applicable |
| Infusion | 1 | 30 | RR | Not estimable | Not applicable | ||
| LOS | Bolus | 4 | 833 | MD | 0.32 [‐0.10, 0.74] | No (P = 0.57; I² = 0%) | Not applicable |
| Infusion | 0 | 0 | MD | Not estimable | Not applicable | ||
| Blood transfusions | Bolus | 4 | 833 | MD | 0.22 [‐0.11, 0.56] | No (P = 0.97; I² = 0%) | Not applicable |
| Infusion | 0 | 0 | MD | Not estimable | Not applicable | ||
| Analysis 6. High vs. non‐high dose regimen: Subgroup analysis according to type of PPI in high dose regimen | |||||||
| Outcome | Subgroup | Studies | Participants | Summary statistic | Effect estimate [95% CI] | Significant heterogeneity: | Test for subgroup differences: |
| Mortality | Omeprazole | 4 | 612 | RR | 0.63 [0.29, 1.37] | No (P = 0.60; I² = 0%) | P = 0.49 |
| Pantoprazole | 7 | 581 | RR | 1.49 [0.44, 5.01] | No (P = 0.68; I² = 0%) | ||
| Either omeprazole or pantoprazole | 1 | 474 | RR | 0.99 [0.29, 3.38] | Not applicable | ||
| Rebleeding | Omeprazole | 4 | 608 | RR | 1.25 [0.83, 1.87] | No (P = 0.60; I² = 0%) | P = 0.49 |
| Pantoprazole | 8 | 634 | RR | 1.15 [0.69, 1.93] | No (P = 0.68; I² = 0%) | ||
| Either omeprazole or pantoprazole | 1 | 474 | RR | 1.46 [0.84, 2.54] | Not applicable | ||
| Surgery | Omeprazole | 2 | 373 | RR | 1.23 [0.44, 3.48] | No (P = 0.92; I² = 0%) | P = 0.76 |
| Pantoprazole | 6 | 423 | RR | 1.17 [0.36, 3.82] | No (P = 0.85; I² = 0%) | ||
| Either omeprazole or pantoprazole | 1 | 474 | RR | 2.97 [0.31, 28.39] | Not applicable | ||
| Further EHT | Omeprazole | 1 | 142 | RR | 1.06 [0.28, 4.07] | Not applicable | P = 0.91 |
| Pantoprazole | 4 | 286 | RR | 1.35 [0.51, 3.59] | No (P = 0.83; I² = 0%) | ||
| Either omeprazole or pantoprazole | 1 | 474 | RR | 1.46 [0.84, 2.54] | Not applicable | ||
| LOS | Omeprazole | 2 | 353 | MD | 0.13 [‐0.35, 0.62] | No (P = 0.85; I² = 0%) | P = 0.42 |
| Pantoprazole | 3 | 242 | MD | 0.16 [‐0.46, 0.79] | No (P = 0.54; I² = 0%) | ||
| Either omeprazole or pantoprazole | 1 | 474 | MD | 0.70 [‐0.03, 1.43] | Not applicable | ||
| Blood transfusions | Omeprazole | 2 | 353 | MD | ‐0.19 [‐0.57, 0.20] | No (P = 0.72; I² = 0%) | P = 0.27 |
| Pantoprazole | 3 | 242 | MD | 0.34 [‐0.43, 1.11] | No (P = 0.93; I² = 0%) | ||
| Either omeprazole or pantoprazole | 1 | 474 | MD | 0.20 [‐0.18, 0.58] | Not applicable | ||
| Analysis 7. High vs. non‐high dose regimen: Subgroup analysis according to ulcer site | |||||||
| Outcome | Subgroup | Studies | Participants | Summary statistic | Effect estimate [95% CI] | Significant heterogeneity: | Test for subgroup differences: |
| Mortality | Gastric ulcer | 1 | 15 | RR | Not estimable | Not applicable | Not applicable |
| Duodenal ulcer | 1 | 13 | RR | Not estimable | Not applicable | ||
| Rebleeding | Gastric ulcer | 2 | 196 | RR | 1.52 [0.66, 3.49] | No (P = 0.71; I² = 0%) | P = 1.00 |
| Duodenal ulcer | 2 | 306 | RR | 1.52 [0.75, 3.07] | No (P = 0.72; I² = 0%) | ||
| Surgery | Gastric ulcer | 1 | 15 | RR | 2.67 [0.13, 56.63] | Not applicable | Not applicable |
| Duodenal ulcer | 1 | 13 | RR | Not estimable | Not applicable | ||
| Analysis 8. Sensitivity analysis: High vs. low dose regimen | |||||||
| Outcome | Studies | Participants | Summary statistic | Effect estimate [95% CI] | Significant heterogeneity: Yes or No (P value: I2) | ||
| Mortality | 4 | 835 | RR | 0.96 [0.43, 2.18] | No (P = 0.87; I² = 0%) | ||
| Rebleeding | 5 | 867 | RR | 1.22 [0.82, 1.82] | No (P = 0.72; I² = 0%) | ||
| Surgery | 3 | 677 | RR | 1.41 [0.51, 3.95] | No (P = 0.76; I² = 0%) | ||
| Analysis 9. Sensitivity analysis: High vs. medium dose regimen | |||||||
| Outcome | Studies | Participants | Summary statistic | Effect estimate [95% CI] | Significant heterogeneity: Yes or No (P value: I2) | ||
| Mortality | 8 | 832 | RR | 0.74 [0.33, 1.68] | No (P = 0.45; I² = 0%) | ||
| Rebleeding | 9 | 868 | RR | 1.30 [0.89, 1.90] | No (P = 0.93; I² = 0%) | ||
| Surgery | 6 | 593 | RR | 1.24 [0.43, 3.57] | No (P = 0.85; I² = 0%) | ||
| Analysis 10. Sensitivity analysis: Medium vs. low dose regimen | |||||||
| Outcome | Studies | Participants | Summary statistic | Effect estimate [95% CI] | Significant heterogeneity: Yes or No (P value: I2) | ||
| Mortality | 3 | 275 | RR | 0.42 [0.06, 2.80] | No (P = 0.81; I² = 0%) | ||
| Rebleeding | 5 | 320 | RR | 0.69 [0.33, 1.43] | No (P = 0.28; I² = 21%) | ||
| Surgery | 3 | 249 | RR | 0.48 [0.09, 2.55] | No (P = 0.96; I² = 0%) | ||
| Analysis 11. Sensitivity analysis: Non‐low (high or medium) dose vs. low dose regimen | |||||||
| Outcome | Studies | Participants | Summary statistic | Effect estimate [95% CI] | Significant heterogeneity: Yes or No (P value: I2) | ||
| Mortality | 4 | 835 | RR | 0.96 [0.43, 2.18] | No (P = 0.87; I² = 0%) | ||
| Rebleeding | 6 | 917 | RR | 1.22 [0.82, 1.82] | No (P = 0.47; I² = 0%) | ||
| Surgery | 4 | 702 | RR | 1.51 [0.57, 4.01] | No (P = 0.87; I² = 0%) | ||
| Analysis 12. Sensitivity analysis: High vs. non‐high dose regimen, restricted to patients with high risk SRH | |||||||
| Outcome | Subgroup | Studies | Participants | Summary statistic | Effect estimate [95% CI] | Significant heterogeneity: Yes or No (P value: I2) | Test for subgroup differences (P value) |
| Mortality | All patients with HR SRH received initial EHT | 3 | 292 | RR | 1.10 [0.26, 4.67] | No (P = 0.42; I² = 0%) | Not applicable |
| Not all patients with HR SRH received initial EHT | 1 | 14 | RR | Not estimable | Not applicable | ||
| Rebleeding | All patients with HR SRH received initial EHT | 4 | 655 | RR | 1.24 [0.79, 1.94] | No (P = 0.85; I² = 0%) | P = 0.64 |
| Not all patients with HR SRH received initial EHT | 2 | 96 | RR | 1.75 [0.45, 6.85] | Not applicable | ||
| Surgery | All patients with HR SRH received initial EHT | 2 | 134 | RR | 1.02 [0.15, 6.96] | 1.02 [0.15, 6.96] | Not applicable |
| Not all patients with HR SRH received initial EHT | 1 | 14 | RR | Not estimable | Not applicable | ||
| Analysis 13. Post hoc analysis: Studies that compared at least two PPI regimens with different 72‐hour cumulative dose (highest vs. lowest dose) | |||||||
| Outcome | Studies | Participants | Summary statistic | Effect estimate [95% CI] | Significant heterogeneity: Yes or No (P value: I2) | ||
| Mortality | 18 | 2197 | RR | 0.79 [0.47, 1.36] | No (P = 0.86; I² = 0%) | ||
| Rebleeding | 21 | 2338 | RR | 1.02 [0.81, 1.29] | No (P = 0.67; I² = 0%) | ||
| Surgery | 16 | 1884 | RR | 1.22 [0.64, 2.30] | No (P = 0.98; I² = 0%) | ||
| Further EHT | 11 | 1352 | RR | 1.02 [0.74, 1.42] | No (P = 0.78; I² = 0%) | ||
| LOS | 11 | 1503 | MD | 0.06 [‐0.28, 0.40] | No (P = 0.33; I² = 12%) | ||
| Blood transfusions | 9 | 1425 | MD | 0.23 [‐0.25, 0.71] | Yes (P = 0.04; I² = 50%) | ||
| Analysis 14. Post hoc analysis: Studies that compared at least two PPI regimens with different 72‐hour cumulative dose (highest vs. lowest dose), restricted to patients with high risk SRH | |||||||
| Outcome | Subgroup | Studies | Participants | Summary statistic | Effect estimate [95% CI] | Significant heterogeneity: Yes or No (P value: I2) | Test for subgroup differences (P value) |
| Mortality | All patients with HR SRH received initial EHT | 4 | 359 | RR | 0.88 [0.24, 3.28] | No (P = 0.52; I² = 0%) | Not applicable |
| Not all patients with HR SRH received initial EHT | 1 | 14 | RR | Not estimable | Not applicable | ||
| Rebleeding | All patients with HR SRH received initial EHT | 8 | 919 | RR | 0.97 [0.68, 1.39] | No (P = 0.40; I² = 4%) | P = 0.51 |
| Not all patients with HR SRH received initial EHT | 3 | 122 | RR | 1.43 [0.48, 4.24] | No (P = 0.63; I² = 0%) | ||
| Surgery | All patients with HR SRH received initial EHT | 4 | 357 | RR | 0.66 [0.19, 2.34] | No (P = 0.84; I² = 0%) | Not applicable |
| Not all patients with HR SRH received initial EHT | 2 | 40 | RR | Not estimable | Not applicable | ||
| Analysis 15. Post hoc analysis: Comparison of regimens with the same 72‐hour cumulative dose, but different route or frequency | |||||||
| Outcome | Studies | Participants | Summary statistic | Effect estimate [95% CI] | Significant heterogeneity: Yes or No (P value: I2) | ||
| Rebleeding | 1 | 22 | RR | 0.30 [0.04, 2.27] | Not applicable | ||
| Analysis 16. Post hoc analysis: IV vs. PO regimen | |||||||
| Outcome | Studies | Participants | Summary statistic | Effect estimate [95% CI] | Significant heterogeneity: Yes or No (P value: I2) | ||
| Mortality | 4 | 429 | RR | 0.77 [0.21, 2.79] | No (P = 0.65; I² = 0%) | ||
| Rebleeding | 5 | 516 | RR | 1.08 [0.63, 1.84] | No (P = 0.70; I² = 0%) | ||
| Surgery | 5 | 516 | RR | 1.13 [0.31, 4.11] | No (P = 0.67; I² = 0%) | ||
| Further EHT | 3 | 268 | RR | 1.10 [0.57, 2.11] | No (P = 0.57; I² = 0%) | ||
| LOS | 3 | 392 | MD | 0.09 [‐0.46, 0.63] | No (P = 0.55; I² = 0%) | ||
| Blood transfusions | 3 | 392 | MD | ‐0.18 [‐0.56, 0.20] | No (P = 0.89; I² = 0%) | ||
Analysis 2. Subgroup analysis according to risk of bias (comparison of high vs. non‐high dose regimens)
This planned subgroup analysis separated the studies into two groups: studies with high risk of bias vs. studies with low or unclear risk of bias. Since none of the studies was of low risk of bias, the subgroup analysis became a subgroup analysis of high risk vs. unclear risk of bias studies. The results are included in Table 2.
Analysis 3. Subgroup analysis according to geographical location (comparison of high vs. non‐high dose regimens)
This planned subgroup analysis separated the studies into two groups: studies that had been conducted in Asia vs. studies that had been conducted elsewhere. It included eight studies that had been conducted in Asia (six in South East Asia (Cheng 2005; Cheng 2009; Choi 2009; Hsu 2010; Hung 2007; Jang 2006) and two in Turkey (Yilmaz 2006; Yüksel 2008)), as well as five studies that had been conducted elsewhere (four in Europe (Andriulli 2008; Garrido 2008; Schonekas 1999; Udd 2001) and one in the US (Bajaj 2007)). The results are included in Table 2.
When, by post hoc sensitivity analysis, the two Turkish studies were removed from the Asian group and pooled together with the European and US studies, there were only small numerical changes in the results; the conclusions were not affected in any subgroup analysis for any outcome (results not shown).
Analysis 4. Subgroup analysis according to route of administration in the non‐high dose group (comparison of high vs. non‐high dose regimens)
In this planned subgroup analysis we separated the studies into two groups according to whether the non‐high dose regimen was administered intravenously or orally. Of note, the high‐dose regimen had always been administered intravenously in all studies. The results are included in Table 2.
Analysis 5. Subgroup analysis according to mode of IV administration in non‐high dose group (comparison of high vs. non‐high IV dose regimens)
In this planned subgroup analysis we included only the studies that compared high dose regimens with intravenous non‐high dose regimens. The high‐dose regimen had always been administered intravenously as continuous infusion (with or without an initial bolus dose). In this subgroup analysis we separated the studies into two groups according to whether the non‐high IV dose regimen was administered as continuous IV infusion or as IV bolus doses. The results are included in Table 2.
Of note, Choi et al (Choi 2009) randomized the participants into three arms:
-
a high dose regimen (N = 19; pantoprazole 80 mg bolus IV, then 8 mg/h IV infusion; cumulative dose of PPI over first 72 h was 656 mg);
-
a medium dose IV infusion regimen (N = 21; pantoprazole 40 mg bolus IV, then 4 mg/h IV infusion; cumulative dose of PPI over first 72 h was 328 mg); and
-
a low dose IV bolus regimen (N = 29; pantoprazole 40 mg bolus IV every 24 h; cumulative dose of PPI over first 72 h was 120 mg).
In order to avoid unit of analysis issues, we divided the high dose arm into two sub‐arms of 10 and 9 patients, and compared each one of these with one of the two other arms of the study. There was only one event in the high dose arm for the outcome of rebleeding. Sensitivity analyses (not shown) confirmed that the results were robust regardless of how the high dose arm was divided (9/10 or 10/9) and regardless of which sub‐arm the one event was assigned to.
Analysis 6. Subgroup analysis according to type of PPI in the high dose regimen (comparison of high vs. non‐high IV dose regimens)
In this planned subgroup analysis, we separated the studies into two groups according to the type of PPI in the high dose regimen. All studies included in this subgroup analysis used the same type of PPI for all study groups. Four studies used omeprazole (Cheng 2005; Cheng 2009; Udd 2001; Yilmaz 2006), eight used pantoprazole (Bajaj 2007; Choi 2009; Garrido 2008; Hsu 2010; Hung 2007; Jang 2006; Schonekas 1999; Yüksel 2008), and one allowed use of either omeprazole or pantoprazole (Andriulli 2008). The results are included in Table 2.
Analysis 7. Subgroup analysis according to ulcer site (comparison of high vs. non‐high IV dose regimens)
In this planned subgroup analysis, patients who bled from gastric ulcers were pooled separately from those who bled from duodenal ulcers. Only two studies (Andriulli 2008; Bajaj 2007) reported outcomes separately by ulcer site or allowed the calculation of such outcomes.The results are included in Table 2.
Sensitivity analyses
The results are included in Table 2.
-
Analysis 8. High dose regimens vs. low dose regimens (patients who received medium dose regimens were excluded from this analysis).
-
Analysis 9. High dose regimens vs. medium dose regimens (patients who received low dose regimens were excluded from this analysis).
-
Analysis 10. Medium dose regimens vs. low dose regimens (patients who received high dose regimens were excluded from this analysis).
-
Analysis 11. Non‐low dose regimens (high or medium) vs. low dose regimens.
-
Analysis 12. High dose regimens vs. non‐high dose regimens, restricted to patients with high risk stigmata of recent haemorrhage (SRH) (active bleeding or non‐bleeding visible vessel (NBVV)). Subgroup analysis was performed according to whether all or not all patients with high risk SRH received EHT at study entry. Only six studies were included in this analysis. See Analysis 12.1; Analysis 12.2; Analysis 12.3. Since Bajaj et al (Bajaj 2007) reported conflicting information regarding the proportion of patients with high risk SRH who received EHT at study entry, a sensitivity analysis was performed by placing this study in either of the two subgroups: as this was a zero event trial, it did not contribute to the calculation of the pooled estimate, therefore the results were identical either way. Choosing RD as summary statistic allowed this study to contribute to the analysis, but still the results did not change substantially because of the small weight of the study (results not shown).
-
Odds ratio vs. relative risk. The conclusions remained robust to the choice of summary statistic: results showed only minor (not clinically important) numerical changes (results not shown).
-
Fixed‐effect model vs. random‐effects model. The conclusions remained robust to the choice of model: results showed only minor (not clinically important) numerical changes (results not shown).
Post hoc analyses
Analysis 13. Post hoc analysis: All studies that compared at least two PPI regimens with different cumulative 72 hour doses
If more than two regimens of PPI were compared within a study, only the two extreme doses were included in this analysis (the highest dose vs. the lowest dose). The results are included in Table 2.
Mortality
Eighteen studies comprising 2197 participants compared at least two PPI regimens with different cumulative 72 hour doses and reported mortality. There was no significant heterogeneity among studies (P = 0.86; I² = 0%). We found low quality evidence that did not exclude a potential reduction or increase in mortality with higher dose PPI regimens: pooled RR 0.79 (95% CI 0.47 to 1.36) (Analysis 13.1). Visual inspection of the funnel plot (Figure 7) did not reveal asymmetry. Egger's test was not statistically significant (P = 0.34).

Funnel plot of comparison: 13 Post hoc analysis: studies that compared at least two PPI regimens with different cumulative 72 hour doses, outcome: 13.1 Mortality.
Rebleeding
Twenty one studies comprising 2338 participants compared at least two PPI regimens with different cumulative 72 hour doses and reported rebleeding. There was no significant heterogeneity among studies (P = 0.67; I² = 0%). We found low quality evidence that did not exclude a potential reduction or increase in rebleeding events with higher dose PPI regimens; pooled RR 1.02 (95% CI 0.81 to 1.29) (Analysis 13.2). Visual inspection of the funnel plot (Figure 8) did not show obvious asymmetry. Egger's test was not statistically significant (P = 0.82).
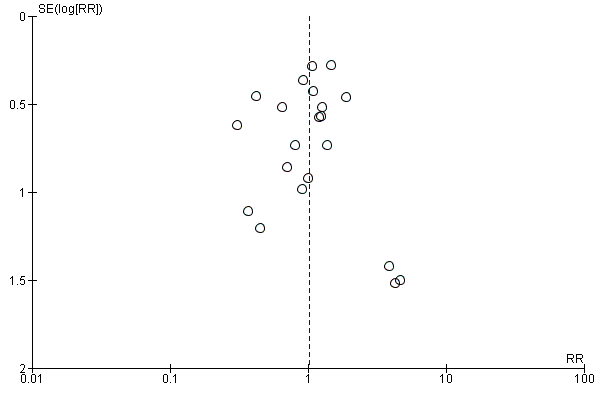
Funnel plot of comparison: 13 Post hoc analysis: studies that compared at least two PPI regimens with different cumulative 72 hour doses, outcome: 13.2 Rebleeding.
Surgery
Sixteen studies comprising 1884 participants compared at least two PPI regimens with different cumulative 72 hour doses and reported rates of surgical intervention. There was no significant heterogeneity among studies (P = 0.98; I² = 0%). We found low quality evidence that did not exclude a potential reduction or increase in surgical interventions with higher dose PPI regimens; pooled RR 1.22 (95% CI 0.64 to 2.3) (Analysis 13.3). Visual inspection of the funnel plot (Figure 9) did not show asymmetry. Egger's test was not statistically significant (P = 0.8).

Funnel plot of comparison: 13 Post hoc analysis: studies that compared at least two PPI regimens with different cumulative 72 hour doses, outcome: 13.3 Surgery.
Further endoscopic haemostatic treatment (EHT)
Eleven studies comprising 1352 participants compared at least two PPI regimens with different cumulative 72 hour doses and reported rates for EHT performed after study entry (initial EHT that was performed in some studies was not counted as part of the outcome). There was no significant heterogeneity among studies (P = 0.78; I² = 0%). We found low quality evidence that did not exclude a potential reduction or increase in EHT with higher dose PPI regimens; pooled RR 1.02 (95% CI 0.74 to 1.42); test for overall effect P = 0.88 (Analysis 13.4).
Length of hospital stay (LOS)
Eleven studies comprising 1570 participants compared at least two PPI regimens with different cumulative 72 hour doses and reported mean LOS together with standard deviation, standard error or 95% CI for each group. There was significant heterogeneity among studies: P < 0.0001; I² = 75%. (The heterogeneity was due to the results of a single study (Sha 2001). When this study was removed by post hoc sensitivity analysis, the heterogeneity was eliminated without substantial change in the pooled effect estimate.) We found moderate quality evidence suggesting no important difference in LOS between the two regimens: MD ‐0.41 days (95% CI ‐1.09 to 0.27) (Analysis 13.5).
Blood transfusions
Nine studies comprising 1425 participants compared at least two PPI regimens with different cumulative 72 hour doses and reported mean blood transfusion requirements together with standard deviation, standard error or 95% CI for each group. There was significant heterogeneity among studies: P < 0.04; I² = 50%. (As in the previous analysis for LOS, the heterogeneity was due to the results of a single study (Sha 2001). When this study was removed by post hoc sensitivity analysis, the heterogeneity was eliminated without substantial change in the pooled effect estimate.) We found moderate quality evidence suggesting no important difference in blood transfusion requirements between the two regimens: MD 0.23 units (95% CI ‐0.25 to 0.71) (Analysis 13.6).
Analysis 14. Post hoc analysis: All studies that compared at least two PPI regimens with different cumulative 72‐hour doses; restricted to patients with high risk stigmata of recent haemorrhage (SRH)
This analysis was restricted to patients with high risk SRH (active bleeding or NBVV): subgroup analysis was performed according to whether or not all patients with high risk SRH received EHT at study entry (Analysis 14.1; Analysis 14.2; Analysis 14.3). The results are included in Table 2.
Analysis 15. Post hoc analysis: Comparison of PPI regimens with the same 72‐hour cumulative dose, but different route of administration or frequency
Only one study (Costamagna 1998) was included in this analysis. Two of the four randomization groups in this study used (i) lansoprazole 30 mg IV twice daily and (ii) lansoprazole 60 mg IV once daily (for each group, the cumulative dose of PPI over the first 72 hours was 180 mg) Analysis 15.1. The results are included in Table 2.
Analysis 16. Post hoc analysis: IV regimens vs. oral regimens
Five studies (Bajaj 2007; Focareta 2004; Jang 2006; Tsai 2009; Yilmaz 2006) were included in this analysis. Within each of these five studies the 72‐hour cumulative dose of PPI was higher in the IV than the oral regimen. Three of the studies used a high dose IV PPI regimen (Bajaj 2007; Jang 2006; Yilmaz 2006) (Analysis 16.1; Analysis 16.2; Analysis 16.3). The results are included in Table 2.
Meta‐regression analysis
Meta‐regression analysis did not show any statistically significant associations between treatment effect (for the outcomes of mortality, rebleeding and surgical intervention) and the three study‐level factors that were assessed: geographical location (Asia or not Asia), route of PPI administration (IV or oral), and within‐study ratio among the 72‐hour cumulative doses of the two PPI regimens.
Specifically, all univariate and multivariate meta‐regression analyses showed non‐significant results. Numerical results are provided in Table 3 and examples are shown in Figure 10 and Figure 11.
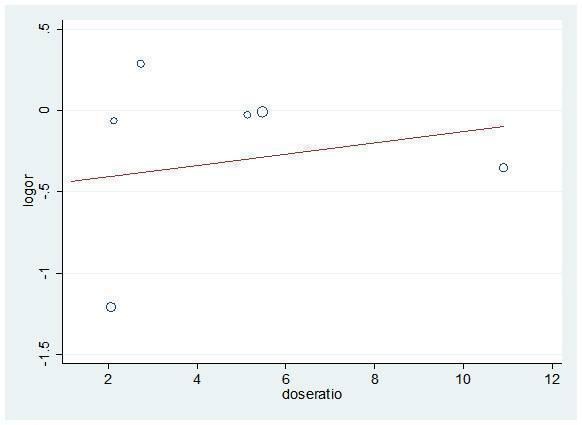
Meta‐regression (univariate) for dose ratio and mortality logOR

Meta‐regression (univariate) for dose ratio and rebleeding logOR
| Outcome | Number of included studies | Covariate | Univariate meta‐regression | Multivariate meta‐regression: P | |
| Coefficient (95% CI) | P | ||||
| Mortality | 6 | Dose ratio | 0.04 (‐0.26 to 0.33) | 0.759 | 0.995 |
| Geographical location | ‐0.40 (‐2.24 to 1.43) | 0.575 | 0.643 | ||
| Route for lower dose | ‐0.68 (‐3.42 to 2.06) | 0.529 | 0.406 | ||
| Rebleeding | 11 | Dose ratio | 0.01 (‐0.14 to 0.15) | 0.997 | 1.000 |
| Geographical location | ‐0.02 (‐0.77 to 0.74) | 0.959 | 1.000 | ||
| Route for lower dose | 0.04 (‐1.38 to 1.46) | 0.948 | 0.999 | ||
| Surgery | 5 | Dose ratio | ‐0.01 (‐0.38 to 0.37) | 0.956 | 1.000 |
| Geographical location | ‐0.51 (‐.3.78 to 1.75) | 0.651 | 0.621 | ||
| Route for lower dose | 0.01 (‐3.31 to 3.32) | 0.998 | 1.000 | ||
Dose ratio: ratio of higher dose to lower dose
Geographical location: Asia vs. elsewhere
Route for lower dose: intravenous or oral
We performed the same meta‐regression analyses for post hoc analysis 13 (all studies that compared at least two PPI regimens with different cumulative 72‐hour doses). Again, all results were non‐significant (results not shown; Figure 10 shows an example (Figure 12)).

Post hoc analysis: Meta‐regression (univariate) for dose ratio and rebleeding logOR for all studies that compared at least two doses of PPIs
Discussion
Summary of main results
This review has included 22 RCTs (2388 participants in total) that have compared at least two different regimens of the same or a different PPI in patients with acute bleeding from peptic ulcers.
There was no significant heterogeneity in the analyses contained in this review, with the exception of two post hoc analyses (for the outcomes of LOS and blood transfusions in analysis 13 which included all studies that compared at least two PPI regimens with different cumulative 72‐hour doses). The lack of heterogeneity may be partly due to the imprecision of most studies. The inclusion of relatively small studies with few or no events would have resulted in wide confidence intervals for their effect estimates, which would be likely to overlap considerably with the other studies' confidence intervals.
The main analysis of the review compared high dose regimens (cumulative PPI dose over the first 72 hours of 600 mg or higher) with non‐high dose regimens that administered less than 600 mg of PPI over the first 72 hours, i.e. either medium dose (cumulative PPI dose over the first 72 hours of 121 to 599 mg) or low dose (cumulative PPI dose over the first 72 hours of 120 mg or less). There was no significant heterogeneity for any outcome. For the outcomes of mortality, rebleeding, surgery and repeat EHT, we found low quality evidence that did not exclude either a potential reduction or an increase in outcomes with high dose PPI regimens compared to non‐high dose PPI regimens. For the outcomes of LOS and blood transfusions, we found moderate quality evidence suggesting no important difference in outcomes between the two regimens.
All subgroup and sensitivity analyses (including post hoc analyses) showed results similar to the respective main analyses.
-
For the outcomes of mortality, rebleeding, surgery and repeat EHT, all subgroup and sensitivity analyses showed low quality evidence that did not exclude either a potential reduction or an increase in outcomes with high dose compared to non‐high dose PPI regimens.
-
For the outcomes of LOS and blood transfusions, all subgroup analyses showed moderate quality evidence suggesting no important difference in outcomes between the two regimens.
-
None of the subgroup analyses suggested the presence of an interaction between the effect of the intervention and the pre‐specified variables (the test for subgroup differences was non‐significant in all subgroup analyses). However, some subgroup analyses may have been underpowered, given the small number of studies and events in some subgroups.
Multivariate meta‐regression did not show any demonstrable association between the effect estimate and pre‐determined study characteristics (ratio of "high" to "low" 72‐hour cumulative dose; geographical location; route of administration in the "non‐high" dose group).
There was no major funnel plot asymmetry in the analyses contained in this review, but there was clear asymmetry in the analysis for mortality with small, imprecise studies showing results in favour of "non‐high" dose PPI regimens and larger, more precise studies showing results supporting no difference ("inverse" publication bias).
The only analysis that was close to reaching conventional levels of statistical significance was the main analysis for rebleeding. Thirteen studies had compared high dose with non‐high dose PPI (Analysis 1.2; RR 1.27; 95% CI 0.96 to 1.67). This result is compatible with no difference, appreciable harm, or with a small appreciable benefit from high dose compared to non‐high dose PPI regimens. However, this lacks biological plausibility. It would have been expected that high doses would either be equivalent or more efficacious than lower doses in reducing rebleeding. There is no plausible explanation for a lower dose of a PPI to reduce rebleeding more than a high dose. Admittedly, high‐dose PPI treatment could have been associated with more adverse events than lower doses. However, we did not observe any trend for higher rates of mortality with high‐dose PPI treatment (although our analysis for mortality was under‐powered). The trend towards less rebleeding with non‐high dose PPI treatment cannot be explained by the route and mode of PPI administration. Neither could it be explained on the basis of the geographical location of the trials. Furthermore, this trend was not evident in the post hoc analysis (Analysis 13.2) that included 21 studies and compared the highest and the lowest dose in each study (regardless of whether the higher dose was a "high", "medium" or "low dose" according to our a priori definitions).
Thus, we cannot exclude the possibility that the trend towards more rebleeding with high‐dose PPIs may be real, although biologically implausible. However, it may equally be explained on the basis of a play of chance. Alternatively, this observation may be explicable on the basis of "inverse publication bias". Although there was no statistical funnel plot asymmetry in the analyses in this review, there was visible asymmetry in the analysis for mortality with small, imprecise studies showing results in favour of "non‐high" dose PPI regimens and larger, more precise studies showing results suggesting no difference. It is at least possible that researchers and editors may have considered some underpowered studies showing non‐significant trends in favour of high‐dose as "negative", thereby resulting in lower likelihood of their publication.
Another possibility is that this observed trend may have been caused by bias due to limitations in study design. Only three studies were adequately blinded (performance and detection bias) and even these studies had unclear risk of bias overall, either because of unclear concealment of forthcoming allocation (selection bias) or because of incomplete outcome data (attrition bias). Only two studies had low risk of bias with regards to concealment of forthcoming allocation; the remainder had unclear risk of bias. Trials with inadequate concealment of allocation and trials that are not double‐blinded yield larger estimates of treatment effects (Schulz 1995). The treatment effect of the "non‐high" dose regimens may have been exaggerated through bias in included studies. Trials with inadequate or unclear concealment of allocation or inadequate blinding may also be more likely to report results in the direction that investigators had predicted would be found. In this field, individual groups of investigators may have been motivated (consciously or subconsciously) to demonstrate efficacy of less costly or less cumbersome PPI regimens, or both. However, we have been unable to test this hypothesis since there were no studies with low risk of bias included in this review.
Based on our results, we went on to perform some post hoc analyses. The analysis comparing medium with low PPI dose was the only one to suggest a trend for reduced rebleeding in favour of medium (i.e. the higher) doses. All other analyses comparing dose ranges suggested trends favouring lower rebleeding for the lower dose range compared. We identified no trends in Analysis 13.2 (Figure 17) in which we had included all studies that had compared at least two PPI regimens with different cumulative 72 hour dosages. We subsequently excluded the high‐dose studies from Analysis 13.2. Among nine studies with 865 patients, there was a statistically significant reduction in rebleeding with the higher dose group (RR 0.63, 95% CI 0.42 to 0.95; no significant heterogeneity, I² = 0%, Figure 10). Therefore, when high‐dose regimens are excluded, the remaining studies indicate lower rebleeding risks with the higher dose regimens that remained. Even when the analysis was restricted to four studies (265 patients) that had compared two different regimens which were both within the medium dose range, there was still a statistically significant reduction in rebleeding seen with the higher dose group (RR 0.54, 95% CI 0.30 to 0.98; no significant heterogeneity, I² = 0%, Figure 11).
Therefore, taken at face value, our results for the outcome of rebleeding are conflicting and biologically implausible. Low and medium dose PPI regimens appear to be quantitatively more efficacious than high dose regimens, which is difficult to explain. However, medium dose regimens appear more efficacious than low dose regimens and there appears to be some dose‐response relationship within the medium dose range in favour of higher doses. Since these conclusions are conflicting and not compatible with a conventional dose‐response relationship across the full range of doses studied, they are most likely to be due to individual study limitations with or without the unseen effects of possible publication bias and random chance.
Overall completeness and applicability of evidence
The literature search was thorough, although (as discussed below) it was conducted around two years before the submission of this current version of the review.
The evidence is highly applicable and generalizable as the study populations were representative of patients that clinicians encounter in clinical practice. The interventions (PPIs) are readily available in most healthcare systems world‐wide.
Quality of the evidence
Overall, the quality of evidence for the outcomes of mortality, rebleeding, surgical intervention andfurther endoscopic haemostatic treatment is low because of study limitations and imprecision. None of the studies was of low risk of bias in all domains. Eight of the 13 studies included in the main analysis had high risk of bias in at least one domain. The most common reason was lack of blinding (performance and detection bias), followed by selective outcome reporting (reporting bias) and incomplete outcome data (attrition bias). The remaining five studies had unclear risk of bias in at least one domain; most commonly with regards to allocation concealment (selection bias), which was adequate in only two studies. Regarding imprecision, the 95% CI around the pooled estimate includes the possibilities of no effect as well as both appreciable benefit and appreciable harm. In addition, the total number of events was only 46, which is well below the threshold "rule of thumb" value of 300 for adequate precision.
The overall quality of evidence for the outcomes of length of hospital stay and blood transfusion requirements is moderate because of study limitations (risk of bias) as described above. There was no serious imprecision since the 95% CI around the LOS estimate was less than one day; in the case of blood transfusion, it was less than one unit.
Potential biases in the review process
Although we performed an extensive literature search, this was conducted in September 2010, which is around two years prior to the submission of the current version of this review. However, the authors are unaware of any important trials whose results have subsequently become available. Furthermore, we doubt that any such trials would have had sufficient power to produce substantive or important changes to our broad conclusions.
We deliberately included quite a high number of subgroup and sensitivity analyses because of the known complexity of the individual trials and the large number of variations in design and measurement among the trials. In addition, we also performed a limited number of post hoc analyses, which are carefully described as such in this review. While this would ordinarily have increased the likelihood of finding a spuriously "significant" result by chance alone, this is manifestly not the case.
Agreements and disagreements with other studies or reviews
Since the publication of the protocol for this Cochrane review, two systematic reviews on the topic have been published.
First, Wang et al (Wang 2010) included seven “high‐quality” RCTs that were published before August 2009. Conference proceedings were not searched. Wang et al used a similar threshold for the definition of “high” dose PPI as we did. Their main results were very similar to ours. They reported pooled odds ratios for high dose vs. non–high dose PPI of 0.89 (95% CI 0.37 to 2.13) for mortality (6 studies, 1052 patients), 1.30 (95% CI, 0.88 to 1.91) for rebleeding (7 studies, 1157 patients), and 1.49 (95% CI 0.66 to 3.37) for surgical intervention (6 studies, 1052 patients). Although Wang et al have interpreted their results as showing evidence of no difference between the two dose regimens, we believe that the CIs of the pooled ORs are too wide to support such a conclusion (Leontiadis 2010). Furthermore, these authors did not consider the overall quality of evidence of their results. While they attempted to limit their analysis to RCTs of "high quality", they used questionable methods to do so. They used the Jadad scale which evaluates only three domains of bias (randomization, blinding, completeness of follow‐up) and included studies with at least a score of 3 out of 5. The use of such scale systems is discouraged by The Cochrane Collaboration in favour of the "risk of bias" tool. When we applied this tool to the studies that Wang et al had included, none had low risk of bias, two had high risk and five had unclear risk (see Figure 2).
Second, Wu et al (Wu 2010) included nine RCTs that were published before September 2009. They included trials that had compared two doses of PPIs provided that one of the doses was at least twice that of the other. This was broadly similar to the approach we undertook in our post hoc Analysis 13. Although they did not formally search conference proceedings, they did include the results of three studies that were only available in abstract form, and excluded some studies that had been available as full publications. Although they used the Cochrane risk of bias tool, we disagree with their assessments; they reported that four studies had low risk of bias but we believe that none had low risk (Figure 2). Despite these limitations, their conclusions were broadly similar to ours and to those of Wang et al (Wang 2010). For higher versus lower PPI doses, they found non‐significant results for mortality (OR 1.02; 95% CI 0.48 to 1.48), rebleeding (OR 1.1; 95% CI 0.78 to 1.53) and surgery (OR 1.52; 95% CI 0.64 to 3.61). Like Wang et al, they concluded that their results indicated equivalence of higher and lower PPI doses. However, we are inclined to think that their results are compatible with no difference as well as both potential harm and benefit of higher versus lower PPI doses.

Study flow diagram.

Risk of bias graph: review authors' judgements about each risk of bias item presented as percentages across all included studies.

Risk of bias summary: review authors' judgements about each risk of bias item for each included study.

Funnel plot of comparison: 1 High vs. non‐high (medium or low) dose regimen, outcome: 1.1 Mortality.

Funnel plot of comparison: 1 High vs. non‐high (medium or low) dose regimen, outcome: 1.2 Rebleeding.

Funnel plot of comparison: 1 High vs. non‐high (medium or low) dose regimen, outcome: 1.3 Surgery.

Funnel plot of comparison: 13 Post hoc analysis: studies that compared at least two PPI regimens with different cumulative 72 hour doses, outcome: 13.1 Mortality.

Funnel plot of comparison: 13 Post hoc analysis: studies that compared at least two PPI regimens with different cumulative 72 hour doses, outcome: 13.2 Rebleeding.

Funnel plot of comparison: 13 Post hoc analysis: studies that compared at least two PPI regimens with different cumulative 72 hour doses, outcome: 13.3 Surgery.

Meta‐regression (univariate) for dose ratio and mortality logOR

Meta‐regression (univariate) for dose ratio and rebleeding logOR
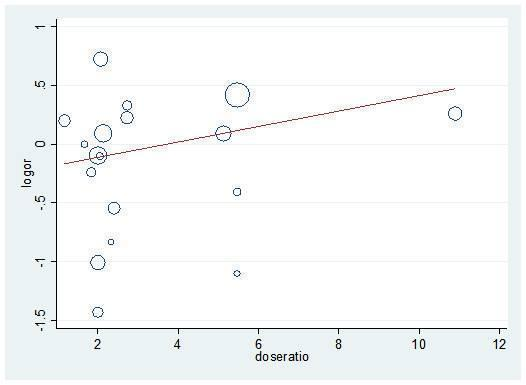
Post hoc analysis: Meta‐regression (univariate) for dose ratio and rebleeding logOR for all studies that compared at least two doses of PPIs

Comparison 1 High vs. non‐high (medium or low) dose regimen, Outcome 1 Mortality.

Comparison 1 High vs. non‐high (medium or low) dose regimen, Outcome 2 Rebleeding.

Comparison 1 High vs. non‐high (medium or low) dose regimen, Outcome 3 Surgery.
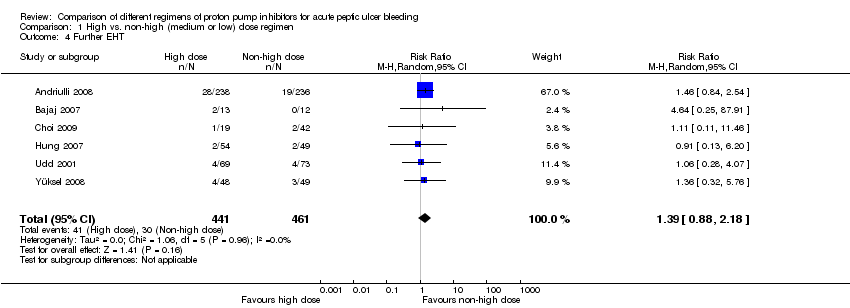
Comparison 1 High vs. non‐high (medium or low) dose regimen, Outcome 4 Further EHT.

Comparison 1 High vs. non‐high (medium or low) dose regimen, Outcome 5 Length of hospital stay.
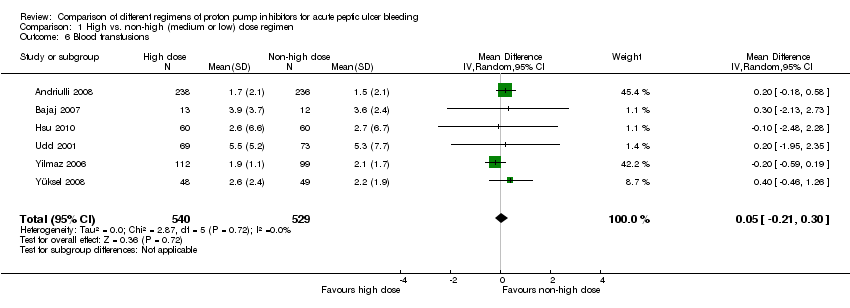
Comparison 1 High vs. non‐high (medium or low) dose regimen, Outcome 6 Blood transfusions.

Comparison 2 Subgroup analysis: Risk of bias, Outcome 1 Mortality.
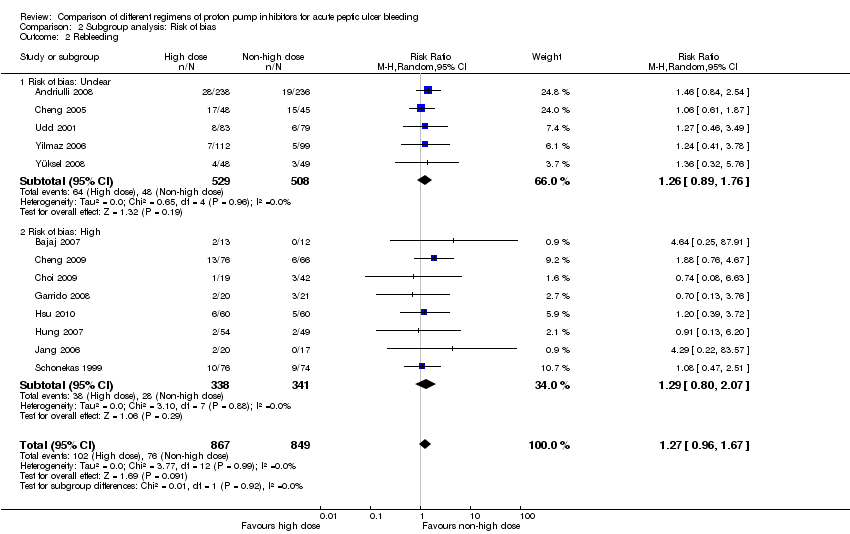
Comparison 2 Subgroup analysis: Risk of bias, Outcome 2 Rebleeding.

Comparison 2 Subgroup analysis: Risk of bias, Outcome 3 Surgery.

Comparison 2 Subgroup analysis: Risk of bias, Outcome 4 Further EHT.
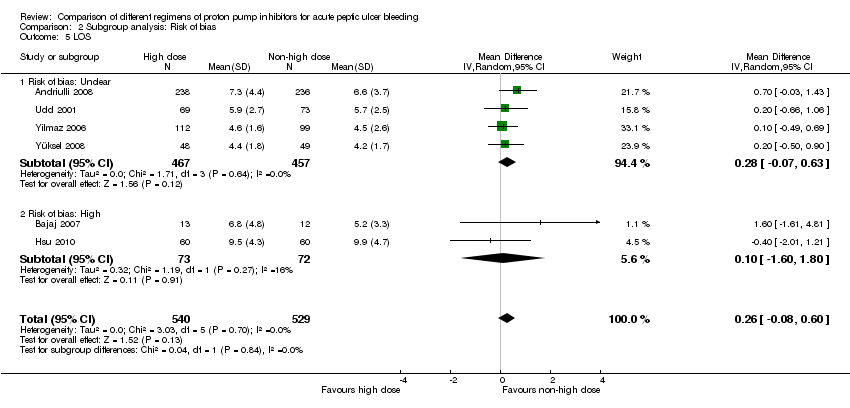
Comparison 2 Subgroup analysis: Risk of bias, Outcome 5 LOS.
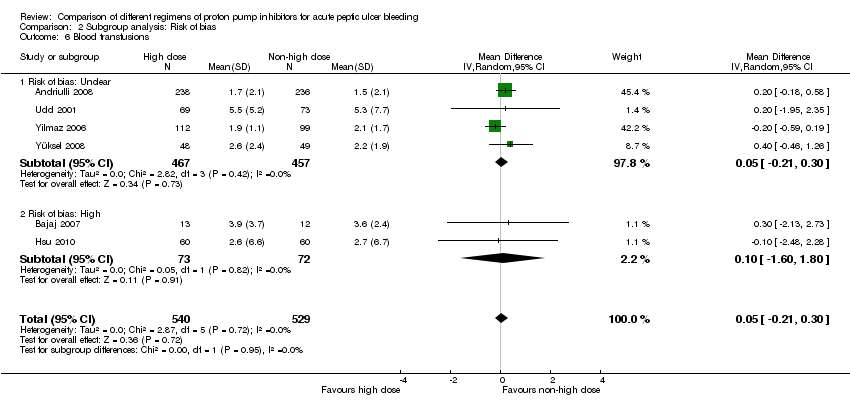
Comparison 2 Subgroup analysis: Risk of bias, Outcome 6 Blood transfusions.

Comparison 3 Subgroup analysis: Geographical location, Outcome 1 Mortality.

Comparison 3 Subgroup analysis: Geographical location, Outcome 2 Rebleeding.
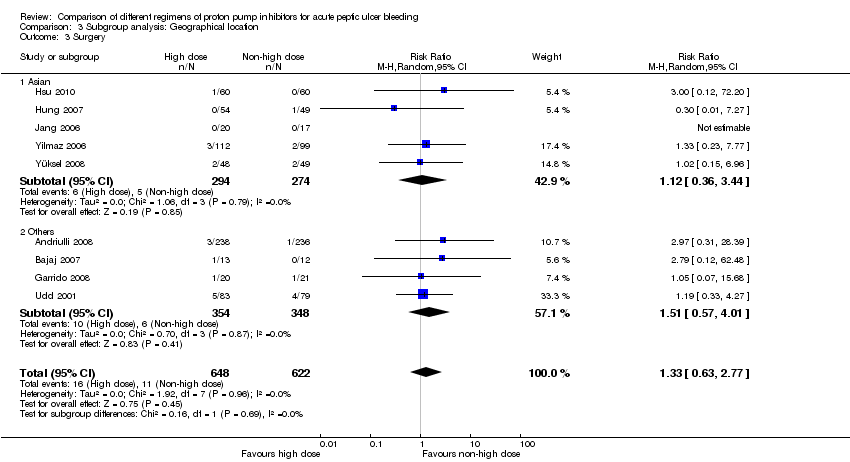
Comparison 3 Subgroup analysis: Geographical location, Outcome 3 Surgery.

Comparison 3 Subgroup analysis: Geographical location, Outcome 4 Further EHT.
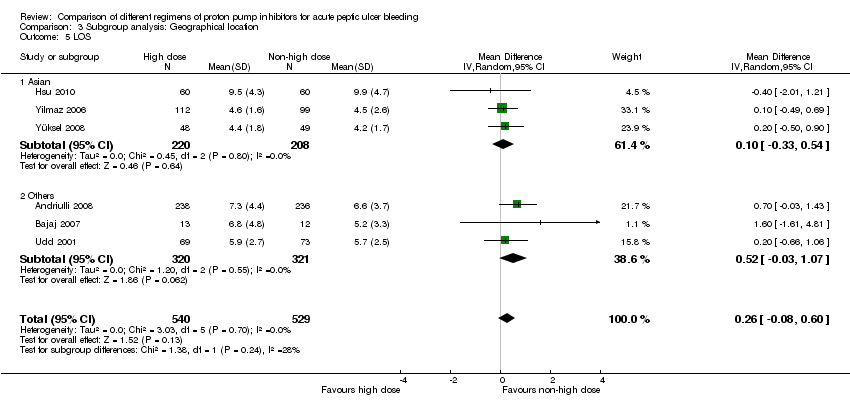
Comparison 3 Subgroup analysis: Geographical location, Outcome 5 LOS.
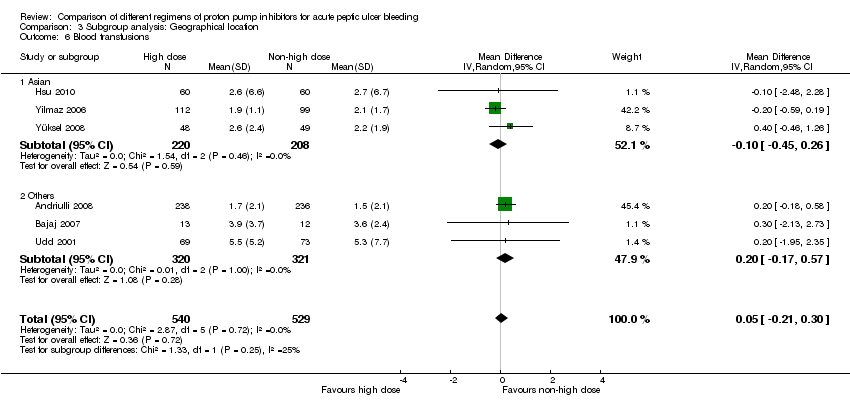
Comparison 3 Subgroup analysis: Geographical location, Outcome 6 Blood transfusions.

Comparison 4 Subgroup analysis: Route of administration in non‐high dose regimen, Outcome 1 Mortality.
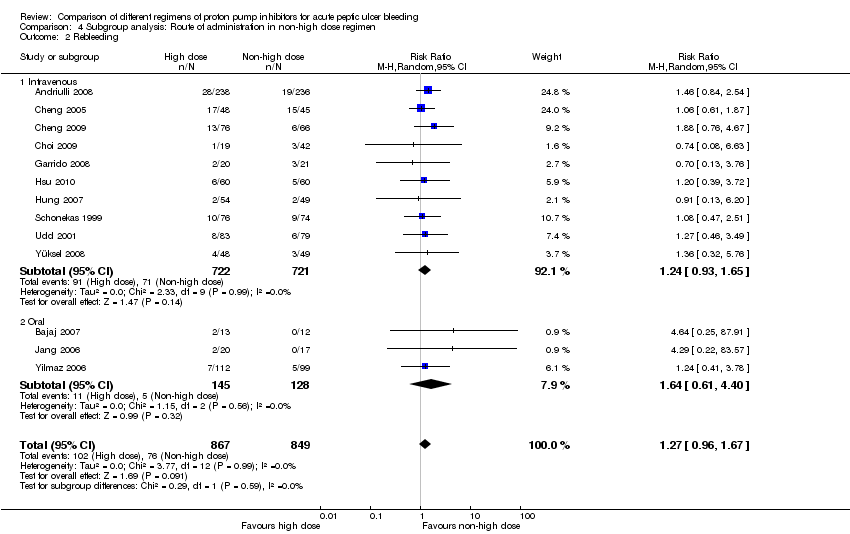
Comparison 4 Subgroup analysis: Route of administration in non‐high dose regimen, Outcome 2 Rebleeding.

Comparison 4 Subgroup analysis: Route of administration in non‐high dose regimen, Outcome 3 Surgery.

Comparison 4 Subgroup analysis: Route of administration in non‐high dose regimen, Outcome 4 Further EHT.
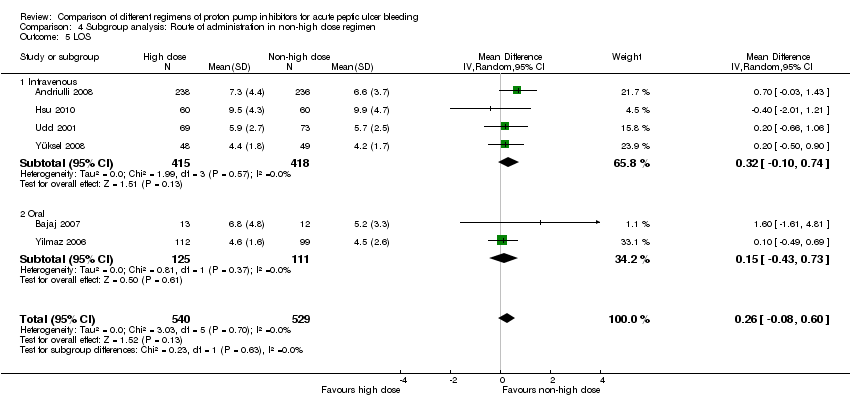
Comparison 4 Subgroup analysis: Route of administration in non‐high dose regimen, Outcome 5 LOS.

Comparison 4 Subgroup analysis: Route of administration in non‐high dose regimen, Outcome 6 Blood transfusions.

Comparison 5 Subgroup analysis: IV bolus vs. IV infusion in non‐high dose regimen, Outcome 1 Mortality.
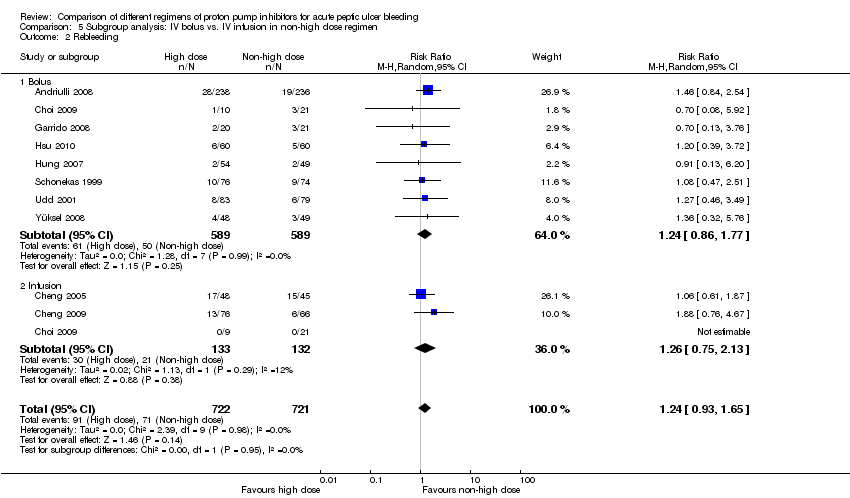
Comparison 5 Subgroup analysis: IV bolus vs. IV infusion in non‐high dose regimen, Outcome 2 Rebleeding.

Comparison 5 Subgroup analysis: IV bolus vs. IV infusion in non‐high dose regimen, Outcome 3 Surgery.
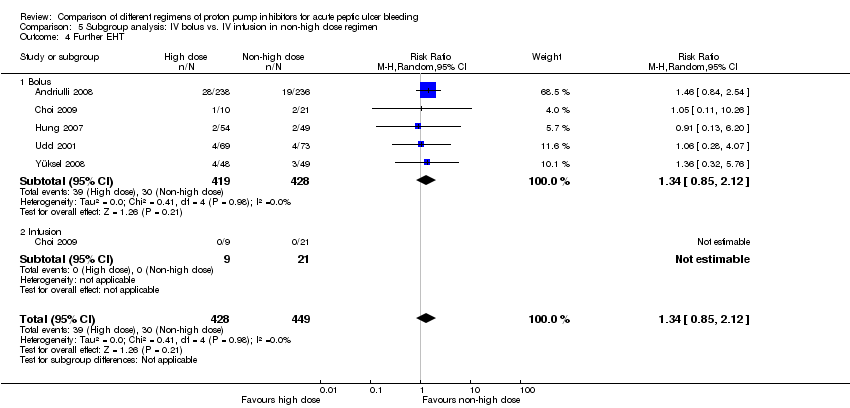
Comparison 5 Subgroup analysis: IV bolus vs. IV infusion in non‐high dose regimen, Outcome 4 Further EHT.

Comparison 5 Subgroup analysis: IV bolus vs. IV infusion in non‐high dose regimen, Outcome 5 LOS.

Comparison 5 Subgroup analysis: IV bolus vs. IV infusion in non‐high dose regimen, Outcome 6 Blood transfusions.

Comparison 6 Subgroup analysis: Type of PPI in high dose regimen, Outcome 1 Mortality.

Comparison 6 Subgroup analysis: Type of PPI in high dose regimen, Outcome 2 Rebleeding.

Comparison 6 Subgroup analysis: Type of PPI in high dose regimen, Outcome 3 Surgery.

Comparison 6 Subgroup analysis: Type of PPI in high dose regimen, Outcome 4 Further EHT.

Comparison 6 Subgroup analysis: Type of PPI in high dose regimen, Outcome 5 LOS.
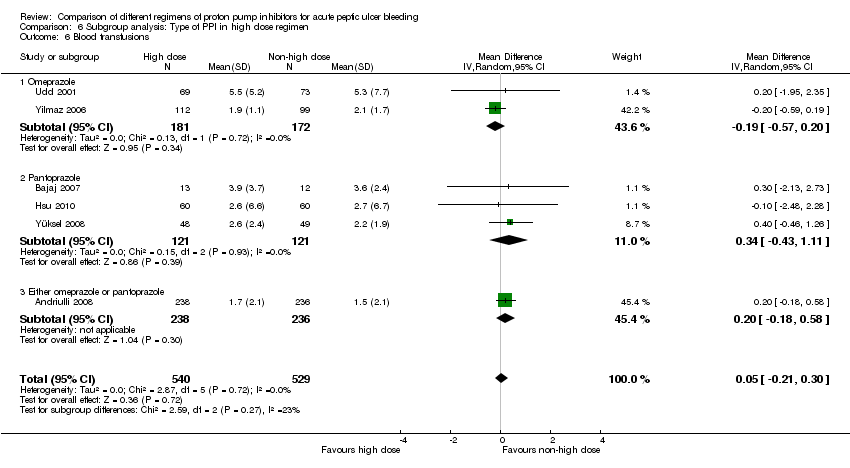
Comparison 6 Subgroup analysis: Type of PPI in high dose regimen, Outcome 6 Blood transfusions.

Comparison 7 Subgroup analysis: Ulcer site, Outcome 1 Mortality.

Comparison 7 Subgroup analysis: Ulcer site, Outcome 2 Rebleeding.

Comparison 7 Subgroup analysis: Ulcer site, Outcome 3 Surgery.

Comparison 8 Sensitivity analysis: High vs. low dose, Outcome 1 Mortality.

Comparison 8 Sensitivity analysis: High vs. low dose, Outcome 2 Rebleeding.

Comparison 8 Sensitivity analysis: High vs. low dose, Outcome 3 Surgery.
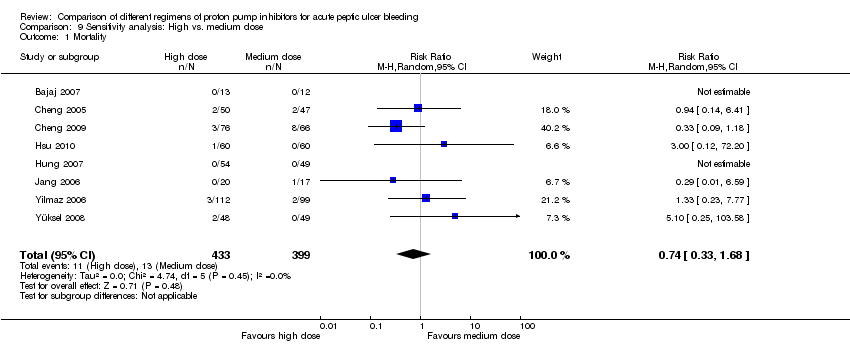
Comparison 9 Sensitivity analysis: High vs. medium dose, Outcome 1 Mortality.

Comparison 9 Sensitivity analysis: High vs. medium dose, Outcome 2 Rebleeding.

Comparison 9 Sensitivity analysis: High vs. medium dose, Outcome 3 Surgery.

Comparison 10 Sensitivity analysis: Medium vs. low dose, Outcome 1 Mortality.

Comparison 10 Sensitivity analysis: Medium vs. low dose, Outcome 2 Rebleeding.

Comparison 10 Sensitivity analysis: Medium vs. low dose, Outcome 3 Surgery.

Comparison 11 Sensitivity analysis: Non‐low (high or medium) dose vs. low dose, Outcome 1 Mortality.
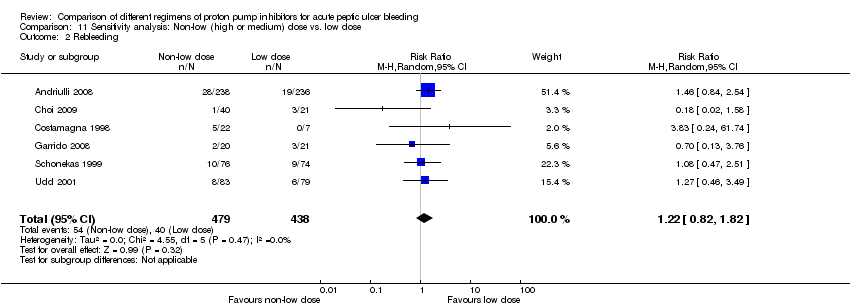
Comparison 11 Sensitivity analysis: Non‐low (high or medium) dose vs. low dose, Outcome 2 Rebleeding.
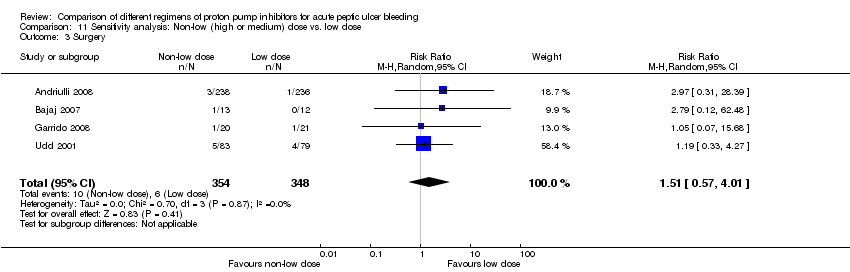
Comparison 11 Sensitivity analysis: Non‐low (high or medium) dose vs. low dose, Outcome 3 Surgery.

Comparison 12 Sensitivity analysis: High vs. non‐high dose; patients with high risk SRH, Outcome 1 Mortality.

Comparison 12 Sensitivity analysis: High vs. non‐high dose; patients with high risk SRH, Outcome 2 Rebleeding.
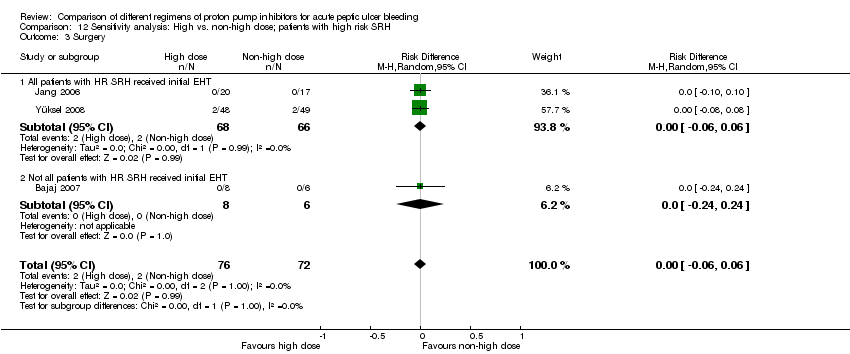
Comparison 12 Sensitivity analysis: High vs. non‐high dose; patients with high risk SRH, Outcome 3 Surgery.

Comparison 13 Post hoc analysis: Studies that compared at least two PPI regimens with different 72‐hour cumulative dose, Outcome 1 Mortality.

Comparison 13 Post hoc analysis: Studies that compared at least two PPI regimens with different 72‐hour cumulative dose, Outcome 2 Rebleeding.

Comparison 13 Post hoc analysis: Studies that compared at least two PPI regimens with different 72‐hour cumulative dose, Outcome 3 Surgery.

Comparison 13 Post hoc analysis: Studies that compared at least two PPI regimens with different 72‐hour cumulative dose, Outcome 4 Further EHT.
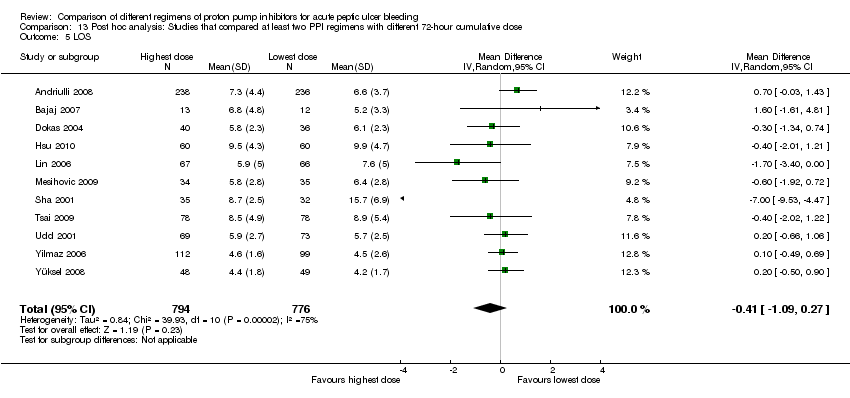
Comparison 13 Post hoc analysis: Studies that compared at least two PPI regimens with different 72‐hour cumulative dose, Outcome 5 LOS.

Comparison 13 Post hoc analysis: Studies that compared at least two PPI regimens with different 72‐hour cumulative dose, Outcome 6 Blood transfusions.

Comparison 14 Post hoc analysis: Studies that compared at least two PPI regimens with different 72‐hour cumulative dose; high risk SRH, Outcome 1 Mortality.

Comparison 14 Post hoc analysis: Studies that compared at least two PPI regimens with different 72‐hour cumulative dose; high risk SRH, Outcome 2 Rebleeding.
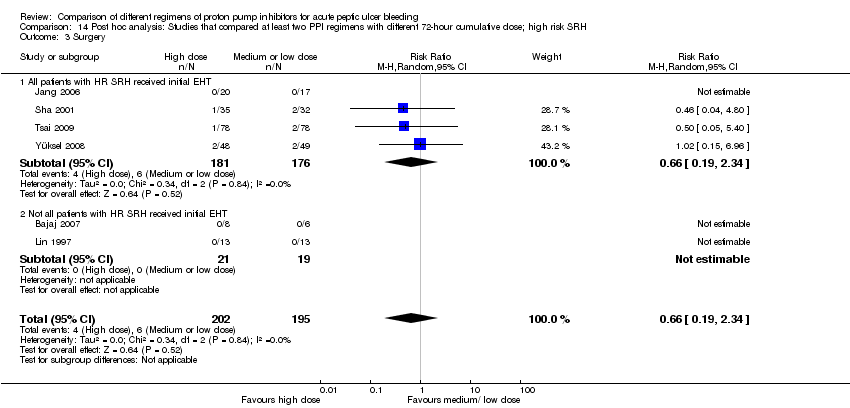
Comparison 14 Post hoc analysis: Studies that compared at least two PPI regimens with different 72‐hour cumulative dose; high risk SRH, Outcome 3 Surgery.

Comparison 15 Post hoc analysis: Comparison of regimens with the same 72‐hour cumulative dose, but different route or frequency, Outcome 1 Rebleeding.
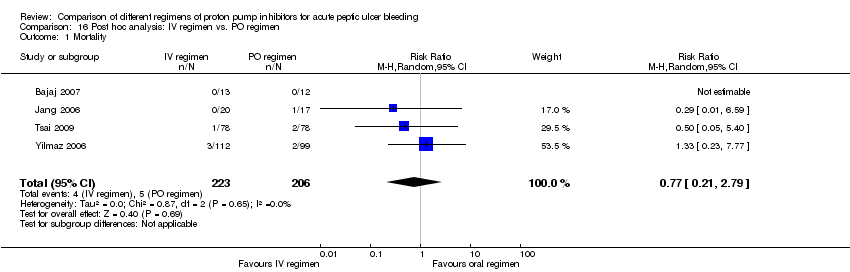
Comparison 16 Post hoc analysis: IV regimen vs. PO regimen, Outcome 1 Mortality.

Comparison 16 Post hoc analysis: IV regimen vs. PO regimen, Outcome 2 Rebleeding.
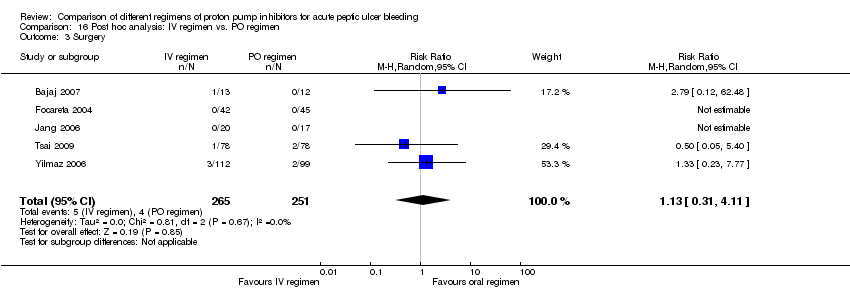
Comparison 16 Post hoc analysis: IV regimen vs. PO regimen, Outcome 3 Surgery.
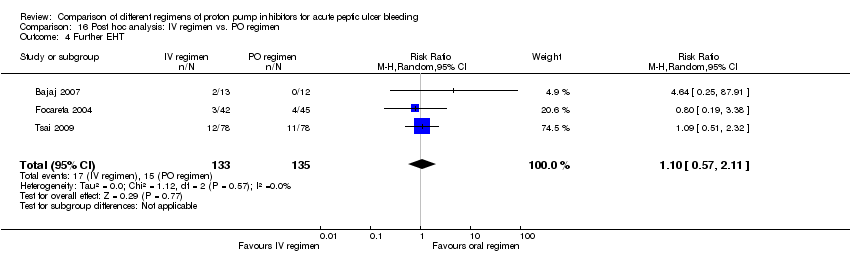
Comparison 16 Post hoc analysis: IV regimen vs. PO regimen, Outcome 4 Further EHT.

Comparison 16 Post hoc analysis: IV regimen vs. PO regimen, Outcome 5 LOS.

Comparison 16 Post hoc analysis: IV regimen vs. PO regimen, Outcome 6 Blood transfusions.
| High compared to non‐high (medium or low) dose regimen for acute peptic ulcer bleeding | ||||||
| Patient or population: patients with acute peptic ulcer bleeding | ||||||
| Outcomes | Illustrative comparative risks* (95% CI) | Relative effect | No of participants | Quality of the evidence | Comments | |
| Assumed risk | Corresponding risk | |||||
| Non‐high (medium or low) dose regimen | High | |||||
| Mortality | 3 per 100 | 3 per 100 | RR 0.85 | 1667 | ⊕⊕⊝⊝ | |
| Rebleeding | 9 per 100 | 11 per 100 | RR 1.27 | 1716 | ⊕⊕⊝⊝ | |
| Surgery | 2 per 100 | 3 per 100 | RR 1.33 | 1270 | ⊕⊕⊝⊝ | |
| Further EHT | 7 per 100 | 9 per 100 | RR 1.39 | 902 | ⊕⊕⊝⊝ | |
| Length of hospital stay | The mean length of hospital stay in the intervention group was | 1069 | ⊕⊕⊕⊝ | |||
| Blood transfusions | The mean blood transfusions in the intervention group was | 1069 | ⊕⊕⊕⊝ | |||
| *The basis for the assumed risk (e.g. the median control group risk across studies) is provided in footnotes. The corresponding risk (and its 95% confidence interval) is based on the assumed risk in the comparison group and the relative effect of the intervention (and its 95% CI). | ||||||
| GRADE Working Group grades of evidence | ||||||
| 1 Pooled risk difference. | ||||||
| Study ID | Mortality | Rebleeding | Surgery | Further endoscopic haemostatic treatment |
| Andriulli 2008 | During hospitalization | During hospitalization; 24 h; 3 d; 7 d | During hospitalization | During hospitalization |
| Bajaj 2007 | 30 d | 30 h; 4 d; 30 d | 30 d | U |
| Cheng 2005 | U | 3 d; 7 d; 14 d; 28 d | U | X |
| Cheng 2009 | U | 7 d; 28 d | X | X |
| Choi 2009 | X | 72 h; 7 d; 30 d | X | U |
| Costamagna 1998 | X | 48 h; 7 d | X | X |
| Dokas 2004 | U | U | U | X |
| Focareta 2004 | X | U | U | U |
| Garrido 2008 | U | U | U | X |
| Hsu 2010 | 14 d | 14 d | U | X |
| Hung 2007 | 30 d | 30 d | 30 d | U |
| Jang 2006 | U | 30 d | U | X |
| Lin 1997 | U | U | U | U |
| Lin 2006 | U | 24 h; 3 d; 14 d | U | U |
| Mesihovic 2009 | U | U | U | U |
| Oh 2007 | U | X | X | X |
| Schonekas 1999 | 14 d | 72 h | U | X |
| Sha 2001 | U | U | U | X |
| Tsai 2009 | 14 d; 30 d | 3 d; 14 d | 14 d; 30 d | 14 d |
| Udd 2001 | 30 d | U | U | U |
| Yilmaz 2006 | 30 d | During hospitalization; 30 d | U | During hospitalization |
| Yüksel 2008 | U | U | U | U |
| U: unclear timing of outcome assessment X: outcome not reported or not calculable h: hours d: days | ||||
| Analysis 2. High vs. non‐high dose regimen: Subgroup analysis according to risk of bias | |||||||
| Outcome | Subgroup | Studies | Participants | Summary statistic | Effect estimate [95% CI] | Significant heterogeneity: | Test for subgroup differences: |
| Mortality | Unclear | 5 | 1041 | RR | 1.05 [0.50, 2.20] | No (P = 0.84; I² = 0%) | P = 0.36 |
| High | 7 | 626 | RR | 0.61 [0.24, 1.52] | No (P = 0.84; I² = 0%) | ||
| Rebleeding | Unclear | 13 | 1037 | RR | 1.26 [0.89, 1.76] | No (P = 0.96; I² = 0%) | P = 0.92 |
| High | 5 | 679 | RR | 1.29 [0.80, 2.07] | No (P = 0.88; I² = 0%) | ||
| Surgery | Unclear | 4 | 944 | RR | 1.35 [0.58, 3.14] | No (P = 0.90; I² = 0%) | P = 0.94 |
| High | 5 | 326 | RR | 1.26 [0.28, 5.73] | No (P = 0.72; I² = 0%) | ||
| Further EHT | Unclear | 3 | 713 | RR | 1.39 [0.86, 2.25] | No (P = 0.91; I² = 0%) | P = 0.96 |
| High | 3 | 189 | RR | 1.35 [0.36, 5.07] | No (P = 0.64; I² = 0%) | ||
| LOS | Unclear | 4 | 924 | MD | 0.28 [‐0.07, 0.63] | No (P = 0.64; I² = 0%) | P = 0.84 |
| High | 2 | 145 | MD | 0.10 [‐1.60, 1.80] | No (P = 0.27; I² = 16%) | ||
| Blood transfusions | Unclear | 4 | 924 | MD | 0.05 [‐0.21, 0.30] | No (P = 0.42; I² = 0%) | P = 0.95 |
| High | 2 | 145 | MD | 0.10 [‐1.60, 1.80] | No (P = 0.82; I² = 0%) | ||
| Analysis 3. High vs. non‐high dose regimen: Subgroup analysis according to geographical location | |||||||
| Outcome | Subgroup | Studies | Participants | Summary statistic | Effect estimate [95% CI] | Significant heterogeneity: | Test for subgroup differences: |
| Mortality | Asian studies | 7 | 807 | RR | 0.74 [0.33, 1.68] | No (P = 0.45; I² = 0%) | P = 0.66 |
| Other | 5 | 860 | RR | 0.96 [0.43, 2.18] | No (P = 0.87; I² = 0%) | ||
| Rebleeding | Asian studies | 8 | 864 | RR | 1.24 [0.85, 1.80] | No (P = 0.95; I² = 0%) | P = 0.85 |
| Other | 5 | 852 | RR | 1.31 [0.87, 1.96] | No (P = 0.81; I² = 0%) | ||
| Surgery | Asian studies | 5 | 568 | RR | 1.12 [0.36, 3.44] | No (P = 0.79; I² = 0%) | P = 0.69 |
| Other | 4 | 702 | RR | 1.51 [0.57, 4.01] | No (P = 0.87; I² = 0%) | ||
| Further EHT | Asian studies | 3 | 261 | RR | 1.16 [0.41, 3.27] | No (P = 0.95; I² = 0%) | P = 0.71 |
| Other | 3 | 641 | RR | 1.44 [0.87, 2.39] | No (P = 0.67; I² = 0%) | ||
| LOS | Asian studies | 3 | 428 | MD | 0.10 [‐0.33, 0.54] | No (P = 0.80; I² = 0%) | P = 0.24 |
| Other | 3 | 641 | MD | 0.52 [‐0.03, 1.07] | No (P = 0.55; I² = 0%) | ||
| Blood transfusions | Asian studies | 3 | 428 | MD | ‐0.10 [‐0.45, 0.26] | No (P = 0.46; I² = 0%) | P = 0.25 |
| Other | 3 | 641 | MD | 0.20 [‐0.17, 0.57] | No (P = 1.00; I² = 0%) | ||
| Analysis 4. High vs. non‐high dose regimen: Subgroup analysis according to route of administration for the non‐high dose regimen | |||||||
| Outcome | Subgroup | Studies | Participants | Summary statistic | Effect estimate [95% CI] | Significant heterogeneity: | Test for subgroup differences: |
| Mortality | IV | 9 | 1394 | RR | 0.84 [0.45, 1.56] | No (P = 0.67; I² = 0%) | P = 0.92 |
| PO | 3 | 273 | RR | 0.92 [0.20, 4.28] | No (P = 0.40; I² = 0%) | ||
| Rebleeding | IV | 10 | 1443 | RR | 1.24 [0.93, 1.65] | No (P = 0.99; I² = 0%) | P = 0.59 |
| PO | 3 | 273 | RR | 1.64 [0.61, 4.40] | No (P = 0.56; I² = 0%) | ||
| Surgery | IV | 6 | 997 | RR | 1.26 [0.54, 2.91] | No (P = 0.89; I² = 0%) | P = 0.79 |
| PO | 3 | 273 | RR | 1.59 [0.34, 7.40] | No (P = 0.68; I² = 0%) | ||
| Further EHT | IV | 5 | 877 | RR | 1.35 [0.85, 2.13] | No (P = 0.98; I² = 0%) | P = 0.41 |
| PO | 1 | 25 | RR | 4.64 [0.25, 87.91] | No (P = 0.96; I² = 0%) | ||
| LOS | IV | 4 | 833 | MD | 0.32 [‐0.10, 0.74] | No (P = 0.57; I² = 0)% | P = 0.63 |
| PO | 2 | 236 | MD | 0.15 [‐0.43, 0.73] | No (P = 0.37; I² = 0%) | ||
| Blood transfusions | IV | 4 | 833 | MD | 0.22 [‐0.11, 0.56] | No (P = 0.97; I² = 0%) | P = 0.12 |
| PO | 2 | 236 | MD | ‐0.19 [‐0.57, 0.20] | No (P = 0.69; I² = 0%) | ||
| Analysis 5. High vs. non‐high dose regimen: Subgroup analysis according to whether in non‐high dose regimen PPI was administered as IV bolus or IV infusion | |||||||
| Outcome | Subgroup | Studies | Participants | Summary statistic | Effect estimate [95% CI] | Significant heterogeneity: | Test for subgroup differences: |
| Mortality | Bolus | 7 | 1155 | RR | 1.15 [0.53, 2.47] | No (P = 0.82; I² = 0%) | P = 0.16 |
| Infusion | 2 | 239 | RR | 0.45 [0.16, 1.32] | No (P = 0.37; I² = 0%) | ||
| Rebleeding | Bolus | 8 | 1178 | RR | 1.24 [0.86, 1.77] | No (P = 0.99; I² = 0%) | P = 0.95 |
| Infusion | 3 | 265 | RR | 1.26 [0.75, 2.13] | No (P = 0.29; I² = 12%) | ||
| Surgery | Bolus | 6 | 997 | RR | 1.26 [0.54, 2.91] | No (P = 0.89; I² = 0%) | Not applicable |
| Infusion | 0 | 0 | RR | Not estimable | Not applicable | ||
| Further EHT | Bolus | 5 | 847 | RR | 1.34 [0.85, 2.12] | No (P = 0.98; I² = 0%) | Not applicable |
| Infusion | 1 | 30 | RR | Not estimable | Not applicable | ||
| LOS | Bolus | 4 | 833 | MD | 0.32 [‐0.10, 0.74] | No (P = 0.57; I² = 0%) | Not applicable |
| Infusion | 0 | 0 | MD | Not estimable | Not applicable | ||
| Blood transfusions | Bolus | 4 | 833 | MD | 0.22 [‐0.11, 0.56] | No (P = 0.97; I² = 0%) | Not applicable |
| Infusion | 0 | 0 | MD | Not estimable | Not applicable | ||
| Analysis 6. High vs. non‐high dose regimen: Subgroup analysis according to type of PPI in high dose regimen | |||||||
| Outcome | Subgroup | Studies | Participants | Summary statistic | Effect estimate [95% CI] | Significant heterogeneity: | Test for subgroup differences: |
| Mortality | Omeprazole | 4 | 612 | RR | 0.63 [0.29, 1.37] | No (P = 0.60; I² = 0%) | P = 0.49 |
| Pantoprazole | 7 | 581 | RR | 1.49 [0.44, 5.01] | No (P = 0.68; I² = 0%) | ||
| Either omeprazole or pantoprazole | 1 | 474 | RR | 0.99 [0.29, 3.38] | Not applicable | ||
| Rebleeding | Omeprazole | 4 | 608 | RR | 1.25 [0.83, 1.87] | No (P = 0.60; I² = 0%) | P = 0.49 |
| Pantoprazole | 8 | 634 | RR | 1.15 [0.69, 1.93] | No (P = 0.68; I² = 0%) | ||
| Either omeprazole or pantoprazole | 1 | 474 | RR | 1.46 [0.84, 2.54] | Not applicable | ||
| Surgery | Omeprazole | 2 | 373 | RR | 1.23 [0.44, 3.48] | No (P = 0.92; I² = 0%) | P = 0.76 |
| Pantoprazole | 6 | 423 | RR | 1.17 [0.36, 3.82] | No (P = 0.85; I² = 0%) | ||
| Either omeprazole or pantoprazole | 1 | 474 | RR | 2.97 [0.31, 28.39] | Not applicable | ||
| Further EHT | Omeprazole | 1 | 142 | RR | 1.06 [0.28, 4.07] | Not applicable | P = 0.91 |
| Pantoprazole | 4 | 286 | RR | 1.35 [0.51, 3.59] | No (P = 0.83; I² = 0%) | ||
| Either omeprazole or pantoprazole | 1 | 474 | RR | 1.46 [0.84, 2.54] | Not applicable | ||
| LOS | Omeprazole | 2 | 353 | MD | 0.13 [‐0.35, 0.62] | No (P = 0.85; I² = 0%) | P = 0.42 |
| Pantoprazole | 3 | 242 | MD | 0.16 [‐0.46, 0.79] | No (P = 0.54; I² = 0%) | ||
| Either omeprazole or pantoprazole | 1 | 474 | MD | 0.70 [‐0.03, 1.43] | Not applicable | ||
| Blood transfusions | Omeprazole | 2 | 353 | MD | ‐0.19 [‐0.57, 0.20] | No (P = 0.72; I² = 0%) | P = 0.27 |
| Pantoprazole | 3 | 242 | MD | 0.34 [‐0.43, 1.11] | No (P = 0.93; I² = 0%) | ||
| Either omeprazole or pantoprazole | 1 | 474 | MD | 0.20 [‐0.18, 0.58] | Not applicable | ||
| Analysis 7. High vs. non‐high dose regimen: Subgroup analysis according to ulcer site | |||||||
| Outcome | Subgroup | Studies | Participants | Summary statistic | Effect estimate [95% CI] | Significant heterogeneity: | Test for subgroup differences: |
| Mortality | Gastric ulcer | 1 | 15 | RR | Not estimable | Not applicable | Not applicable |
| Duodenal ulcer | 1 | 13 | RR | Not estimable | Not applicable | ||
| Rebleeding | Gastric ulcer | 2 | 196 | RR | 1.52 [0.66, 3.49] | No (P = 0.71; I² = 0%) | P = 1.00 |
| Duodenal ulcer | 2 | 306 | RR | 1.52 [0.75, 3.07] | No (P = 0.72; I² = 0%) | ||
| Surgery | Gastric ulcer | 1 | 15 | RR | 2.67 [0.13, 56.63] | Not applicable | Not applicable |
| Duodenal ulcer | 1 | 13 | RR | Not estimable | Not applicable | ||
| Analysis 8. Sensitivity analysis: High vs. low dose regimen | |||||||
| Outcome | Studies | Participants | Summary statistic | Effect estimate [95% CI] | Significant heterogeneity: Yes or No (P value: I2) | ||
| Mortality | 4 | 835 | RR | 0.96 [0.43, 2.18] | No (P = 0.87; I² = 0%) | ||
| Rebleeding | 5 | 867 | RR | 1.22 [0.82, 1.82] | No (P = 0.72; I² = 0%) | ||
| Surgery | 3 | 677 | RR | 1.41 [0.51, 3.95] | No (P = 0.76; I² = 0%) | ||
| Analysis 9. Sensitivity analysis: High vs. medium dose regimen | |||||||
| Outcome | Studies | Participants | Summary statistic | Effect estimate [95% CI] | Significant heterogeneity: Yes or No (P value: I2) | ||
| Mortality | 8 | 832 | RR | 0.74 [0.33, 1.68] | No (P = 0.45; I² = 0%) | ||
| Rebleeding | 9 | 868 | RR | 1.30 [0.89, 1.90] | No (P = 0.93; I² = 0%) | ||
| Surgery | 6 | 593 | RR | 1.24 [0.43, 3.57] | No (P = 0.85; I² = 0%) | ||
| Analysis 10. Sensitivity analysis: Medium vs. low dose regimen | |||||||
| Outcome | Studies | Participants | Summary statistic | Effect estimate [95% CI] | Significant heterogeneity: Yes or No (P value: I2) | ||
| Mortality | 3 | 275 | RR | 0.42 [0.06, 2.80] | No (P = 0.81; I² = 0%) | ||
| Rebleeding | 5 | 320 | RR | 0.69 [0.33, 1.43] | No (P = 0.28; I² = 21%) | ||
| Surgery | 3 | 249 | RR | 0.48 [0.09, 2.55] | No (P = 0.96; I² = 0%) | ||
| Analysis 11. Sensitivity analysis: Non‐low (high or medium) dose vs. low dose regimen | |||||||
| Outcome | Studies | Participants | Summary statistic | Effect estimate [95% CI] | Significant heterogeneity: Yes or No (P value: I2) | ||
| Mortality | 4 | 835 | RR | 0.96 [0.43, 2.18] | No (P = 0.87; I² = 0%) | ||
| Rebleeding | 6 | 917 | RR | 1.22 [0.82, 1.82] | No (P = 0.47; I² = 0%) | ||
| Surgery | 4 | 702 | RR | 1.51 [0.57, 4.01] | No (P = 0.87; I² = 0%) | ||
| Analysis 12. Sensitivity analysis: High vs. non‐high dose regimen, restricted to patients with high risk SRH | |||||||
| Outcome | Subgroup | Studies | Participants | Summary statistic | Effect estimate [95% CI] | Significant heterogeneity: Yes or No (P value: I2) | Test for subgroup differences (P value) |
| Mortality | All patients with HR SRH received initial EHT | 3 | 292 | RR | 1.10 [0.26, 4.67] | No (P = 0.42; I² = 0%) | Not applicable |
| Not all patients with HR SRH received initial EHT | 1 | 14 | RR | Not estimable | Not applicable | ||
| Rebleeding | All patients with HR SRH received initial EHT | 4 | 655 | RR | 1.24 [0.79, 1.94] | No (P = 0.85; I² = 0%) | P = 0.64 |
| Not all patients with HR SRH received initial EHT | 2 | 96 | RR | 1.75 [0.45, 6.85] | Not applicable | ||
| Surgery | All patients with HR SRH received initial EHT | 2 | 134 | RR | 1.02 [0.15, 6.96] | 1.02 [0.15, 6.96] | Not applicable |
| Not all patients with HR SRH received initial EHT | 1 | 14 | RR | Not estimable | Not applicable | ||
| Analysis 13. Post hoc analysis: Studies that compared at least two PPI regimens with different 72‐hour cumulative dose (highest vs. lowest dose) | |||||||
| Outcome | Studies | Participants | Summary statistic | Effect estimate [95% CI] | Significant heterogeneity: Yes or No (P value: I2) | ||
| Mortality | 18 | 2197 | RR | 0.79 [0.47, 1.36] | No (P = 0.86; I² = 0%) | ||
| Rebleeding | 21 | 2338 | RR | 1.02 [0.81, 1.29] | No (P = 0.67; I² = 0%) | ||
| Surgery | 16 | 1884 | RR | 1.22 [0.64, 2.30] | No (P = 0.98; I² = 0%) | ||
| Further EHT | 11 | 1352 | RR | 1.02 [0.74, 1.42] | No (P = 0.78; I² = 0%) | ||
| LOS | 11 | 1503 | MD | 0.06 [‐0.28, 0.40] | No (P = 0.33; I² = 12%) | ||
| Blood transfusions | 9 | 1425 | MD | 0.23 [‐0.25, 0.71] | Yes (P = 0.04; I² = 50%) | ||
| Analysis 14. Post hoc analysis: Studies that compared at least two PPI regimens with different 72‐hour cumulative dose (highest vs. lowest dose), restricted to patients with high risk SRH | |||||||
| Outcome | Subgroup | Studies | Participants | Summary statistic | Effect estimate [95% CI] | Significant heterogeneity: Yes or No (P value: I2) | Test for subgroup differences (P value) |
| Mortality | All patients with HR SRH received initial EHT | 4 | 359 | RR | 0.88 [0.24, 3.28] | No (P = 0.52; I² = 0%) | Not applicable |
| Not all patients with HR SRH received initial EHT | 1 | 14 | RR | Not estimable | Not applicable | ||
| Rebleeding | All patients with HR SRH received initial EHT | 8 | 919 | RR | 0.97 [0.68, 1.39] | No (P = 0.40; I² = 4%) | P = 0.51 |
| Not all patients with HR SRH received initial EHT | 3 | 122 | RR | 1.43 [0.48, 4.24] | No (P = 0.63; I² = 0%) | ||
| Surgery | All patients with HR SRH received initial EHT | 4 | 357 | RR | 0.66 [0.19, 2.34] | No (P = 0.84; I² = 0%) | Not applicable |
| Not all patients with HR SRH received initial EHT | 2 | 40 | RR | Not estimable | Not applicable | ||
| Analysis 15. Post hoc analysis: Comparison of regimens with the same 72‐hour cumulative dose, but different route or frequency | |||||||
| Outcome | Studies | Participants | Summary statistic | Effect estimate [95% CI] | Significant heterogeneity: Yes or No (P value: I2) | ||
| Rebleeding | 1 | 22 | RR | 0.30 [0.04, 2.27] | Not applicable | ||
| Analysis 16. Post hoc analysis: IV vs. PO regimen | |||||||
| Outcome | Studies | Participants | Summary statistic | Effect estimate [95% CI] | Significant heterogeneity: Yes or No (P value: I2) | ||
| Mortality | 4 | 429 | RR | 0.77 [0.21, 2.79] | No (P = 0.65; I² = 0%) | ||
| Rebleeding | 5 | 516 | RR | 1.08 [0.63, 1.84] | No (P = 0.70; I² = 0%) | ||
| Surgery | 5 | 516 | RR | 1.13 [0.31, 4.11] | No (P = 0.67; I² = 0%) | ||
| Further EHT | 3 | 268 | RR | 1.10 [0.57, 2.11] | No (P = 0.57; I² = 0%) | ||
| LOS | 3 | 392 | MD | 0.09 [‐0.46, 0.63] | No (P = 0.55; I² = 0%) | ||
| Blood transfusions | 3 | 392 | MD | ‐0.18 [‐0.56, 0.20] | No (P = 0.89; I² = 0%) | ||
| Outcome | Number of included studies | Covariate | Univariate meta‐regression | Multivariate meta‐regression: P | |
| Coefficient (95% CI) | P | ||||
| Mortality | 6 | Dose ratio | 0.04 (‐0.26 to 0.33) | 0.759 | 0.995 |
| Geographical location | ‐0.40 (‐2.24 to 1.43) | 0.575 | 0.643 | ||
| Route for lower dose | ‐0.68 (‐3.42 to 2.06) | 0.529 | 0.406 | ||
| Rebleeding | 11 | Dose ratio | 0.01 (‐0.14 to 0.15) | 0.997 | 1.000 |
| Geographical location | ‐0.02 (‐0.77 to 0.74) | 0.959 | 1.000 | ||
| Route for lower dose | 0.04 (‐1.38 to 1.46) | 0.948 | 0.999 | ||
| Surgery | 5 | Dose ratio | ‐0.01 (‐0.38 to 0.37) | 0.956 | 1.000 |
| Geographical location | ‐0.51 (‐.3.78 to 1.75) | 0.651 | 0.621 | ||
| Route for lower dose | 0.01 (‐3.31 to 3.32) | 0.998 | 1.000 | ||
| Dose ratio: ratio of higher dose to lower dose Geographical location: Asia vs. elsewhere Route for lower dose: intravenous or oral | |||||
| Outcome or subgroup title | No. of studies | No. of participants | Statistical method | Effect size |
| 1 Mortality Show forest plot | 12 | 1667 | Odds Ratio (M‐H, Random, 95% CI) | 0.85 [0.47, 1.54] |
| 2 Rebleeding Show forest plot | 13 | 1716 | Risk Ratio (M‐H, Random, 95% CI) | 1.27 [0.96, 1.67] |
| 3 Surgery Show forest plot | 9 | 1270 | Risk Ratio (M‐H, Random, 95% CI) | 1.33 [0.63, 2.77] |
| 4 Further EHT Show forest plot | 6 | 902 | Risk Ratio (M‐H, Random, 95% CI) | 1.39 [0.88, 2.18] |
| 5 Length of hospital stay Show forest plot | 6 | 1069 | Mean Difference (IV, Random, 95% CI) | 0.26 [‐0.08, 0.60] |
| 6 Blood transfusions Show forest plot | 6 | 1069 | Mean Difference (IV, Random, 95% CI) | 0.05 [‐0.21, 0.30] |
| Outcome or subgroup title | No. of studies | No. of participants | Statistical method | Effect size |
| 1 Mortality Show forest plot | 12 | 1667 | Risk Ratio (M‐H, Random, 95% CI) | 0.85 [0.48, 1.51] |
| 1.1 Risk of bias: Unclear | 5 | 1041 | Risk Ratio (M‐H, Random, 95% CI) | 1.05 [0.50, 2.20] |
| 1.2 Risk of bias: High | 7 | 626 | Risk Ratio (M‐H, Random, 95% CI) | 0.61 [0.24, 1.52] |
| 2 Rebleeding Show forest plot | 13 | 1716 | Risk Ratio (M‐H, Random, 95% CI) | 1.27 [0.96, 1.67] |
| 2.1 Risk of bias: Unclear | 5 | 1037 | Risk Ratio (M‐H, Random, 95% CI) | 1.26 [0.89, 1.76] |
| 2.2 Risk of bias: High | 8 | 679 | Risk Ratio (M‐H, Random, 95% CI) | 1.29 [0.80, 2.07] |
| 3 Surgery Show forest plot | 9 | 1270 | Risk Ratio (M‐H, Random, 95% CI) | 1.33 [0.63, 2.77] |
| 3.1 Risk of bias: Unclear | 4 | 944 | Risk Ratio (M‐H, Random, 95% CI) | 1.35 [0.58, 3.14] |
| 3.2 Risk of bias: High | 5 | 326 | Risk Ratio (M‐H, Random, 95% CI) | 1.26 [0.28, 5.73] |
| 4 Further EHT Show forest plot | 6 | 902 | Risk Ratio (M‐H, Random, 95% CI) | 1.39 [0.88, 2.18] |
| 4.1 RIsk of bias: Unclear | 3 | 713 | Risk Ratio (M‐H, Random, 95% CI) | 1.39 [0.86, 2.25] |
| 4.2 Risk of bias: High | 3 | 189 | Risk Ratio (M‐H, Random, 95% CI) | 1.35 [0.36, 5.07] |
| 5 LOS Show forest plot | 6 | 1069 | Mean Difference (IV, Random, 95% CI) | 0.26 [‐0.08, 0.60] |
| 5.1 Risk of bias: Unclear | 4 | 924 | Mean Difference (IV, Random, 95% CI) | 0.28 [‐0.07, 0.63] |
| 5.2 Risk of bias: High | 2 | 145 | Mean Difference (IV, Random, 95% CI) | 0.10 [‐1.60, 1.80] |
| 6 Blood transfusions Show forest plot | 6 | 1069 | Mean Difference (IV, Random, 95% CI) | 0.05 [‐0.21, 0.30] |
| 6.1 Risk of bias: Unclear | 4 | 924 | Mean Difference (IV, Random, 95% CI) | 0.05 [‐0.21, 0.30] |
| 6.2 Risk of bias: High | 2 | 145 | Mean Difference (IV, Random, 95% CI) | 0.10 [‐1.60, 1.80] |
| Outcome or subgroup title | No. of studies | No. of participants | Statistical method | Effect size |
| 1 Mortality Show forest plot | 12 | 1667 | Risk Ratio (M‐H, Random, 95% CI) | 0.85 [0.48, 1.51] |
| 1.1 Asian | 7 | 807 | Risk Ratio (M‐H, Random, 95% CI) | 0.74 [0.33, 1.68] |
| 1.2 Others | 5 | 860 | Risk Ratio (M‐H, Random, 95% CI) | 0.96 [0.43, 2.18] |
| 2 Rebleeding Show forest plot | 13 | 1716 | Risk Ratio (M‐H, Random, 95% CI) | 1.27 [0.96, 1.67] |
| 2.1 Asian | 8 | 864 | Risk Ratio (M‐H, Random, 95% CI) | 1.24 [0.85, 1.80] |
| 2.2 Others | 5 | 852 | Risk Ratio (M‐H, Random, 95% CI) | 1.31 [0.87, 1.96] |
| 3 Surgery Show forest plot | 9 | 1270 | Risk Ratio (M‐H, Random, 95% CI) | 1.33 [0.63, 2.77] |
| 3.1 Asian | 5 | 568 | Risk Ratio (M‐H, Random, 95% CI) | 1.12 [0.36, 3.44] |
| 3.2 Others | 4 | 702 | Risk Ratio (M‐H, Random, 95% CI) | 1.51 [0.57, 4.01] |
| 4 Further EHT Show forest plot | 6 | 902 | Risk Ratio (M‐H, Random, 95% CI) | 1.39 [0.88, 2.18] |
| 4.1 Asian | 3 | 261 | Risk Ratio (M‐H, Random, 95% CI) | 1.16 [0.41, 3.27] |
| 4.2 Others | 3 | 641 | Risk Ratio (M‐H, Random, 95% CI) | 1.44 [0.87, 2.39] |
| 5 LOS Show forest plot | 6 | 1069 | Mean Difference (IV, Random, 95% CI) | 0.26 [‐0.08, 0.60] |
| 5.1 Asian | 3 | 428 | Mean Difference (IV, Random, 95% CI) | 0.10 [‐0.33, 0.54] |
| 5.2 Others | 3 | 641 | Mean Difference (IV, Random, 95% CI) | 0.52 [‐0.03, 1.07] |
| 6 Blood transfusions Show forest plot | 6 | 1069 | Mean Difference (IV, Random, 95% CI) | 0.05 [‐0.21, 0.30] |
| 6.1 Asian | 3 | 428 | Mean Difference (IV, Random, 95% CI) | ‐0.10 [‐0.45, 0.26] |
| 6.2 Others | 3 | 641 | Mean Difference (IV, Random, 95% CI) | 0.20 [‐0.17, 0.57] |
| Outcome or subgroup title | No. of studies | No. of participants | Statistical method | Effect size |
| 1 Mortality Show forest plot | 12 | 1667 | Risk Ratio (M‐H, Random, 95% CI) | 0.85 [0.48, 1.51] |
| 1.1 Intravenous | 9 | 1394 | Risk Ratio (M‐H, Random, 95% CI) | 0.84 [0.45, 1.56] |
| 1.2 Oral | 3 | 273 | Risk Ratio (M‐H, Random, 95% CI) | 0.92 [0.20, 4.28] |
| 2 Rebleeding Show forest plot | 13 | 1716 | Risk Ratio (M‐H, Random, 95% CI) | 1.27 [0.96, 1.67] |
| 2.1 Intravenous | 10 | 1443 | Risk Ratio (M‐H, Random, 95% CI) | 1.24 [0.93, 1.65] |
| 2.2 Oral | 3 | 273 | Risk Ratio (M‐H, Random, 95% CI) | 1.64 [0.61, 4.40] |
| 3 Surgery Show forest plot | 9 | 1270 | Risk Ratio (M‐H, Random, 95% CI) | 1.33 [0.63, 2.77] |
| 3.1 Intravenous | 6 | 997 | Risk Ratio (M‐H, Random, 95% CI) | 1.26 [0.54, 2.91] |
| 3.2 Oral | 3 | 273 | Risk Ratio (M‐H, Random, 95% CI) | 1.59 [0.34, 7.40] |
| 4 Further EHT Show forest plot | 6 | 902 | Risk Ratio (M‐H, Random, 95% CI) | 1.39 [0.88, 2.18] |
| 4.1 Intravenous | 5 | 877 | Risk Ratio (M‐H, Random, 95% CI) | 1.35 [0.85, 2.13] |
| 4.2 Oral | 1 | 25 | Risk Ratio (M‐H, Random, 95% CI) | 4.64 [0.25, 87.91] |
| 5 LOS Show forest plot | 6 | 1069 | Mean Difference (IV, Random, 95% CI) | 0.26 [‐0.08, 0.60] |
| 5.1 Intravenous | 4 | 833 | Mean Difference (IV, Random, 95% CI) | 0.32 [‐0.10, 0.74] |
| 5.2 Oral | 2 | 236 | Mean Difference (IV, Random, 95% CI) | 0.15 [‐0.43, 0.73] |
| 6 Blood transfusions Show forest plot | 6 | 1069 | Mean Difference (IV, Random, 95% CI) | 0.05 [‐0.21, 0.30] |
| 6.1 Intravenous | 4 | 833 | Mean Difference (IV, Random, 95% CI) | 0.22 [‐0.11, 0.56] |
| 6.2 Oral | 2 | 236 | Mean Difference (IV, Random, 95% CI) | ‐0.19 [‐0.57, 0.20] |
| Outcome or subgroup title | No. of studies | No. of participants | Statistical method | Effect size |
| 1 Mortality Show forest plot | 9 | 1394 | Risk Ratio (M‐H, Random, 95% CI) | 0.84 [0.45, 1.56] |
| 1.1 Bolus | 7 | 1155 | Risk Ratio (M‐H, Random, 95% CI) | 1.15 [0.53, 2.47] |
| 1.2 Infusion | 2 | 239 | Risk Ratio (M‐H, Random, 95% CI) | 0.45 [0.16, 1.32] |
| 2 Rebleeding Show forest plot | 10 | 1443 | Risk Ratio (M‐H, Random, 95% CI) | 1.24 [0.93, 1.65] |
| 2.1 Bolus | 8 | 1178 | Risk Ratio (M‐H, Random, 95% CI) | 1.24 [0.86, 1.77] |
| 2.2 Infusion | 3 | 265 | Risk Ratio (M‐H, Random, 95% CI) | 1.26 [0.75, 2.13] |
| 3 Surgery Show forest plot | 6 | 997 | Risk Ratio (M‐H, Random, 95% CI) | 1.26 [0.54, 2.91] |
| 3.1 Bolus | 6 | 997 | Risk Ratio (M‐H, Random, 95% CI) | 1.26 [0.54, 2.91] |
| 3.2 Infusion | 0 | 0 | Risk Ratio (M‐H, Random, 95% CI) | 0.0 [0.0, 0.0] |
| 4 Further EHT Show forest plot | 5 | 877 | Risk Ratio (M‐H, Random, 95% CI) | 1.34 [0.85, 2.12] |
| 4.1 Bolus | 5 | 847 | Risk Ratio (M‐H, Random, 95% CI) | 1.34 [0.85, 2.12] |
| 4.2 Infusion | 1 | 30 | Risk Ratio (M‐H, Random, 95% CI) | 0.0 [0.0, 0.0] |
| 5 LOS Show forest plot | 4 | 833 | Mean Difference (IV, Random, 95% CI) | 0.32 [‐0.10, 0.74] |
| 5.1 Bolus | 4 | 833 | Mean Difference (IV, Random, 95% CI) | 0.32 [‐0.10, 0.74] |
| 5.2 Infusion | 0 | 0 | Mean Difference (IV, Random, 95% CI) | 0.0 [0.0, 0.0] |
| 6 Blood transfusions Show forest plot | 4 | 833 | Mean Difference (IV, Random, 95% CI) | 0.22 [‐0.11, 0.56] |
| 6.1 Bolus | 4 | 833 | Mean Difference (IV, Random, 95% CI) | 0.22 [‐0.11, 0.56] |
| 6.2 Infusion | 0 | 0 | Mean Difference (IV, Random, 95% CI) | 0.0 [0.0, 0.0] |
| Outcome or subgroup title | No. of studies | No. of participants | Statistical method | Effect size |
| 1 Mortality Show forest plot | 12 | 1667 | Risk Ratio (M‐H, Random, 95% CI) | 0.85 [0.48, 1.51] |
| 1.1 Omeprazole | 4 | 612 | Risk Ratio (M‐H, Random, 95% CI) | 0.63 [0.29, 1.37] |
| 1.2 Pantoprazole | 7 | 581 | Risk Ratio (M‐H, Random, 95% CI) | 1.49 [0.44, 5.01] |
| 1.3 Either omeprazole or pantoprazole | 1 | 474 | Risk Ratio (M‐H, Random, 95% CI) | 0.99 [0.29, 3.38] |
| 2 Rebleeding Show forest plot | 13 | 1716 | Risk Ratio (M‐H, Random, 95% CI) | 1.27 [0.96, 1.67] |
| 2.1 Omeprazole | 4 | 608 | Risk Ratio (M‐H, Random, 95% CI) | 1.25 [0.83, 1.87] |
| 2.2 Pantoprazole | 8 | 634 | Risk Ratio (M‐H, Random, 95% CI) | 1.15 [0.69, 1.93] |
| 2.3 Either omeprazole or pantoprazole | 1 | 474 | Risk Ratio (M‐H, Random, 95% CI) | 1.46 [0.84, 2.54] |
| 3 Surgery Show forest plot | 9 | 1270 | Risk Ratio (M‐H, Random, 95% CI) | 1.33 [0.63, 2.77] |
| 3.1 Omeprazole | 2 | 373 | Risk Ratio (M‐H, Random, 95% CI) | 1.23 [0.44, 3.48] |
| 3.2 Pantoprazole | 6 | 423 | Risk Ratio (M‐H, Random, 95% CI) | 1.17 [0.36, 3.82] |
| 3.3 Either omeprazole or pantoprazole | 1 | 474 | Risk Ratio (M‐H, Random, 95% CI) | 2.97 [0.31, 28.39] |
| 4 Further EHT Show forest plot | 6 | 902 | Risk Ratio (M‐H, Random, 95% CI) | 1.39 [0.88, 2.18] |
| 4.1 Omeprazole | 1 | 142 | Risk Ratio (M‐H, Random, 95% CI) | 1.06 [0.28, 4.07] |
| 4.2 Pantoprazole | 4 | 286 | Risk Ratio (M‐H, Random, 95% CI) | 1.35 [0.51, 3.59] |
| 4.3 Either omeprazole or pantoprazole | 1 | 474 | Risk Ratio (M‐H, Random, 95% CI) | 1.46 [0.84, 2.54] |
| 5 LOS Show forest plot | 6 | 1069 | Mean Difference (IV, Random, 95% CI) | 0.26 [‐0.08, 0.60] |
| 5.1 Omeprazole | 2 | 353 | Mean Difference (IV, Random, 95% CI) | 0.13 [‐0.35, 0.62] |
| 5.2 Pantoprazole | 3 | 242 | Mean Difference (IV, Random, 95% CI) | 0.16 [‐0.46, 0.79] |
| 5.3 Either omeprazole or pantoprazole | 1 | 474 | Mean Difference (IV, Random, 95% CI) | 0.70 [‐0.03, 1.43] |
| 6 Blood transfusions Show forest plot | 6 | 1069 | Mean Difference (IV, Random, 95% CI) | 0.05 [‐0.21, 0.30] |
| 6.1 Omeprazole | 2 | 353 | Mean Difference (IV, Random, 95% CI) | ‐0.19 [‐0.57, 0.20] |
| 6.2 Pantoprazole | 3 | 242 | Mean Difference (IV, Random, 95% CI) | 0.34 [‐0.43, 1.11] |
| 6.3 Either omeprazole or pantoprazole | 1 | 474 | Mean Difference (IV, Random, 95% CI) | 0.20 [‐0.18, 0.58] |
| Outcome or subgroup title | No. of studies | No. of participants | Statistical method | Effect size |
| 1 Mortality Show forest plot | 1 | 28 | Risk Ratio (M‐H, Random, 95% CI) | 0.0 [0.0, 0.0] |
| 1.1 Gastric ulcer | 1 | 15 | Risk Ratio (M‐H, Random, 95% CI) | 0.0 [0.0, 0.0] |
| 1.2 Duodenal ulcer | 1 | 13 | Risk Ratio (M‐H, Random, 95% CI) | 0.0 [0.0, 0.0] |
| 2 Rebleeding Show forest plot | 2 | 502 | Risk Ratio (M‐H, Random, 95% CI) | 1.52 [0.89, 2.60] |
| 2.1 Gastric Ulcer | 2 | 196 | Risk Ratio (M‐H, Random, 95% CI) | 1.52 [0.66, 3.49] |
| 2.2 Duodenal Ulcer | 2 | 306 | Risk Ratio (M‐H, Random, 95% CI) | 1.52 [0.75, 3.07] |
| 3 Surgery Show forest plot | 1 | 28 | Risk Ratio (M‐H, Random, 95% CI) | 2.67 [0.13, 56.63] |
| 3.1 Gastric ulcer | 1 | 15 | Risk Ratio (M‐H, Random, 95% CI) | 2.67 [0.13, 56.63] |
| 3.2 Duodenal ulcer | 1 | 13 | Risk Ratio (M‐H, Random, 95% CI) | 0.0 [0.0, 0.0] |
| Outcome or subgroup title | No. of studies | No. of participants | Statistical method | Effect size |
| 1 Mortality Show forest plot | 4 | 835 | Risk Ratio (M‐H, Random, 95% CI) | 0.96 [0.43, 2.18] |
| 2 Rebleeding Show forest plot | 5 | 867 | Risk Ratio (M‐H, Random, 95% CI) | 1.22 [0.82, 1.82] |
| 3 Surgery Show forest plot | 3 | 677 | Risk Ratio (M‐H, Random, 95% CI) | 1.41 [0.51, 3.95] |
| Outcome or subgroup title | No. of studies | No. of participants | Statistical method | Effect size |
| 1 Mortality Show forest plot | 8 | 832 | Risk Ratio (M‐H, Random, 95% CI) | 0.74 [0.33, 1.68] |
| 2 Rebleeding Show forest plot | 9 | 868 | Risk Ratio (M‐H, Random, 95% CI) | 1.30 [0.89, 1.90] |
| 3 Surgery Show forest plot | 6 | 593 | Risk Ratio (M‐H, Random, 95% CI) | 1.24 [0.43, 3.57] |
| Outcome or subgroup title | No. of studies | No. of participants | Statistical method | Effect size |
| 1 Mortality Show forest plot | 3 | 275 | Risk Ratio (M‐H, Random, 95% CI) | 0.42 [0.06, 2.80] |
| 2 Rebleeding Show forest plot | 5 | 320 | Risk Ratio (M‐H, Random, 95% CI) | 0.69 [0.33, 1.43] |
| 3 Surgery Show forest plot | 3 | 249 | Risk Ratio (M‐H, Random, 95% CI) | 0.48 [0.09, 2.55] |
| Outcome or subgroup title | No. of studies | No. of participants | Statistical method | Effect size |
| 1 Mortality Show forest plot | 4 | 835 | Risk Ratio (M‐H, Random, 95% CI) | 0.96 [0.43, 2.18] |
| 2 Rebleeding Show forest plot | 6 | 917 | Risk Ratio (M‐H, Random, 95% CI) | 1.22 [0.82, 1.82] |
| 3 Surgery Show forest plot | 4 | 702 | Risk Ratio (M‐H, Random, 95% CI) | 1.51 [0.57, 4.01] |
| Outcome or subgroup title | No. of studies | No. of participants | Statistical method | Effect size |
| 1 Mortality Show forest plot | 4 | 306 | Odds Ratio (M‐H, Random, 95% CI) | 1.11 [0.25, 4.91] |
| 1.1 All patients with HR SRH received initial EHT | 3 | 292 | Odds Ratio (M‐H, Random, 95% CI) | 1.11 [0.25, 4.91] |
| 1.2 Not all patients with HR SRH received initial EHT | 1 | 14 | Odds Ratio (M‐H, Random, 95% CI) | 0.0 [0.0, 0.0] |
| 2 Rebleeding Show forest plot | 6 | 751 | Risk Ratio (M‐H, Random, 95% CI) | 1.28 [0.84, 1.97] |
| 2.1 All patients with HR SRH received initial EHT | 4 | 655 | Risk Ratio (M‐H, Random, 95% CI) | 1.24 [0.79, 1.94] |
| 2.2 Not all patients with HR SRH received initial EHT | 2 | 96 | Risk Ratio (M‐H, Random, 95% CI) | 1.75 [0.45, 6.85] |
| 3 Surgery Show forest plot | 3 | 148 | Risk Difference (M‐H, Random, 95% CI) | 0.00 [‐0.06, 0.06] |
| 3.1 All patients with HR SRH received initial EHT | 2 | 134 | Risk Difference (M‐H, Random, 95% CI) | 0.00 [‐0.06, 0.06] |
| 3.2 Not all patients with HR SRH received initial EHT | 1 | 14 | Risk Difference (M‐H, Random, 95% CI) | 0.0 [‐0.24, 0.24] |
| Outcome or subgroup title | No. of studies | No. of participants | Statistical method | Effect size |
| 1 Mortality Show forest plot | 18 | 2197 | Risk Ratio (M‐H, Random, 95% CI) | 0.79 [0.47, 1.36] |
| 2 Rebleeding Show forest plot | 21 | 2338 | Risk Ratio (M‐H, Random, 95% CI) | 1.02 [0.81, 1.29] |
| 3 Surgery Show forest plot | 16 | 1884 | Risk Ratio (M‐H, Random, 95% CI) | 1.22 [0.64, 2.30] |
| 4 Further EHT Show forest plot | 11 | 1352 | Risk Ratio (M‐H, Random, 95% CI) | 1.02 [0.74, 1.42] |
| 5 LOS Show forest plot | 11 | 1570 | Mean Difference (IV, Random, 95% CI) | ‐0.41 [‐1.09, 0.27] |
| 6 Blood transfusions Show forest plot | 9 | 1425 | Mean Difference (IV, Random, 95% CI) | 0.23 [‐0.25, 0.71] |
| Outcome or subgroup title | No. of studies | No. of participants | Statistical method | Effect size |
| 1 Mortality Show forest plot | 5 | 373 | Risk Ratio (M‐H, Random, 95% CI) | 0.88 [0.24, 3.28] |
| 1.1 All patients with HR SRH received initial EHT | 4 | 359 | Risk Ratio (M‐H, Random, 95% CI) | 0.88 [0.24, 3.28] |
| 1.2 Not all patients with HR SRH received initial EHT | 1 | 14 | Risk Ratio (M‐H, Random, 95% CI) | 0.0 [0.0, 0.0] |
| 2 Rebleeding Show forest plot | 11 | 1041 | Risk Ratio (M‐H, Random, 95% CI) | 1.01 [0.73, 1.41] |
| 2.1 All patients with HR SRH received initial EHT | 8 | 919 | Risk Ratio (M‐H, Random, 95% CI) | 0.97 [0.68, 1.39] |
| 2.2 Not all patients with HR SRH received initial EHT | 3 | 122 | Risk Ratio (M‐H, Random, 95% CI) | 1.43 [0.48, 4.24] |
| 3 Surgery Show forest plot | 6 | 397 | Risk Ratio (M‐H, Random, 95% CI) | 0.66 [0.19, 2.34] |
| 3.1 All patients with HR SRH received initial EHT | 4 | 357 | Risk Ratio (M‐H, Random, 95% CI) | 0.66 [0.19, 2.34] |
| 3.2 Not all patients with HR SRH received initial EHT | 2 | 40 | Risk Ratio (M‐H, Random, 95% CI) | 0.0 [0.0, 0.0] |
| Outcome or subgroup title | No. of studies | No. of participants | Statistical method | Effect size |
| 1 Rebleeding Show forest plot | 1 | 22 | Risk Ratio (M‐H, Random, 95% CI) | 0.30 [0.04, 2.27] |
| Outcome or subgroup title | No. of studies | No. of participants | Statistical method | Effect size |
| 1 Mortality Show forest plot | 4 | 429 | Risk Ratio (M‐H, Random, 95% CI) | 0.77 [0.21, 2.79] |
| 2 Rebleeding Show forest plot | 5 | 516 | Risk Ratio (M‐H, Random, 95% CI) | 1.08 [0.63, 1.84] |
| 3 Surgery Show forest plot | 5 | 516 | Risk Ratio (M‐H, Random, 95% CI) | 1.13 [0.31, 4.11] |
| 4 Further EHT Show forest plot | 3 | 268 | Risk Ratio (M‐H, Random, 95% CI) | 1.10 [0.57, 2.11] |
| 5 LOS Show forest plot | 3 | 392 | Mean Difference (IV, Random, 95% CI) | 0.09 [‐0.46, 0.63] |
| 6 Blood transfusions Show forest plot | 3 | 392 | Mean Difference (IV, Random, 95% CI) | ‐0.18 [‐0.56, 0.20] |