| Analysis 2. High vs. non‐high dose regimen: Subgroup analysis according to risk of bias |
| Outcome | Subgroup | Studies | Participants | Summary statistic | Effect estimate [95% CI] | Significant heterogeneity:
Yes or No (P value; I²) | Test for subgroup differences:
P value |
| Mortality | Unclear | 5 | 1041 | RR | 1.05 [0.50, 2.20] | No (P = 0.84; I² = 0%) | P = 0.36 |
| High | 7 | 626 | RR | 0.61 [0.24, 1.52] | No (P = 0.84; I² = 0%) |
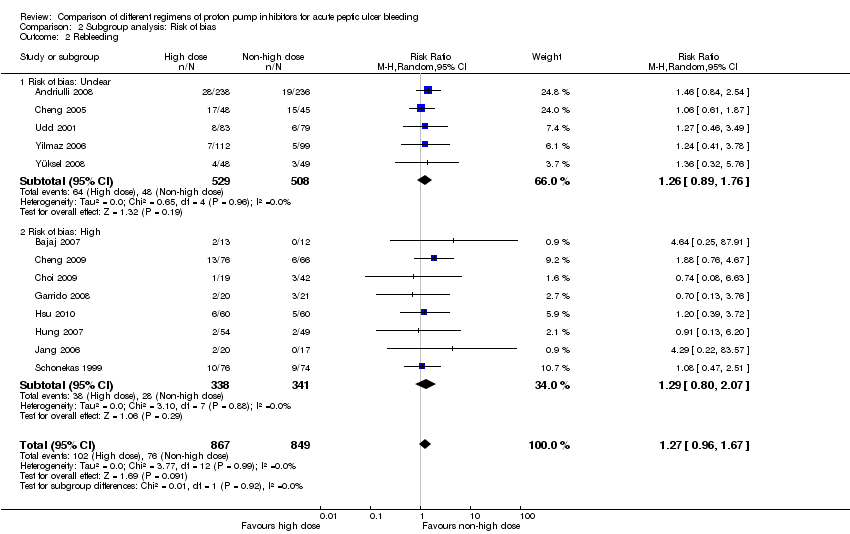
| Rebleeding | Unclear | 13 | 1037 | RR | 1.26 [0.89, 1.76] | No (P = 0.96; I² = 0%) | P = 0.92 |
| High | 5 | 679 | RR | 1.29 [0.80, 2.07] | No (P = 0.88; I² = 0%) |
| Surgery | Unclear | 4 | 944 | RR | 1.35 [0.58, 3.14] | No (P = 0.90; I² = 0%) | P = 0.94 |
| High | 5 | 326 | RR | 1.26 [0.28, 5.73] | No (P = 0.72; I² = 0%) |
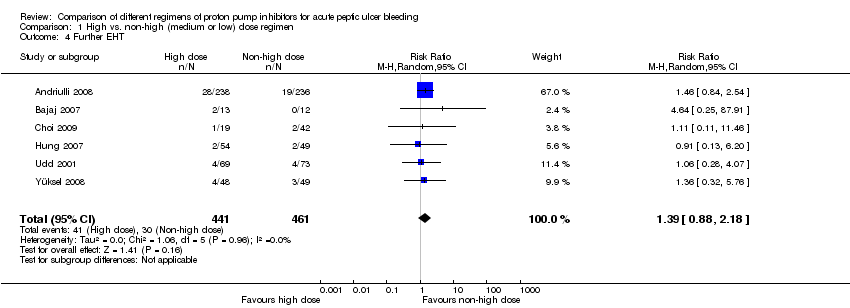
| Further EHT | Unclear | 3 | 713 | RR | 1.39 [0.86, 2.25] | No (P = 0.91; I² = 0%) | P = 0.96 |
| High | 3 | 189 | RR | 1.35 [0.36, 5.07] | No (P = 0.64; I² = 0%) |
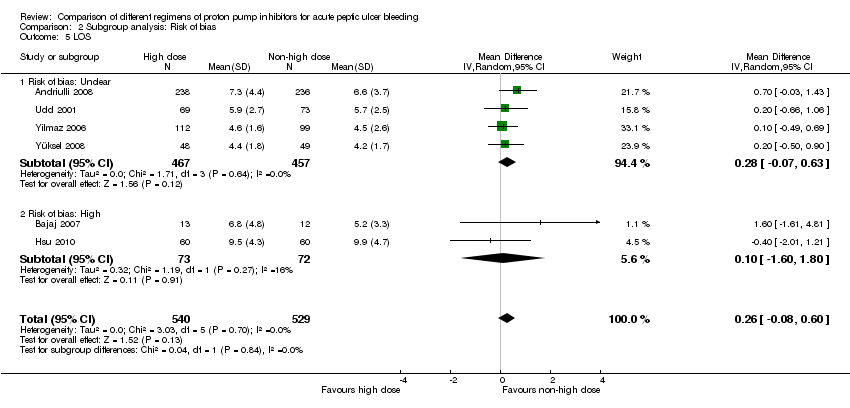
| LOS | Unclear | 4 | 924 | MD | 0.28 [‐0.07, 0.63] | No (P = 0.64; I² = 0%) | P = 0.84 |
| High | 2 | 145 | MD | 0.10 [‐1.60, 1.80] | No (P = 0.27; I² = 16%) |
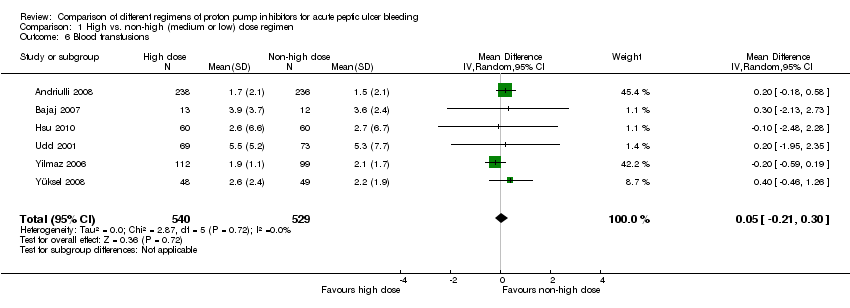
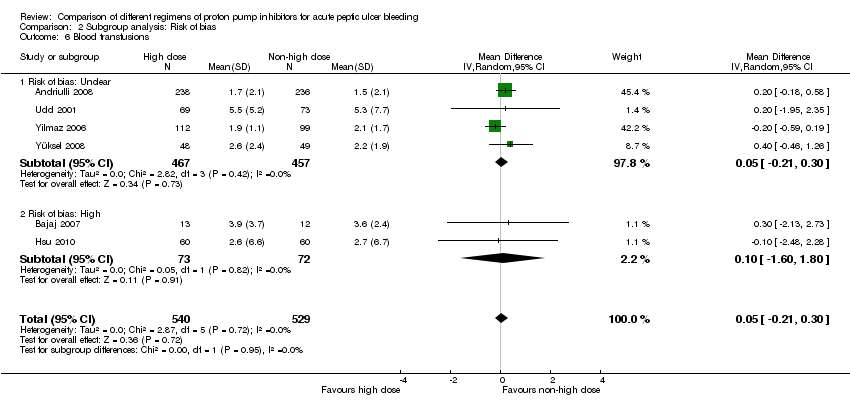
| Blood transfusions | Unclear | 4 | 924 | MD | 0.05 [‐0.21, 0.30] | No (P = 0.42; I² = 0%) | P = 0.95 |
| High | 2 | 145 | MD | 0.10 [‐1.60, 1.80] | No (P = 0.82; I² = 0%) |
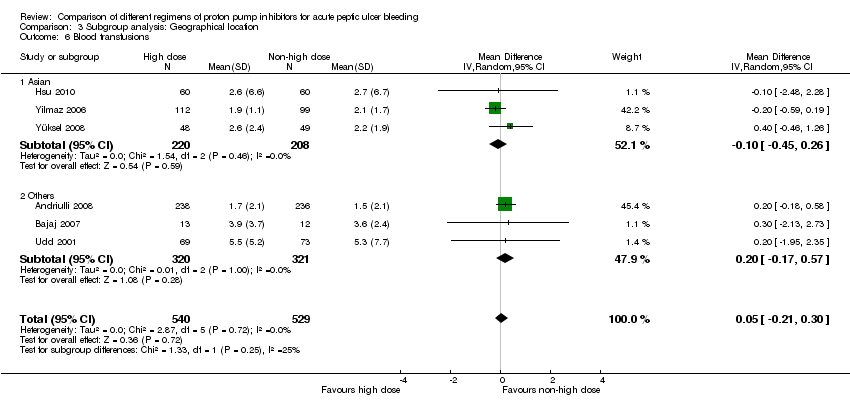
| Analysis 3. High vs. non‐high dose regimen: Subgroup analysis according to geographical location |
| Outcome | Subgroup | Studies | Participants | Summary statistic | Effect estimate [95% CI] | Significant heterogeneity:
Yes or No (P value; I²) | Test for subgroup differences:
P value |
| Mortality | Asian studies | 7 | 807 | RR | 0.74 [0.33, 1.68] | No (P = 0.45; I² = 0%) | P = 0.66 |
| Other | 5 | 860 | RR | 0.96 [0.43, 2.18] | No (P = 0.87; I² = 0%) |
| Rebleeding | Asian studies | 8 | 864 | RR | 1.24 [0.85, 1.80] | No (P = 0.95; I² = 0%) | P = 0.85 |
| Other | 5 | 852 | RR | 1.31 [0.87, 1.96] | No (P = 0.81; I² = 0%) |
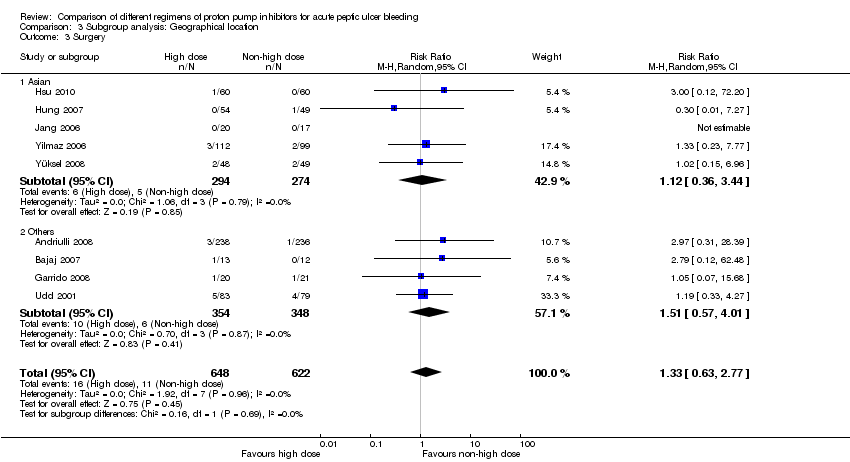
| Surgery | Asian studies | 5 | 568 | RR | 1.12 [0.36, 3.44] | No (P = 0.79; I² = 0%) | P = 0.69 |
| Other | 4 | 702 | RR | 1.51 [0.57, 4.01] | No (P = 0.87; I² = 0%) |
| Further EHT | Asian studies | 3 | 261 | RR | 1.16 [0.41, 3.27] | No (P = 0.95; I² = 0%) | P = 0.71 |
| Other | 3 | 641 | RR | 1.44 [0.87, 2.39] | No (P = 0.67; I² = 0%) |
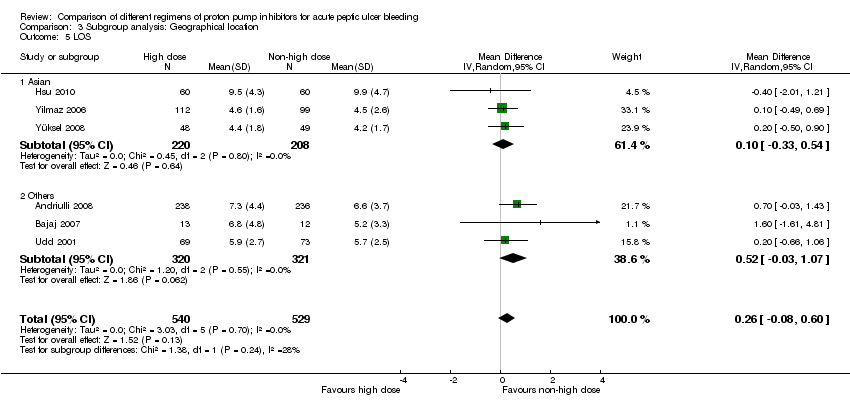
| LOS | Asian studies | 3 | 428 | MD | 0.10 [‐0.33, 0.54] | No (P = 0.80; I² = 0%) | P = 0.24 |
| Other | 3 | 641 | MD | 0.52 [‐0.03, 1.07] | No (P = 0.55; I² = 0%) |
| Blood transfusions | Asian studies | 3 | 428 | MD | ‐0.10 [‐0.45, 0.26] | No (P = 0.46; I² = 0%) | P = 0.25 |
| Other | 3 | 641 | MD | 0.20 [‐0.17, 0.57] | No (P = 1.00; I² = 0%) |
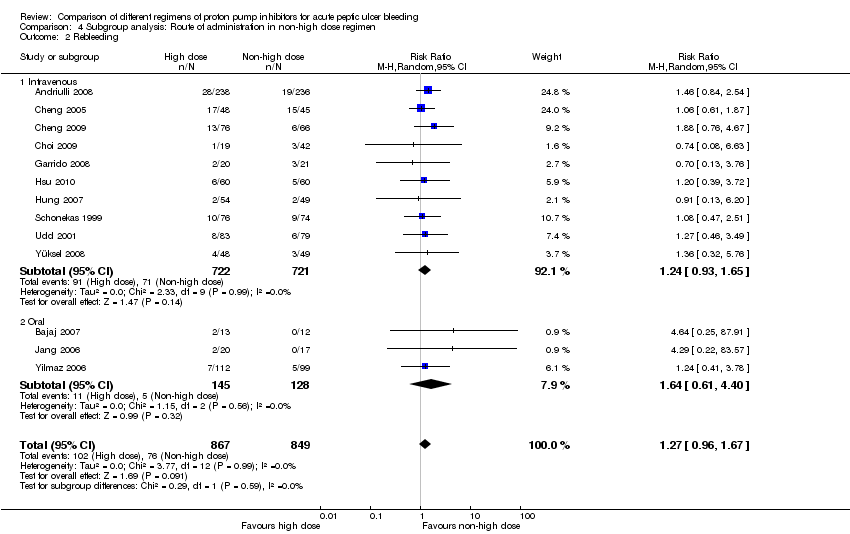
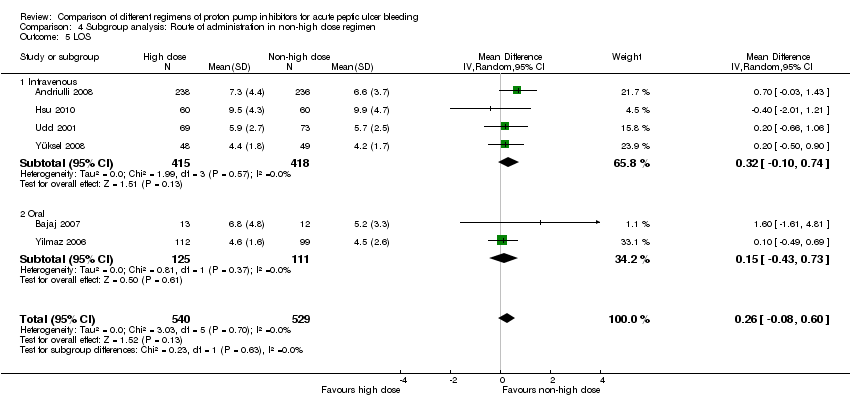
| Analysis 4. High vs. non‐high dose regimen: Subgroup analysis according to route of administration for the non‐high dose regimen |
| Outcome | Subgroup | Studies | Participants | Summary statistic | Effect estimate [95% CI] | Significant heterogeneity:
Yes or No (P value; I²) | Test for subgroup differences:
P value |
| Mortality | IV | 9 | 1394 | RR | 0.84 [0.45, 1.56] | No (P = 0.67; I² = 0%) | P = 0.92 |
| PO | 3 | 273 | RR | 0.92 [0.20, 4.28] | No (P = 0.40; I² = 0%) |
| Rebleeding | IV | 10 | 1443 | RR | 1.24 [0.93, 1.65] | No (P = 0.99; I² = 0%) | P = 0.59 |
| PO | 3 | 273 | RR | 1.64 [0.61, 4.40] | No (P = 0.56; I² = 0%) |
| Surgery | IV | 6 | 997 | RR | 1.26 [0.54, 2.91] | No (P = 0.89; I² = 0%) | P = 0.79 |
| PO | 3 | 273 | RR | 1.59 [0.34, 7.40] | No (P = 0.68; I² = 0%) |
| Further EHT | IV | 5 | 877 | RR | 1.35 [0.85, 2.13] | No (P = 0.98; I² = 0%) | P = 0.41 |
| PO | 1 | 25 | RR | 4.64 [0.25, 87.91] | No (P = 0.96; I² = 0%) |
| LOS | IV | 4 | 833 | MD | 0.32 [‐0.10, 0.74] | No (P = 0.57; I² = 0)% | P = 0.63 |
| PO | 2 | 236 | MD | 0.15 [‐0.43, 0.73] | No (P = 0.37; I² = 0%) |
| Blood transfusions | IV | 4 | 833 | MD | 0.22 [‐0.11, 0.56] | No (P = 0.97; I² = 0%) | P = 0.12 |
| PO | 2 | 236 | MD | ‐0.19 [‐0.57, 0.20] | No (P = 0.69; I² = 0%) |
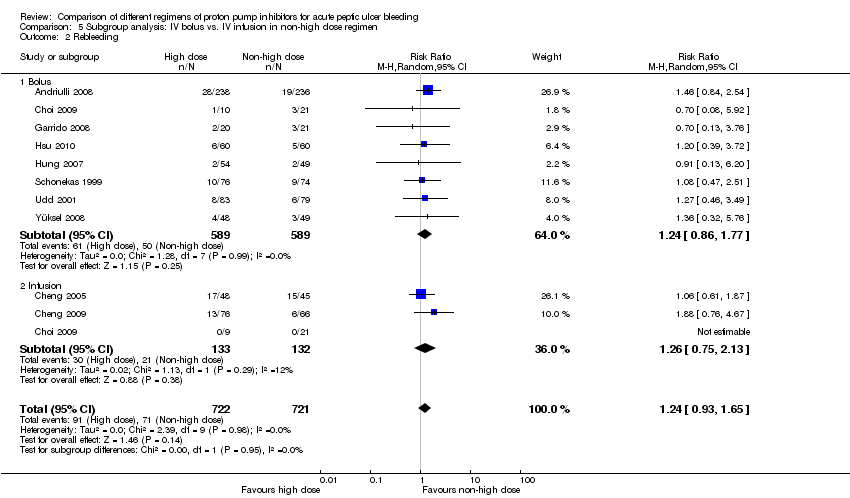
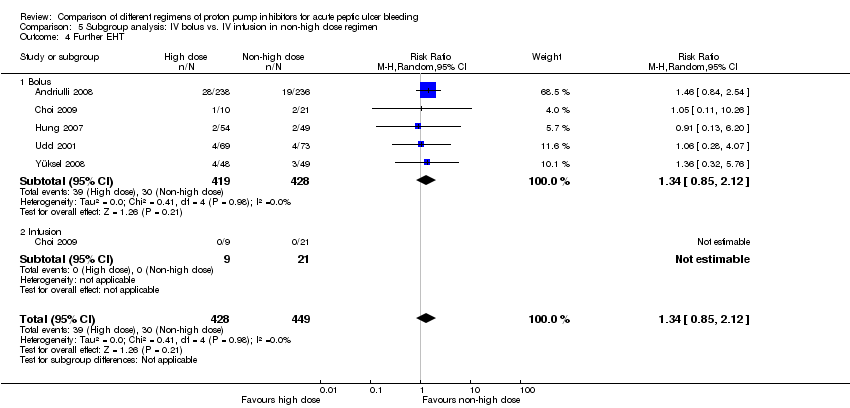
| Analysis 5. High vs. non‐high dose regimen: Subgroup analysis according to whether in non‐high dose regimen PPI was administered as IV bolus or IV infusion |
| Outcome | Subgroup | Studies | Participants | Summary statistic | Effect estimate [95% CI] | Significant heterogeneity:
Yes or No (P value; I²) | Test for subgroup differences:
P value |
| Mortality | Bolus | 7 | 1155 | RR | 1.15 [0.53, 2.47] | No (P = 0.82; I² = 0%) | P = 0.16 |
| Infusion | 2 | 239 | RR | 0.45 [0.16, 1.32] | No (P = 0.37; I² = 0%) |
| Rebleeding | Bolus | 8 | 1178 | RR | 1.24 [0.86, 1.77] | No (P = 0.99; I² = 0%) | P = 0.95 |
| Infusion | 3 | 265 | RR | 1.26 [0.75, 2.13] | No (P = 0.29; I² = 12%) |
| Surgery | Bolus | 6 | 997 | RR | 1.26 [0.54, 2.91] | No (P = 0.89; I² = 0%) | Not applicable |
| Infusion | 0 | 0 | RR | Not estimable | Not applicable |
| Further EHT | Bolus | 5 | 847 | RR | 1.34 [0.85, 2.12] | No (P = 0.98; I² = 0%) | Not applicable |
| Infusion | 1 | 30 | RR | Not estimable | Not applicable |
| LOS | Bolus | 4 | 833 | MD | 0.32 [‐0.10, 0.74] | No (P = 0.57; I² = 0%) | Not applicable |
| Infusion | 0 | 0 | MD | Not estimable | Not applicable |
| Blood transfusions | Bolus | 4 | 833 | MD | 0.22 [‐0.11, 0.56] | No (P = 0.97; I² = 0%) | Not applicable |
| Infusion | 0 | 0 | MD | Not estimable | Not applicable |
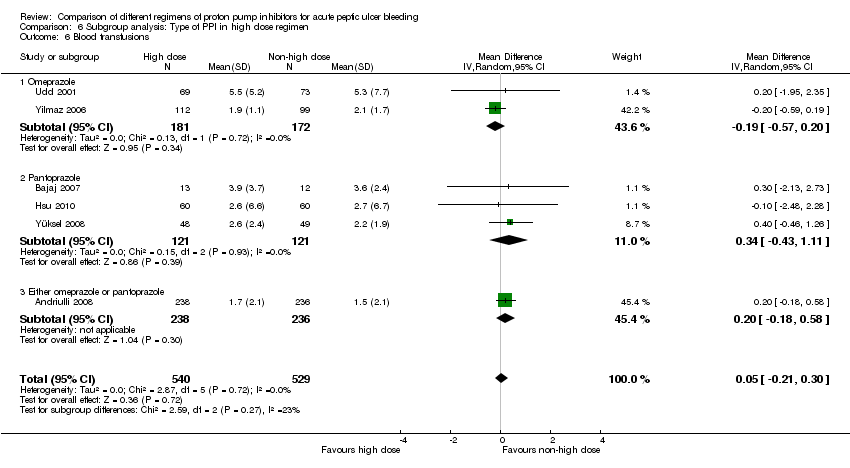
| Analysis 6. High vs. non‐high dose regimen: Subgroup analysis according to type of PPI in high dose regimen |
| Outcome | Subgroup | Studies | Participants | Summary statistic | Effect estimate [95% CI] | Significant heterogeneity:
Yes or No (P value; I²) | Test for subgroup differences:
P value |
| Mortality | Omeprazole | 4 | 612 | RR | 0.63 [0.29, 1.37] | No (P = 0.60; I² = 0%) | P = 0.49 |
| Pantoprazole | 7 | 581 | RR | 1.49 [0.44, 5.01] | No (P = 0.68; I² = 0%) |
| Either omeprazole or pantoprazole | 1 | 474 | RR | 0.99 [0.29, 3.38] | Not applicable |
| Rebleeding | Omeprazole | 4 | 608 | RR | 1.25 [0.83, 1.87] | No (P = 0.60; I² = 0%) | P = 0.49 |
| Pantoprazole | 8 | 634 | RR | 1.15 [0.69, 1.93] | No (P = 0.68; I² = 0%) |
| Either omeprazole or pantoprazole | 1 | 474 | RR | 1.46 [0.84, 2.54] | Not applicable |
| Surgery | Omeprazole | 2 | 373 | RR | 1.23 [0.44, 3.48] | No (P = 0.92; I² = 0%) | P = 0.76 |
| Pantoprazole | 6 | 423 | RR | 1.17 [0.36, 3.82] | No (P = 0.85; I² = 0%) |
| Either omeprazole or pantoprazole | 1 | 474 | RR | 2.97 [0.31, 28.39] | Not applicable |
| Further EHT | Omeprazole | 1 | 142 | RR | 1.06 [0.28, 4.07] | Not applicable | P = 0.91 |
| Pantoprazole | 4 | 286 | RR | 1.35 [0.51, 3.59] | No (P = 0.83; I² = 0%) |
| Either omeprazole or pantoprazole | 1 | 474 | RR | 1.46 [0.84, 2.54] | Not applicable |
| LOS | Omeprazole | 2 | 353 | MD | 0.13 [‐0.35, 0.62] | No (P = 0.85; I² = 0%) | P = 0.42 |
| Pantoprazole | 3 | 242 | MD | 0.16 [‐0.46, 0.79] | No (P = 0.54; I² = 0%) |
| Either omeprazole or pantoprazole | 1 | 474 | MD | 0.70 [‐0.03, 1.43] | Not applicable |
| Blood transfusions | Omeprazole | 2 | 353 | MD | ‐0.19 [‐0.57, 0.20] | No (P = 0.72; I² = 0%) | P = 0.27 |
| Pantoprazole | 3 | 242 | MD | 0.34 [‐0.43, 1.11] | No (P = 0.93; I² = 0%) |
| Either omeprazole or pantoprazole | 1 | 474 | MD | 0.20 [‐0.18, 0.58] | Not applicable |
| Analysis 7. High vs. non‐high dose regimen: Subgroup analysis according to ulcer site |
| Outcome | Subgroup | Studies | Participants | Summary statistic | Effect estimate [95% CI] | Significant heterogeneity:
Yes or No (P value; I²) | Test for subgroup differences:
P value |
| Mortality | Gastric ulcer | 1 | 15 | RR | Not estimable | Not applicable | Not applicable |
| Duodenal ulcer | 1 | 13 | RR | Not estimable | Not applicable |
| Rebleeding | Gastric ulcer | 2 | 196 | RR | 1.52 [0.66, 3.49] | No (P = 0.71; I² = 0%) | P = 1.00 |
| Duodenal ulcer | 2 | 306 | RR | 1.52 [0.75, 3.07] | No (P = 0.72; I² = 0%) |
| Surgery | Gastric ulcer | 1 | 15 | RR | 2.67 [0.13, 56.63] | Not applicable | Not applicable |
| Duodenal ulcer | 1 | 13 | RR | Not estimable | Not applicable |
| Analysis 8. Sensitivity analysis: High vs. low dose regimen |
| Outcome | Studies | Participants | Summary statistic | Effect estimate [95% CI] | Significant heterogeneity: Yes or No (P value: I2) |
| Mortality | 4 | 835 | RR | 0.96 [0.43, 2.18] | No (P = 0.87; I² = 0%) |
| Rebleeding | 5 | 867 | RR | 1.22 [0.82, 1.82] | No (P = 0.72; I² = 0%) |
| Surgery | 3 | 677 | RR | 1.41 [0.51, 3.95] | No (P = 0.76; I² = 0%) |
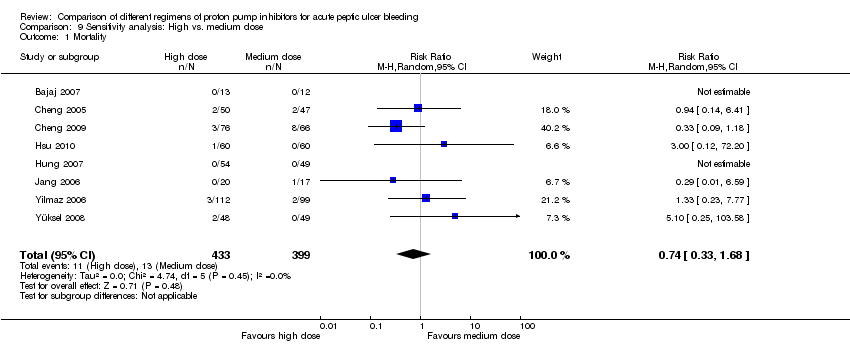
| Analysis 9. Sensitivity analysis: High vs. medium dose regimen |
| Outcome | Studies | Participants | Summary statistic | Effect estimate [95% CI] | Significant heterogeneity: Yes or No (P value: I2) |
| Mortality | 8 | 832 | RR | 0.74 [0.33, 1.68] | No (P = 0.45; I² = 0%) |
| Rebleeding | 9 | 868 | RR | 1.30 [0.89, 1.90] | No (P = 0.93; I² = 0%) |
| Surgery | 6 | 593 | RR | 1.24 [0.43, 3.57] | No (P = 0.85; I² = 0%) |
| Analysis 10. Sensitivity analysis: Medium vs. low dose regimen |
| Outcome | Studies | Participants | Summary statistic | Effect estimate [95% CI] | Significant heterogeneity: Yes or No (P value: I2) |
| Mortality | 3 | 275 | RR | 0.42 [0.06, 2.80] | No (P = 0.81; I² = 0%) |
| Rebleeding | 5 | 320 | RR | 0.69 [0.33, 1.43] | No (P = 0.28; I² = 21%) |
| Surgery | 3 | 249 | RR | 0.48 [0.09, 2.55] | No (P = 0.96; I² = 0%) |
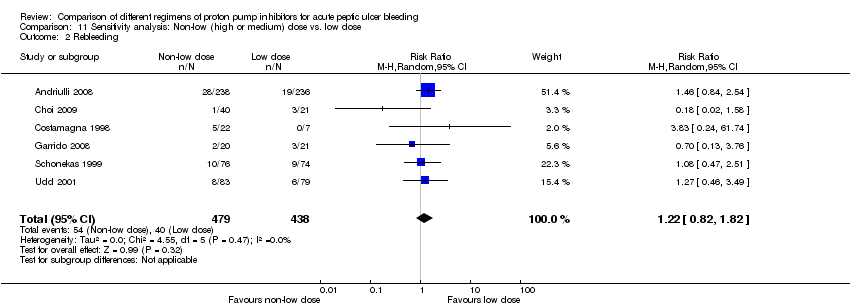
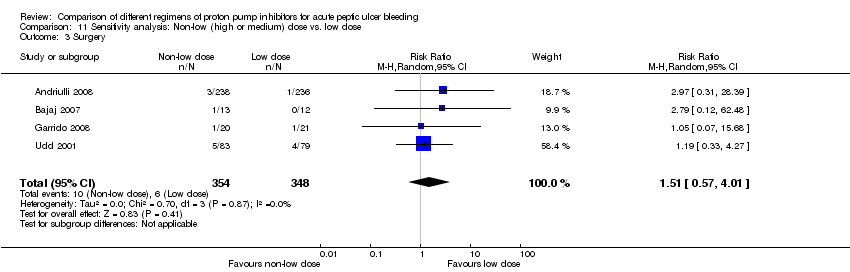
| Analysis 11. Sensitivity analysis: Non‐low (high or medium) dose vs. low dose regimen |
| Outcome | Studies | Participants | Summary statistic | Effect estimate [95% CI] | Significant heterogeneity: Yes or No (P value: I2) |
| Mortality | 4 | 835 | RR | 0.96 [0.43, 2.18] | No (P = 0.87; I² = 0%) |
| Rebleeding | 6 | 917 | RR | 1.22 [0.82, 1.82] | No (P = 0.47; I² = 0%) |
| Surgery | 4 | 702 | RR | 1.51 [0.57, 4.01] | No (P = 0.87; I² = 0%) |
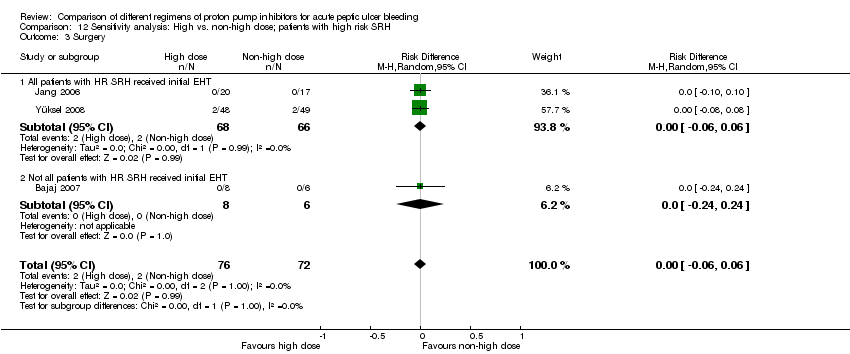
| Analysis 12. Sensitivity analysis: High vs. non‐high dose regimen, restricted to patients with high risk SRH |
| Outcome | Subgroup | Studies | Participants | Summary statistic | Effect estimate [95% CI] | Significant heterogeneity: Yes or No (P value: I2) | Test for subgroup differences (P value) |
| Mortality | All patients with HR SRH received initial EHT | 3 | 292 | RR | 1.10 [0.26, 4.67] | No (P = 0.42; I² = 0%) | Not applicable |
| Not all patients with HR SRH received initial EHT | 1 | 14 | RR | Not estimable | Not applicable |
| Rebleeding | All patients with HR SRH received initial EHT | 4 | 655 | RR | 1.24 [0.79, 1.94] | No (P = 0.85; I² = 0%) | P = 0.64 |
| Not all patients with HR SRH received initial EHT | 2 | 96 | RR | 1.75 [0.45, 6.85] | Not applicable |
| Surgery | All patients with HR SRH received initial EHT | 2 | 134 | RR | 1.02 [0.15, 6.96] | 1.02 [0.15, 6.96] | Not applicable |
| Not all patients with HR SRH received initial EHT | 1 | 14 | RR | Not estimable | Not applicable |
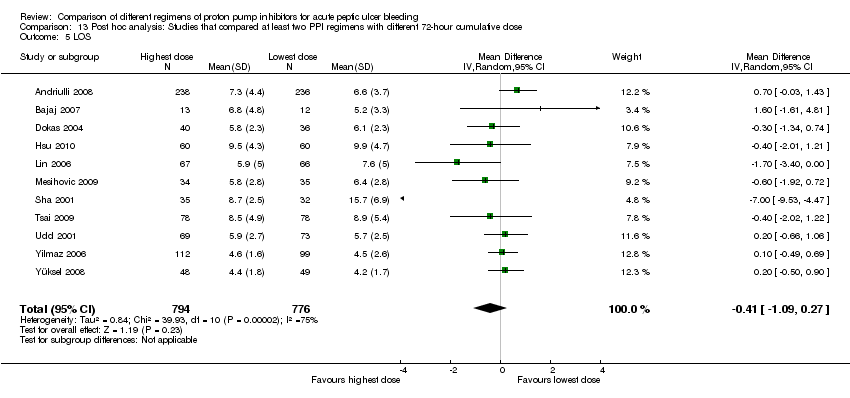
| Analysis 13. Post hoc analysis: Studies that compared at least two PPI regimens with different 72‐hour cumulative dose (highest vs. lowest dose) |
| Outcome | Studies | Participants | Summary statistic | Effect estimate [95% CI] | Significant heterogeneity: Yes or No (P value: I2) |
| Mortality | 18 | 2197 | RR | 0.79 [0.47, 1.36] | No (P = 0.86; I² = 0%) |
| Rebleeding | 21 | 2338 | RR | 1.02 [0.81, 1.29] | No (P = 0.67; I² = 0%) |
| Surgery | 16 | 1884 | RR | 1.22 [0.64, 2.30] | No (P = 0.98; I² = 0%) |
| Further EHT | 11 | 1352 | RR | 1.02 [0.74, 1.42] | No (P = 0.78; I² = 0%) |
| LOS | 11 | 1503 | MD | 0.06 [‐0.28, 0.40] | No (P = 0.33; I² = 12%) |
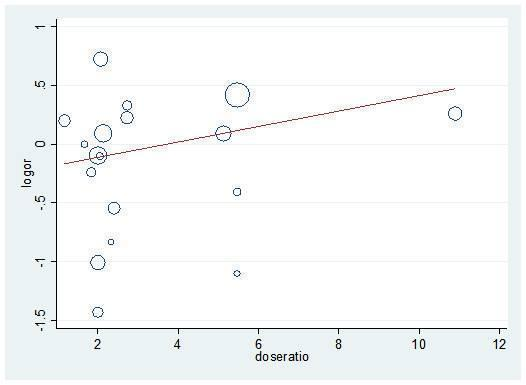
| Blood transfusions | 9 | 1425 | MD | 0.23 [‐0.25, 0.71] | Yes (P = 0.04; I² = 50%) |
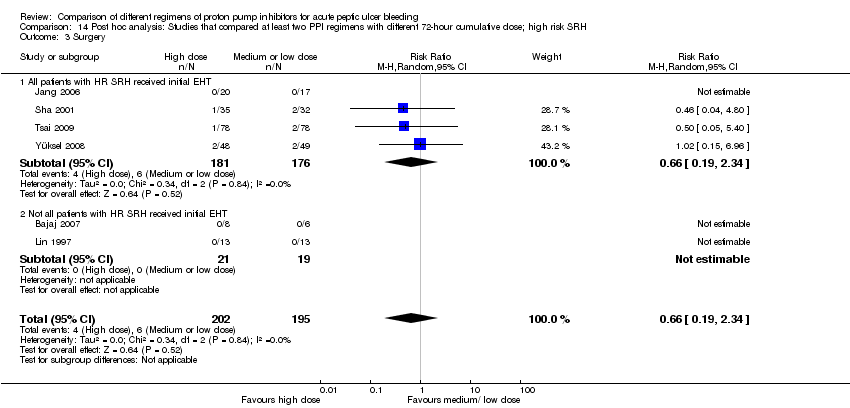
| Analysis 14. Post hoc analysis: Studies that compared at least two PPI regimens with different 72‐hour cumulative dose (highest vs. lowest dose), restricted to patients with high risk SRH |
| Outcome | Subgroup | Studies | Participants | Summary statistic | Effect estimate [95% CI] | Significant heterogeneity: Yes or No (P value: I2) | Test for subgroup differences (P value) |
| Mortality | All patients with HR SRH received initial EHT | 4 | 359 | RR | 0.88 [0.24, 3.28] | No (P = 0.52; I² = 0%) | Not applicable |
| Not all patients with HR SRH received initial EHT | 1 | 14 | RR | Not estimable | Not applicable |
| Rebleeding | All patients with HR SRH received initial EHT | 8 | 919 | RR | 0.97 [0.68, 1.39] | No (P = 0.40; I² = 4%) | P = 0.51 |
| Not all patients with HR SRH received initial EHT | 3 | 122 | RR | 1.43 [0.48, 4.24] | No (P = 0.63; I² = 0%) |
| Surgery | All patients with HR SRH received initial EHT | 4 | 357 | RR | 0.66 [0.19, 2.34] | No (P = 0.84; I² = 0%) | Not applicable |
| Not all patients with HR SRH received initial EHT | 2 | 40 | RR | Not estimable | Not applicable |
| Analysis 15. Post hoc analysis: Comparison of regimens with the same 72‐hour cumulative dose, but different route or frequency |
| Outcome | Studies | Participants | Summary statistic | Effect estimate [95% CI] | Significant heterogeneity: Yes or No (P value: I2) |
| Rebleeding | 1 | 22 | RR | 0.30 [0.04, 2.27] | Not applicable |
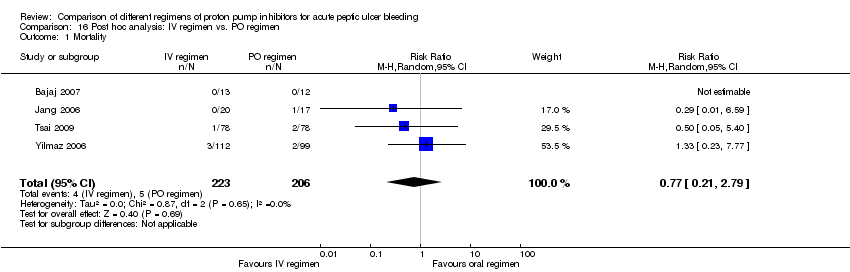
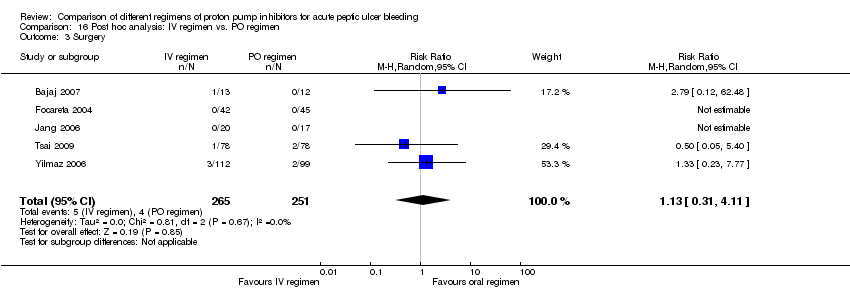
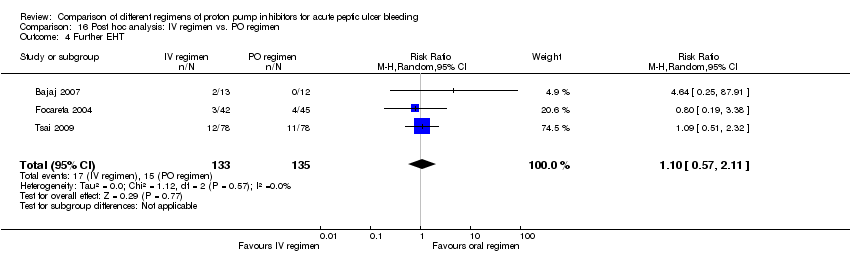
| Analysis 16. Post hoc analysis: IV vs. PO regimen |
| Outcome | Studies | Participants | Summary statistic | Effect estimate [95% CI] | Significant heterogeneity: Yes or No (P value: I2) |
| Mortality | 4 | 429 | RR | 0.77 [0.21, 2.79] | No (P = 0.65; I² = 0%) |
| Rebleeding | 5 | 516 | RR | 1.08 [0.63, 1.84] | No (P = 0.70; I² = 0%) |
| Surgery | 5 | 516 | RR | 1.13 [0.31, 4.11] | No (P = 0.67; I² = 0%) |
| Further EHT | 3 | 268 | RR | 1.10 [0.57, 2.11] | No (P = 0.57; I² = 0%) |
| LOS | 3 | 392 | MD | 0.09 [‐0.46, 0.63] | No (P = 0.55; I² = 0%) |
| Blood transfusions | 3 | 392 | MD | ‐0.18 [‐0.56, 0.20] | No (P = 0.89; I² = 0%) |