Agentes aumentadores de volumen inyectables perianales como tratamiento para la incontinencia fecal en adultos
Información
- DOI:
- https://doi.org/10.1002/14651858.CD007959.pub3Copiar DOI

- Base de datos:
-
- Cochrane Database of Systematic Reviews
- Versión publicada:
-
- 28 febrero 2013see what's new
- Tipo:
-
- Intervention
- Etapa:
-
- Review
- Grupo Editorial Cochrane:
-
Grupo Cochrane de Incontinencia
- Copyright:
-
- Copyright © 2013 The Cochrane Collaboration. Published by John Wiley & Sons, Ltd.
Cifras del artículo
Altmetric:
Citado por:
Autores
Contributions of authors
Yasuko Maeda and Christine Norton examined all the materials derived from the electronic search strategy. Yasuko Maeda and Christine Norton wrote the first draft of the review. Søren Laurberg helped with the design of the protocol, the interpretation of the data, and contributed to the final version of the review.
Sources of support
Internal sources
-
No sources of support supplied
External sources
-
NIHR, UK.
The Cochrane Incontinence Review Group is supported by NIHR UK
Declarations of interest
Yasuko Maeda is an author of a study included in this review.
Acknowledgements
The authors would like to thank Sheila Wallace for her help and advice with the electronic search strategy.
Version history
| Published | Title | Stage | Authors | Version |
| 2013 Feb 28 | Perianal injectable bulking agents as treatment for faecal incontinence in adults | Review | Yasuko Maeda, Søren Laurberg, Christine Norton | |
| 2010 May 12 | Perianal injectable bulking agents as treatment for faecal incontinence in adults | Review | Yasuko Maeda, Søren Laurberg, Christine Norton | |
| 2009 Jul 08 | Perianal injectable bulking agents as treatment for faecal incontinence | Protocol | Yasuko Maeda, Søren Laurberg, Christine S Norton | |
Differences between protocol and review
None
Keywords
MeSH
Medical Subject Headings (MeSH) Keywords
- Acrylic Resins [administration & dosage];
- Administration, Rectal;
- Biocompatible Materials [*administration & dosage, adverse effects];
- Collagen [administration & dosage];
- Dimethylpolysiloxanes [administration & dosage];
- Fecal Incontinence [*therapy];
- Glucans [administration & dosage];
- Hydrogels [administration & dosage];
- Palpation;
- Randomized Controlled Trials as Topic;
- Silicones [administration & dosage];
- Ultrasonography, Interventional;
- Zirconium [administration & dosage];
Medical Subject Headings Check Words
Adult; Humans;

PRISMA study flow diagram,
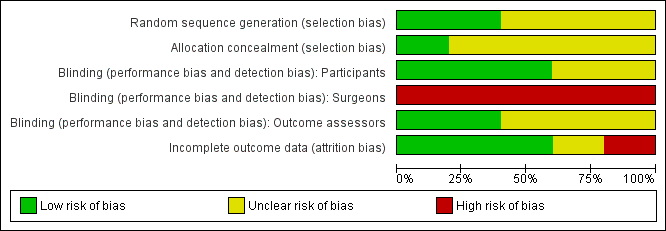
Methodological quality graph: review authors' judgements about each methodological quality item presented as percentages across all included studies.
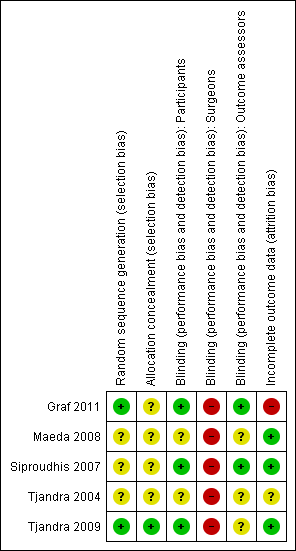
Methodological quality summary: review authors' judgements about each methodological quality item for each included study.

Comparison 1 Injectable versus placebo injection, Outcome 1 Failure (number of participants with Wexner's >8).

Comparison 1 Injectable versus placebo injection, Outcome 2 No improvement (less than 50% reduction in incontinence episodes.
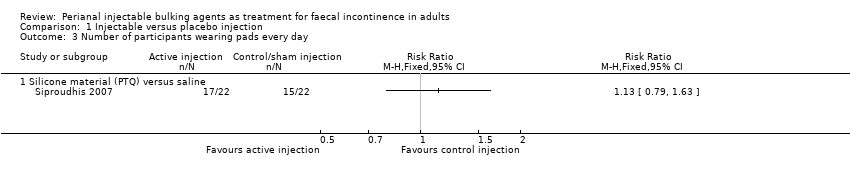
Comparison 1 Injectable versus placebo injection, Outcome 3 Number of participants wearing pads every day.

Comparison 1 Injectable versus placebo injection, Outcome 4 Number of incontinence free days at 6 months.
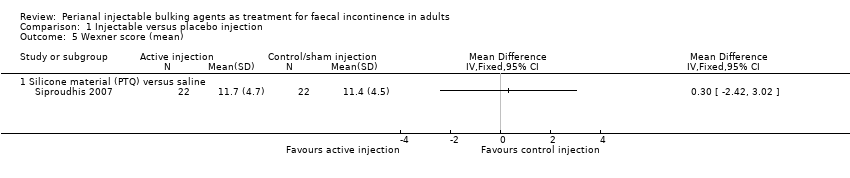
Comparison 1 Injectable versus placebo injection, Outcome 5 Wexner score (mean).

Comparison 1 Injectable versus placebo injection, Outcome 6 Number of adverse effects.

Comparison 1 Injectable versus placebo injection, Outcome 7 Serious adverse effects.

Comparison 1 Injectable versus placebo injection, Outcome 8 Need for re‐treatment at 6 months.

Comparison 2 One injectable material versus another, Outcome 1 Failure (number with worse faecal incontinence).

Comparison 2 One injectable material versus another, Outcome 2 Wexner's incontinence score.
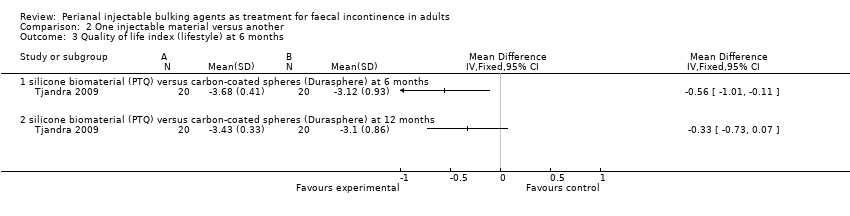
Comparison 2 One injectable material versus another, Outcome 3 Quality of life index (lifestyle) at 6 months.
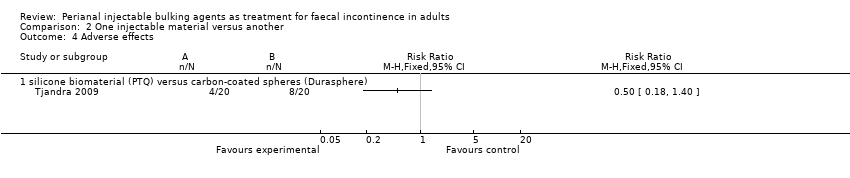
Comparison 2 One injectable material versus another, Outcome 4 Adverse effects.

Comparison 2 One injectable material versus another, Outcome 5 Serious adverse effects.
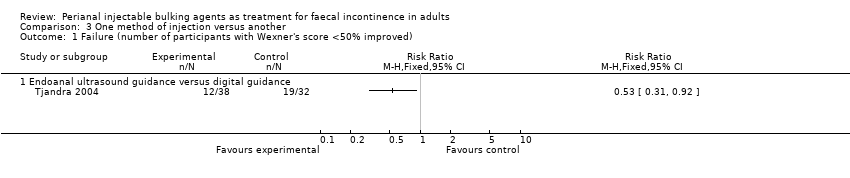
Comparison 3 One method of injection versus another, Outcome 1 Failure (number of participants with Wexner's score <50% improved).

Comparison 3 One method of injection versus another, Outcome 2 Failure (number of participants global Quality of Life score <50% improved).
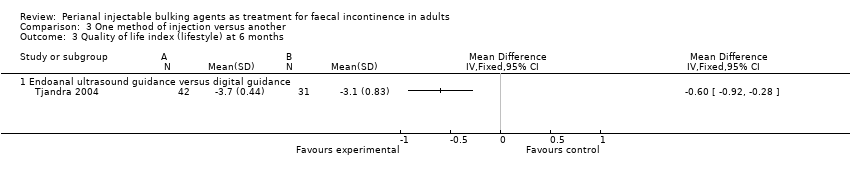
Comparison 3 One method of injection versus another, Outcome 3 Quality of life index (lifestyle) at 6 months.

Comparison 3 One method of injection versus another, Outcome 4 Discomfort at injection site.
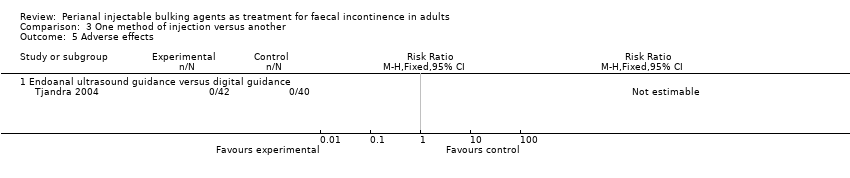
Comparison 3 One method of injection versus another, Outcome 5 Adverse effects.
| Agent | Authors and Year | No of patients | Injection route | Total volume | Complications | Number of adverse effects/Number of participants |
| Autologous fat | 14 | Submucosal | 15‐20ml | Reports that there were no complications | 0/14 | |
| 1 | Perianal | 130ml | Reports that there were no complications | 0/1 | ||
| Bioplastique™/PTQ™ | 10 | Perianal | 5‐11.5ml | 4 anal canal ulcer, 1 injection site pain, 1 leakage of injected material | 6/10 | |
| 82 | Perianal | 10.0ml | 6 minor discomfort at injection site (4: digital guidance group, 2: ultrasound guidance group) | 6/82 | ||
| 7 | Perianal | Not mentioned | Reports that there were no complications | 0/7 | ||
| 20 | Perianal | 7.5ml | Not reported | Not reported | ||
| 6 | Perianal | 7.5ml | 1 recto‐vaginal fistula | 1/6 | ||
| 24 | Perianal | 7.5ml | Not reported | Not reported | ||
| 37 | Not mentioned | Not mentioned | 4 perianal abscess required surgical drainage | 4/37 | ||
| 22 | Perianal | 7.5ml | 6 pain at the implant site, 2 anal inflammation | 8/22 | ||
| 33 | Perianal | 7.5ml | Reports that there were no complications | 0/33 | ||
| 20 | Perianal | 10.0ml | 4 bruising | 4/20 | ||
| 74 | Perianal | 10.0ml | 9 minor complications | 9/74 | ||
| 50 | Perianal | Not mentioned | 2 local giant cell foreign body reaction | 2/50 | ||
| Bulkamid™ | 5 | Perianal | median 9ml (8‐9) | Reports that there were no complications | 0/5 | |
| Coaptite® | 10 | Perianal | 4ml | 1 leakage of Coaptite® | 1/10 | |
| Contigen® | 17 | Submucosal | 2ml | Reports that there were no complications | 0/17 | |
| 73 | Submucosal | 5ml | Not reported | Not reported | ||
| Durasphere®/ACYST‐TM | 7 | Submucosal | average 6.8ml | Not reported | Not reported | |
| 18 | Submucosal | mean 1.28ml at 1‐4 sites | 2 anal discomfort, 1 exacerbation of pruritis ani, 2 passage of injected Durasphere via anus | 5/18 | ||
| 33 | Submucosal | median 8.8ml (2‐19ml) | 2 anal pain, 1 Durasphere® leakage, 2 material migration | 5/33 | ||
| 11 | Perianal | mean 9ml (8‐12ml) | Local pain (most frequent, no numbers reported), 3 passage of Durasphere® | At least 3/11 | ||
| 20 | Submucosal | 10.0ml | 4 bruising, 2 erosion of rectal mucosa, 1 rectal pain, 1 type III hypersensitivity | 8/20 | ||
| Gatekeeper™ (polyacrylonitrile) | 14 | Perianal | 1 cylinder (length 21mm, diameter 1‐2mm)x4 | Reports that there were none. | 0/14 | |
| NASHA™Dx | 4 | Submucosal | 5.6ml | 1 bleeding settled with compression, 1 anal pain, 1 tenesmus. All complications settled within 2‐7 days after procedure. | 3/4 | |
| 34 | Submucosal | 4ml | Pain (26% during 1st injection procedure, 55% for second treatment), 3 suspected inflammation of anal canal, 2 sensation of obstructed defaecation | At least 5/34 | ||
| 136 | Submucosal | 4‐8ml | 128 adverse events in total. Two serious events, one prostatic abscess and one rectal abscess. | 128/136 | ||
| 115 | Submucosal | up to 4ml | 154 adverse events, including 20 serious events such as abscess and haemorrhage | 154 adverse events by 70 patients | ||
| Permacol™ | 7 | Submucosal | Not mentioned | Reports that there were no complications | 0/7 | |
| 5 | Perianal | median 15ml (15‐17.5) | Reports that there were no complications | 0/5 | ||
| Saline | 22 | Perianal | 7.5ml | 2 pain at the implant site | 2/22 | |
| Synthetic collagen | 11 | Submucosal | Not specified | One death unrelated to the treatment | 1/11 | |
| Teflon® | 11 | Submucosal | 10ml | Not reported | Not reported | |
| Urosurge® | 6 | Submucosal | up to 5 balloons | 1 bleeding, 1 lost balloon after 2 months (potential spontaneous burst) | 2/6 | |
| Bioplastique™/PTQ™: Silicone biomaterial Bulkamid™: Hydrogel cross‐linked with polyacrylamide Coaptite®: Calcium hydroxylapatite Contigen®: Synthetic bovine collagen Durasphere®/ACYST‐TM: Carbon‐coated microbeads NASHA™Dx: Stabilized nonanimal hyaluronic acid with dextranomer Permacol™: Porcine dermal collagen Teflon®: Polytetrafluoroethylene Urosurge®: Expandable silicone microballoon | ||||||
| Outcome or subgroup title | No. of studies | No. of participants | Statistical method | Effect size |
| 1 Failure (number of participants with Wexner's >8) Show forest plot | 1 | Risk Ratio (M‐H, Fixed, 95% CI) | Totals not selected | |
| 1.1 Silicone material (PTQ) versus saline | 1 | Risk Ratio (M‐H, Fixed, 95% CI) | 0.0 [0.0, 0.0] | |
| 2 No improvement (less than 50% reduction in incontinence episodes Show forest plot | 1 | Risk Ratio (M‐H, Fixed, 95% CI) | Totals not selected | |
| 2.1 Dextranomer stabilised in hyaluronic acid (NASHA Dx) versus sham injection | 1 | Risk Ratio (M‐H, Fixed, 95% CI) | 0.0 [0.0, 0.0] | |
| 3 Number of participants wearing pads every day Show forest plot | 1 | Risk Ratio (M‐H, Fixed, 95% CI) | Totals not selected | |
| 3.1 Silicone material (PTQ) versus saline | 1 | Risk Ratio (M‐H, Fixed, 95% CI) | 0.0 [0.0, 0.0] | |
| 4 Number of incontinence free days at 6 months Show forest plot | 1 | Mean Difference (IV, Fixed, 95% CI) | Totals not selected | |
| 4.1 Dextranomer stabilised in hyaluronic acid (NASHA Dx) versus sham injection | 1 | Mean Difference (IV, Fixed, 95% CI) | 0.0 [0.0, 0.0] | |
| 5 Wexner score (mean) Show forest plot | 1 | Mean Difference (IV, Fixed, 95% CI) | Totals not selected | |
| 5.1 Silicone material (PTQ) versus saline | 1 | Mean Difference (IV, Fixed, 95% CI) | 0.0 [0.0, 0.0] | |
| 6 Number of adverse effects Show forest plot | 2 | Risk Ratio (M‐H, Fixed, 95% CI) | Totals not selected | |
| 6.1 Silicone biomaterial (PTQ) versus saline injection | 1 | Risk Ratio (M‐H, Fixed, 95% CI) | 0.0 [0.0, 0.0] | |
| 6.2 Dextranomer stabilised in hyaluronic acid (NASHA Dx) versus sham injection | 1 | Risk Ratio (M‐H, Fixed, 95% CI) | 0.0 [0.0, 0.0] | |
| 7 Serious adverse effects Show forest plot | 1 | Risk Ratio (M‐H, Fixed, 95% CI) | Totals not selected | |
| 7.1 Dextranomer stabilised in hyaluronic acid (NASHA Dx) versus sham injection | 1 | Risk Ratio (M‐H, Fixed, 95% CI) | 0.0 [0.0, 0.0] | |
| 8 Need for re‐treatment at 6 months Show forest plot | 1 | Risk Ratio (M‐H, Fixed, 95% CI) | Totals not selected | |
| 8.1 Dextranomer stabilised in hyaluronic acid (NASHA Dx) versus sham injection | 1 | Risk Ratio (M‐H, Fixed, 95% CI) | 0.0 [0.0, 0.0] | |
| Outcome or subgroup title | No. of studies | No. of participants | Statistical method | Effect size |
| 1 Failure (number with worse faecal incontinence) Show forest plot | 2 | Risk Ratio (M‐H, Fixed, 95% CI) | Totals not selected | |
| 1.1 hydrogel crosslinked with polyacrylamide versus porcine dermal collagen | 1 | Risk Ratio (M‐H, Fixed, 95% CI) | 0.0 [0.0, 0.0] | |
| 1.2 silicone biomaterial (PTQ) versus carbon‐coated spheres (Durasphere) at 6 months | 1 | Risk Ratio (M‐H, Fixed, 95% CI) | 0.0 [0.0, 0.0] | |
| 1.3 silicone biomaterial (PTQ) versus carbon‐coated spheres (Durasphere) at 12 months | 1 | Risk Ratio (M‐H, Fixed, 95% CI) | 0.0 [0.0, 0.0] | |
| 2 Wexner's incontinence score Show forest plot | 1 | Mean Difference (IV, Fixed, 95% CI) | Totals not selected | |
| 2.1 silicone biomaterial (PTQ) versus carbon‐coated spheres (Durasphere) at 6 months | 1 | Mean Difference (IV, Fixed, 95% CI) | 0.0 [0.0, 0.0] | |
| 2.2 silicone biomaterial (PTQ) versus carbon‐coated spheres (Durasphere) at12 months | 1 | Mean Difference (IV, Fixed, 95% CI) | 0.0 [0.0, 0.0] | |
| 3 Quality of life index (lifestyle) at 6 months Show forest plot | 1 | Mean Difference (IV, Fixed, 95% CI) | Totals not selected | |
| 3.1 silicone biomaterial (PTQ) versus carbon‐coated spheres (Durasphere) at 6 months | 1 | Mean Difference (IV, Fixed, 95% CI) | 0.0 [0.0, 0.0] | |
| 3.2 silicone biomaterial (PTQ) versus carbon‐coated spheres (Durasphere) at 12 months | 1 | Mean Difference (IV, Fixed, 95% CI) | 0.0 [0.0, 0.0] | |
| 4 Adverse effects Show forest plot | 1 | Risk Ratio (M‐H, Fixed, 95% CI) | Totals not selected | |
| 4.1 silicone biomaterial (PTQ) versus carbon‐coated spheres (Durasphere) | 1 | Risk Ratio (M‐H, Fixed, 95% CI) | 0.0 [0.0, 0.0] | |
| 5 Serious adverse effects Show forest plot | 1 | Risk Ratio (M‐H, Fixed, 95% CI) | Totals not selected | |
| 5.1 silicone biomaterial (PTQ) versus carbon‐coated spheres (Durasphere) | 1 | Risk Ratio (M‐H, Fixed, 95% CI) | 0.0 [0.0, 0.0] | |
| Outcome or subgroup title | No. of studies | No. of participants | Statistical method | Effect size |
| 1 Failure (number of participants with Wexner's score <50% improved) Show forest plot | 1 | Risk Ratio (M‐H, Fixed, 95% CI) | Totals not selected | |
| 1.1 Endoanal ultrasound guidance versus digital guidance | 1 | Risk Ratio (M‐H, Fixed, 95% CI) | 0.0 [0.0, 0.0] | |
| 2 Failure (number of participants global Quality of Life score <50% improved) Show forest plot | 1 | Risk Ratio (M‐H, Fixed, 95% CI) | Totals not selected | |
| 2.1 Endoanal ultrasound guidance versus digital guidance | 1 | Risk Ratio (M‐H, Fixed, 95% CI) | 0.0 [0.0, 0.0] | |
| 3 Quality of life index (lifestyle) at 6 months Show forest plot | 1 | Mean Difference (IV, Fixed, 95% CI) | Totals not selected | |
| 3.1 Endoanal ultrasound guidance versus digital guidance | 1 | Mean Difference (IV, Fixed, 95% CI) | 0.0 [0.0, 0.0] | |
| 4 Discomfort at injection site Show forest plot | 1 | Risk Ratio (M‐H, Fixed, 95% CI) | Totals not selected | |
| 4.1 Endoanal ultrasound guidance versus digital guidance | 1 | Risk Ratio (M‐H, Fixed, 95% CI) | 0.0 [0.0, 0.0] | |
| 5 Adverse effects Show forest plot | 1 | Risk Ratio (M‐H, Fixed, 95% CI) | Totals not selected | |
| 5.1 Endoanal ultrasound guidance versus digital guidance | 1 | Risk Ratio (M‐H, Fixed, 95% CI) | 0.0 [0.0, 0.0] | |