호지킨 림프종 환자들에게 실시한 BEACOPP를 포함한 1차 항암화학요법과 ABVD를 포함한 1차 항암화학요법의 비교
Referencias
References to studies included in this review
References to studies excluded from this review
Additional references
References to other published versions of this review
Characteristics of studies
Characteristics of included studies [ordered by study ID]
Ir a:
| Methods | Randomisation
Recruitment period
Median follow‐up time
| |
| Participants | Eligibility criteria:
Patients recruited (not known)
Mean age:
Gender (male, female):
Country
| |
| Interventions | escalated BEACOPP (every 22 days), (no information about dosage)
ABVD (every 28 days) (no information about doses)
Additional therapy
| |
| Outcomes | Outcomes and time points from the registered protocol of the study that are considered in the review: reported
not reported
| |
| Notes | None | |
| Risk of bias | ||
| Bias | Authors' judgement | Support for judgement |
| Random sequence generation (selection bias) | Low risk | Quote: "Between October 2002 and January 2010, 550 patients were randomly assigned. " |
| Allocation concealment (selection bias) | Low risk | Quote: "Random assignments were stratified by institution and JPS ... " |
| Blinding (performance bias and detection bias) | Low risk | No information about blinding provided. This is judged not to be a source of bias for OS. |
| Blinding (performance bias and detection bias) | High risk | No information about blinding provided, blinding in this setting uncommon. |
| Incomplete outcome data (attrition bias) | Low risk | CONSORT flow diagram provided. |
| Selective reporting (reporting bias) | High risk | Comment: The protocol was registered at http://clinicaltrials.gov (Identifier: NCT00049595). The authors recognised all predefined outcomes except quality of life. |
| Other bias | Unclear risk | No information provided. |
| Methods | Randomisation
Allocation ratios
Recruitment period
Median follow‐up time
| |
| Participants | Eligibility criteria:
Patients recruited (N = 1655),
Mean age:
Gender (male, female):
Stage of disease:
Country
| |
| Interventions | BEACOPP (repeated on day 22)
ABVD (repeated on day 29)
After chemotherapy all patients received IF‐RT
Others: Treatment was postponed until recovery of WBC to at least 2 500/L and platelet count to at least 80 000/L on the day scheduled for re‐treatment. In cases of treatment postponement of more than 2 weeks or pronounced toxicity during treatment, dose reductions were foreseen in the trial protocol. | |
| Outcomes | Outcomes and time points from the study that are considered in the review: reported
not reported
| |
| Notes | Supported by Grant No. 106164 from German Cancer Aid (Deutsche Krebshilfe) and the Swiss Federal Government. Employment or Leadership Position: None Consultant or Advisory | |
| Risk of bias | ||
| Bias | Authors' judgement | Support for judgement |
| Random sequence generation (selection bias) | Unclear risk | Quote: "patients (...) were randomized" Comment: The HD 14 trial is organized by the GHSG, that also led the HD 9 trial. Sequence generation and allocation concealment should be judged to probably be adequate, because this is a large multi‐centre trial and other trials of this study group have previously been adequately randomised and allocation of these trials have previously been adequately concealed. |
| Allocation concealment (selection bias) | Unclear risk | No information provided. |
| Blinding (performance bias and detection bias) | Low risk | No information about blinding provided. This is judged not to be a source of bias for OS. |
| Blinding (performance bias and detection bias) | High risk | No information about blinding provided, blinding in this setting uncommon. |
| Incomplete outcome data (attrition bias) | Low risk | Quote: "[..] 1.655 patients [...] were randomized. [...] The full analysis set comprised 1623 patients [...]. Patient characteristics were well balanced between both arms [...]." Comment: Missing outcome data are balanced in numbers across intervention groups, with similar reasons for missing data across groups. |
| Selective reporting (reporting bias) | Unclear risk | A protocol of this trial was not registered. |
| Other bias | Unclear risk | When the third planned interim analysis yielded a significant group sequential test (adjusted overall P.0452), the trial was stopped according to protocol. |
| Methods | Randomisation
Allocation ratios
Recruitment period
Median follow‐up time
| |
| Participants | Eligibility criteria:
Patients recruited (N = 1282)
Mean age:
Gender (male, female):
Stage of disease:
Bulky disease: escalated BEACOPP: 67%; standard BEACOPP: 68%; COPP/ABVD: 58% Country
| |
| Interventions | escalated BEACOPP (every 22 days)
standard BEACOPP (every 22 days)
COPP/ABVD (every 57 days)
Additional therapy At the end of chemotherapy, radiotherapy was scheduled for sites of initial bulky disease (those at least 5 cm in diameter) and any residual tumour.
| |
| Outcomes | Outcomes and time points from the study that are considered in the review: reported
not reported
| |
| Notes | At the first interim analysis in September 1996, the early stopping boundary was crossed, with the demonstration that both BEACOPP groups together were significantly superior to COPP/ABVD in terms of the rate of FFTF. Therefore, assignment to the COPP/ABVD group was stopped (Diehl 2003a). This study was supported by a grand from: Deutsche Krebshilfe, Swiss Group for Clinical Cancer Research (Diehl 2003a) The author(s) indicated no potential conflicts of interest (Engert 2009). | |
| Risk of bias | ||
| Bias | Authors' judgement | Support for judgement |
| Random sequence generation (selection bias) | Low risk | Quote: "random assignment was performed by computer" |
| Allocation concealment (selection bias) | Low risk | Quote: "after clinical staging patients were randomly assigned by telephone call to the trial coordination center to one of three chemotherapy regimens" |
| Blinding (performance bias and detection bias) | Low risk | No information about blinding provided. This is judged not to be a source of bias for OS. |
| Blinding (performance bias and detection bias) | High risk | No information about blinding provided, blinding in this setting uncommon. |
| Incomplete outcome data (attrition bias) | Low risk | Quote: "Of 1282 patients, 86 were excluded due to incorrect Comment: Missing outcome data are balanced in numbers across intervention groups, with similar reasons for missing data across groups. Therefore, see Diehl 2003a who has given a detailed overview of the reasons for the exclusion of patients: escalated BEACOPP (15 did not have HD, 12 met clinical exclusion criteria, 1 lost to follow‐up), standard BEACOPP (19 did not have HD, 9 met clinical exclusion criteria, 1 lost to follow‐up), COPP/ABVD (12 did not have HD, 13 met clinical exclusion criteria, 3 lost to follow‐up). |
| Selective reporting (reporting bias) | Unclear risk | A protocol of this trial was not registered. |
| Other bias | Unclear risk | Quote: "Assignment to the COPP/ABVD group was stopped by the safety board after the first interim analysis indicating that both BEACOPP groups were significantly superior in terms of FFTF to COPP/ABVD (P .03)." Comment: In the GHSG HD9 trial randomisation for the escalated BEACOPP‐arm started later than randomisation to both other arms. Furthermore, randomisation to the COPP/ABVD‐arm was stopped after first interim analysis due to the fact that both BEACOPP groups together were significantly superior to COPP/ABVD in terms of the rate of freedom from treatment failure (Diehl 2003). According to this potential risk of bias the analyses of OS and PFS were based on data of patients recruited in parallel, i.e. during the same time period (COPP/ABVD N = 177, BEACOPP N = 265). |
| Methods | Randomisation
Allocation ratios
Recruitment period
Median follow‐up time
| |
| Participants | Eligibility criteria
Patients recruited (331 patients)
Mean age:
Gender (male, female):
Stage of disease:
Country
| |
| Interventions | escalated BEACOPP (every 21 days)
standard BEACOPP (every 21 days)
ABVD (every 28 days)
Additional therapy At the end of chemotherapy, radiotherapy was scheduled for sites of initial bulky disease and any residual tumour
For treatment failures
| |
| Outcomes | Outcomes and time points from the study that are considered in the review: reported
not reported
| |
| Notes | Funding resources: The study was designed by the investigators, and the coordination of the study, the collection and quality control of the data, and the statistical analyses were performed at the operations office of Fondazione Michelangelo (the sponsoring organization). No commercial support was provided. The author(s) indicated no potential conflicts of interest. | |
| Risk of bias | ||
| Bias | Authors' judgement | Support for judgement |
| Random sequence generation (selection bias) | Unclear risk | Quote: "patients (...) were randomized" Comment: No further information provided |
| Allocation concealment (selection bias) | Unclear risk | No information provided. |
| Blinding (performance bias and detection bias) | Low risk | No information about blinding provided. This is judged not to be a source of bias for OS. |
| Blinding (performance bias and detection bias) | High risk | No information about blinding provided, blinding in this setting uncommon. |
| Incomplete outcome data (attrition bias) | Low risk | Quote: "a total of 331 patients were recruited (...); 168 patients were assigned to receive ABVD and 163 to receive BEACOPP. Two patients were subsequently found to be ineligible because of a wrong diagnosis, and 7 withdrew consent before starting chemotherapy. Thus, 166 patients were initiated on ABVD chemotherapy and 156 on BEACOPP chemotherapy (safety population), whereas all 331 patients who underwent randomization were assessed for efficacy (intention‐to‐treat population)." |
| Selective reporting (reporting bias) | Low risk | All outcomes reported as pre‐planned |
| Other bias | Unclear risk | No information provided. |
| Methods | Randomisation
Allocation ratios
Recruitment period
Median follow‐up time
| |
| Participants | Eligibility criteria.
Patients recruited (N = 307)
Mean age:
Gender (male, female):
Stage of disease:
Bulky disease: escalated BEACOPP: 37%; CEC: 37%; ABVD: 31% Country
| |
| Interventions | BEACOPP (every 21 days)
CEC (every 28 days)
ABVD (every 28 days)
Additional therapy At the end of chemotherapy, radiotherapy was scheduled for sites of previous bulky disease or on slowly or partially responding sites.
| |
| Outcomes | Outcomes and time points from the study that are considered in the review: reported
not reported
| |
| Notes | This study was in parts funded by: Associazione Angela Serra per la Ricerca sul Cancro, Modena, and the Gruppo Amici Dell’Ematologia, Reggio Emilia, Italy. The author(s) indicated no potential conflicts of interest. | |
| Risk of bias | ||
| Bias | Authors' judgement | Support for judgement |
| Random sequence generation (selection bias) | Unclear risk | Quote: "patients were randomly assigned" Comment: No further information provided |
| Allocation concealment (selection bias) | Unclear risk | No information provided |
| Blinding (performance bias and detection bias) | Low risk | No information about blinding provided. This is judged not to be a source of bias for OS. |
| Blinding (performance bias and detection bias) | High risk | No information about blinding provided, blinding in this setting uncommon. |
| Incomplete outcome data (attrition bias) | Low risk | Missing outcome data balanced in numbers across intervention groups, with similar reasons for missing data across groups (i.e. 4 patients of the BEACOPP arm were excluded from the analyses because of revised histology (N = 1), not compliant (N = 1), missing data (N = 2); 4 patients of the ABVD arm were excluded because of missing data (N = 3) and lost to follow‐up (N = 1)) |
| Selective reporting (reporting bias) | Unclear risk | Although the protocol is published, no pre‐planned outcomes are reported, therefore we judge the risk of bias as unclear. |
| Other bias | Unclear risk | Quote: "The study was initially designed to compare myelotoxicity referred of leukopenia of CEC and BEACOPP regimens with respect of that of ABVD (...). Once, in the first 18 months, Gruppo Italiano per lo Studio dei Linfomi centers became familiar with BEACOPP, the protocol was amended and BEACOPP and CEC regimens were tested against ABVD primarily in terms of FFS." Quote: "We used one‐sided test in consideration of the expected superiority of BEACOPP and CEC, in term of FFS in comparison with the historical knowledge about ABVD chemotherapy regimen." Comment: This procedure might have led to a underpowered study. |
Abbreviations: CR ‐ complete response; EFS – event‐free survival; FFTF ‐ freedom from treatment failure; G‐CSF ‐ Granulocyte‐colony stimulating factor; HD ‐ Hodgkin's disease; HL ‐ Hodgkin lymphoma; HTLV ‐ human T‐cell lymphotropic virus; LVEF ‐ left ventricular ejection fraction; OS ‐ overall survival; PFS ‐ progression‐free survival; WBC – white blood cell
Characteristics of excluded studies [ordered by study ID]
Ir a:
| Study | Reason for exclusion |
| Comparison arm not treated with escalated BEACOPP chemotherapy | |
| Not a randomised controlled trial | |
| Control arm not treated with ABVD chemotherapy | |
| Comparison arm not treated with ABVD chemotherapy | |
| Review | |
| Review | |
| Review | |
| Not a randomised controlled trial | |
| Review | |
| Not a randomised controlled trial | |
| Not a randomised controlled trial | |
| Review | |
| Comparison arm not treated with escalated BEACOPP chemotherapy | |
| Not a randomised controlled trial | |
| Not a randomised controlled trial | |
| Comparison arm not treated with escalated BEACOPP chemotherapy | |
| Control arm not treated with ABVD chemotherapy | |
| Comparison arms not treated with escalated BEACOPP chemotherapy | |
| Comparison arms not treated with escalated BEACOPP chemotherapy | |
| Comparison arm not treated with escalated BEACOPP chemotherapy | |
| Review | |
| Review | |
| Review | |
| Review | |
| All PET‐positive patients received BEACOPP chemotherapy | |
| Not a randomised controlled trial | |
| Not a randomised controlled trial | |
| Not a randomised controlled trial | |
| Review | |
| Review | |
| Comparison arm not treated with escalated BEACOPP chemotherapy | |
| Comparison arm not treated with escalated BEACOPP chemotherapy | |
| Control arm not treated with ABVD chemotherapy | |
| Not a randomised controlled trial | |
| Not a randomised controlled trial | |
| Not a randomised controlled trial | |
| Comparison arm not treated with escalated BEACOPP chemotherapy |
AVBD ‐ doxorubicin/bleomycin/vinblastine/dacarbazine; BEACOPP ‐ bleomycin, etoposide, doxorubicin, cyclophosphamide, vincristine, procarbazine, prednisone; PET ‐ Positron emission tomography
Data and analyses
| Outcome or subgroup title | No. of studies | No. of participants | Statistical method | Effect size |
| 1 OS ‐ all ‐ same recruitment period between the 2 arms (HD9) Show forest plot | 5 | 3142 | Hazard Ratio (Fixed, 95% CI) | 0.74 [0.57, 0.97] |
| Analysis 1.1  Comparison 1 Analysis overall survival, Outcome 1 OS ‐ all ‐ same recruitment period between the 2 arms (HD9). | ||||
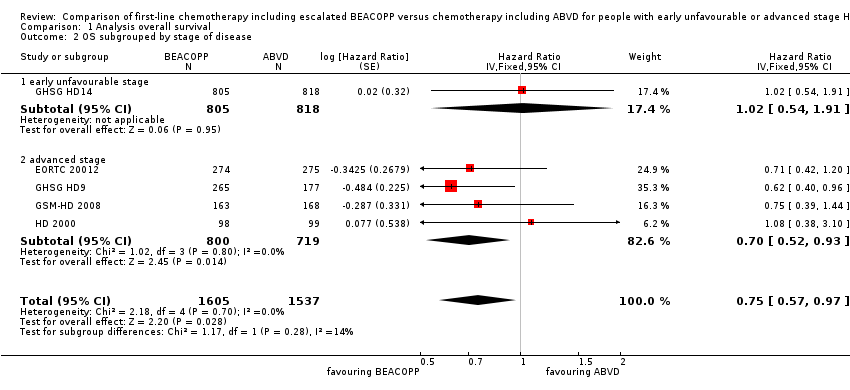
| 2 OS subgrouped by stage of disease Show forest plot | 5 | 3142 | Hazard Ratio (Fixed, 95% CI) | 0.75 [0.57, 0.97] |
| Analysis 1.2  Comparison 1 Analysis overall survival, Outcome 2 OS subgrouped by stage of disease. | ||||
| 2.1 early unfavourable stage | 1 | 1623 | Hazard Ratio (Fixed, 95% CI) | 1.02 [0.54, 1.91] |
| 2.2 advanced stage | 4 | 1519 | Hazard Ratio (Fixed, 95% CI) | 0.70 [0.52, 0.93] |
| 3 OS subgrouped by treatment Show forest plot | 5 | 3142 | Hazard Ratio (Fixed, 95% CI) | 0.75 [0.57, 0.97] |
| Analysis 1.3  Comparison 1 Analysis overall survival, Outcome 3 OS subgrouped by treatment. | ||||
| 3.1 only ABVD regimen | 4 | 2700 | Hazard Ratio (Fixed, 95% CI) | 0.83 [0.60, 1.14] |
| 3.2 ABVD including regimen | 1 | 442 | Hazard Ratio (Fixed, 95% CI) | 0.62 [0.40, 0.96] |
| 4 OS subgrouped by number of cycles of escalated BEACOPP Show forest plot | 5 | 3142 | Hazard Ratio (Fixed, 95% CI) | 0.75 [0.57, 0.97] |
| Analysis 1.4 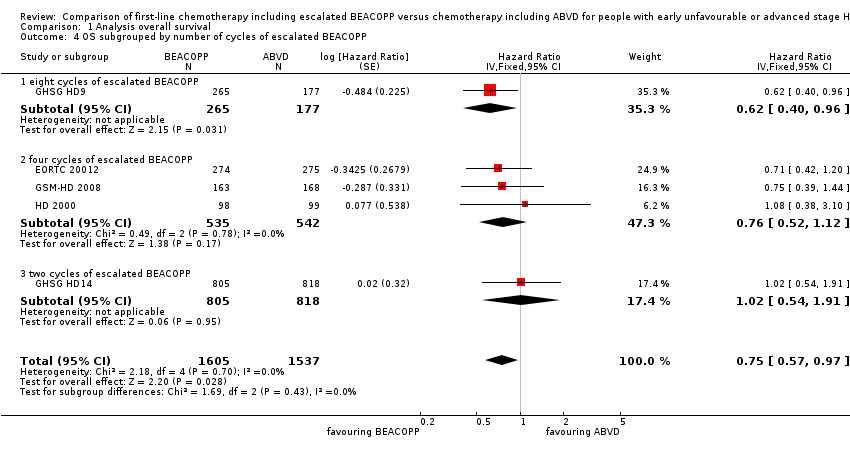 Comparison 1 Analysis overall survival, Outcome 4 OS subgrouped by number of cycles of escalated BEACOPP. | ||||
| 4.1 eight cycles of escalated BEACOPP | 1 | 442 | Hazard Ratio (Fixed, 95% CI) | 0.62 [0.40, 0.96] |
| 4.2 four cycles of escalated BEACOPP | 3 | 1077 | Hazard Ratio (Fixed, 95% CI) | 0.76 [0.52, 1.12] |
| 4.3 two cycles of escalated BEACOPP | 1 | 1623 | Hazard Ratio (Fixed, 95% CI) | 1.02 [0.54, 1.91] |
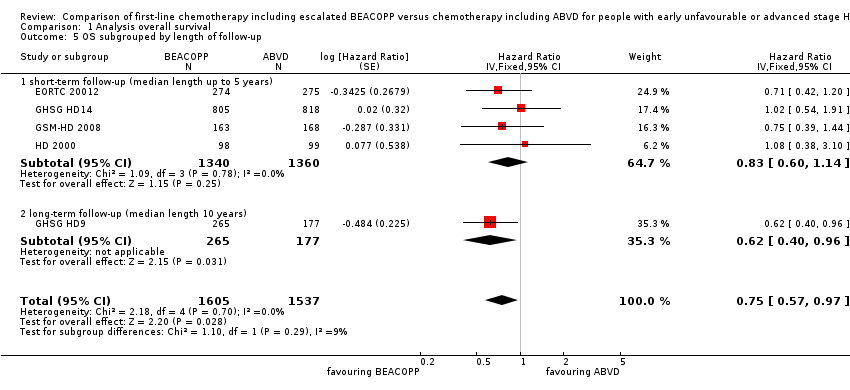
| 5 OS subgrouped by length of follow‐up Show forest plot | 5 | 3142 | Hazard Ratio (Fixed, 95% CI) | 0.75 [0.57, 0.97] |
| Analysis 1.5  Comparison 1 Analysis overall survival, Outcome 5 OS subgrouped by length of follow‐up. | ||||
| 5.1 short‐term follow‐up (median length up to 5 years) | 4 | 2700 | Hazard Ratio (Fixed, 95% CI) | 0.83 [0.60, 1.14] |
| 5.2 long‐term follow‐up (median length 10 years) | 1 | 442 | Hazard Ratio (Fixed, 95% CI) | 0.62 [0.40, 0.96] |
| 6 OS subgrouped by radiotherapy Show forest plot | 5 | 3132 | Hazard Ratio (Fixed, 95% CI) | 0.75 [0.57, 0.97] |
| Analysis 1.6 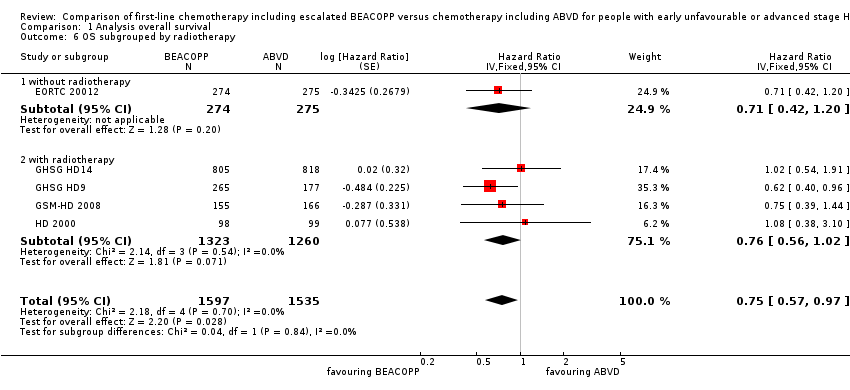 Comparison 1 Analysis overall survival, Outcome 6 OS subgrouped by radiotherapy. | ||||
| 6.1 without radiotherapy | 1 | 549 | Hazard Ratio (Fixed, 95% CI) | 0.71 [0.42, 1.20] |
| 6.2 with radiotherapy | 4 | 2583 | Hazard Ratio (Fixed, 95% CI) | 0.76 [0.56, 1.02] |
| 7 OS ‐ all recruited patients (HD9) with potential risk of bias due to different time periods of recruitment Show forest plot | 5 | Hazard Ratio (Fixed, 95% CI) | 0.66 [0.52, 0.84] | |
| Analysis 1.7  Comparison 1 Analysis overall survival, Outcome 7 OS ‐ all recruited patients (HD9) with potential risk of bias due to different time periods of recruitment. | ||||
| Outcome or subgroup title | No. of studies | No. of participants | Statistical method | Effect size |
| 1 PFS ‐ all ‐ same recruitment period between the 2 arms (HD9) Show forest plot | 5 | 3142 | Hazard Ratio (Fixed, 95% CI) | 0.54 [0.45, 0.64] |
| Analysis 2.1  Comparison 2 Analysis of progression‐free survival (PFS), Outcome 1 PFS ‐ all ‐ same recruitment period between the 2 arms (HD9). | ||||
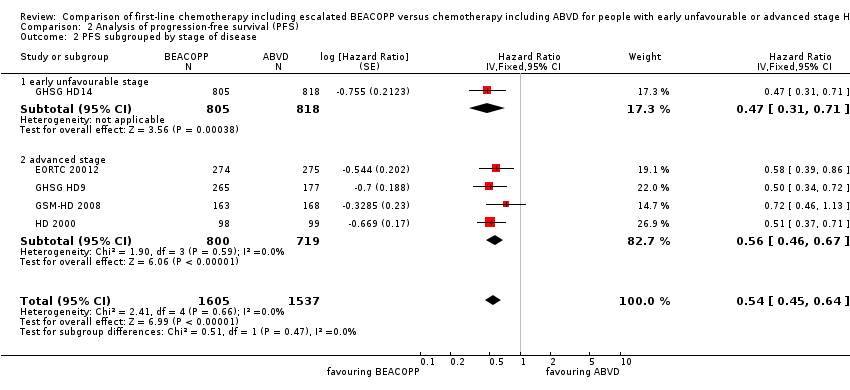
| 2 PFS subgrouped by stage of disease Show forest plot | 5 | 3142 | Hazard Ratio (Fixed, 95% CI) | 0.54 [0.45, 0.64] |
| Analysis 2.2  Comparison 2 Analysis of progression‐free survival (PFS), Outcome 2 PFS subgrouped by stage of disease. | ||||
| 2.1 early unfavourable stage | 1 | 1623 | Hazard Ratio (Fixed, 95% CI) | 0.47 [0.31, 0.71] |
| 2.2 advanced stage | 4 | 1519 | Hazard Ratio (Fixed, 95% CI) | 0.56 [0.46, 0.67] |
| 3 PFS subgrouped by treatment Show forest plot | 5 | 3142 | Hazard Ratio (Fixed, 95% CI) | 0.54 [0.45, 0.64] |
| Analysis 2.3  Comparison 2 Analysis of progression‐free survival (PFS), Outcome 3 PFS subgrouped by treatment. | ||||
| 3.1 only ABVD regimen | 4 | 2700 | Hazard Ratio (Fixed, 95% CI) | 0.55 [0.45, 0.67] |
| 3.2 ABVD including regimen | 1 | 442 | Hazard Ratio (Fixed, 95% CI) | 0.50 [0.34, 0.72] |
| 4 PFS subgrouped by number of cycles of escalated BEACOPP Show forest plot | 5 | 3142 | Hazard Ratio (Fixed, 95% CI) | 0.54 [0.45, 0.64] |
| Analysis 2.4  Comparison 2 Analysis of progression‐free survival (PFS), Outcome 4 PFS subgrouped by number of cycles of escalated BEACOPP. | ||||
| 4.1 eight cycles of escalated BEACOPP | 1 | 442 | Hazard Ratio (Fixed, 95% CI) | 0.50 [0.34, 0.72] |
| 4.2 four cycles of escalated BEACOPP | 3 | 1077 | Hazard Ratio (Fixed, 95% CI) | 0.58 [0.46, 0.72] |
| 4.3 two cycles of escalated BEACOPP | 1 | 1623 | Hazard Ratio (Fixed, 95% CI) | 0.47 [0.31, 0.71] |
| 5 PFS subgrouped by length of follow‐up Show forest plot | 5 | 3142 | Hazard Ratio (Fixed, 95% CI) | 0.54 [0.45, 0.64] |
| Analysis 2.5 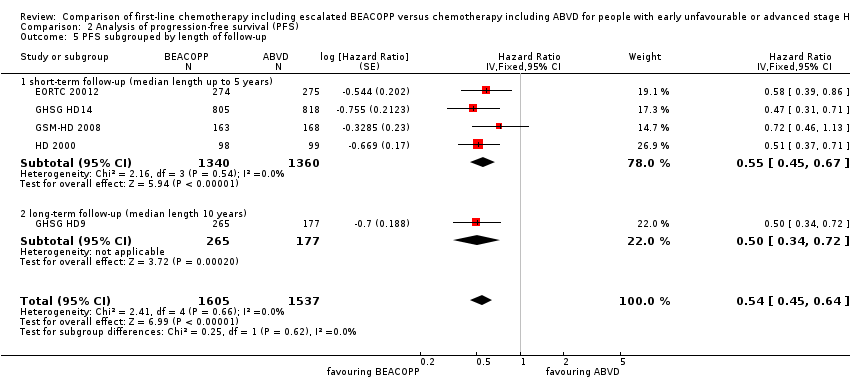 Comparison 2 Analysis of progression‐free survival (PFS), Outcome 5 PFS subgrouped by length of follow‐up. | ||||
| 5.1 short‐term follow‐up (median length up to 5 years) | 4 | 2700 | Hazard Ratio (Fixed, 95% CI) | 0.55 [0.45, 0.67] |
| 5.2 long‐term follow‐up (median length 10 years) | 1 | 442 | Hazard Ratio (Fixed, 95% CI) | 0.50 [0.34, 0.72] |
| 6 PFS subgrouped by type of radiotherapy Show forest plot | 5 | Hazard Ratio (Fixed, 95% CI) | 0.54 [0.45, 0.64] | |
| Analysis 2.6 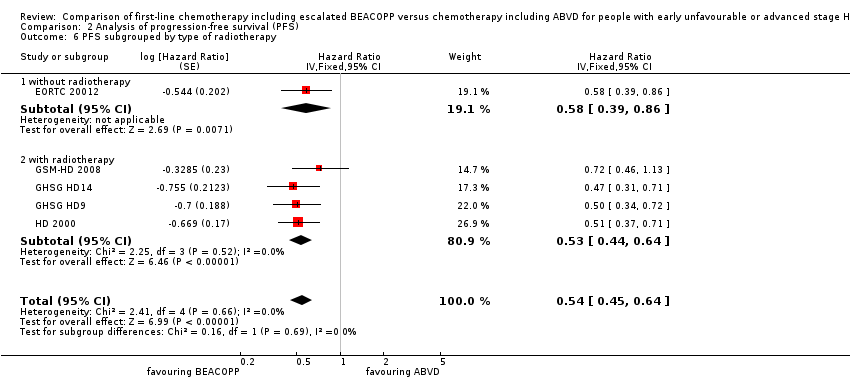 Comparison 2 Analysis of progression‐free survival (PFS), Outcome 6 PFS subgrouped by type of radiotherapy. | ||||
| 6.1 without radiotherapy | 1 | Hazard Ratio (Fixed, 95% CI) | 0.58 [0.39, 0.86] | |
| 6.2 with radiotherapy | 4 | Hazard Ratio (Fixed, 95% CI) | 0.53 [0.44, 0.64] | |
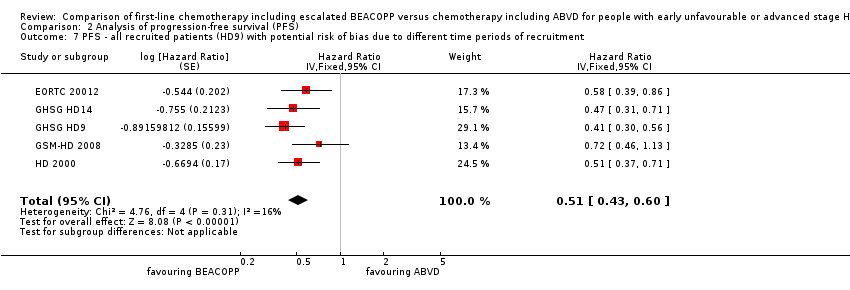
| 7 PFS ‐ all recruited patients (HD9) with potential risk of bias due to different time periods of recruitment Show forest plot | 5 | Hazard Ratio (Fixed, 95% CI) | 0.51 [0.43, 0.60] | |
| Analysis 2.7  Comparison 2 Analysis of progression‐free survival (PFS), Outcome 7 PFS ‐ all recruited patients (HD9) with potential risk of bias due to different time periods of recruitment. | ||||
| Outcome or subgroup title | No. of studies | No. of participants | Statistical method | Effect size |
| 1 Treatment‐related mortality Show forest plot | 4 | 2700 | Risk Ratio (M‐H, Fixed, 95% CI) | 2.15 [0.93, 4.95] |
| Analysis 3.1  Comparison 3 Analysis of treatment‐related mortality, Outcome 1 Treatment‐related mortality. | ||||
| 2 TRM subgrouped by stage of disease Show forest plot | 4 | 2700 | Risk Ratio (M‐H, Fixed, 95% CI) | 2.15 [0.93, 4.95] |
| Analysis 3.2  Comparison 3 Analysis of treatment‐related mortality, Outcome 2 TRM subgrouped by stage of disease. | ||||
| 2.1 early unfavourable stage | 1 | 1623 | Risk Ratio (M‐H, Fixed, 95% CI) | 9.15 [0.49, 169.58] |
| 2.2 advanced stage | 3 | 1077 | Risk Ratio (M‐H, Fixed, 95% CI) | 1.69 [0.69, 4.13] |
| 3 TRM subgrouped by number of cycles of escalated BEACOPP Show forest plot | 4 | 2700 | Risk Ratio (M‐H, Fixed, 95% CI) | 2.15 [0.93, 4.95] |
| Analysis 3.3 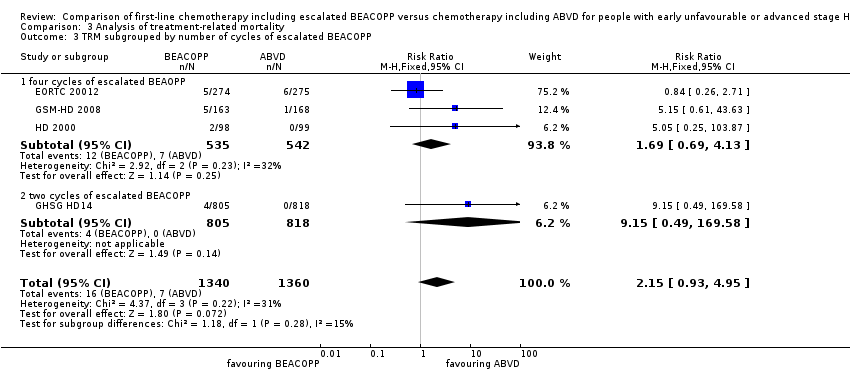 Comparison 3 Analysis of treatment‐related mortality, Outcome 3 TRM subgrouped by number of cycles of escalated BEACOPP. | ||||
| 3.1 four cycles of escalated BEAOPP | 3 | 1077 | Risk Ratio (M‐H, Fixed, 95% CI) | 1.69 [0.69, 4.13] |
| 3.2 two cycles of escalated BEACOPP | 1 | 1623 | Risk Ratio (M‐H, Fixed, 95% CI) | 9.15 [0.49, 169.58] |
| 4 TRM subgrouped by type of radiotherapy Show forest plot | 4 | 2700 | Risk Ratio (M‐H, Fixed, 95% CI) | 2.15 [0.93, 4.95] |
| Analysis 3.4 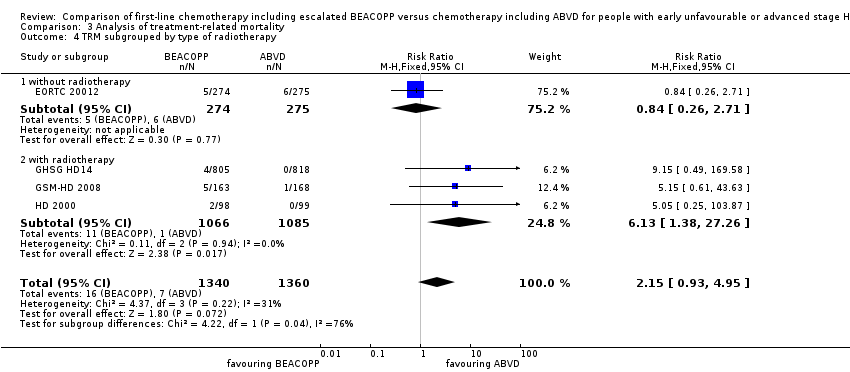 Comparison 3 Analysis of treatment‐related mortality, Outcome 4 TRM subgrouped by type of radiotherapy. | ||||
| 4.1 without radiotherapy | 1 | 549 | Risk Ratio (M‐H, Fixed, 95% CI) | 0.84 [0.26, 2.71] |
| 4.2 with radiotherapy | 3 | 2151 | Risk Ratio (M‐H, Fixed, 95% CI) | 6.13 [1.38, 27.26] |
| Outcome or subgroup title | No. of studies | No. of participants | Statistical method | Effect size |
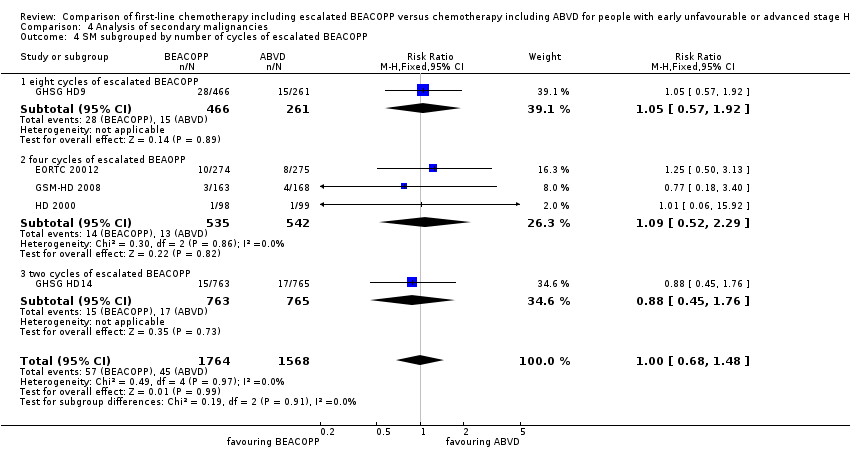
| 1 Secondary malignancies Show forest plot | 5 | 3332 | Risk Ratio (M‐H, Fixed, 95% CI) | 1.00 [0.68, 1.48] |
| Analysis 4.1  Comparison 4 Analysis of secondary malignancies, Outcome 1 Secondary malignancies. | ||||
| 2 SM subgrouped by stage of disease Show forest plot | 5 | 3332 | Risk Ratio (M‐H, Fixed, 95% CI) | 1.00 [0.68, 1.48] |
| Analysis 4.2  Comparison 4 Analysis of secondary malignancies, Outcome 2 SM subgrouped by stage of disease. | ||||
| 2.1 early unfavourable stage | 1 | 1528 | Risk Ratio (M‐H, Fixed, 95% CI) | 0.88 [0.45, 1.76] |
| 2.2 advanced stage | 4 | 1804 | Risk Ratio (M‐H, Fixed, 95% CI) | 1.06 [0.66, 1.70] |
| 3 SM subgrouped by treatment Show forest plot | 5 | 3332 | Risk Ratio (M‐H, Fixed, 95% CI) | 1.00 [0.68, 1.48] |
| Analysis 4.3  Comparison 4 Analysis of secondary malignancies, Outcome 3 SM subgrouped by treatment. | ||||
| 3.1 only ABVD | 4 | 2605 | Risk Ratio (M‐H, Fixed, 95% CI) | 0.97 [0.59, 1.61] |
| 3.2 ABVD including regimen | 1 | 727 | Risk Ratio (M‐H, Fixed, 95% CI) | 1.05 [0.57, 1.92] |
| 4 SM subgrouped by number of cycles of escalated BEACOPP Show forest plot | 5 | 3332 | Risk Ratio (M‐H, Fixed, 95% CI) | 1.00 [0.68, 1.48] |
| Analysis 4.4  Comparison 4 Analysis of secondary malignancies, Outcome 4 SM subgrouped by number of cycles of escalated BEACOPP. | ||||
| 4.1 eight cycles of escalated BEACOPP | 1 | 727 | Risk Ratio (M‐H, Fixed, 95% CI) | 1.05 [0.57, 1.92] |
| 4.2 four cycles of escalated BEAOPP | 3 | 1077 | Risk Ratio (M‐H, Fixed, 95% CI) | 1.09 [0.52, 2.29] |
| 4.3 two cycles of escalated BEACOPP | 1 | 1528 | Risk Ratio (M‐H, Fixed, 95% CI) | 0.88 [0.45, 1.76] |
| 5 SM subgrouped by type of radiotherapy Show forest plot | 5 | 3332 | Risk Ratio (M‐H, Fixed, 95% CI) | 1.00 [0.68, 1.48] |
| Analysis 4.5 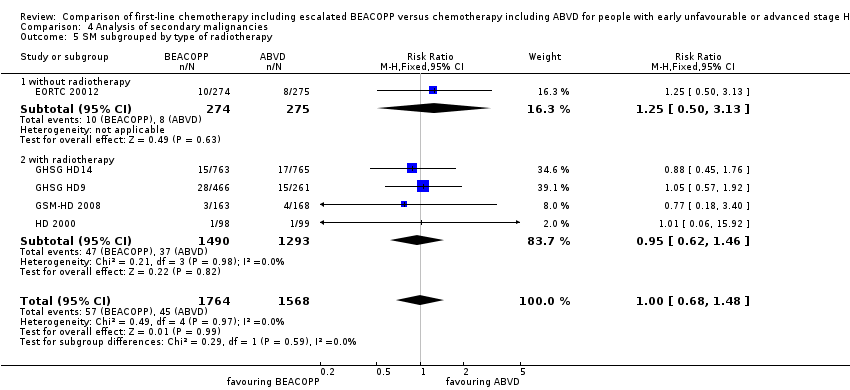 Comparison 4 Analysis of secondary malignancies, Outcome 5 SM subgrouped by type of radiotherapy. | ||||
| 5.1 without radiotherapy | 1 | 549 | Risk Ratio (M‐H, Fixed, 95% CI) | 1.25 [0.50, 3.13] |
| 5.2 with radiotherapy | 4 | 2783 | Risk Ratio (M‐H, Fixed, 95% CI) | 0.95 [0.62, 1.46] |
| 6 SM subgrouped by length of follow‐up Show forest plot | 5 | 3332 | Risk Ratio (M‐H, Fixed, 95% CI) | 1.00 [0.68, 1.48] |
| Analysis 4.6  Comparison 4 Analysis of secondary malignancies, Outcome 6 SM subgrouped by length of follow‐up. | ||||
| 6.1 short‐term follow‐up (median length up to 5 years) | 4 | 2605 | Risk Ratio (M‐H, Fixed, 95% CI) | 0.97 [0.59, 1.61] |
| 6.2 long‐term follow‐up (median length 10 years) | 1 | 727 | Risk Ratio (M‐H, Fixed, 95% CI) | 1.05 [0.57, 1.92] |
| Outcome or subgroup title | No. of studies | No. of participants | Statistical method | Effect size |
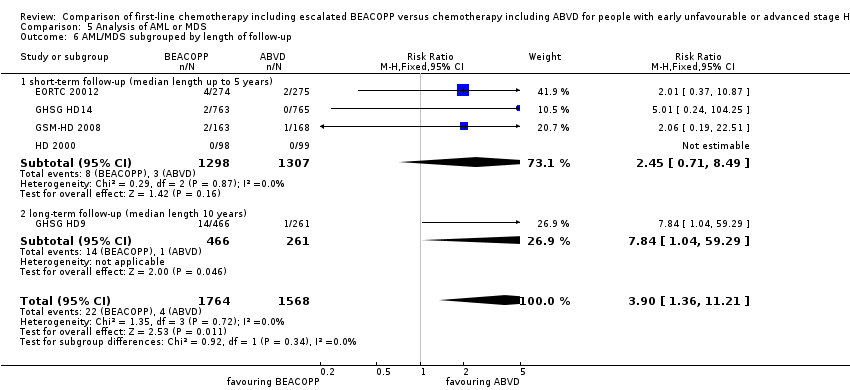
| 1 AML or MDS Show forest plot | 5 | 3332 | Risk Ratio (M‐H, Fixed, 95% CI) | 3.90 [1.36, 11.21] |
| Analysis 5.1  Comparison 5 Analysis of AML or MDS, Outcome 1 AML or MDS. | ||||
| 2 AML/MDS subgrouped by stage of disease Show forest plot | 5 | 3332 | Risk Ratio (M‐H, Fixed, 95% CI) | 3.90 [1.36, 11.21] |
| Analysis 5.2  Comparison 5 Analysis of AML or MDS, Outcome 2 AML/MDS subgrouped by stage of disease. | ||||
| 2.1 early unfavourable stage | 1 | 1528 | Risk Ratio (M‐H, Fixed, 95% CI) | 5.01 [0.24, 104.25] |
| 2.2 advanced stage | 4 | 1804 | Risk Ratio (M‐H, Fixed, 95% CI) | 3.77 [1.22, 11.64] |
| 3 AML/MDS subgrouped by treatment Show forest plot | 5 | 3332 | Risk Ratio (M‐H, Fixed, 95% CI) | 3.90 [1.36, 11.21] |
| Analysis 5.3 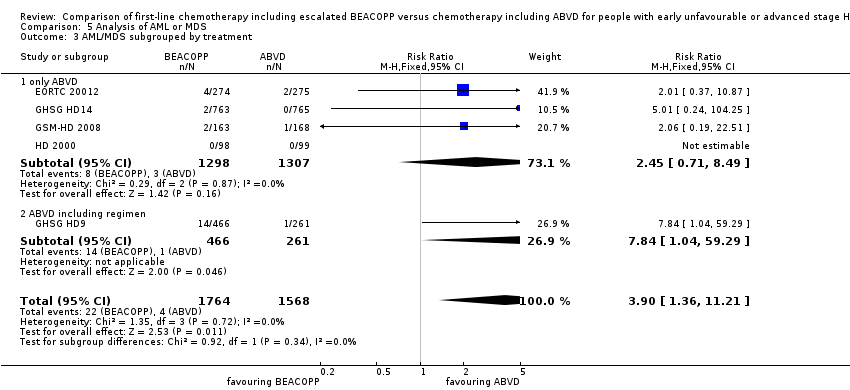 Comparison 5 Analysis of AML or MDS, Outcome 3 AML/MDS subgrouped by treatment. | ||||
| 3.1 only ABVD | 4 | 2605 | Risk Ratio (M‐H, Fixed, 95% CI) | 2.45 [0.71, 8.49] |
| 3.2 ABVD including regimen | 1 | 727 | Risk Ratio (M‐H, Fixed, 95% CI) | 7.84 [1.04, 59.29] |
| 4 AML/MDS subgrouped by number of cycles of escalated BEACOPP Show forest plot | 5 | 3332 | Risk Ratio (M‐H, Fixed, 95% CI) | 3.90 [1.36, 11.21] |
| Analysis 5.4 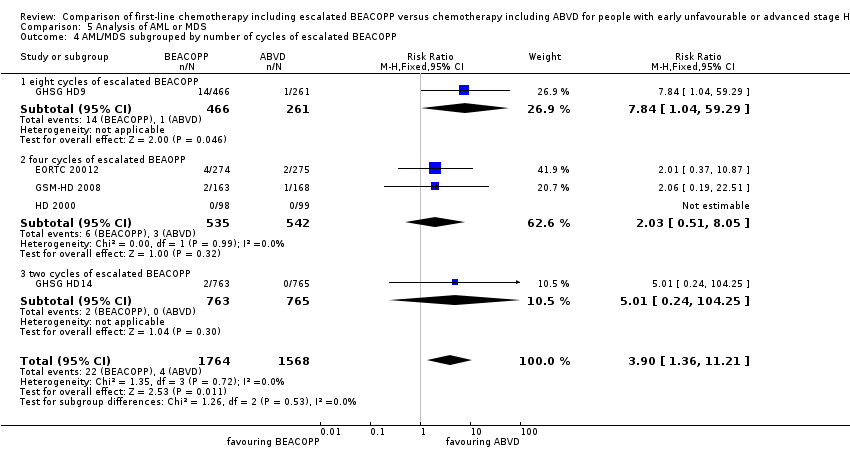 Comparison 5 Analysis of AML or MDS, Outcome 4 AML/MDS subgrouped by number of cycles of escalated BEACOPP. | ||||
| 4.1 eight cycles of escalated BEACOPP | 1 | 727 | Risk Ratio (M‐H, Fixed, 95% CI) | 7.84 [1.04, 59.29] |
| 4.2 four cycles of escalated BEAOPP | 3 | 1077 | Risk Ratio (M‐H, Fixed, 95% CI) | 2.03 [0.51, 8.05] |
| 4.3 two cycles of escalated BEACOPP | 1 | 1528 | Risk Ratio (M‐H, Fixed, 95% CI) | 5.01 [0.24, 104.25] |
| 5 AML/MDS subgrouped by type of radiotherapy Show forest plot | 5 | 3332 | Risk Ratio (M‐H, Fixed, 95% CI) | 3.90 [1.36, 11.21] |
| Analysis 5.5  Comparison 5 Analysis of AML or MDS, Outcome 5 AML/MDS subgrouped by type of radiotherapy. | ||||
| 5.1 without radiotherapy | 1 | 549 | Risk Ratio (M‐H, Fixed, 95% CI) | 2.01 [0.37, 10.87] |
| 5.2 with radiotherapy | 4 | 2783 | Risk Ratio (M‐H, Fixed, 95% CI) | 5.27 [1.34, 20.74] |
| 6 AML/MDS subgrouped by length of follow‐up Show forest plot | 5 | 3332 | Risk Ratio (M‐H, Fixed, 95% CI) | 3.90 [1.36, 11.21] |
| Analysis 5.6  Comparison 5 Analysis of AML or MDS, Outcome 6 AML/MDS subgrouped by length of follow‐up. | ||||
| 6.1 short‐ term follow‐up (median length up to 5 years) | 4 | 2605 | Risk Ratio (M‐H, Fixed, 95% CI) | 2.45 [0.71, 8.49] |
| 6.2 long‐ term follow‐up (median length 10 years) | 1 | 727 | Risk Ratio (M‐H, Fixed, 95% CI) | 7.84 [1.04, 59.29] |
| Outcome or subgroup title | No. of studies | No. of participants | Statistical method | Effect size |
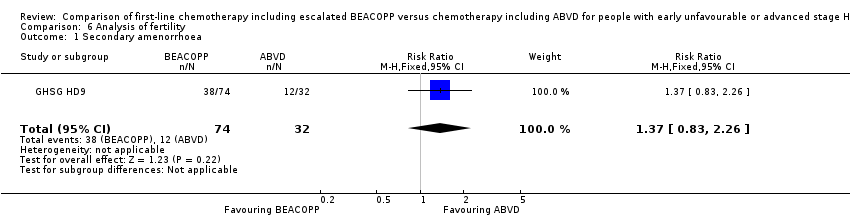
| 1 Secondary amenorrhoea Show forest plot | 1 | 106 | Risk Ratio (M‐H, Fixed, 95% CI) | 1.37 [0.83, 2.26] |
| Analysis 6.1  Comparison 6 Analysis of fertility, Outcome 1 Secondary amenorrhoea. | ||||
| Outcome or subgroup title | No. of studies | No. of participants | Statistical method | Effect size |
| 1 Anaemia Show forest plot | 3 | 2425 | Risk Ratio (M‐H, Fixed, 95% CI) | 10.67 [7.14, 15.93] |
| Analysis 7.1  Comparison 7 Analysis of anaemia, Outcome 1 Anaemia. | ||||
| Outcome or subgroup title | No. of studies | No. of participants | Statistical method | Effect size |
| 1 Infection Show forest plot | 3 | 2425 | Risk Ratio (M‐H, Fixed, 95% CI) | 3.73 [2.58, 5.38] |
| Analysis 8.1  Comparison 8 Analysis of infection, Outcome 1 Infection. | ||||
| Outcome or subgroup title | No. of studies | No. of participants | Statistical method | Effect size |
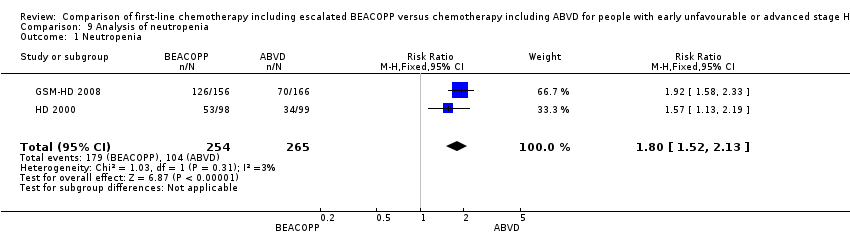
| 1 Neutropenia Show forest plot | 2 | 519 | Risk Ratio (M‐H, Fixed, 95% CI) | 1.80 [1.52, 2.13] |
| Analysis 9.1  Comparison 9 Analysis of neutropenia, Outcome 1 Neutropenia. | ||||
| Outcome or subgroup title | No. of studies | No. of participants | Statistical method | Effect size |
| 1 Thrombocytopenia Show forest plot | 3 | 2425 | Risk Ratio (M‐H, Fixed, 95% CI) | 18.12 [11.77, 27.92] |
| Analysis 10.1 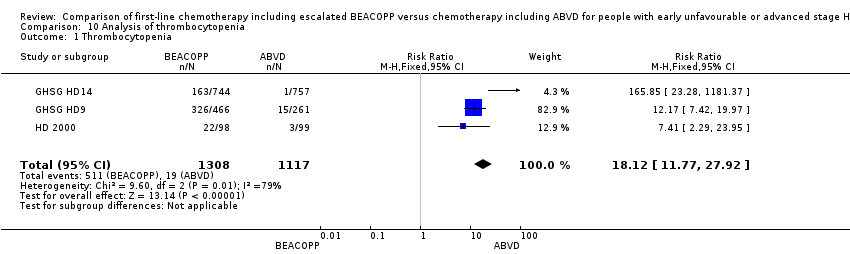 Comparison 10 Analysis of thrombocytopenia, Outcome 1 Thrombocytopenia. | ||||
| Outcome or subgroup title | No. of studies | No. of participants | Statistical method | Effect size |
| 1 Alopecia Show forest plot | 3 | 2425 | Risk Ratio (M‐H, Fixed, 95% CI) | 1.98 [1.78, 2.21] |
| Analysis 11.1 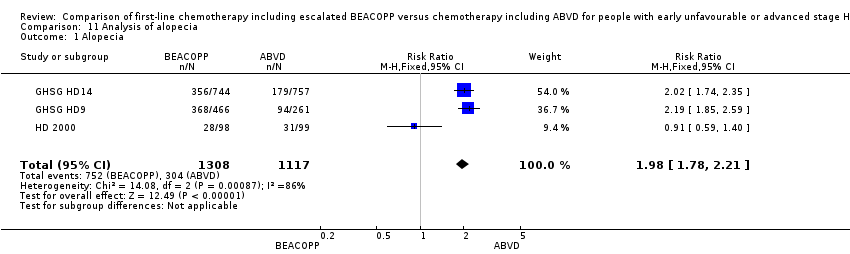 Comparison 11 Analysis of alopecia, Outcome 1 Alopecia. | ||||
| Outcome or subgroup title | No. of studies | No. of participants | Statistical method | Effect size |
| 1 Constipation Show forest plot | 2 | 923 | Risk Ratio (M‐H, Fixed, 95% CI) | 1.19 [0.56, 2.55] |
| Analysis 12.1  Comparison 12 Analysis of constipation, Outcome 1 Constipation. | ||||
| Outcome or subgroup title | No. of studies | No. of participants | Statistical method | Effect size |
| 1 Mucositis Show forest plot | 3 | 2425 | Risk Ratio (M‐H, Fixed, 95% CI) | 8.04 [3.72, 17.38] |
| Analysis 13.1  Comparison 13 Analysis of mucositis, Outcome 1 Mucositis. | ||||
| Outcome or subgroup title | No. of studies | No. of participants | Statistical method | Effect size |
| 1 Nausea/vomiting Show forest plot | 3 | 2425 | Risk Ratio (M‐H, Fixed, 95% CI) | 0.83 [0.68, 1.01] |
| Analysis 14.1 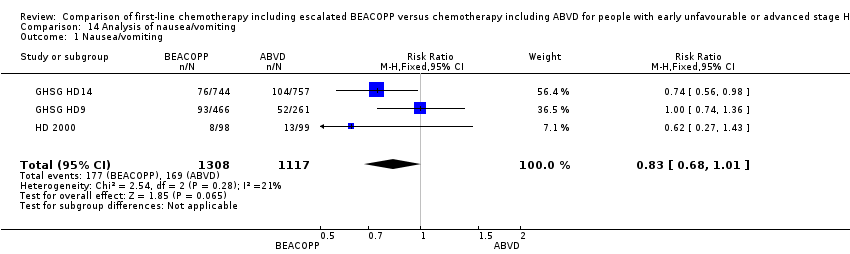 Comparison 14 Analysis of nausea/vomiting, Outcome 1 Nausea/vomiting. | ||||
| Outcome or subgroup title | No. of studies | No. of participants | Statistical method | Effect size |
| 1 Neurologic Show forest plot | 3 | 2425 | Risk Ratio (M‐H, Fixed, 95% CI) | 2.04 [1.19, 3.50] |
| Analysis 15.1  Comparison 15 Analysis of neurologic toxicity, Outcome 1 Neurologic. | ||||
| Outcome or subgroup title | No. of studies | No. of participants | Statistical method | Effect size |
| 1 Pain Show forest plot | 3 | 2425 | Risk Ratio (M‐H, Fixed, 95% CI) | 2.62 [1.76, 3.90] |
| Analysis 16.1 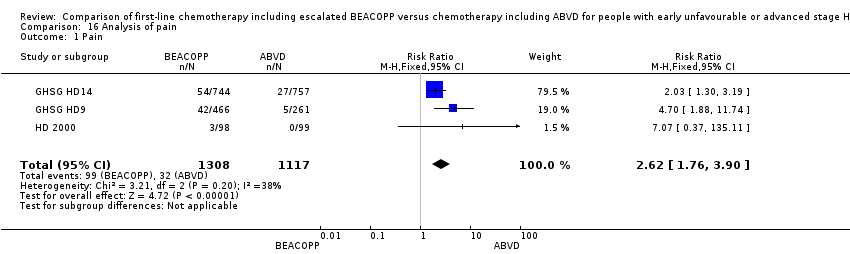 Comparison 16 Analysis of pain, Outcome 1 Pain. | ||||
| Outcome or subgroup title | No. of studies | No. of participants | Statistical method | Effect size |
| 1 Respiratory Show forest plot | 3 | 2549 | Risk Ratio (M‐H, Fixed, 95% CI) | 1.80 [1.01, 3.20] |
| Analysis 17.1  Comparison 17 Analysis of respiratory, Outcome 1 Respiratory. | ||||
| Outcome or subgroup title | No. of studies | No. of participants | Statistical method | Effect size |
| 1 Skin Show forest plot | 2 | 2227 | Risk Ratio (M‐H, Fixed, 95% CI) | 1.02 [0.45, 2.34] |
| Analysis 18.1  Comparison 18 Analysis of skin, Outcome 1 Skin. | ||||
| Outcome or subgroup title | No. of studies | No. of participants | Statistical method | Effect size |
| 1 heart Show forest plot | 2 | 1823 | Risk Ratio (M‐H, Fixed, 95% CI) | 1.04 [0.21, 5.10] |
| Analysis 19.1 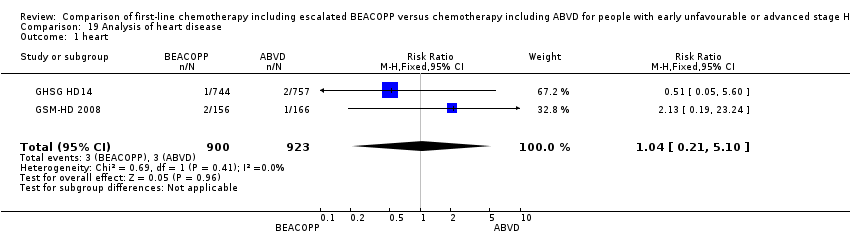 Comparison 19 Analysis of heart disease, Outcome 1 heart. | ||||
| Outcome or subgroup title | No. of studies | No. of participants | Statistical method | Effect size |
| 1 Freedom from first progression Show forest plot | 1 | 331 | Hazard Ratio (Fixed, 95% CI) | 0.46 [0.27, 0.78] |
| Analysis 20.1  Comparison 20 Analysis of freedom from first progression, Outcome 1 Freedom from first progression. | ||||
| Outcome or subgroup title | No. of studies | No. of participants | Statistical method | Effect size |
| 1 CR Show forest plot | 5 | 3427 | Risk Ratio (M‐H, Fixed, 95% CI) | 1.03 [1.01, 1.06] |
| Analysis 21.1  Comparison 21 Analysis of complete response (CR) rate, Outcome 1 CR. | ||||
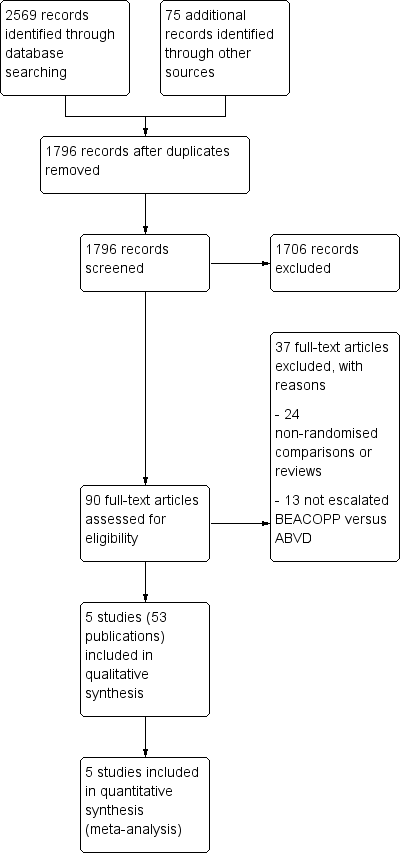
Study flow diagram.

Risk of bias summary: review authors' judgements about each risk of bias item for each included study.

Forest plot of comparison: 1 Analysis of Overall Survival, outcome: 1.1 OS ‐ all ‐ same recruitment period between the 2 arms (HD9).

Forest plot of comparison: 2 Analysis of Progression Free Survival, outcome: 2.1 PFS ‐ all ‐ same recruitment period between the 2 arms (HD9).
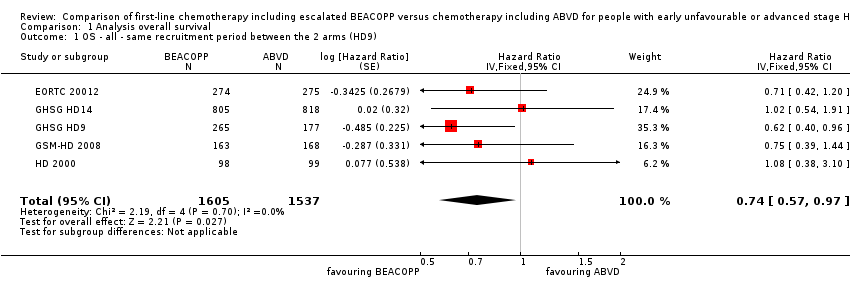
Comparison 1 Analysis overall survival, Outcome 1 OS ‐ all ‐ same recruitment period between the 2 arms (HD9).
Comparison 1 Analysis overall survival, Outcome 2 OS subgrouped by stage of disease.

Comparison 1 Analysis overall survival, Outcome 3 OS subgrouped by treatment.

Comparison 1 Analysis overall survival, Outcome 4 OS subgrouped by number of cycles of escalated BEACOPP.
Comparison 1 Analysis overall survival, Outcome 5 OS subgrouped by length of follow‐up.

Comparison 1 Analysis overall survival, Outcome 6 OS subgrouped by radiotherapy.

Comparison 1 Analysis overall survival, Outcome 7 OS ‐ all recruited patients (HD9) with potential risk of bias due to different time periods of recruitment.

Comparison 2 Analysis of progression‐free survival (PFS), Outcome 1 PFS ‐ all ‐ same recruitment period between the 2 arms (HD9).
Comparison 2 Analysis of progression‐free survival (PFS), Outcome 2 PFS subgrouped by stage of disease.

Comparison 2 Analysis of progression‐free survival (PFS), Outcome 3 PFS subgrouped by treatment.

Comparison 2 Analysis of progression‐free survival (PFS), Outcome 4 PFS subgrouped by number of cycles of escalated BEACOPP.

Comparison 2 Analysis of progression‐free survival (PFS), Outcome 5 PFS subgrouped by length of follow‐up.

Comparison 2 Analysis of progression‐free survival (PFS), Outcome 6 PFS subgrouped by type of radiotherapy.
Comparison 2 Analysis of progression‐free survival (PFS), Outcome 7 PFS ‐ all recruited patients (HD9) with potential risk of bias due to different time periods of recruitment.
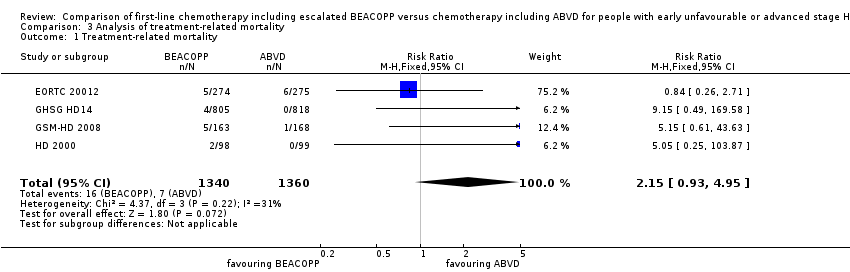
Comparison 3 Analysis of treatment‐related mortality, Outcome 1 Treatment‐related mortality.
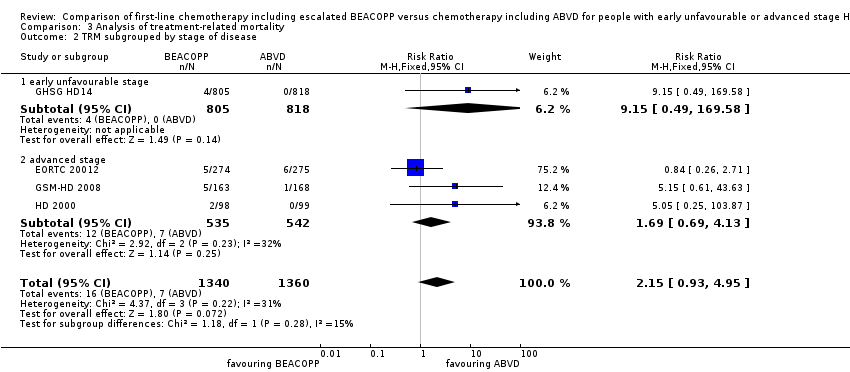
Comparison 3 Analysis of treatment‐related mortality, Outcome 2 TRM subgrouped by stage of disease.

Comparison 3 Analysis of treatment‐related mortality, Outcome 3 TRM subgrouped by number of cycles of escalated BEACOPP.

Comparison 3 Analysis of treatment‐related mortality, Outcome 4 TRM subgrouped by type of radiotherapy.
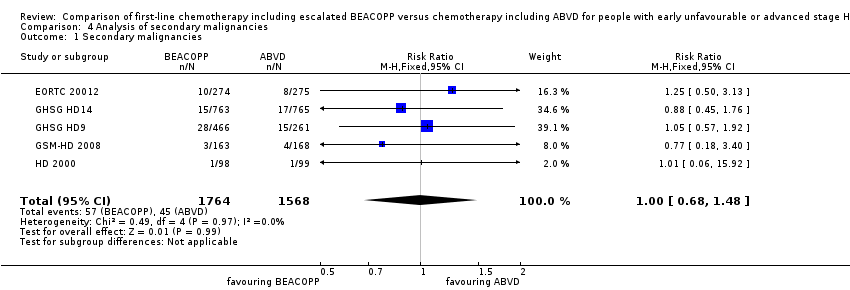
Comparison 4 Analysis of secondary malignancies, Outcome 1 Secondary malignancies.

Comparison 4 Analysis of secondary malignancies, Outcome 2 SM subgrouped by stage of disease.
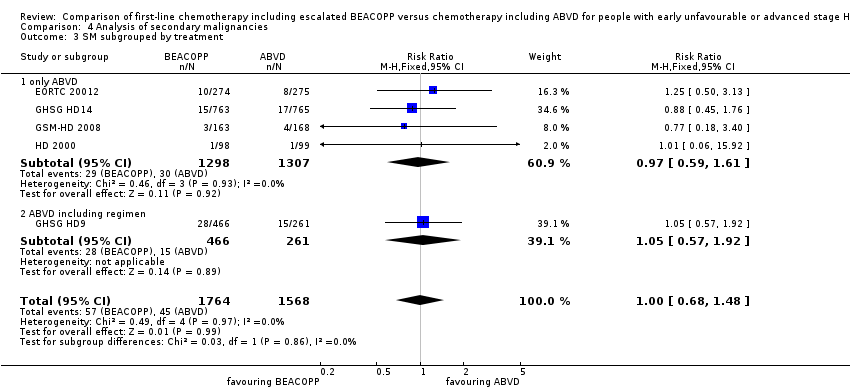
Comparison 4 Analysis of secondary malignancies, Outcome 3 SM subgrouped by treatment.
Comparison 4 Analysis of secondary malignancies, Outcome 4 SM subgrouped by number of cycles of escalated BEACOPP.

Comparison 4 Analysis of secondary malignancies, Outcome 5 SM subgrouped by type of radiotherapy.

Comparison 4 Analysis of secondary malignancies, Outcome 6 SM subgrouped by length of follow‐up.

Comparison 5 Analysis of AML or MDS, Outcome 1 AML or MDS.

Comparison 5 Analysis of AML or MDS, Outcome 2 AML/MDS subgrouped by stage of disease.

Comparison 5 Analysis of AML or MDS, Outcome 3 AML/MDS subgrouped by treatment.

Comparison 5 Analysis of AML or MDS, Outcome 4 AML/MDS subgrouped by number of cycles of escalated BEACOPP.

Comparison 5 Analysis of AML or MDS, Outcome 5 AML/MDS subgrouped by type of radiotherapy.
Comparison 5 Analysis of AML or MDS, Outcome 6 AML/MDS subgrouped by length of follow‐up.
Comparison 6 Analysis of fertility, Outcome 1 Secondary amenorrhoea.

Comparison 7 Analysis of anaemia, Outcome 1 Anaemia.

Comparison 8 Analysis of infection, Outcome 1 Infection.
Comparison 9 Analysis of neutropenia, Outcome 1 Neutropenia.

Comparison 10 Analysis of thrombocytopenia, Outcome 1 Thrombocytopenia.

Comparison 11 Analysis of alopecia, Outcome 1 Alopecia.

Comparison 12 Analysis of constipation, Outcome 1 Constipation.

Comparison 13 Analysis of mucositis, Outcome 1 Mucositis.

Comparison 14 Analysis of nausea/vomiting, Outcome 1 Nausea/vomiting.
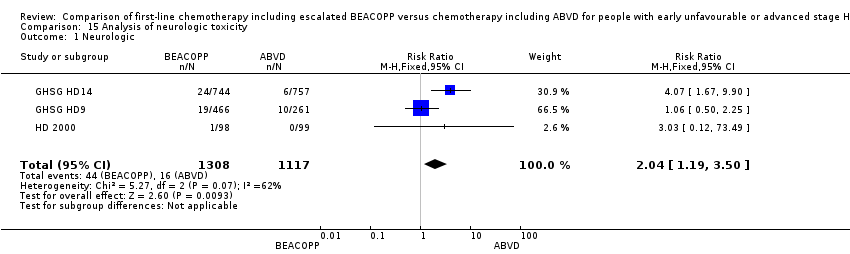
Comparison 15 Analysis of neurologic toxicity, Outcome 1 Neurologic.

Comparison 16 Analysis of pain, Outcome 1 Pain.

Comparison 17 Analysis of respiratory, Outcome 1 Respiratory.

Comparison 18 Analysis of skin, Outcome 1 Skin.

Comparison 19 Analysis of heart disease, Outcome 1 heart.

Comparison 20 Analysis of freedom from first progression, Outcome 1 Freedom from first progression.
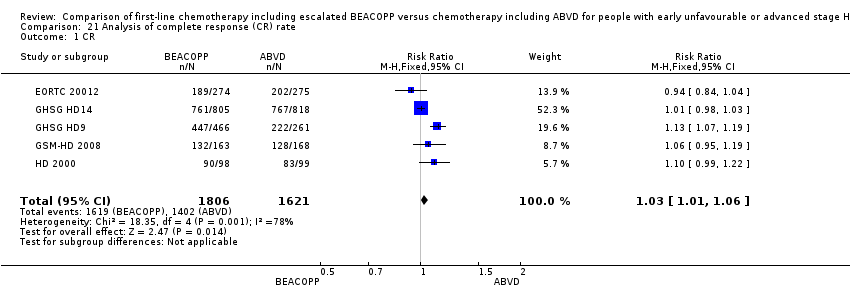
Comparison 21 Analysis of complete response (CR) rate, Outcome 1 CR.
| Comparison of chemotherapy including escalated BEACOPP versus chemotherapy including ABVD for people with early unfavourable or advanced stage Hodgkin lymphoma | ||||||
| Patient or population: Patients with early unfavourable or advanced stage HL | ||||||
| Outcomes | Anticipated absolute effects* (95% CI) | Relative effect | № of participants | Quality of the evidence | Comments | |
| Risk with ABVD | Risk with BEACOPP | |||||
| Mortality | Study population1 | HR 0.74 | 3142 | ⊕⊕⊕⊕ | To provide correct results by using the GRADE software, we calculated mortality instead of overall survival | |
| 120 per 1000 | 90 per 1000 | |||||
| Progression, relapse or death | Study population3 | HR 0.54 | 3142 | ⊕⊕⊕⊝ | To provide correct results by using the GRADE software, we calculated progression, relapse or death instead of progression‐free survival | |
| 250 per 1000 | 144 per 1000 | |||||
| Adverse event: treatment‐related mortality follow up median 5 years | Study population | RR 2.15 | 2700 | ⊕⊕⊝⊝ | ||
| 5 per 1000 | 11 per 1000 | |||||
| Adverse event: secondary malignancies follow up median 5 years | Study population | RR 1.00 | 3332 | ⊕⊕⊝⊝ | ||
| 29 per 1000 | 29 per 1000 | |||||
| Adverse event: secondary malignancies: AML or MDS | Study population | RR 3.90 | 3332 | ⊕⊕⊝⊝ | ||
| 3 per 1000 | 10 per 1000 | |||||
| Adverse event: infertility (secondary amenorrhoea) follow up median 5 years | Study population | RR 1.37 | 106 | ⊕⊝⊝⊝ | In the text referred to as infertility. | |
| 375 per 1000 | 514 per 1000 | |||||
| Quality of life | Not reported | |||||
| *The risk in the intervention group (and its 95% confidence interval) is based on the assumed risk in the comparison group and the relative effect of the intervention (and its 95% CI). | ||||||
| GRADE Working Group grades of evidence | ||||||
| 1 we estimated the risk of mortality after 5 years in the ABVD arm as being 12% 2 we estimated the risk of progress, relapse or mortality after 5 years in the ABVD arm as being 25% 3 one level down due to the open‐label design of the included trials which could lead to performance or detection biases 4 two levels down due to very few events and wide confidence intervals (imprecision) 5 one level down due to few events and wide confidence intervals (imprecision) 6 one level down due to indirect results (follow‐up period not long enough to detect meaningful differences) 7 one level down due to indirect results (secondary amenorrhoea measured instead of infertility) (indirectness) | ||||||
| Drug | Single Dose (mg/m2) | Route | Days given* |
| Bleomycin | 10 | IV | 8 |
| Etoposide | 200 | IV | 1 to 3 |
| Doxorubicin | 35 | IV | 1 |
| Cyclophosphamide | 1200 | IV | 1 |
| Vincristine | 1.4 | IV | 8 |
| Procarbazine | 100 | P.O. | 1 to 7 |
| Prednisone | 40 | P.O. | 1 to 14 |
| G‐CSF | SC | from day 8 | |
| *the regimen was repeated on day 22 IV: intravenously, P.O.: orally, SC: subcutaneous | |||
| Name of trial | Adverse event | Experimental arm (N) | Control arm (N) |
| Gastrointestinal, others | 43/744 | 14/757 | |
| Urogenital tract | 0/744 | 2/757 | |
| Drug fever | 17/744 | 6/757 | |
| Allergy | 12/744 | 2/757 | |
| Gastrointestinal, others | 9/156 | 3/166 | |
| Fever of unknown reason | 2/156 | 1/166 | |
| Others | 16/156 | 1/166 |
| Outcome or subgroup title | No. of studies | No. of participants | Statistical method | Effect size |
| 1 OS ‐ all ‐ same recruitment period between the 2 arms (HD9) Show forest plot | 5 | 3142 | Hazard Ratio (Fixed, 95% CI) | 0.74 [0.57, 0.97] |
| 2 OS subgrouped by stage of disease Show forest plot | 5 | 3142 | Hazard Ratio (Fixed, 95% CI) | 0.75 [0.57, 0.97] |
| 2.1 early unfavourable stage | 1 | 1623 | Hazard Ratio (Fixed, 95% CI) | 1.02 [0.54, 1.91] |
| 2.2 advanced stage | 4 | 1519 | Hazard Ratio (Fixed, 95% CI) | 0.70 [0.52, 0.93] |
| 3 OS subgrouped by treatment Show forest plot | 5 | 3142 | Hazard Ratio (Fixed, 95% CI) | 0.75 [0.57, 0.97] |
| 3.1 only ABVD regimen | 4 | 2700 | Hazard Ratio (Fixed, 95% CI) | 0.83 [0.60, 1.14] |
| 3.2 ABVD including regimen | 1 | 442 | Hazard Ratio (Fixed, 95% CI) | 0.62 [0.40, 0.96] |
| 4 OS subgrouped by number of cycles of escalated BEACOPP Show forest plot | 5 | 3142 | Hazard Ratio (Fixed, 95% CI) | 0.75 [0.57, 0.97] |
| 4.1 eight cycles of escalated BEACOPP | 1 | 442 | Hazard Ratio (Fixed, 95% CI) | 0.62 [0.40, 0.96] |
| 4.2 four cycles of escalated BEACOPP | 3 | 1077 | Hazard Ratio (Fixed, 95% CI) | 0.76 [0.52, 1.12] |
| 4.3 two cycles of escalated BEACOPP | 1 | 1623 | Hazard Ratio (Fixed, 95% CI) | 1.02 [0.54, 1.91] |
| 5 OS subgrouped by length of follow‐up Show forest plot | 5 | 3142 | Hazard Ratio (Fixed, 95% CI) | 0.75 [0.57, 0.97] |
| 5.1 short‐term follow‐up (median length up to 5 years) | 4 | 2700 | Hazard Ratio (Fixed, 95% CI) | 0.83 [0.60, 1.14] |
| 5.2 long‐term follow‐up (median length 10 years) | 1 | 442 | Hazard Ratio (Fixed, 95% CI) | 0.62 [0.40, 0.96] |
| 6 OS subgrouped by radiotherapy Show forest plot | 5 | 3132 | Hazard Ratio (Fixed, 95% CI) | 0.75 [0.57, 0.97] |
| 6.1 without radiotherapy | 1 | 549 | Hazard Ratio (Fixed, 95% CI) | 0.71 [0.42, 1.20] |
| 6.2 with radiotherapy | 4 | 2583 | Hazard Ratio (Fixed, 95% CI) | 0.76 [0.56, 1.02] |
| 7 OS ‐ all recruited patients (HD9) with potential risk of bias due to different time periods of recruitment Show forest plot | 5 | Hazard Ratio (Fixed, 95% CI) | 0.66 [0.52, 0.84] | |
| Outcome or subgroup title | No. of studies | No. of participants | Statistical method | Effect size |
| 1 PFS ‐ all ‐ same recruitment period between the 2 arms (HD9) Show forest plot | 5 | 3142 | Hazard Ratio (Fixed, 95% CI) | 0.54 [0.45, 0.64] |
| 2 PFS subgrouped by stage of disease Show forest plot | 5 | 3142 | Hazard Ratio (Fixed, 95% CI) | 0.54 [0.45, 0.64] |
| 2.1 early unfavourable stage | 1 | 1623 | Hazard Ratio (Fixed, 95% CI) | 0.47 [0.31, 0.71] |
| 2.2 advanced stage | 4 | 1519 | Hazard Ratio (Fixed, 95% CI) | 0.56 [0.46, 0.67] |
| 3 PFS subgrouped by treatment Show forest plot | 5 | 3142 | Hazard Ratio (Fixed, 95% CI) | 0.54 [0.45, 0.64] |
| 3.1 only ABVD regimen | 4 | 2700 | Hazard Ratio (Fixed, 95% CI) | 0.55 [0.45, 0.67] |
| 3.2 ABVD including regimen | 1 | 442 | Hazard Ratio (Fixed, 95% CI) | 0.50 [0.34, 0.72] |
| 4 PFS subgrouped by number of cycles of escalated BEACOPP Show forest plot | 5 | 3142 | Hazard Ratio (Fixed, 95% CI) | 0.54 [0.45, 0.64] |
| 4.1 eight cycles of escalated BEACOPP | 1 | 442 | Hazard Ratio (Fixed, 95% CI) | 0.50 [0.34, 0.72] |
| 4.2 four cycles of escalated BEACOPP | 3 | 1077 | Hazard Ratio (Fixed, 95% CI) | 0.58 [0.46, 0.72] |
| 4.3 two cycles of escalated BEACOPP | 1 | 1623 | Hazard Ratio (Fixed, 95% CI) | 0.47 [0.31, 0.71] |
| 5 PFS subgrouped by length of follow‐up Show forest plot | 5 | 3142 | Hazard Ratio (Fixed, 95% CI) | 0.54 [0.45, 0.64] |
| 5.1 short‐term follow‐up (median length up to 5 years) | 4 | 2700 | Hazard Ratio (Fixed, 95% CI) | 0.55 [0.45, 0.67] |
| 5.2 long‐term follow‐up (median length 10 years) | 1 | 442 | Hazard Ratio (Fixed, 95% CI) | 0.50 [0.34, 0.72] |
| 6 PFS subgrouped by type of radiotherapy Show forest plot | 5 | Hazard Ratio (Fixed, 95% CI) | 0.54 [0.45, 0.64] | |
| 6.1 without radiotherapy | 1 | Hazard Ratio (Fixed, 95% CI) | 0.58 [0.39, 0.86] | |
| 6.2 with radiotherapy | 4 | Hazard Ratio (Fixed, 95% CI) | 0.53 [0.44, 0.64] | |
| 7 PFS ‐ all recruited patients (HD9) with potential risk of bias due to different time periods of recruitment Show forest plot | 5 | Hazard Ratio (Fixed, 95% CI) | 0.51 [0.43, 0.60] | |
| Outcome or subgroup title | No. of studies | No. of participants | Statistical method | Effect size |
| 1 Treatment‐related mortality Show forest plot | 4 | 2700 | Risk Ratio (M‐H, Fixed, 95% CI) | 2.15 [0.93, 4.95] |
| 2 TRM subgrouped by stage of disease Show forest plot | 4 | 2700 | Risk Ratio (M‐H, Fixed, 95% CI) | 2.15 [0.93, 4.95] |
| 2.1 early unfavourable stage | 1 | 1623 | Risk Ratio (M‐H, Fixed, 95% CI) | 9.15 [0.49, 169.58] |
| 2.2 advanced stage | 3 | 1077 | Risk Ratio (M‐H, Fixed, 95% CI) | 1.69 [0.69, 4.13] |
| 3 TRM subgrouped by number of cycles of escalated BEACOPP Show forest plot | 4 | 2700 | Risk Ratio (M‐H, Fixed, 95% CI) | 2.15 [0.93, 4.95] |
| 3.1 four cycles of escalated BEAOPP | 3 | 1077 | Risk Ratio (M‐H, Fixed, 95% CI) | 1.69 [0.69, 4.13] |
| 3.2 two cycles of escalated BEACOPP | 1 | 1623 | Risk Ratio (M‐H, Fixed, 95% CI) | 9.15 [0.49, 169.58] |
| 4 TRM subgrouped by type of radiotherapy Show forest plot | 4 | 2700 | Risk Ratio (M‐H, Fixed, 95% CI) | 2.15 [0.93, 4.95] |
| 4.1 without radiotherapy | 1 | 549 | Risk Ratio (M‐H, Fixed, 95% CI) | 0.84 [0.26, 2.71] |
| 4.2 with radiotherapy | 3 | 2151 | Risk Ratio (M‐H, Fixed, 95% CI) | 6.13 [1.38, 27.26] |
| Outcome or subgroup title | No. of studies | No. of participants | Statistical method | Effect size |
| 1 Secondary malignancies Show forest plot | 5 | 3332 | Risk Ratio (M‐H, Fixed, 95% CI) | 1.00 [0.68, 1.48] |
| 2 SM subgrouped by stage of disease Show forest plot | 5 | 3332 | Risk Ratio (M‐H, Fixed, 95% CI) | 1.00 [0.68, 1.48] |
| 2.1 early unfavourable stage | 1 | 1528 | Risk Ratio (M‐H, Fixed, 95% CI) | 0.88 [0.45, 1.76] |
| 2.2 advanced stage | 4 | 1804 | Risk Ratio (M‐H, Fixed, 95% CI) | 1.06 [0.66, 1.70] |
| 3 SM subgrouped by treatment Show forest plot | 5 | 3332 | Risk Ratio (M‐H, Fixed, 95% CI) | 1.00 [0.68, 1.48] |
| 3.1 only ABVD | 4 | 2605 | Risk Ratio (M‐H, Fixed, 95% CI) | 0.97 [0.59, 1.61] |
| 3.2 ABVD including regimen | 1 | 727 | Risk Ratio (M‐H, Fixed, 95% CI) | 1.05 [0.57, 1.92] |
| 4 SM subgrouped by number of cycles of escalated BEACOPP Show forest plot | 5 | 3332 | Risk Ratio (M‐H, Fixed, 95% CI) | 1.00 [0.68, 1.48] |
| 4.1 eight cycles of escalated BEACOPP | 1 | 727 | Risk Ratio (M‐H, Fixed, 95% CI) | 1.05 [0.57, 1.92] |
| 4.2 four cycles of escalated BEAOPP | 3 | 1077 | Risk Ratio (M‐H, Fixed, 95% CI) | 1.09 [0.52, 2.29] |
| 4.3 two cycles of escalated BEACOPP | 1 | 1528 | Risk Ratio (M‐H, Fixed, 95% CI) | 0.88 [0.45, 1.76] |
| 5 SM subgrouped by type of radiotherapy Show forest plot | 5 | 3332 | Risk Ratio (M‐H, Fixed, 95% CI) | 1.00 [0.68, 1.48] |
| 5.1 without radiotherapy | 1 | 549 | Risk Ratio (M‐H, Fixed, 95% CI) | 1.25 [0.50, 3.13] |
| 5.2 with radiotherapy | 4 | 2783 | Risk Ratio (M‐H, Fixed, 95% CI) | 0.95 [0.62, 1.46] |
| 6 SM subgrouped by length of follow‐up Show forest plot | 5 | 3332 | Risk Ratio (M‐H, Fixed, 95% CI) | 1.00 [0.68, 1.48] |
| 6.1 short‐term follow‐up (median length up to 5 years) | 4 | 2605 | Risk Ratio (M‐H, Fixed, 95% CI) | 0.97 [0.59, 1.61] |
| 6.2 long‐term follow‐up (median length 10 years) | 1 | 727 | Risk Ratio (M‐H, Fixed, 95% CI) | 1.05 [0.57, 1.92] |
| Outcome or subgroup title | No. of studies | No. of participants | Statistical method | Effect size |
| 1 AML or MDS Show forest plot | 5 | 3332 | Risk Ratio (M‐H, Fixed, 95% CI) | 3.90 [1.36, 11.21] |
| 2 AML/MDS subgrouped by stage of disease Show forest plot | 5 | 3332 | Risk Ratio (M‐H, Fixed, 95% CI) | 3.90 [1.36, 11.21] |
| 2.1 early unfavourable stage | 1 | 1528 | Risk Ratio (M‐H, Fixed, 95% CI) | 5.01 [0.24, 104.25] |
| 2.2 advanced stage | 4 | 1804 | Risk Ratio (M‐H, Fixed, 95% CI) | 3.77 [1.22, 11.64] |
| 3 AML/MDS subgrouped by treatment Show forest plot | 5 | 3332 | Risk Ratio (M‐H, Fixed, 95% CI) | 3.90 [1.36, 11.21] |
| 3.1 only ABVD | 4 | 2605 | Risk Ratio (M‐H, Fixed, 95% CI) | 2.45 [0.71, 8.49] |
| 3.2 ABVD including regimen | 1 | 727 | Risk Ratio (M‐H, Fixed, 95% CI) | 7.84 [1.04, 59.29] |
| 4 AML/MDS subgrouped by number of cycles of escalated BEACOPP Show forest plot | 5 | 3332 | Risk Ratio (M‐H, Fixed, 95% CI) | 3.90 [1.36, 11.21] |
| 4.1 eight cycles of escalated BEACOPP | 1 | 727 | Risk Ratio (M‐H, Fixed, 95% CI) | 7.84 [1.04, 59.29] |
| 4.2 four cycles of escalated BEAOPP | 3 | 1077 | Risk Ratio (M‐H, Fixed, 95% CI) | 2.03 [0.51, 8.05] |
| 4.3 two cycles of escalated BEACOPP | 1 | 1528 | Risk Ratio (M‐H, Fixed, 95% CI) | 5.01 [0.24, 104.25] |
| 5 AML/MDS subgrouped by type of radiotherapy Show forest plot | 5 | 3332 | Risk Ratio (M‐H, Fixed, 95% CI) | 3.90 [1.36, 11.21] |
| 5.1 without radiotherapy | 1 | 549 | Risk Ratio (M‐H, Fixed, 95% CI) | 2.01 [0.37, 10.87] |
| 5.2 with radiotherapy | 4 | 2783 | Risk Ratio (M‐H, Fixed, 95% CI) | 5.27 [1.34, 20.74] |
| 6 AML/MDS subgrouped by length of follow‐up Show forest plot | 5 | 3332 | Risk Ratio (M‐H, Fixed, 95% CI) | 3.90 [1.36, 11.21] |
| 6.1 short‐ term follow‐up (median length up to 5 years) | 4 | 2605 | Risk Ratio (M‐H, Fixed, 95% CI) | 2.45 [0.71, 8.49] |
| 6.2 long‐ term follow‐up (median length 10 years) | 1 | 727 | Risk Ratio (M‐H, Fixed, 95% CI) | 7.84 [1.04, 59.29] |
| Outcome or subgroup title | No. of studies | No. of participants | Statistical method | Effect size |
| 1 Secondary amenorrhoea Show forest plot | 1 | 106 | Risk Ratio (M‐H, Fixed, 95% CI) | 1.37 [0.83, 2.26] |
| Outcome or subgroup title | No. of studies | No. of participants | Statistical method | Effect size |
| 1 Anaemia Show forest plot | 3 | 2425 | Risk Ratio (M‐H, Fixed, 95% CI) | 10.67 [7.14, 15.93] |
| Outcome or subgroup title | No. of studies | No. of participants | Statistical method | Effect size |
| 1 Infection Show forest plot | 3 | 2425 | Risk Ratio (M‐H, Fixed, 95% CI) | 3.73 [2.58, 5.38] |
| Outcome or subgroup title | No. of studies | No. of participants | Statistical method | Effect size |
| 1 Neutropenia Show forest plot | 2 | 519 | Risk Ratio (M‐H, Fixed, 95% CI) | 1.80 [1.52, 2.13] |
| Outcome or subgroup title | No. of studies | No. of participants | Statistical method | Effect size |
| 1 Thrombocytopenia Show forest plot | 3 | 2425 | Risk Ratio (M‐H, Fixed, 95% CI) | 18.12 [11.77, 27.92] |
| Outcome or subgroup title | No. of studies | No. of participants | Statistical method | Effect size |
| 1 Alopecia Show forest plot | 3 | 2425 | Risk Ratio (M‐H, Fixed, 95% CI) | 1.98 [1.78, 2.21] |
| Outcome or subgroup title | No. of studies | No. of participants | Statistical method | Effect size |
| 1 Constipation Show forest plot | 2 | 923 | Risk Ratio (M‐H, Fixed, 95% CI) | 1.19 [0.56, 2.55] |
| Outcome or subgroup title | No. of studies | No. of participants | Statistical method | Effect size |
| 1 Mucositis Show forest plot | 3 | 2425 | Risk Ratio (M‐H, Fixed, 95% CI) | 8.04 [3.72, 17.38] |
| Outcome or subgroup title | No. of studies | No. of participants | Statistical method | Effect size |
| 1 Nausea/vomiting Show forest plot | 3 | 2425 | Risk Ratio (M‐H, Fixed, 95% CI) | 0.83 [0.68, 1.01] |
| Outcome or subgroup title | No. of studies | No. of participants | Statistical method | Effect size |
| 1 Neurologic Show forest plot | 3 | 2425 | Risk Ratio (M‐H, Fixed, 95% CI) | 2.04 [1.19, 3.50] |
| Outcome or subgroup title | No. of studies | No. of participants | Statistical method | Effect size |
| 1 Pain Show forest plot | 3 | 2425 | Risk Ratio (M‐H, Fixed, 95% CI) | 2.62 [1.76, 3.90] |
| Outcome or subgroup title | No. of studies | No. of participants | Statistical method | Effect size |
| 1 Respiratory Show forest plot | 3 | 2549 | Risk Ratio (M‐H, Fixed, 95% CI) | 1.80 [1.01, 3.20] |
| Outcome or subgroup title | No. of studies | No. of participants | Statistical method | Effect size |
| 1 Skin Show forest plot | 2 | 2227 | Risk Ratio (M‐H, Fixed, 95% CI) | 1.02 [0.45, 2.34] |
| Outcome or subgroup title | No. of studies | No. of participants | Statistical method | Effect size |
| 1 heart Show forest plot | 2 | 1823 | Risk Ratio (M‐H, Fixed, 95% CI) | 1.04 [0.21, 5.10] |
| Outcome or subgroup title | No. of studies | No. of participants | Statistical method | Effect size |
| 1 Freedom from first progression Show forest plot | 1 | 331 | Hazard Ratio (Fixed, 95% CI) | 0.46 [0.27, 0.78] |
| Outcome or subgroup title | No. of studies | No. of participants | Statistical method | Effect size |
| 1 CR Show forest plot | 5 | 3427 | Risk Ratio (M‐H, Fixed, 95% CI) | 1.03 [1.01, 1.06] |