Comparación de la quimioterapia de primera línea con BEACOPP escalonado y la quimioterapia con ABVD para pacientes con linfoma de Hodgkin avanzado o temprano no favorable
Información
- DOI:
- https://doi.org/10.1002/14651858.CD007941.pub3Copiar DOI

- Base de datos:
-
- Cochrane Database of Systematic Reviews
- Versión publicada:
-
- 25 mayo 2017see what's new
- Tipo:
-
- Intervention
- Etapa:
-
- Review
- Grupo Editorial Cochrane:
-
Grupo Cochrane de Hematología
- Copyright:
-
- Copyright © 2017 The Cochrane Collaboration. Published by John Wiley & Sons, Ltd.
Cifras del artículo
Altmetric:
Citado por:
Autores
Contributions of authors
AW: data extraction.
IM: development of the search strategy.
AE: clinical expertise.
CB: conception of the primary review, writing of the protocol, data extraction in the primary and updated review, statistical expertise, grant application for the primary review.
BT: clinical expertise.
NS: data extraction, methodological expertise, writing updated review
All authors have read and accepted the final version of the updated review.
Sources of support
Internal sources
-
No sources of support supplied
External sources
-
This review was funded by the Federal Ministry of Education and Research, Germany.
Declarations of interest
AW: none known
IM: none known
CB: none known
AE is chairman of the German Hodgkin Study Group and conducted two of the five included studies (GHSG HD9; GHSG HD14).
BT is study physician of the GHSG and was sub‐investigator in GHSG HD14.
NS: none known
Acknowledgements
We are grateful to the following persons for their comments and improving the protocol and review.
Professor Lena Specht and Professor Keith Wheatley, Editors of the Cochrane Haematological Malignancies Group, Céline Fournier, consumer feedback, Sabine Kluge, Ina Monsef and Bettina Schmidtke of the Cochrane Haematological Malignancies Group.
Furthermore, we would like to thank Jeremy Franklin for providing the recalculated data of the GHSG HD9 trial.
Version history
| Published | Title | Stage | Authors | Version |
| 2017 May 25 | Comparison of first‐line chemotherapy including escalated BEACOPP versus chemotherapy including ABVD for people with early unfavourable or advanced stage Hodgkin lymphoma | Review | Nicole Skoetz, Andrea Will, Ina Monsef, Corinne Brillant, Andreas Engert, Bastian von Tresckow | |
| 2011 Aug 10 | Comparison of chemotherapy including escalated BEACOPP versus chemotherapy including ABVD for patients with early unfavourable or advanced stage Hodgkin lymphoma | Review | Kathrin Bauer, Nicole Skoetz, Ina Monsef, Andreas Engert, Corinne Brillant | |
| 2009 Jul 08 | Comparison of chemotherapy including escalated BEACOPP versus chemotherapy including ABVD for patients with early unfavourable or advanced stage Hodgkin lymphoma | Protocol | Corinne Brillant, Kathrin Bauer, Christine Herbst, Ina Monsef, Nicole Skoetz, Andreas Engert | |
Differences between protocol and review
We searched more trial registries than mentioned in the previous version to identify all ongoing and completed trials in this field.
We restricted subgroup and sensitivity analyses to the outcomes reported in the 'Summary of findings' table, to provide clinically meaningful results.
In the 'Summary of findings' table we replaced the endpoint complete response rate by quality of life which we consider a more patient‐relevant outcome.
Notes
Some passages in this review, especially in the methods part, are from the standard template of the Cochrane Haematological Malignancies Review Group.
Keywords
MeSH
Medical Subject Headings (MeSH) Keywords
- Antineoplastic Combined Chemotherapy Protocols [administration & dosage, adverse effects, *therapeutic use];
- Bleomycin [administration & dosage, adverse effects];
- Cyclophosphamide [administration & dosage, adverse effects];
- Dacarbazine [administration & dosage, adverse effects];
- Disease Progression;
- Doxorubicin [administration & dosage, adverse effects];
- Etoposide [administration & dosage, adverse effects];
- Hodgkin Disease [*drug therapy, mortality, pathology];
- Prednisone [administration & dosage, adverse effects];
- Procarbazine [administration & dosage, adverse effects];
- Randomized Controlled Trials as Topic;
- Vinblastine [administration & dosage, adverse effects];
- Vincristine [administration & dosage, adverse effects];
Medical Subject Headings Check Words
Adolescent; Adult; Humans; Middle Aged; Young Adult;
PICO
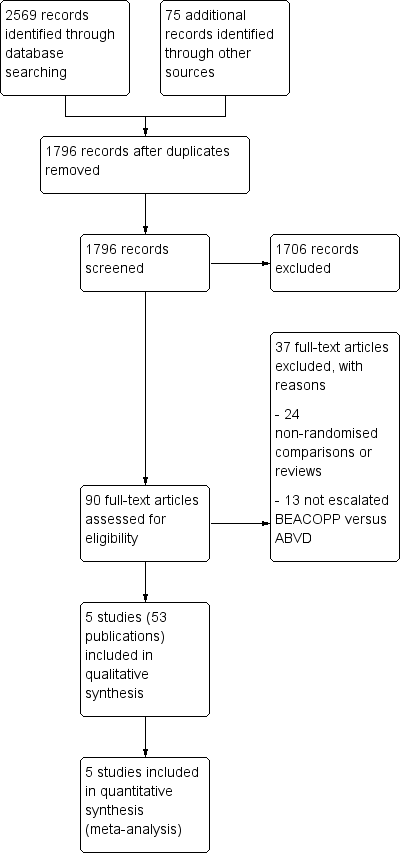
Study flow diagram.

Risk of bias summary: review authors' judgements about each risk of bias item for each included study.

Forest plot of comparison: 1 Analysis of Overall Survival, outcome: 1.1 OS ‐ all ‐ same recruitment period between the 2 arms (HD9).

Forest plot of comparison: 2 Analysis of Progression Free Survival, outcome: 2.1 PFS ‐ all ‐ same recruitment period between the 2 arms (HD9).
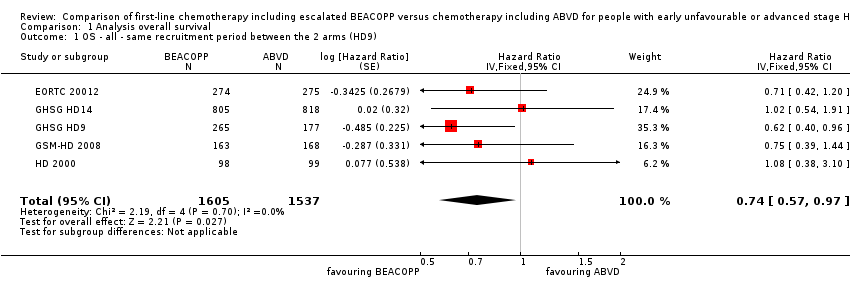
Comparison 1 Analysis overall survival, Outcome 1 OS ‐ all ‐ same recruitment period between the 2 arms (HD9).
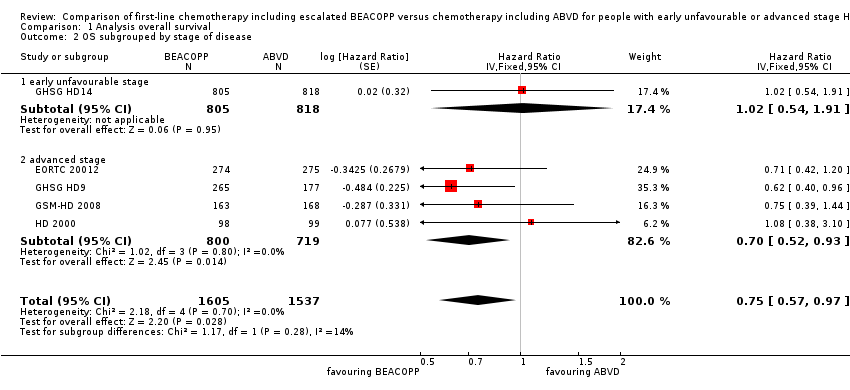
Comparison 1 Analysis overall survival, Outcome 2 OS subgrouped by stage of disease.

Comparison 1 Analysis overall survival, Outcome 3 OS subgrouped by treatment.

Comparison 1 Analysis overall survival, Outcome 4 OS subgrouped by number of cycles of escalated BEACOPP.
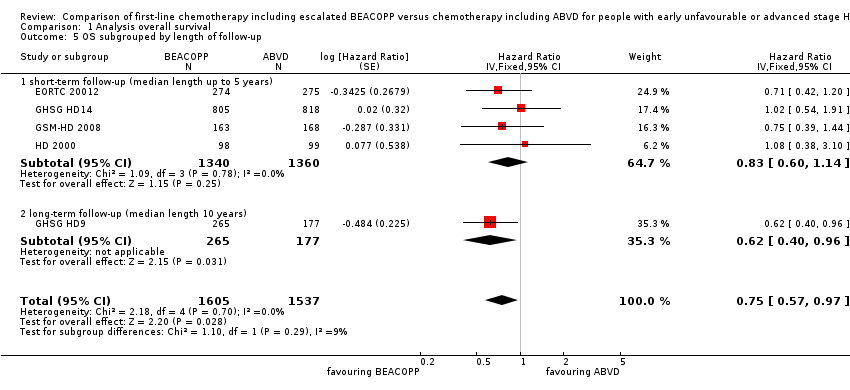
Comparison 1 Analysis overall survival, Outcome 5 OS subgrouped by length of follow‐up.

Comparison 1 Analysis overall survival, Outcome 6 OS subgrouped by radiotherapy.

Comparison 1 Analysis overall survival, Outcome 7 OS ‐ all recruited patients (HD9) with potential risk of bias due to different time periods of recruitment.

Comparison 2 Analysis of progression‐free survival (PFS), Outcome 1 PFS ‐ all ‐ same recruitment period between the 2 arms (HD9).
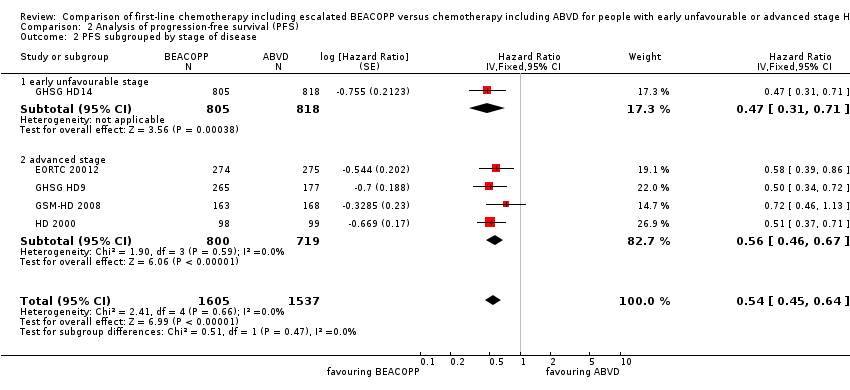
Comparison 2 Analysis of progression‐free survival (PFS), Outcome 2 PFS subgrouped by stage of disease.

Comparison 2 Analysis of progression‐free survival (PFS), Outcome 3 PFS subgrouped by treatment.

Comparison 2 Analysis of progression‐free survival (PFS), Outcome 4 PFS subgrouped by number of cycles of escalated BEACOPP.

Comparison 2 Analysis of progression‐free survival (PFS), Outcome 5 PFS subgrouped by length of follow‐up.

Comparison 2 Analysis of progression‐free survival (PFS), Outcome 6 PFS subgrouped by type of radiotherapy.
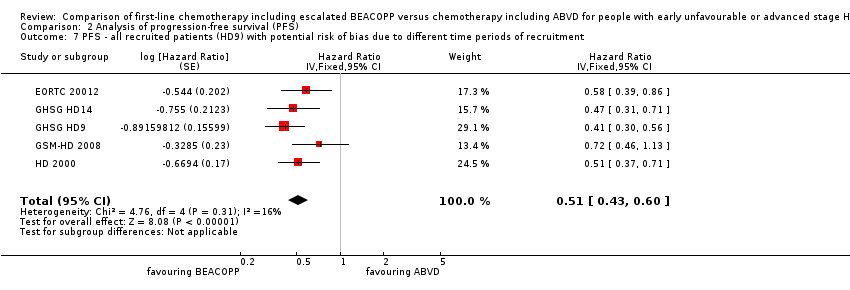
Comparison 2 Analysis of progression‐free survival (PFS), Outcome 7 PFS ‐ all recruited patients (HD9) with potential risk of bias due to different time periods of recruitment.
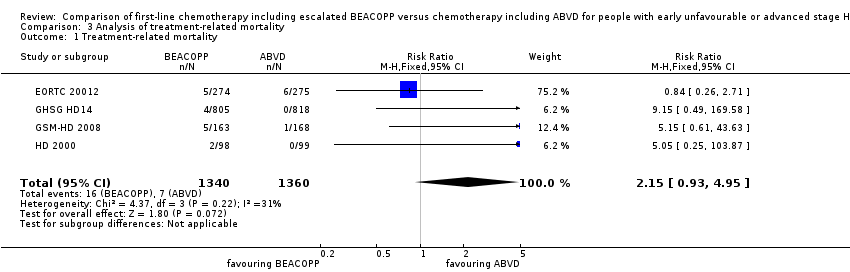
Comparison 3 Analysis of treatment‐related mortality, Outcome 1 Treatment‐related mortality.
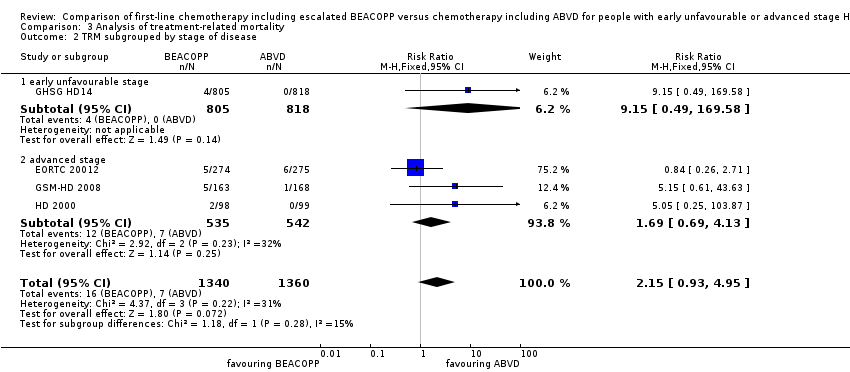
Comparison 3 Analysis of treatment‐related mortality, Outcome 2 TRM subgrouped by stage of disease.

Comparison 3 Analysis of treatment‐related mortality, Outcome 3 TRM subgrouped by number of cycles of escalated BEACOPP.

Comparison 3 Analysis of treatment‐related mortality, Outcome 4 TRM subgrouped by type of radiotherapy.
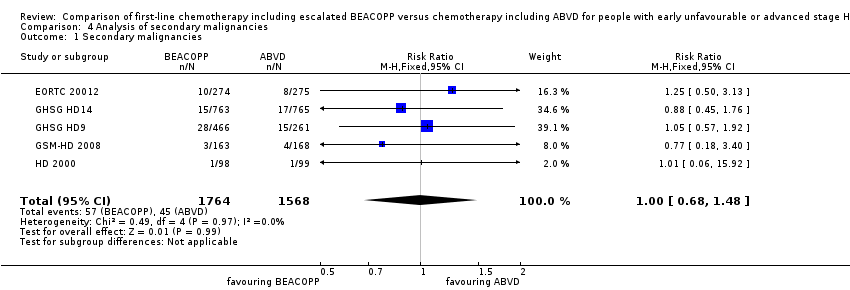
Comparison 4 Analysis of secondary malignancies, Outcome 1 Secondary malignancies.

Comparison 4 Analysis of secondary malignancies, Outcome 2 SM subgrouped by stage of disease.
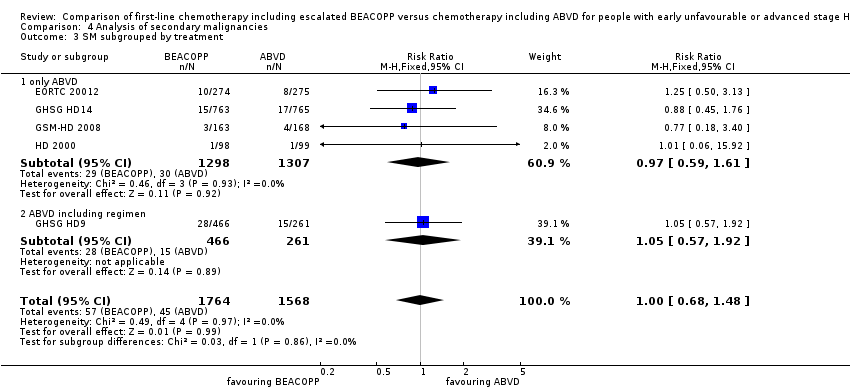
Comparison 4 Analysis of secondary malignancies, Outcome 3 SM subgrouped by treatment.
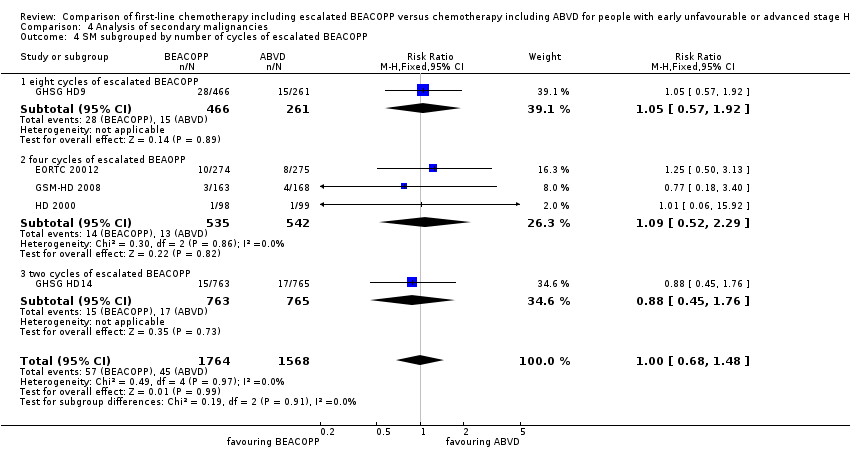
Comparison 4 Analysis of secondary malignancies, Outcome 4 SM subgrouped by number of cycles of escalated BEACOPP.
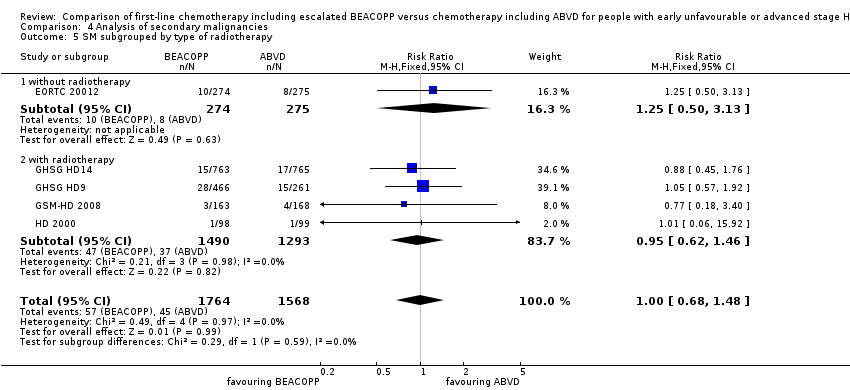
Comparison 4 Analysis of secondary malignancies, Outcome 5 SM subgrouped by type of radiotherapy.

Comparison 4 Analysis of secondary malignancies, Outcome 6 SM subgrouped by length of follow‐up.

Comparison 5 Analysis of AML or MDS, Outcome 1 AML or MDS.

Comparison 5 Analysis of AML or MDS, Outcome 2 AML/MDS subgrouped by stage of disease.

Comparison 5 Analysis of AML or MDS, Outcome 3 AML/MDS subgrouped by treatment.

Comparison 5 Analysis of AML or MDS, Outcome 4 AML/MDS subgrouped by number of cycles of escalated BEACOPP.

Comparison 5 Analysis of AML or MDS, Outcome 5 AML/MDS subgrouped by type of radiotherapy.
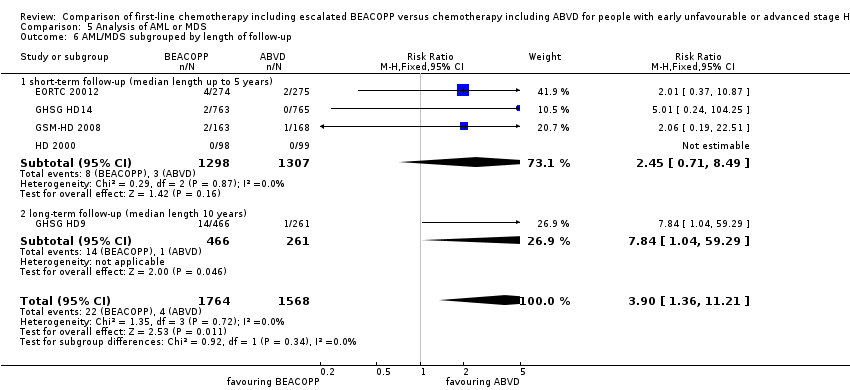
Comparison 5 Analysis of AML or MDS, Outcome 6 AML/MDS subgrouped by length of follow‐up.
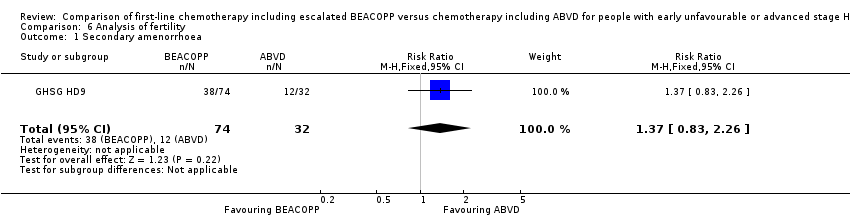
Comparison 6 Analysis of fertility, Outcome 1 Secondary amenorrhoea.

Comparison 7 Analysis of anaemia, Outcome 1 Anaemia.

Comparison 8 Analysis of infection, Outcome 1 Infection.
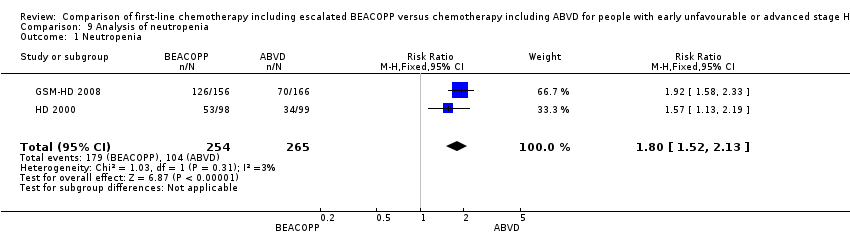
Comparison 9 Analysis of neutropenia, Outcome 1 Neutropenia.

Comparison 10 Analysis of thrombocytopenia, Outcome 1 Thrombocytopenia.

Comparison 11 Analysis of alopecia, Outcome 1 Alopecia.

Comparison 12 Analysis of constipation, Outcome 1 Constipation.

Comparison 13 Analysis of mucositis, Outcome 1 Mucositis.

Comparison 14 Analysis of nausea/vomiting, Outcome 1 Nausea/vomiting.
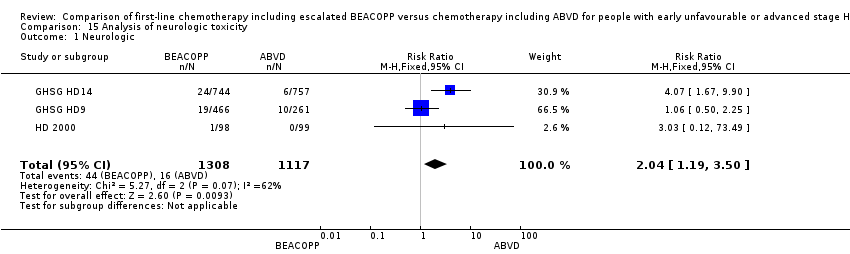
Comparison 15 Analysis of neurologic toxicity, Outcome 1 Neurologic.

Comparison 16 Analysis of pain, Outcome 1 Pain.

Comparison 17 Analysis of respiratory, Outcome 1 Respiratory.

Comparison 18 Analysis of skin, Outcome 1 Skin.

Comparison 19 Analysis of heart disease, Outcome 1 heart.

Comparison 20 Analysis of freedom from first progression, Outcome 1 Freedom from first progression.
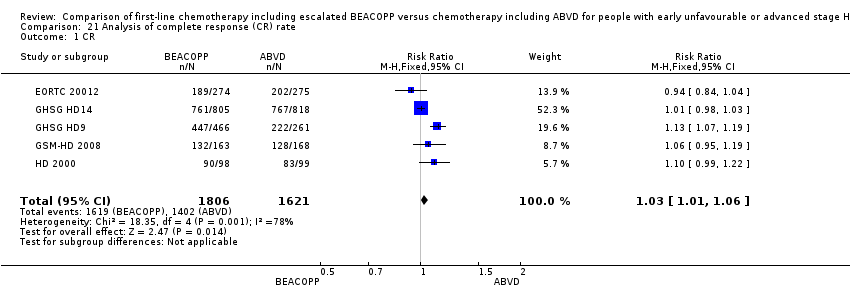
Comparison 21 Analysis of complete response (CR) rate, Outcome 1 CR.
| Comparison of chemotherapy including escalated BEACOPP versus chemotherapy including ABVD for people with early unfavourable or advanced stage Hodgkin lymphoma | ||||||
| Patient or population: Patients with early unfavourable or advanced stage HL | ||||||
| Outcomes | Anticipated absolute effects* (95% CI) | Relative effect | № of participants | Quality of the evidence | Comments | |
| Risk with ABVD | Risk with BEACOPP | |||||
| Mortality | Study population1 | HR 0.74 | 3142 | ⊕⊕⊕⊕ | To provide correct results by using the GRADE software, we calculated mortality instead of overall survival | |
| 120 per 1000 | 90 per 1000 | |||||
| Progression, relapse or death | Study population3 | HR 0.54 | 3142 | ⊕⊕⊕⊝ | To provide correct results by using the GRADE software, we calculated progression, relapse or death instead of progression‐free survival | |
| 250 per 1000 | 144 per 1000 | |||||
| Adverse event: treatment‐related mortality follow up median 5 years | Study population | RR 2.15 | 2700 | ⊕⊕⊝⊝ | ||
| 5 per 1000 | 11 per 1000 | |||||
| Adverse event: secondary malignancies follow up median 5 years | Study population | RR 1.00 | 3332 | ⊕⊕⊝⊝ | ||
| 29 per 1000 | 29 per 1000 | |||||
| Adverse event: secondary malignancies: AML or MDS | Study population | RR 3.90 | 3332 | ⊕⊕⊝⊝ | ||
| 3 per 1000 | 10 per 1000 | |||||
| Adverse event: infertility (secondary amenorrhoea) follow up median 5 years | Study population | RR 1.37 | 106 | ⊕⊝⊝⊝ | In the text referred to as infertility. | |
| 375 per 1000 | 514 per 1000 | |||||
| Quality of life | Not reported | |||||
| *The risk in the intervention group (and its 95% confidence interval) is based on the assumed risk in the comparison group and the relative effect of the intervention (and its 95% CI). | ||||||
| GRADE Working Group grades of evidence | ||||||
| 1 we estimated the risk of mortality after 5 years in the ABVD arm as being 12% 2 we estimated the risk of progress, relapse or mortality after 5 years in the ABVD arm as being 25% 3 one level down due to the open‐label design of the included trials which could lead to performance or detection biases 4 two levels down due to very few events and wide confidence intervals (imprecision) 5 one level down due to few events and wide confidence intervals (imprecision) 6 one level down due to indirect results (follow‐up period not long enough to detect meaningful differences) 7 one level down due to indirect results (secondary amenorrhoea measured instead of infertility) (indirectness) | ||||||
| Drug | Single Dose (mg/m2) | Route | Days given* |
| Bleomycin | 10 | IV | 8 |
| Etoposide | 200 | IV | 1 to 3 |
| Doxorubicin | 35 | IV | 1 |
| Cyclophosphamide | 1200 | IV | 1 |
| Vincristine | 1.4 | IV | 8 |
| Procarbazine | 100 | P.O. | 1 to 7 |
| Prednisone | 40 | P.O. | 1 to 14 |
| G‐CSF | SC | from day 8 | |
| *the regimen was repeated on day 22 IV: intravenously, P.O.: orally, SC: subcutaneous | |||
| Name of trial | Adverse event | Experimental arm (N) | Control arm (N) |
| Gastrointestinal, others | 43/744 | 14/757 | |
| Urogenital tract | 0/744 | 2/757 | |
| Drug fever | 17/744 | 6/757 | |
| Allergy | 12/744 | 2/757 | |
| Gastrointestinal, others | 9/156 | 3/166 | |
| Fever of unknown reason | 2/156 | 1/166 | |
| Others | 16/156 | 1/166 |
| Outcome or subgroup title | No. of studies | No. of participants | Statistical method | Effect size |
| 1 OS ‐ all ‐ same recruitment period between the 2 arms (HD9) Show forest plot | 5 | 3142 | Hazard Ratio (Fixed, 95% CI) | 0.74 [0.57, 0.97] |
| 2 OS subgrouped by stage of disease Show forest plot | 5 | 3142 | Hazard Ratio (Fixed, 95% CI) | 0.75 [0.57, 0.97] |
| 2.1 early unfavourable stage | 1 | 1623 | Hazard Ratio (Fixed, 95% CI) | 1.02 [0.54, 1.91] |
| 2.2 advanced stage | 4 | 1519 | Hazard Ratio (Fixed, 95% CI) | 0.70 [0.52, 0.93] |
| 3 OS subgrouped by treatment Show forest plot | 5 | 3142 | Hazard Ratio (Fixed, 95% CI) | 0.75 [0.57, 0.97] |
| 3.1 only ABVD regimen | 4 | 2700 | Hazard Ratio (Fixed, 95% CI) | 0.83 [0.60, 1.14] |
| 3.2 ABVD including regimen | 1 | 442 | Hazard Ratio (Fixed, 95% CI) | 0.62 [0.40, 0.96] |
| 4 OS subgrouped by number of cycles of escalated BEACOPP Show forest plot | 5 | 3142 | Hazard Ratio (Fixed, 95% CI) | 0.75 [0.57, 0.97] |
| 4.1 eight cycles of escalated BEACOPP | 1 | 442 | Hazard Ratio (Fixed, 95% CI) | 0.62 [0.40, 0.96] |
| 4.2 four cycles of escalated BEACOPP | 3 | 1077 | Hazard Ratio (Fixed, 95% CI) | 0.76 [0.52, 1.12] |
| 4.3 two cycles of escalated BEACOPP | 1 | 1623 | Hazard Ratio (Fixed, 95% CI) | 1.02 [0.54, 1.91] |
| 5 OS subgrouped by length of follow‐up Show forest plot | 5 | 3142 | Hazard Ratio (Fixed, 95% CI) | 0.75 [0.57, 0.97] |
| 5.1 short‐term follow‐up (median length up to 5 years) | 4 | 2700 | Hazard Ratio (Fixed, 95% CI) | 0.83 [0.60, 1.14] |
| 5.2 long‐term follow‐up (median length 10 years) | 1 | 442 | Hazard Ratio (Fixed, 95% CI) | 0.62 [0.40, 0.96] |
| 6 OS subgrouped by radiotherapy Show forest plot | 5 | 3132 | Hazard Ratio (Fixed, 95% CI) | 0.75 [0.57, 0.97] |
| 6.1 without radiotherapy | 1 | 549 | Hazard Ratio (Fixed, 95% CI) | 0.71 [0.42, 1.20] |
| 6.2 with radiotherapy | 4 | 2583 | Hazard Ratio (Fixed, 95% CI) | 0.76 [0.56, 1.02] |
| 7 OS ‐ all recruited patients (HD9) with potential risk of bias due to different time periods of recruitment Show forest plot | 5 | Hazard Ratio (Fixed, 95% CI) | 0.66 [0.52, 0.84] | |
| Outcome or subgroup title | No. of studies | No. of participants | Statistical method | Effect size |
| 1 PFS ‐ all ‐ same recruitment period between the 2 arms (HD9) Show forest plot | 5 | 3142 | Hazard Ratio (Fixed, 95% CI) | 0.54 [0.45, 0.64] |
| 2 PFS subgrouped by stage of disease Show forest plot | 5 | 3142 | Hazard Ratio (Fixed, 95% CI) | 0.54 [0.45, 0.64] |
| 2.1 early unfavourable stage | 1 | 1623 | Hazard Ratio (Fixed, 95% CI) | 0.47 [0.31, 0.71] |
| 2.2 advanced stage | 4 | 1519 | Hazard Ratio (Fixed, 95% CI) | 0.56 [0.46, 0.67] |
| 3 PFS subgrouped by treatment Show forest plot | 5 | 3142 | Hazard Ratio (Fixed, 95% CI) | 0.54 [0.45, 0.64] |
| 3.1 only ABVD regimen | 4 | 2700 | Hazard Ratio (Fixed, 95% CI) | 0.55 [0.45, 0.67] |
| 3.2 ABVD including regimen | 1 | 442 | Hazard Ratio (Fixed, 95% CI) | 0.50 [0.34, 0.72] |
| 4 PFS subgrouped by number of cycles of escalated BEACOPP Show forest plot | 5 | 3142 | Hazard Ratio (Fixed, 95% CI) | 0.54 [0.45, 0.64] |
| 4.1 eight cycles of escalated BEACOPP | 1 | 442 | Hazard Ratio (Fixed, 95% CI) | 0.50 [0.34, 0.72] |
| 4.2 four cycles of escalated BEACOPP | 3 | 1077 | Hazard Ratio (Fixed, 95% CI) | 0.58 [0.46, 0.72] |
| 4.3 two cycles of escalated BEACOPP | 1 | 1623 | Hazard Ratio (Fixed, 95% CI) | 0.47 [0.31, 0.71] |
| 5 PFS subgrouped by length of follow‐up Show forest plot | 5 | 3142 | Hazard Ratio (Fixed, 95% CI) | 0.54 [0.45, 0.64] |
| 5.1 short‐term follow‐up (median length up to 5 years) | 4 | 2700 | Hazard Ratio (Fixed, 95% CI) | 0.55 [0.45, 0.67] |
| 5.2 long‐term follow‐up (median length 10 years) | 1 | 442 | Hazard Ratio (Fixed, 95% CI) | 0.50 [0.34, 0.72] |
| 6 PFS subgrouped by type of radiotherapy Show forest plot | 5 | Hazard Ratio (Fixed, 95% CI) | 0.54 [0.45, 0.64] | |
| 6.1 without radiotherapy | 1 | Hazard Ratio (Fixed, 95% CI) | 0.58 [0.39, 0.86] | |
| 6.2 with radiotherapy | 4 | Hazard Ratio (Fixed, 95% CI) | 0.53 [0.44, 0.64] | |
| 7 PFS ‐ all recruited patients (HD9) with potential risk of bias due to different time periods of recruitment Show forest plot | 5 | Hazard Ratio (Fixed, 95% CI) | 0.51 [0.43, 0.60] | |
| Outcome or subgroup title | No. of studies | No. of participants | Statistical method | Effect size |
| 1 Treatment‐related mortality Show forest plot | 4 | 2700 | Risk Ratio (M‐H, Fixed, 95% CI) | 2.15 [0.93, 4.95] |
| 2 TRM subgrouped by stage of disease Show forest plot | 4 | 2700 | Risk Ratio (M‐H, Fixed, 95% CI) | 2.15 [0.93, 4.95] |
| 2.1 early unfavourable stage | 1 | 1623 | Risk Ratio (M‐H, Fixed, 95% CI) | 9.15 [0.49, 169.58] |
| 2.2 advanced stage | 3 | 1077 | Risk Ratio (M‐H, Fixed, 95% CI) | 1.69 [0.69, 4.13] |
| 3 TRM subgrouped by number of cycles of escalated BEACOPP Show forest plot | 4 | 2700 | Risk Ratio (M‐H, Fixed, 95% CI) | 2.15 [0.93, 4.95] |
| 3.1 four cycles of escalated BEAOPP | 3 | 1077 | Risk Ratio (M‐H, Fixed, 95% CI) | 1.69 [0.69, 4.13] |
| 3.2 two cycles of escalated BEACOPP | 1 | 1623 | Risk Ratio (M‐H, Fixed, 95% CI) | 9.15 [0.49, 169.58] |
| 4 TRM subgrouped by type of radiotherapy Show forest plot | 4 | 2700 | Risk Ratio (M‐H, Fixed, 95% CI) | 2.15 [0.93, 4.95] |
| 4.1 without radiotherapy | 1 | 549 | Risk Ratio (M‐H, Fixed, 95% CI) | 0.84 [0.26, 2.71] |
| 4.2 with radiotherapy | 3 | 2151 | Risk Ratio (M‐H, Fixed, 95% CI) | 6.13 [1.38, 27.26] |
| Outcome or subgroup title | No. of studies | No. of participants | Statistical method | Effect size |
| 1 Secondary malignancies Show forest plot | 5 | 3332 | Risk Ratio (M‐H, Fixed, 95% CI) | 1.00 [0.68, 1.48] |
| 2 SM subgrouped by stage of disease Show forest plot | 5 | 3332 | Risk Ratio (M‐H, Fixed, 95% CI) | 1.00 [0.68, 1.48] |
| 2.1 early unfavourable stage | 1 | 1528 | Risk Ratio (M‐H, Fixed, 95% CI) | 0.88 [0.45, 1.76] |
| 2.2 advanced stage | 4 | 1804 | Risk Ratio (M‐H, Fixed, 95% CI) | 1.06 [0.66, 1.70] |
| 3 SM subgrouped by treatment Show forest plot | 5 | 3332 | Risk Ratio (M‐H, Fixed, 95% CI) | 1.00 [0.68, 1.48] |
| 3.1 only ABVD | 4 | 2605 | Risk Ratio (M‐H, Fixed, 95% CI) | 0.97 [0.59, 1.61] |
| 3.2 ABVD including regimen | 1 | 727 | Risk Ratio (M‐H, Fixed, 95% CI) | 1.05 [0.57, 1.92] |
| 4 SM subgrouped by number of cycles of escalated BEACOPP Show forest plot | 5 | 3332 | Risk Ratio (M‐H, Fixed, 95% CI) | 1.00 [0.68, 1.48] |
| 4.1 eight cycles of escalated BEACOPP | 1 | 727 | Risk Ratio (M‐H, Fixed, 95% CI) | 1.05 [0.57, 1.92] |
| 4.2 four cycles of escalated BEAOPP | 3 | 1077 | Risk Ratio (M‐H, Fixed, 95% CI) | 1.09 [0.52, 2.29] |
| 4.3 two cycles of escalated BEACOPP | 1 | 1528 | Risk Ratio (M‐H, Fixed, 95% CI) | 0.88 [0.45, 1.76] |
| 5 SM subgrouped by type of radiotherapy Show forest plot | 5 | 3332 | Risk Ratio (M‐H, Fixed, 95% CI) | 1.00 [0.68, 1.48] |
| 5.1 without radiotherapy | 1 | 549 | Risk Ratio (M‐H, Fixed, 95% CI) | 1.25 [0.50, 3.13] |
| 5.2 with radiotherapy | 4 | 2783 | Risk Ratio (M‐H, Fixed, 95% CI) | 0.95 [0.62, 1.46] |
| 6 SM subgrouped by length of follow‐up Show forest plot | 5 | 3332 | Risk Ratio (M‐H, Fixed, 95% CI) | 1.00 [0.68, 1.48] |
| 6.1 short‐term follow‐up (median length up to 5 years) | 4 | 2605 | Risk Ratio (M‐H, Fixed, 95% CI) | 0.97 [0.59, 1.61] |
| 6.2 long‐term follow‐up (median length 10 years) | 1 | 727 | Risk Ratio (M‐H, Fixed, 95% CI) | 1.05 [0.57, 1.92] |
| Outcome or subgroup title | No. of studies | No. of participants | Statistical method | Effect size |
| 1 AML or MDS Show forest plot | 5 | 3332 | Risk Ratio (M‐H, Fixed, 95% CI) | 3.90 [1.36, 11.21] |
| 2 AML/MDS subgrouped by stage of disease Show forest plot | 5 | 3332 | Risk Ratio (M‐H, Fixed, 95% CI) | 3.90 [1.36, 11.21] |
| 2.1 early unfavourable stage | 1 | 1528 | Risk Ratio (M‐H, Fixed, 95% CI) | 5.01 [0.24, 104.25] |
| 2.2 advanced stage | 4 | 1804 | Risk Ratio (M‐H, Fixed, 95% CI) | 3.77 [1.22, 11.64] |
| 3 AML/MDS subgrouped by treatment Show forest plot | 5 | 3332 | Risk Ratio (M‐H, Fixed, 95% CI) | 3.90 [1.36, 11.21] |
| 3.1 only ABVD | 4 | 2605 | Risk Ratio (M‐H, Fixed, 95% CI) | 2.45 [0.71, 8.49] |
| 3.2 ABVD including regimen | 1 | 727 | Risk Ratio (M‐H, Fixed, 95% CI) | 7.84 [1.04, 59.29] |
| 4 AML/MDS subgrouped by number of cycles of escalated BEACOPP Show forest plot | 5 | 3332 | Risk Ratio (M‐H, Fixed, 95% CI) | 3.90 [1.36, 11.21] |
| 4.1 eight cycles of escalated BEACOPP | 1 | 727 | Risk Ratio (M‐H, Fixed, 95% CI) | 7.84 [1.04, 59.29] |
| 4.2 four cycles of escalated BEAOPP | 3 | 1077 | Risk Ratio (M‐H, Fixed, 95% CI) | 2.03 [0.51, 8.05] |
| 4.3 two cycles of escalated BEACOPP | 1 | 1528 | Risk Ratio (M‐H, Fixed, 95% CI) | 5.01 [0.24, 104.25] |
| 5 AML/MDS subgrouped by type of radiotherapy Show forest plot | 5 | 3332 | Risk Ratio (M‐H, Fixed, 95% CI) | 3.90 [1.36, 11.21] |
| 5.1 without radiotherapy | 1 | 549 | Risk Ratio (M‐H, Fixed, 95% CI) | 2.01 [0.37, 10.87] |
| 5.2 with radiotherapy | 4 | 2783 | Risk Ratio (M‐H, Fixed, 95% CI) | 5.27 [1.34, 20.74] |
| 6 AML/MDS subgrouped by length of follow‐up Show forest plot | 5 | 3332 | Risk Ratio (M‐H, Fixed, 95% CI) | 3.90 [1.36, 11.21] |
| 6.1 short‐ term follow‐up (median length up to 5 years) | 4 | 2605 | Risk Ratio (M‐H, Fixed, 95% CI) | 2.45 [0.71, 8.49] |
| 6.2 long‐ term follow‐up (median length 10 years) | 1 | 727 | Risk Ratio (M‐H, Fixed, 95% CI) | 7.84 [1.04, 59.29] |
| Outcome or subgroup title | No. of studies | No. of participants | Statistical method | Effect size |
| 1 Secondary amenorrhoea Show forest plot | 1 | 106 | Risk Ratio (M‐H, Fixed, 95% CI) | 1.37 [0.83, 2.26] |
| Outcome or subgroup title | No. of studies | No. of participants | Statistical method | Effect size |
| 1 Anaemia Show forest plot | 3 | 2425 | Risk Ratio (M‐H, Fixed, 95% CI) | 10.67 [7.14, 15.93] |
| Outcome or subgroup title | No. of studies | No. of participants | Statistical method | Effect size |
| 1 Infection Show forest plot | 3 | 2425 | Risk Ratio (M‐H, Fixed, 95% CI) | 3.73 [2.58, 5.38] |
| Outcome or subgroup title | No. of studies | No. of participants | Statistical method | Effect size |
| 1 Neutropenia Show forest plot | 2 | 519 | Risk Ratio (M‐H, Fixed, 95% CI) | 1.80 [1.52, 2.13] |
| Outcome or subgroup title | No. of studies | No. of participants | Statistical method | Effect size |
| 1 Thrombocytopenia Show forest plot | 3 | 2425 | Risk Ratio (M‐H, Fixed, 95% CI) | 18.12 [11.77, 27.92] |
| Outcome or subgroup title | No. of studies | No. of participants | Statistical method | Effect size |
| 1 Alopecia Show forest plot | 3 | 2425 | Risk Ratio (M‐H, Fixed, 95% CI) | 1.98 [1.78, 2.21] |
| Outcome or subgroup title | No. of studies | No. of participants | Statistical method | Effect size |
| 1 Constipation Show forest plot | 2 | 923 | Risk Ratio (M‐H, Fixed, 95% CI) | 1.19 [0.56, 2.55] |
| Outcome or subgroup title | No. of studies | No. of participants | Statistical method | Effect size |
| 1 Mucositis Show forest plot | 3 | 2425 | Risk Ratio (M‐H, Fixed, 95% CI) | 8.04 [3.72, 17.38] |
| Outcome or subgroup title | No. of studies | No. of participants | Statistical method | Effect size |
| 1 Nausea/vomiting Show forest plot | 3 | 2425 | Risk Ratio (M‐H, Fixed, 95% CI) | 0.83 [0.68, 1.01] |
| Outcome or subgroup title | No. of studies | No. of participants | Statistical method | Effect size |
| 1 Neurologic Show forest plot | 3 | 2425 | Risk Ratio (M‐H, Fixed, 95% CI) | 2.04 [1.19, 3.50] |
| Outcome or subgroup title | No. of studies | No. of participants | Statistical method | Effect size |
| 1 Pain Show forest plot | 3 | 2425 | Risk Ratio (M‐H, Fixed, 95% CI) | 2.62 [1.76, 3.90] |
| Outcome or subgroup title | No. of studies | No. of participants | Statistical method | Effect size |
| 1 Respiratory Show forest plot | 3 | 2549 | Risk Ratio (M‐H, Fixed, 95% CI) | 1.80 [1.01, 3.20] |
| Outcome or subgroup title | No. of studies | No. of participants | Statistical method | Effect size |
| 1 Skin Show forest plot | 2 | 2227 | Risk Ratio (M‐H, Fixed, 95% CI) | 1.02 [0.45, 2.34] |
| Outcome or subgroup title | No. of studies | No. of participants | Statistical method | Effect size |
| 1 heart Show forest plot | 2 | 1823 | Risk Ratio (M‐H, Fixed, 95% CI) | 1.04 [0.21, 5.10] |
| Outcome or subgroup title | No. of studies | No. of participants | Statistical method | Effect size |
| 1 Freedom from first progression Show forest plot | 1 | 331 | Hazard Ratio (Fixed, 95% CI) | 0.46 [0.27, 0.78] |
| Outcome or subgroup title | No. of studies | No. of participants | Statistical method | Effect size |
| 1 CR Show forest plot | 5 | 3427 | Risk Ratio (M‐H, Fixed, 95% CI) | 1.03 [1.01, 1.06] |