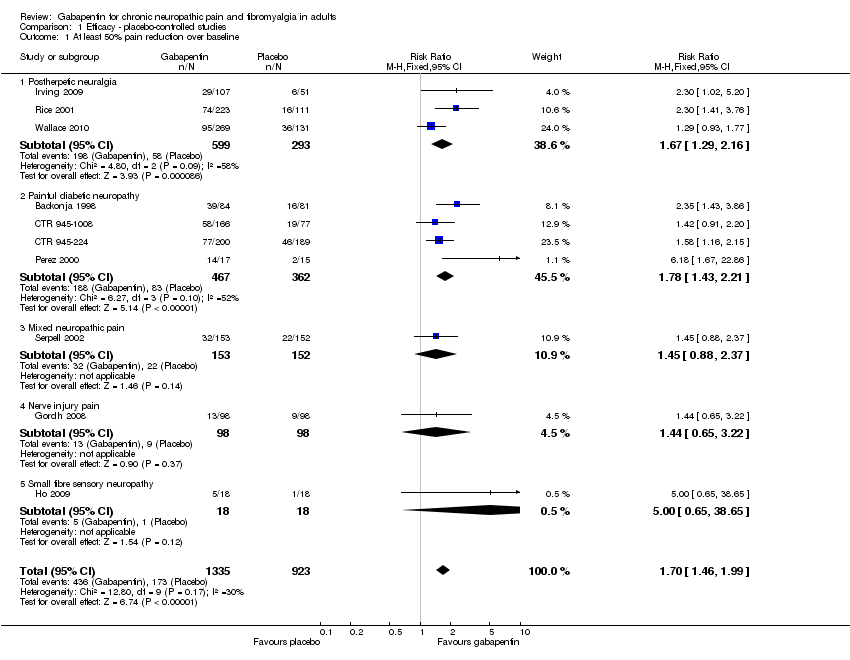
| 1 At least 50% pain reduction over baseline Show forest plot | 10 | 2258 | Risk Ratio (M‐H, Fixed, 95% CI) | 1.70 [1.46, 1.99] |
|
| 1.1 Postherpetic neuralgia | 3 | 892 | Risk Ratio (M‐H, Fixed, 95% CI) | 1.67 [1.29, 2.16] |
| 1.2 Painful diabetic neuropathy | 4 | 829 | Risk Ratio (M‐H, Fixed, 95% CI) | 1.78 [1.43, 2.21] |
| 1.3 Mixed neuropathic pain | 1 | 305 | Risk Ratio (M‐H, Fixed, 95% CI) | 1.45 [0.88, 2.37] |
| 1.4 Nerve injury pain | 1 | 196 | Risk Ratio (M‐H, Fixed, 95% CI) | 1.44 [0.65, 3.22] |
| 1.5 Small fibre sensory neuropathy | 1 | 36 | Risk Ratio (M‐H, Fixed, 95% CI) | 5.0 [0.65, 38.65] |
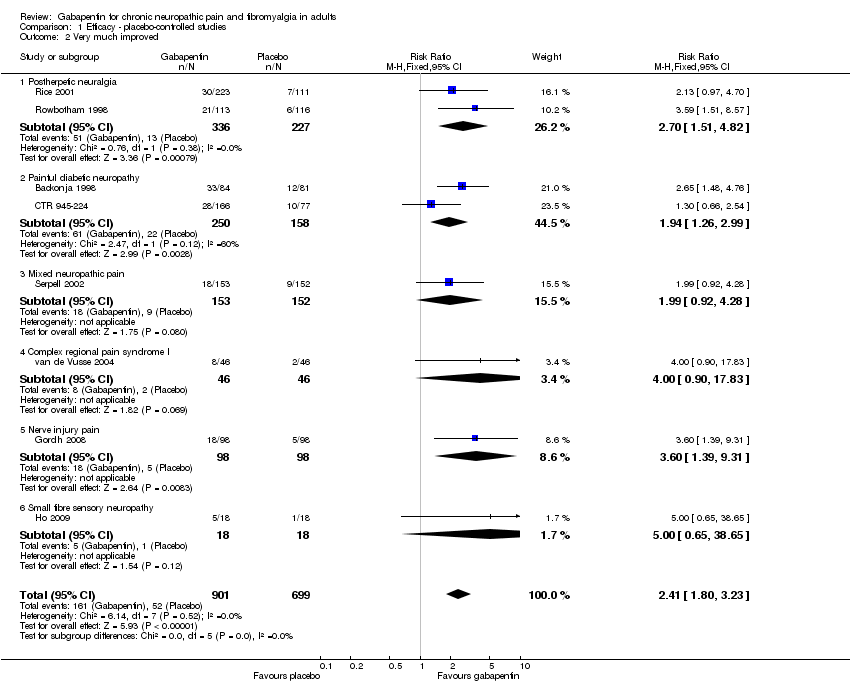
| 2 Very much improved Show forest plot | 8 | 1600 | Risk Ratio (M‐H, Fixed, 95% CI) | 2.41 [1.80, 3.23] |
|
| 2.1 Postherpetic neuralgia | 2 | 563 | Risk Ratio (M‐H, Fixed, 95% CI) | 2.70 [1.51, 4.82] |
| 2.2 Painful diabetic neuropathy | 2 | 408 | Risk Ratio (M‐H, Fixed, 95% CI) | 1.94 [1.26, 2.99] |
| 2.3 Mixed neuropathic pain | 1 | 305 | Risk Ratio (M‐H, Fixed, 95% CI) | 1.99 [0.92, 4.28] |
| 2.4 Complex regional pain syndrome I | 1 | 92 | Risk Ratio (M‐H, Fixed, 95% CI) | 4.0 [0.90, 17.83] |
| 2.5 Nerve injury pain | 1 | 196 | Risk Ratio (M‐H, Fixed, 95% CI) | 3.6 [1.39, 9.31] |
| 2.6 Small fibre sensory neuropathy | 1 | 36 | Risk Ratio (M‐H, Fixed, 95% CI) | 5.0 [0.65, 38.65] |
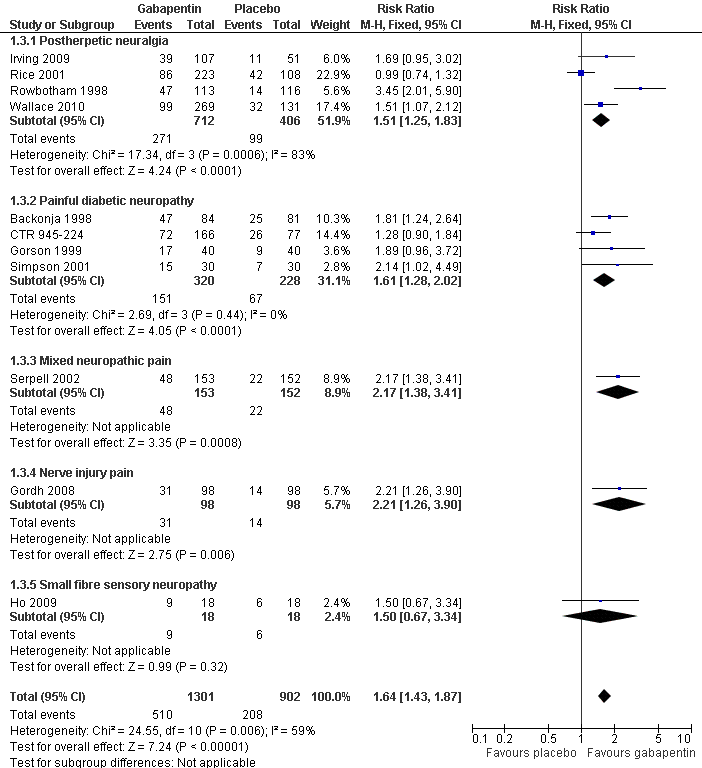
| 3 Much or very much improved Show forest plot | 11 | 2203 | Risk Ratio (M‐H, Fixed, 95% CI) | 1.64 [1.43, 1.87] |
|
| 3.1 Postherpetic neuralgia | 4 | 1118 | Risk Ratio (M‐H, Fixed, 95% CI) | 1.51 [1.25, 1.83] |
| 3.2 Painful diabetic neuropathy | 4 | 548 | Risk Ratio (M‐H, Fixed, 95% CI) | 1.61 [1.28, 2.02] |
| 3.3 Mixed neuropathic pain | 1 | 305 | Risk Ratio (M‐H, Fixed, 95% CI) | 2.17 [1.38, 3.41] |
| 3.4 Nerve injury pain | 1 | 196 | Risk Ratio (M‐H, Fixed, 95% CI) | 2.21 [1.26, 3.90] |
| 3.5 Small fibre sensory neuropathy | 1 | 36 | Risk Ratio (M‐H, Fixed, 95% CI) | 1.5 [0.67, 3.34] |
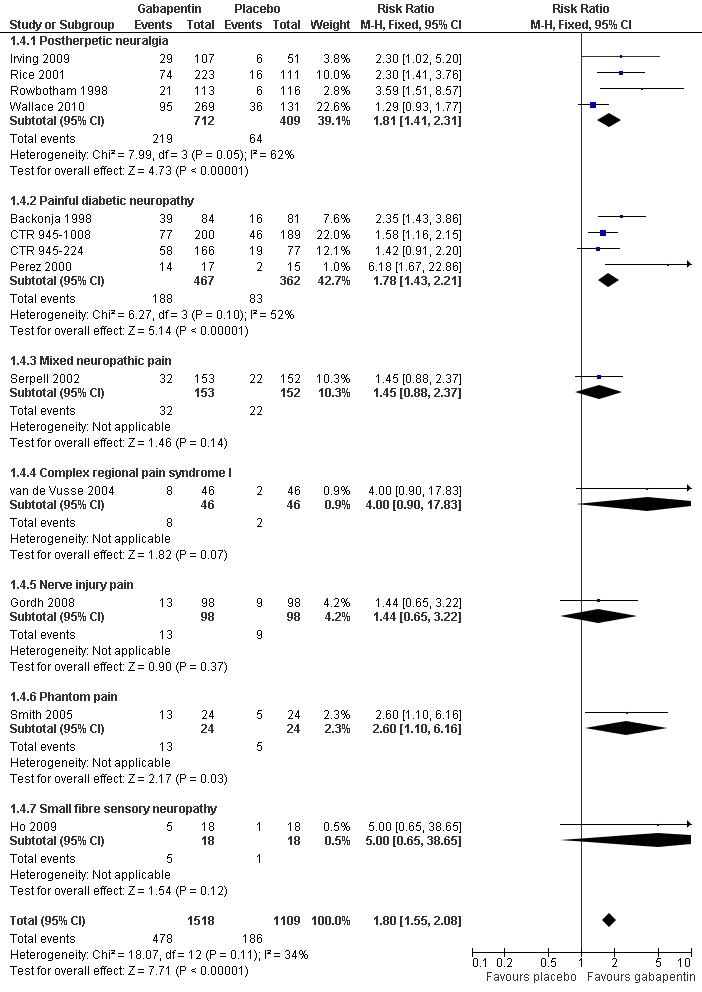
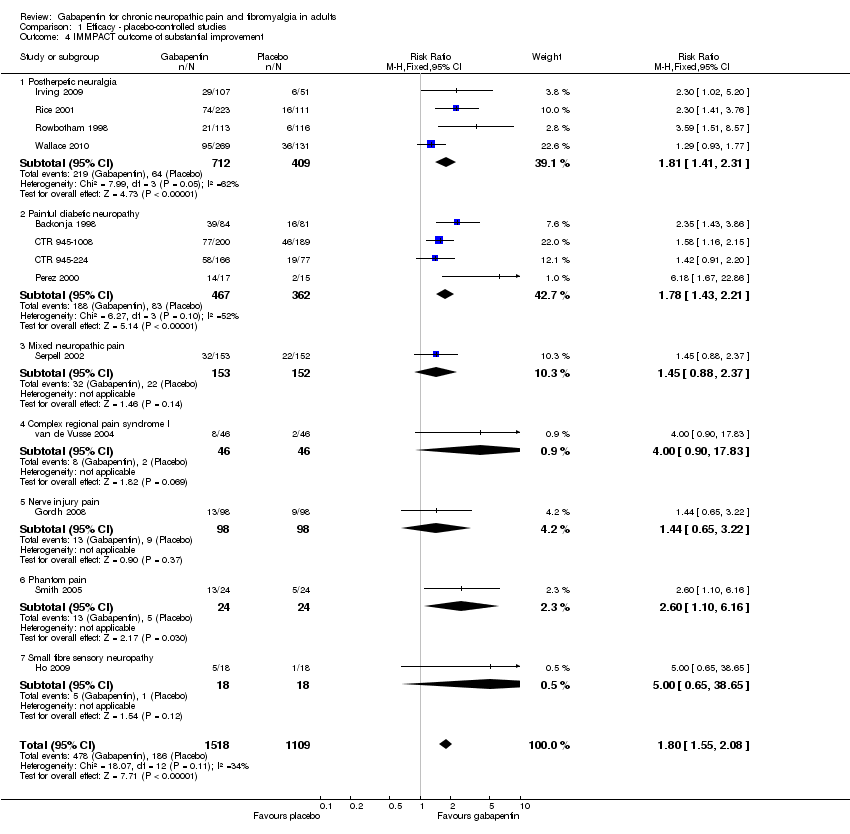
| 4 IMMPACT outcome of substantial improvement Show forest plot | 13 | 2627 | Risk Ratio (M‐H, Fixed, 95% CI) | 1.80 [1.55, 2.08] |
|
| 4.1 Postherpetic neuralgia | 4 | 1121 | Risk Ratio (M‐H, Fixed, 95% CI) | 1.81 [1.41, 2.31] |
| 4.2 Painful diabetic neuropathy | 4 | 829 | Risk Ratio (M‐H, Fixed, 95% CI) | 1.78 [1.43, 2.21] |
| 4.3 Mixed neuropathic pain | 1 | 305 | Risk Ratio (M‐H, Fixed, 95% CI) | 1.45 [0.88, 2.37] |
| 4.4 Complex regional pain syndrome I | 1 | 92 | Risk Ratio (M‐H, Fixed, 95% CI) | 4.0 [0.90, 17.83] |
| 4.5 Nerve injury pain | 1 | 196 | Risk Ratio (M‐H, Fixed, 95% CI) | 1.44 [0.65, 3.22] |
| 4.6 Phantom pain | 1 | 48 | Risk Ratio (M‐H, Fixed, 95% CI) | 2.6 [1.10, 6.16] |
| 4.7 Small fibre sensory neuropathy | 1 | 36 | Risk Ratio (M‐H, Fixed, 95% CI) | 5.0 [0.65, 38.65] |
| 5 IMMPACT outcome of at least moderate improvement Show forest plot | 14 | 2831 | Risk Ratio (M‐H, Fixed, 95% CI) | 1.68 [1.51, 1.88] |
|
| 5.1 Postherpetic neuralgia | 4 | 1121 | Risk Ratio (M‐H, Fixed, 95% CI) | 1.84 [1.50, 2.26] |
| 5.2 Painful diabetic neuropathy | 5 | 937 | Risk Ratio (M‐H, Fixed, 95% CI) | 1.50 [1.28, 1.75] |
| 5.3 Mixed neuropathic pain | 2 | 391 | Risk Ratio (M‐H, Fixed, 95% CI) | 2.10 [1.49, 2.95] |
| 5.4 Fibromyalgia | 1 | 150 | Risk Ratio (M‐H, Fixed, 95% CI) | 1.61 [1.07, 2.42] |
| 5.5 Nerve injury pain | 1 | 196 | Risk Ratio (M‐H, Fixed, 95% CI) | 1.53 [0.92, 2.53] |
| 5.6 Small fibre sensory neuropathy | 1 | 36 | Risk Ratio (M‐H, Fixed, 95% CI) | 2.25 [0.84, 5.99] |