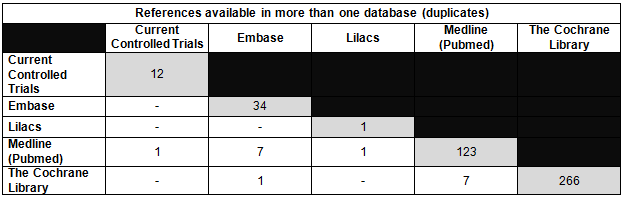
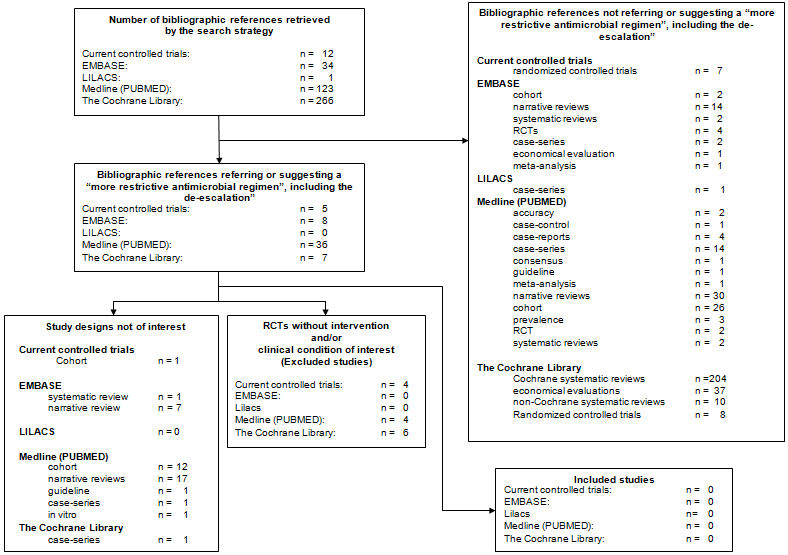
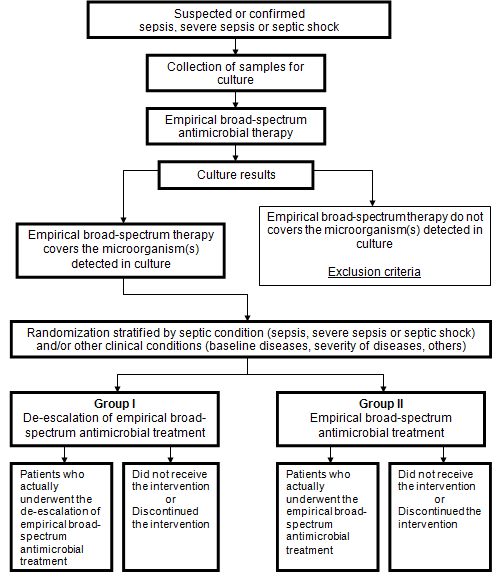
Contenido relacionado
Revisiones y protocolos relacionados
Brenda NG Silva, Régis B Andriolo, Álvaro N Atallah, Reinaldo Salomão | 28 marzo 2013
Brenda NG Andriolo, Regis B Andriolo, Reinaldo Salomão, Álvaro N Atallah | 18 enero 2017
Sharon R Lewis, Michael W Pritchard, Oliver J Schofield‐Robinson, Phil Alderson, Andrew F Smith | 18 julio 2018
Annette M Matthews, Rongwei Fu, Tracy Dana, Roger Chou | 12 enero 2016
Abel Wakai, Ronan O'Sullivan, Aileen McCabe | 13 abril 2011
Bennedikte K Madsen, Dennis Zetner, Ann Merete Møller, Jacob Rosenberg | 8 diciembre 2020
Lars H Lundstrøm, Christophe HV Duez, Anders K Nørskov, Charlotte V Rosenstock, Jakob L Thomsen, Ann Merete Møller, Søren Strande, Jørn Wetterslev | 17 mayo 2017
Lihua Peng, Su Min, Ke Wei, Patrick Ziemann‐Gimmel | 11 abril 2014
Bernardo O Ratilal, João Costa, Cristina Sampaio | 19 julio 2006
Matthew Bizzarro, Ian Gross, Fabiano T Barbosa | 3 julio 2014