| 1 Blood loss ‐ total body mL Show forest plot | 2 | 140 | Mean Difference (IV, Random, 95% CI) | ‐637.06 [‐753.61, ‐520.50] |
|
| 1.1 Cold Compression vs. Compression | 2 | 140 | Mean Difference (IV, Random, 95% CI) | ‐637.06 [‐753.61, ‐520.50] |
| 2 Blood loss ‐ wound drainage mL/24hrs Show forest plot | 1 | | Mean Difference (IV, Random, 95% CI) | Totals not selected |
|
| 2.1 Cold Compression vs. Compression | 1 | | Mean Difference (IV, Random, 95% CI) | 0.0 [0.0, 0.0] |
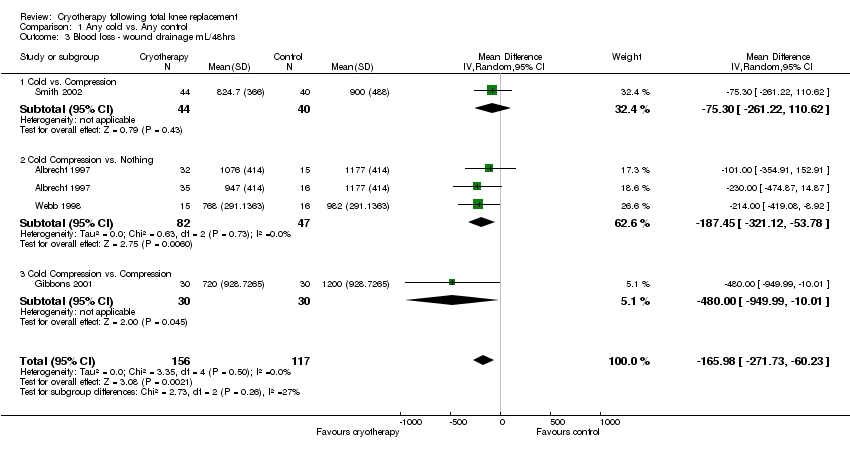
| 3 Blood loss ‐ wound drainage mL/48hrs Show forest plot | 4 | 273 | Mean Difference (IV, Random, 95% CI) | ‐165.98 [‐271.73, ‐60.23] |
|
| 3.1 Cold vs. Compression | 1 | 84 | Mean Difference (IV, Random, 95% CI) | ‐75.30 [‐261.22, 110.62] |
| 3.2 Cold Compression vs. Nothing | 2 | 129 | Mean Difference (IV, Random, 95% CI) | ‐187.45 [‐321.12, ‐53.78] |
| 3.3 Cold Compression vs. Compression | 1 | 60 | Mean Difference (IV, Random, 95% CI) | ‐480.0 [‐949.99, ‐10.01] |
| 4 Blood loss ‐ total wound drainage mL Show forest plot | 2 | 66 | Mean Difference (IV, Random, 95% CI) | ‐107.70 [‐268.52, 53.12] |
|
| 4.1 Cold Compression vs. Compression | 1 | 36 | Mean Difference (IV, Random, 95% CI) | ‐188.0 [‐458.89, 82.89] |
| 4.2 Cold and Continuous Passive Motion vs. Continuous Passive Motion | 1 | 30 | Mean Difference (IV, Random, 95% CI) | ‐64.0 [‐263.84, 135.84] |
| 5 Blood loss ‐ Hb drop mmol/L/24hrs Show forest plot | 1 | | Mean Difference (IV, Random, 95% CI) | Totals not selected |
|
| 5.1 Cold Compression vs. Nothing | 1 | | Mean Difference (IV, Random, 95% CI) | 0.0 [0.0, 0.0] |
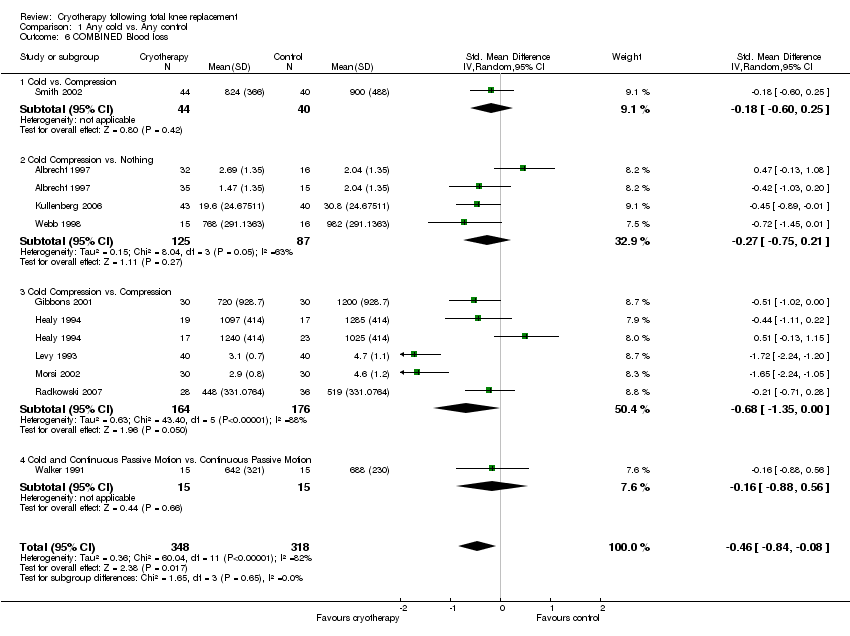
| 6 COMBINED Blood loss Show forest plot | 10 | 666 | Std. Mean Difference (IV, Random, 95% CI) | ‐0.46 [‐0.84, ‐0.08] |
|
| 6.1 Cold vs. Compression | 1 | 84 | Std. Mean Difference (IV, Random, 95% CI) | ‐0.18 [‐0.60, 0.25] |
| 6.2 Cold Compression vs. Nothing | 3 | 212 | Std. Mean Difference (IV, Random, 95% CI) | ‐0.27 [‐0.75, 0.21] |
| 6.3 Cold Compression vs. Compression | 5 | 340 | Std. Mean Difference (IV, Random, 95% CI) | ‐0.68 [‐1.35, 0.00] |
| 6.4 Cold and Continuous Passive Motion vs. Continuous Passive Motion | 1 | 30 | Std. Mean Difference (IV, Random, 95% CI) | ‐0.16 [‐0.88, 0.56] |
| 7 COMBINED Blood Loss CEMENT&NO‐CEMENT Show forest plot | 10 | 662 | Std. Mean Difference (IV, Random, 95% CI) | ‐0.55 [‐0.99, ‐0.11] |
|
| 7.1 Cement | 5 | 295 | Std. Mean Difference (IV, Random, 95% CI) | ‐0.34 [‐0.92, 0.23] |
| 7.2 No Cement | 5 | 367 | Std. Mean Difference (IV, Random, 95% CI) | ‐0.82 [‐1.53, ‐0.10] |
| 8 Analgesic use mg/kg/48hrs of morphine equivalent Show forest plot | 4 | 255 | Mean Difference (IV, Random, 95% CI) | ‐0.16 [‐0.37, 0.05] |
|
| 8.1 Cold vs. Compression | 1 | 84 | Mean Difference (IV, Random, 95% CI) | ‐0.10 [‐0.23, 0.03] |
| 8.2 Cold Compression vs. Nothing | 1 | 31 | Mean Difference (IV, Random, 95% CI) | ‐0.14 [‐0.30, 0.02] |
| 8.3 Cold Compression vs. Compression | 2 | 140 | Mean Difference (IV, Random, 95% CI) | ‐0.19 [‐0.66, 0.28] |
| 9 Pain at POD 2 VAS Show forest plot | 4 | 322 | Mean Difference (IV, Random, 95% CI) | ‐1.32 [‐2.37, ‐0.27] |
|
| 9.1 Cold vs. Compression | 1 | 84 | Mean Difference (IV, Random, 95% CI) | ‐0.5 [‐1.33, 0.33] |
| 9.2 Cold Compression vs. Nothing | 1 | 98 | Mean Difference (IV, Random, 95% CI) | ‐2.71 [‐5.43, 0.01] |
| 9.3 Cold Compression vs. Compression | 2 | 140 | Mean Difference (IV, Random, 95% CI) | ‐1.40 [‐2.28, ‐0.52] |
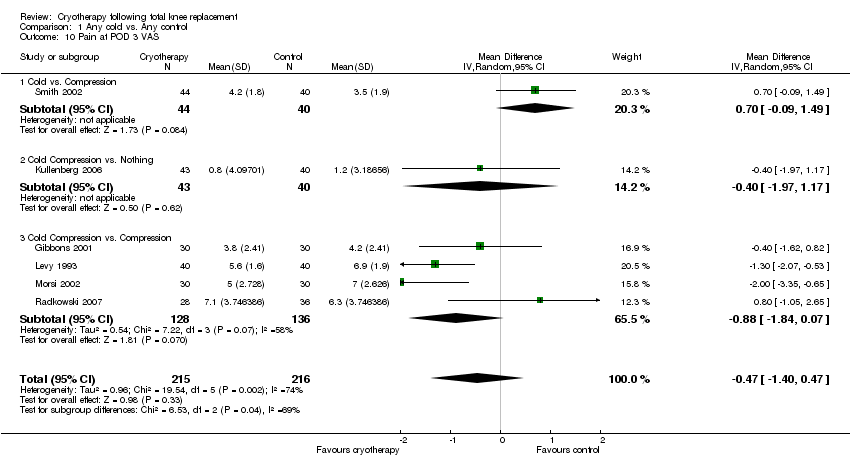
| 10 Pain at POD 3 VAS Show forest plot | 6 | 431 | Mean Difference (IV, Random, 95% CI) | ‐0.47 [‐1.40, 0.47] |
|
| 10.1 Cold vs. Compression | 1 | 84 | Mean Difference (IV, Random, 95% CI) | 0.70 [‐0.09, 1.49] |
| 10.2 Cold Compression vs. Nothing | 1 | 83 | Mean Difference (IV, Random, 95% CI) | ‐0.40 [‐1.97, 1.17] |
| 10.3 Cold Compression vs. Compression | 4 | 264 | Mean Difference (IV, Random, 95% CI) | ‐0.88 [‐1.84, 0.07] |
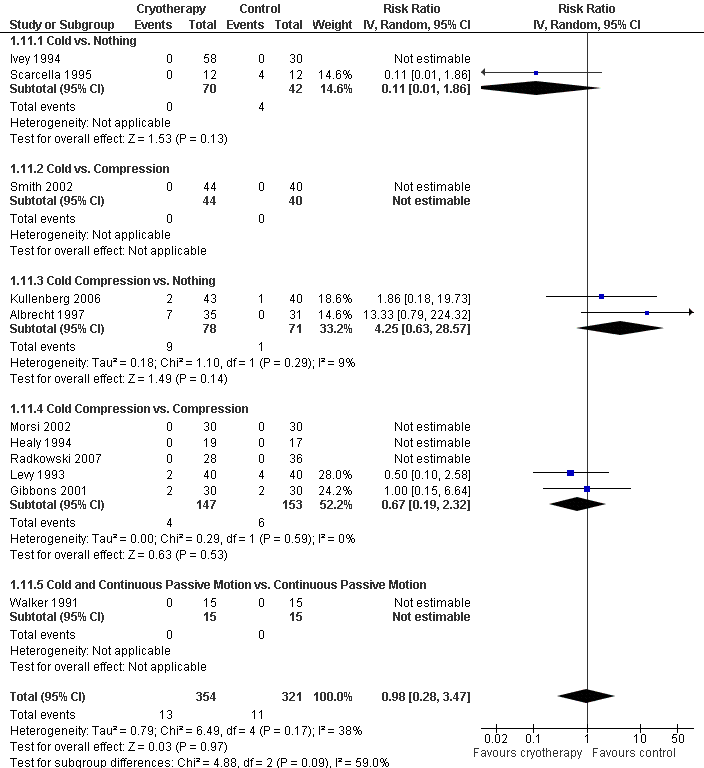
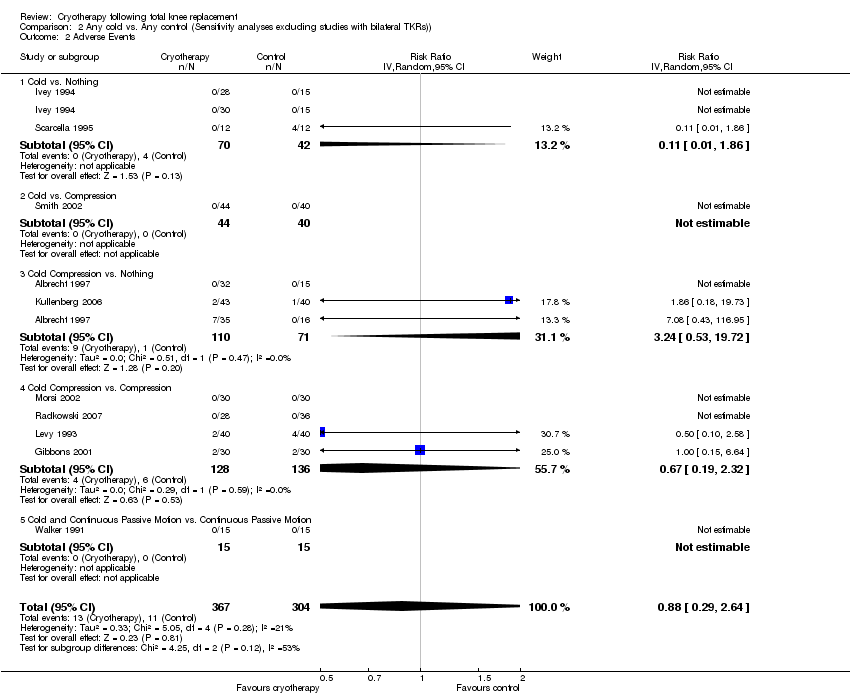
| 11 Adverse Events Show forest plot | 11 | 675 | Risk Ratio (IV, Random, 95% CI) | 0.98 [0.28, 3.47] |
|
| 11.1 Cold vs. Nothing | 2 | 112 | Risk Ratio (IV, Random, 95% CI) | 0.11 [0.01, 1.86] |
| 11.2 Cold vs. Compression | 1 | 84 | Risk Ratio (IV, Random, 95% CI) | 0.0 [0.0, 0.0] |
| 11.3 Cold Compression vs. Nothing | 2 | 149 | Risk Ratio (IV, Random, 95% CI) | 4.25 [0.63, 28.57] |
| 11.4 Cold Compression vs. Compression | 5 | 300 | Risk Ratio (IV, Random, 95% CI) | 0.67 [0.19, 2.32] |
| 11.5 Cold and Continuous Passive Motion vs. Continuous Passive Motion | 1 | 30 | Risk Ratio (IV, Random, 95% CI) | 0.0 [0.0, 0.0] |
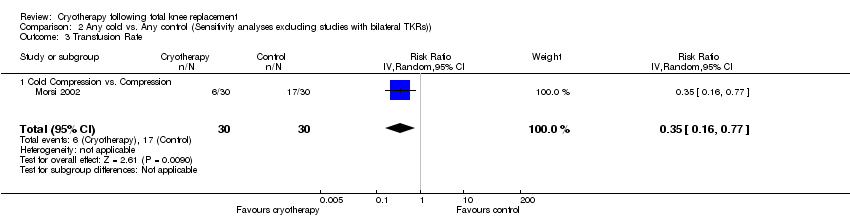
| 12 Transfusion Rate Show forest plot | 2 | 91 | Risk Ratio (IV, Random, 95% CI) | 2.13 [0.04, 109.63] |
|
| 12.1 Cold Compression vs. Nothing | 1 | 31 | Risk Ratio (IV, Random, 95% CI) | 20.19 [1.28, 319.17] |
| 12.2 Cold Compression vs. Compression | 1 | 60 | Risk Ratio (IV, Random, 95% CI) | 0.35 [0.16, 0.77] |
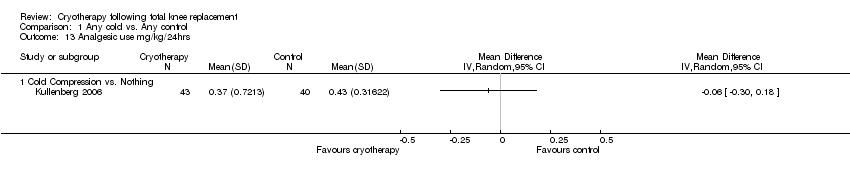
| 13 Analgesic use mg/kg/24hrs Show forest plot | 1 | | Mean Difference (IV, Random, 95% CI) | Totals not selected |
|
| 13.1 Cold Compression vs. Nothing | 1 | | Mean Difference (IV, Random, 95% CI) | 0.0 [0.0, 0.0] |
| 14 Pain at POD 1 VAS Show forest plot | 6 | 469 | Mean Difference (IV, Random, 95% CI) | ‐0.22 [‐0.93, 0.49] |
|
| 14.1 Cold vs. Compression | 1 | 84 | Mean Difference (IV, Random, 95% CI) | 0.10 [‐0.72, 0.92] |
| 14.2 Cold Compression vs. Nothing | 2 | 181 | Mean Difference (IV, Random, 95% CI) | ‐1.47 [‐3.55, 0.60] |
| 14.3 Cold Compression vs. Compression | 3 | 204 | Mean Difference (IV, Random, 95% CI) | 0.12 [‐0.66, 0.89] |
| 15 Analgesic use mg/kg/72hrs Show forest plot | 1 | 88 | Mean Difference (IV, Random, 95% CI) | 0.19 [‐0.10, 0.48] |
|
| 15.1 Cold vs. Nothing | 1 | 88 | Mean Difference (IV, Random, 95% CI) | 0.19 [‐0.10, 0.48] |
| 16 Analgesia use total mg/kg Show forest plot | 2 | 90 | Mean Difference (IV, Random, 95% CI) | ‐213.80 [‐604.00, 176.39] |
|
| 16.1 Cold Compression vs. Compression | 1 | 60 | Mean Difference (IV, Random, 95% CI) | ‐450.0 [‐781.16, ‐118.84] |
| 16.2 Cold and Continuous Passive Motion vs. Continuous Passive Motion | 1 | 30 | Mean Difference (IV, Random, 95% CI) | ‐46.0 [‐105.42, 13.42] |
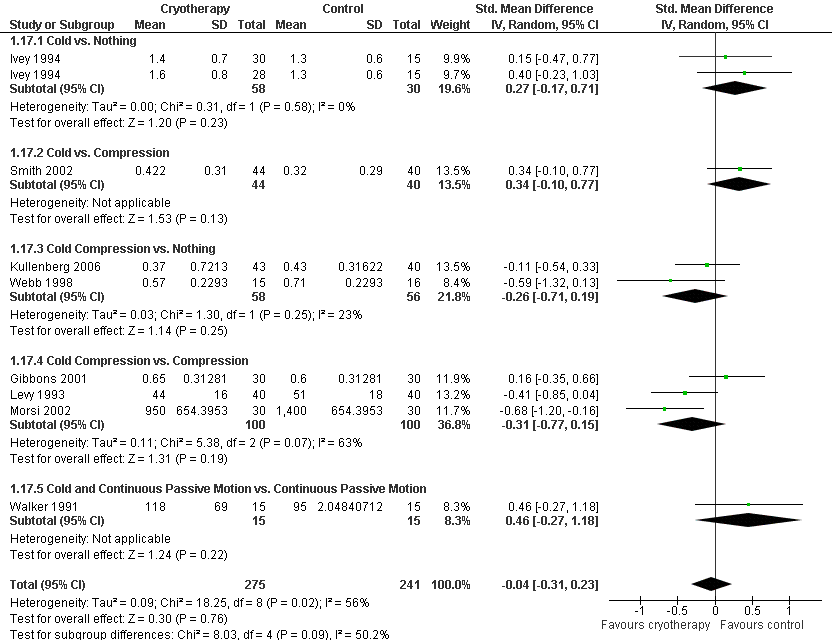
| 17 COMBINED Analgesic use Show forest plot | 8 | 516 | Std. Mean Difference (IV, Random, 95% CI) | ‐0.04 [‐0.31, 0.23] |
|
| 17.1 Cold vs. Nothing | 1 | 88 | Std. Mean Difference (IV, Random, 95% CI) | 0.27 [‐0.17, 0.71] |
| 17.2 Cold vs. Compression | 1 | 84 | Std. Mean Difference (IV, Random, 95% CI) | 0.34 [‐0.10, 0.77] |
| 17.3 Cold Compression vs. Nothing | 2 | 114 | Std. Mean Difference (IV, Random, 95% CI) | ‐0.26 [‐0.71, 0.19] |
| 17.4 Cold Compression vs. Compression | 3 | 200 | Std. Mean Difference (IV, Random, 95% CI) | ‐0.31 [‐0.77, 0.15] |
| 17.5 Cold and Continuous Passive Motion vs. Continuous Passive Motion | 1 | 30 | Std. Mean Difference (IV, Random, 95% CI) | 0.46 [‐0.27, 1.18] |
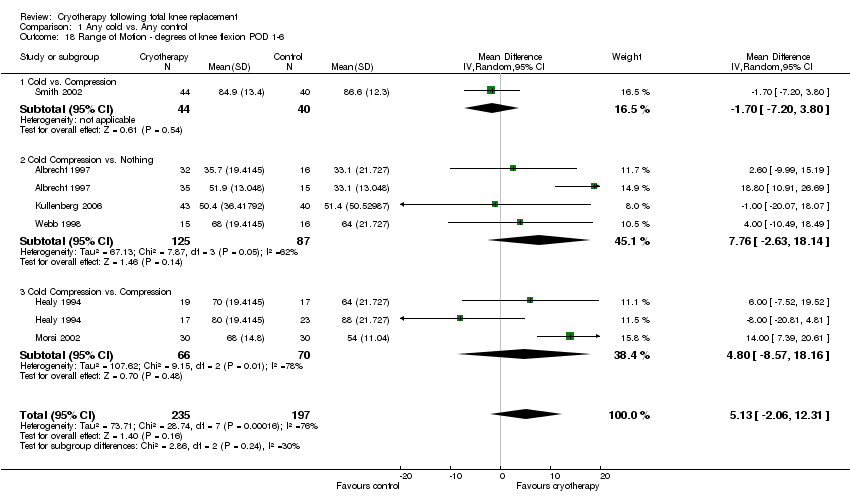
| 18 Range of Motion ‐ degrees of knee flexion POD 1‐6 Show forest plot | 6 | 432 | Mean Difference (IV, Random, 95% CI) | 5.13 [‐2.06, 12.31] |
|
| 18.1 Cold vs. Compression | 1 | 84 | Mean Difference (IV, Random, 95% CI) | ‐1.70 [‐7.20, 3.80] |
| 18.2 Cold Compression vs. Nothing | 3 | 212 | Mean Difference (IV, Random, 95% CI) | 7.76 [‐2.63, 18.14] |
| 18.3 Cold Compression vs. Compression | 2 | 136 | Mean Difference (IV, Random, 95% CI) | 4.80 [‐8.57, 18.16] |
| 19 Range of Motion ‐ degrees of knee flexion POD 7‐14 Show forest plot | 2 | 140 | Mean Difference (IV, Random, 95% CI) | 12.89 [8.48, 17.30] |
|
| 19.1 Cold Compression vs. Compression | 2 | 140 | Mean Difference (IV, Random, 95% CI) | 12.89 [8.48, 17.30] |
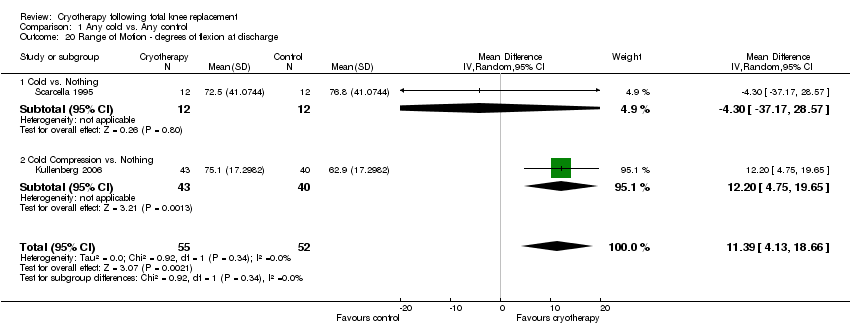
| 20 Range of Motion ‐ degrees of flexion at discharge Show forest plot | 2 | 107 | Mean Difference (IV, Random, 95% CI) | 11.39 [4.13, 18.66] |
|
| 20.1 Cold vs. Nothing | 1 | 24 | Mean Difference (IV, Random, 95% CI) | ‐4.30 [‐37.17, 28.57] |
| 20.2 Cold Compression vs. Nothing | 1 | 83 | Mean Difference (IV, Random, 95% CI) | 12.20 [4.75, 19.65] |
| 21 Range of Motion ‐ degrees of flexion at 3 months Show forest plot | 2 | 61 | Mean Difference (IV, Random, 95% CI) | 0.0 [0.0, 0.0] |
|
| 21.1 Cold Compression vs. Nothing | 1 | 31 | Mean Difference (IV, Random, 95% CI) | 0.0 [0.0, 0.0] |
| 21.2 Cold and Continuous Passive Motion vs. Continuous Passive Motion | 1 | 30 | Mean Difference (IV, Random, 95% CI) | 0.0 [0.0, 0.0] |
| 22 COMBINED Swelling postoperative at midpatella in mm Show forest plot | 4 | 231 | Std. Mean Difference (IV, Random, 95% CI) | 0.25 [‐0.18, 0.68] |
|
| 22.1 Cold vs. Compression | 1 | 84 | Std. Mean Difference (IV, Random, 95% CI) | 0.25 [‐0.18, 0.68] |
| 22.2 Cold Compression vs. Nothing | 1 | 31 | Std. Mean Difference (IV, Random, 95% CI) | 0.0 [0.0, 0.0] |
| 22.3 Cold Compression vs. Compression | 2 | 116 | Std. Mean Difference (IV, Random, 95% CI) | 0.0 [0.0, 0.0] |
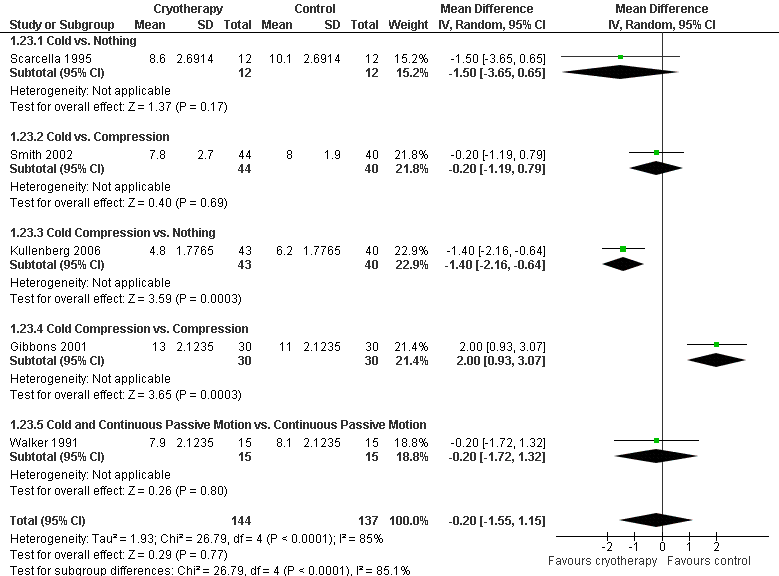
| 23 Length of Hospital Stay ‐ Days Show forest plot | 5 | 281 | Mean Difference (IV, Random, 95% CI) | ‐0.20 [‐1.55, 1.15] |
|
| 23.1 Cold vs. Nothing | 1 | 24 | Mean Difference (IV, Random, 95% CI) | ‐1.5 [‐3.65, 0.65] |
| 23.2 Cold vs. Compression | 1 | 84 | Mean Difference (IV, Random, 95% CI) | ‐0.20 [‐1.19, 0.79] |
| 23.3 Cold Compression vs. Nothing | 1 | 83 | Mean Difference (IV, Random, 95% CI) | ‐1.40 [‐2.16, ‐0.64] |
| 23.4 Cold Compression vs. Compression | 1 | 60 | Mean Difference (IV, Random, 95% CI) | 2.0 [0.93, 3.07] |
| 23.5 Cold and Continuous Passive Motion vs. Continuous Passive Motion | 1 | 30 | Mean Difference (IV, Random, 95% CI) | ‐0.20 [‐1.72, 1.32] |