Scolaris Content Display Scolaris Content Display

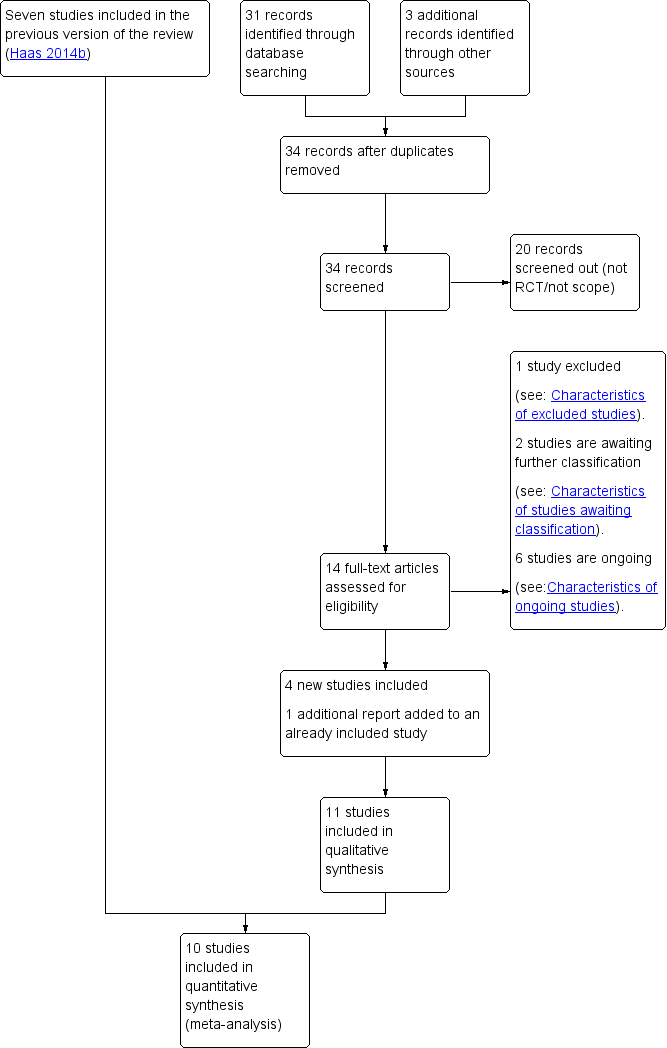
Study flow diagram.
Figuras y tablas -
Figure 1

Study flow diagram.

Methodological quality graph: review authors' judgements about each methodological quality item presented as percentages across all included studies.
Figuras y tablas -
Figure 2

Methodological quality graph: review authors' judgements about each methodological quality item presented as percentages across all included studies.

Methodological quality summary: review authors' judgements about each methodological quality item for each included study.
Figuras y tablas -
Figure 3

Methodological quality summary: review authors' judgements about each methodological quality item for each included study.

Comparison 1 Vaginal preparation with antiseptic solution versus control (no preparation or saline preparation), Outcome 1 Post‐cesarean endometritis.
Figuras y tablas -
Analysis 1.1

Comparison 1 Vaginal preparation with antiseptic solution versus control (no preparation or saline preparation), Outcome 1 Post‐cesarean endometritis.

Comparison 1 Vaginal preparation with antiseptic solution versus control (no preparation or saline preparation), Outcome 2 Postoperative fever.
Figuras y tablas -
Analysis 1.2

Comparison 1 Vaginal preparation with antiseptic solution versus control (no preparation or saline preparation), Outcome 2 Postoperative fever.

Comparison 1 Vaginal preparation with antiseptic solution versus control (no preparation or saline preparation), Outcome 3 Postoperative wound infection.
Figuras y tablas -
Analysis 1.3

Comparison 1 Vaginal preparation with antiseptic solution versus control (no preparation or saline preparation), Outcome 3 Postoperative wound infection.

Comparison 1 Vaginal preparation with antiseptic solution versus control (no preparation or saline preparation), Outcome 4 Composite wound complication.
Figuras y tablas -
Analysis 1.4

Comparison 1 Vaginal preparation with antiseptic solution versus control (no preparation or saline preparation), Outcome 4 Composite wound complication.

Comparison 1 Vaginal preparation with antiseptic solution versus control (no preparation or saline preparation), Outcome 5 Composite wound complication or endometritis.
Figuras y tablas -
Analysis 1.5

Comparison 1 Vaginal preparation with antiseptic solution versus control (no preparation or saline preparation), Outcome 5 Composite wound complication or endometritis.

Comparison 2 Vaginal preparation with antiseptic solution versus control (no preparation or saline preparation) ‐ stratified by presence of labor, Outcome 1 Post‐cesarean endometritis.
Figuras y tablas -
Analysis 2.1

Comparison 2 Vaginal preparation with antiseptic solution versus control (no preparation or saline preparation) ‐ stratified by presence of labor, Outcome 1 Post‐cesarean endometritis.

Comparison 2 Vaginal preparation with antiseptic solution versus control (no preparation or saline preparation) ‐ stratified by presence of labor, Outcome 2 Postoperative fever.
Figuras y tablas -
Analysis 2.2

Comparison 2 Vaginal preparation with antiseptic solution versus control (no preparation or saline preparation) ‐ stratified by presence of labor, Outcome 2 Postoperative fever.

Comparison 2 Vaginal preparation with antiseptic solution versus control (no preparation or saline preparation) ‐ stratified by presence of labor, Outcome 3 Postoperative wound infection.
Figuras y tablas -
Analysis 2.3

Comparison 2 Vaginal preparation with antiseptic solution versus control (no preparation or saline preparation) ‐ stratified by presence of labor, Outcome 3 Postoperative wound infection.

Comparison 2 Vaginal preparation with antiseptic solution versus control (no preparation or saline preparation) ‐ stratified by presence of labor, Outcome 4 Composite wound complication.
Figuras y tablas -
Analysis 2.4

Comparison 2 Vaginal preparation with antiseptic solution versus control (no preparation or saline preparation) ‐ stratified by presence of labor, Outcome 4 Composite wound complication.

Comparison 2 Vaginal preparation with antiseptic solution versus control (no preparation or saline preparation) ‐ stratified by presence of labor, Outcome 5 Composite wound complication or endometritis.
Figuras y tablas -
Analysis 2.5

Comparison 2 Vaginal preparation with antiseptic solution versus control (no preparation or saline preparation) ‐ stratified by presence of labor, Outcome 5 Composite wound complication or endometritis.

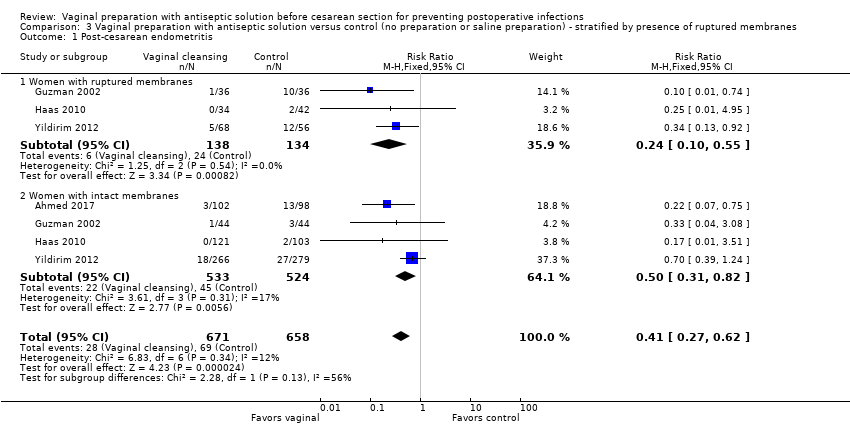
Comparison 3 Vaginal preparation with antiseptic solution versus control (no preparation or saline preparation) ‐ stratified by presence of ruptured membranes, Outcome 1 Post‐cesarean endometritis.
Figuras y tablas -
Analysis 3.1

Comparison 3 Vaginal preparation with antiseptic solution versus control (no preparation or saline preparation) ‐ stratified by presence of ruptured membranes, Outcome 1 Post‐cesarean endometritis.

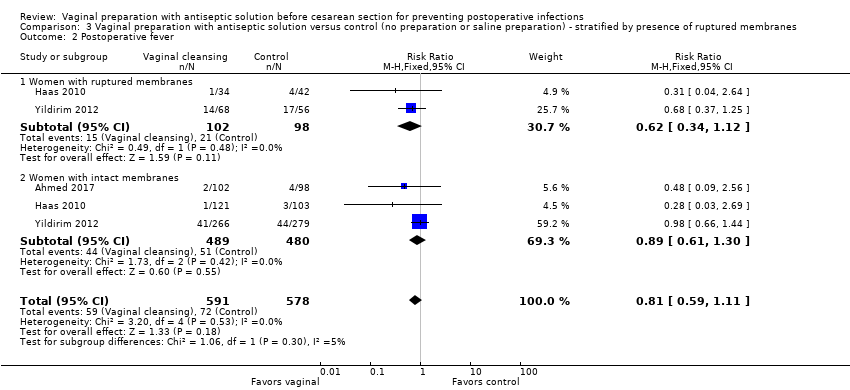
Comparison 3 Vaginal preparation with antiseptic solution versus control (no preparation or saline preparation) ‐ stratified by presence of ruptured membranes, Outcome 2 Postoperative fever.
Figuras y tablas -
Analysis 3.2

Comparison 3 Vaginal preparation with antiseptic solution versus control (no preparation or saline preparation) ‐ stratified by presence of ruptured membranes, Outcome 2 Postoperative fever.

Comparison 3 Vaginal preparation with antiseptic solution versus control (no preparation or saline preparation) ‐ stratified by presence of ruptured membranes, Outcome 3 Postoperative wound infection.
Figuras y tablas -
Analysis 3.3

Comparison 3 Vaginal preparation with antiseptic solution versus control (no preparation or saline preparation) ‐ stratified by presence of ruptured membranes, Outcome 3 Postoperative wound infection.

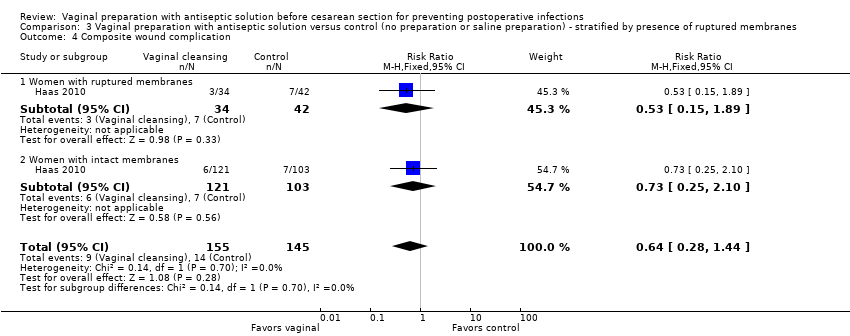
Comparison 3 Vaginal preparation with antiseptic solution versus control (no preparation or saline preparation) ‐ stratified by presence of ruptured membranes, Outcome 4 Composite wound complication.
Figuras y tablas -
Analysis 3.4

Comparison 3 Vaginal preparation with antiseptic solution versus control (no preparation or saline preparation) ‐ stratified by presence of ruptured membranes, Outcome 4 Composite wound complication.

Comparison 3 Vaginal preparation with antiseptic solution versus control (no preparation or saline preparation) ‐ stratified by presence of ruptured membranes, Outcome 5 Composite wound complication or endometritis.
Figuras y tablas -
Analysis 3.5

Comparison 3 Vaginal preparation with antiseptic solution versus control (no preparation or saline preparation) ‐ stratified by presence of ruptured membranes, Outcome 5 Composite wound complication or endometritis.

Summary of findings for the main comparison. Vaginal preparation with antiseptic solution compared to control (no preparation or saline preparation) for preventing postoperative infections

Vaginal preparation with antiseptic solution compared to control (no preparation or saline preparation) for preventing postoperative infections

Patient or population: pregnant women who were about to receive a cesarean delivery. This included women receiving elective, laboring, or urgent cesareans
Setting: multiple countries (United States‐5, Pakistan‐2, Turkey‐2, Iran‐1, Saudi Arabia‐1) mostly in academic centers or large hospitals
Intervention: vaginal preparation ‐ 9 trials using iodine solution and 2 using chlorhexidine solution
Comparison: control ‐ 9 trials with no vaginal cleansing and 2 with a saline vaginal cleansing

Outcomes

Anticipated absolute effects* (95% CI)

Relative effect
(95% CI)

№ of participants
(studies)

Certainty of the evidence
(GRADE)

Comments

Risk with control

Risk with vaginal preparation

Post‐cesarean endometritis

Study population

Average RR 0.36
(0.20 to 0.63)

3283
(10 RCTs)

⊕⊕⊕⊝
MODERATE 1

86 per 1000

31 per 1000
(17 to 54)

Postoperative fever

Study population

RR 0.87
(0.72 to 1.05)

3109
(8 RCTs)

⊕⊕⊕⊝
MODERATE 2

125 per 1000

109 per 1000
(90 to 131)

Postoperative wound infection

Study population

RR 0.74
(0.49 to 1.11)

2839
(8 RCTs)

⊕⊕⊕⊝
MODERATE 2

36 per 1000

27 per 1000
(18 to 41)

Composite wound complication or endometritis

Study population

RR 0.46
(0.26 to 0.82)

499
(2 RCTs)

⊕⊕⊕⊝
MODERATE 1

135 per 1000

62 per 1000
(35 to 111)

*The risk in the intervention group (and its 95% confidence interval) is based on the assumed risk in the comparison group and the relative effect of the intervention (and its 95% CI).

CI: Confidence interval; RR: Risk ratio;

GRADE Working Group grades of evidence
High certainty: We are very confident that the true effect lies close to that of the estimate of the effect
Moderate certainty: We are moderately confident in the effect estimate: The true effect is likely to be close to the estimate of the effect, but there is a possibility that it is substantially different
Low certainty: Our confidence in the effect estimate is limited: The true effect may be substantially different from the estimate of the effect
Very low certainty: We have very little confidence in the effect estimate: The true effect is likely to be substantially different from the estimate of effect

1 Over 40% of included studies had some design limitations.

2 Wide confidence intervals in included studies.

Figuras y tablas -
Summary of findings for the main comparison. Vaginal preparation with antiseptic solution compared to control (no preparation or saline preparation) for preventing postoperative infections
Comparison 1. Vaginal preparation with antiseptic solution versus control (no preparation or saline preparation)

Outcome or subgroup title

No. of studies

No. of participants

Statistical method

Effect size

1 Post‐cesarean endometritis Show forest plot

10

3283

Risk Ratio (M‐H, Random, 95% CI)

0.36 [0.20, 0.63]

1.1 Iodine‐based solution

8

3069

Risk Ratio (M‐H, Random, 95% CI)

0.38 [0.21, 0.69]

1.2 Chlorhexidine‐based solution

2

214

Risk Ratio (M‐H, Random, 95% CI)

0.22 [0.07, 0.75]

2 Postoperative fever Show forest plot

8

3109

Risk Ratio (M‐H, Fixed, 95% CI)

0.87 [0.72, 1.05]

2.1 Iodine‐based solution

7

2909

Risk Ratio (M‐H, Fixed, 95% CI)

0.87 [0.72, 1.06]

2.2 Chlorhexidine‐based solution

1

200

Risk Ratio (M‐H, Fixed, 95% CI)

0.48 [0.09, 2.56]

3 Postoperative wound infection Show forest plot

8

2839

Risk Ratio (M‐H, Fixed, 95% CI)

0.74 [0.49, 1.11]

3.1 Iodine‐based solution

7

2639

Risk Ratio (M‐H, Fixed, 95% CI)

0.77 [0.50, 1.19]

3.2 Chlorhexidine‐based solution

1

200

Risk Ratio (M‐H, Fixed, 95% CI)

0.55 [0.17, 1.82]

4 Composite wound complication Show forest plot

2

729

Risk Ratio (M‐H, Fixed, 95% CI)

0.63 [0.37, 1.07]

5 Composite wound complication or endometritis Show forest plot

2

499

Risk Ratio (M‐H, Fixed, 95% CI)

0.46 [0.26, 0.82]

Figuras y tablas -
Comparison 1. Vaginal preparation with antiseptic solution versus control (no preparation or saline preparation)
Comparison 2. Vaginal preparation with antiseptic solution versus control (no preparation or saline preparation) ‐ stratified by presence of labor

Outcome or subgroup title

No. of studies

No. of participants

Statistical method

Effect size

1 Post‐cesarean endometritis Show forest plot

5

1846

Risk Ratio (M‐H, Random, 95% CI)

0.58 [0.32, 1.06]

1.1 Women in labor

4

960

Risk Ratio (M‐H, Random, 95% CI)

0.41 [0.19, 0.89]

1.2 Women not in labor

4

886

Risk Ratio (M‐H, Random, 95% CI)

1.00 [0.35, 2.84]

2 Postoperative fever Show forest plot

3

1402

Risk Ratio (M‐H, Fixed, 95% CI)

0.77 [0.57, 1.03]

2.1 Women in labor

3

741

Risk Ratio (M‐H, Fixed, 95% CI)

0.64 [0.43, 0.96]

2.2 Women not in labor

2

661

Risk Ratio (M‐H, Fixed, 95% CI)

0.96 [0.61, 1.49]

3 Postoperative wound infection Show forest plot

3

1402

Risk Ratio (M‐H, Fixed, 95% CI)

0.59 [0.32, 1.08]

3.1 Women in labor

3

741

Risk Ratio (M‐H, Fixed, 95% CI)

0.54 [0.23, 1.24]

3.2 Women not in labor

2

661

Risk Ratio (M‐H, Fixed, 95% CI)

0.65 [0.27, 1.57]

4 Composite wound complication Show forest plot

2

729

Risk Ratio (M‐H, Fixed, 95% CI)

0.64 [0.38, 1.09]

4.1 Women in labor

2

314

Risk Ratio (M‐H, Fixed, 95% CI)

0.77 [0.36, 1.61]

4.2 Women not in labor

2

415

Risk Ratio (M‐H, Fixed, 95% CI)

0.54 [0.25, 1.16]

5 Composite wound complication or endometritis Show forest plot

2

499

Risk Ratio (M‐H, Fixed, 95% CI)

0.47 [0.27, 0.85]

5.1 Women in labor

2

164

Risk Ratio (M‐H, Fixed, 95% CI)

0.34 [0.13, 0.87]

5.2 Women not in labor

2

335

Risk Ratio (M‐H, Fixed, 95% CI)

0.60 [0.29, 1.26]

Figuras y tablas -
Comparison 2. Vaginal preparation with antiseptic solution versus control (no preparation or saline preparation) ‐ stratified by presence of labor
Comparison 3. Vaginal preparation with antiseptic solution versus control (no preparation or saline preparation) ‐ stratified by presence of ruptured membranes

Outcome or subgroup title

No. of studies

No. of participants

Statistical method

Effect size

1 Post‐cesarean endometritis Show forest plot

4

1329

Risk Ratio (M‐H, Fixed, 95% CI)

0.41 [0.27, 0.62]

1.1 Women with ruptured membranes

3

272

Risk Ratio (M‐H, Fixed, 95% CI)

0.24 [0.10, 0.55]

1.2 Women with intact membranes

4

1057

Risk Ratio (M‐H, Fixed, 95% CI)

0.50 [0.31, 0.82]

2 Postoperative fever Show forest plot

3

1169

Risk Ratio (M‐H, Fixed, 95% CI)

0.81 [0.59, 1.11]

2.1 Women with ruptured membranes

2

200

Risk Ratio (M‐H, Fixed, 95% CI)

0.62 [0.34, 1.12]

2.2 Women with intact membranes

3

969

Risk Ratio (M‐H, Fixed, 95% CI)

0.89 [0.61, 1.30]

3 Postoperative wound infection Show forest plot

4

1329

Risk Ratio (M‐H, Random, 95% CI)

0.74 [0.43, 1.30]

3.1 Women with ruptured membranes

3

272

Risk Ratio (M‐H, Random, 95% CI)

1.04 [0.16, 6.70]

3.2 Women with intact membranes

4

1057

Risk Ratio (M‐H, Random, 95% CI)

0.68 [0.36, 1.28]

4 Composite wound complication Show forest plot

1

300

Risk Ratio (M‐H, Fixed, 95% CI)

0.64 [0.28, 1.44]

4.1 Women with ruptured membranes

1

76

Risk Ratio (M‐H, Fixed, 95% CI)

0.53 [0.15, 1.89]

4.2 Women with intact membranes

1

224

Risk Ratio (M‐H, Fixed, 95% CI)

0.73 [0.25, 2.10]

5 Composite wound complication or endometritis Show forest plot

2

500

Risk Ratio (M‐H, Fixed, 95% CI)

0.48 [0.27, 0.85]

5.1 Women with ruptured membranes

2

134

Risk Ratio (M‐H, Fixed, 95% CI)

0.39 [0.13, 1.13]

5.2 Women with intact membranes

2

366

Risk Ratio (M‐H, Fixed, 95% CI)

0.52 [0.26, 1.04]

Figuras y tablas -
Comparison 3. Vaginal preparation with antiseptic solution versus control (no preparation or saline preparation) ‐ stratified by presence of ruptured membranes