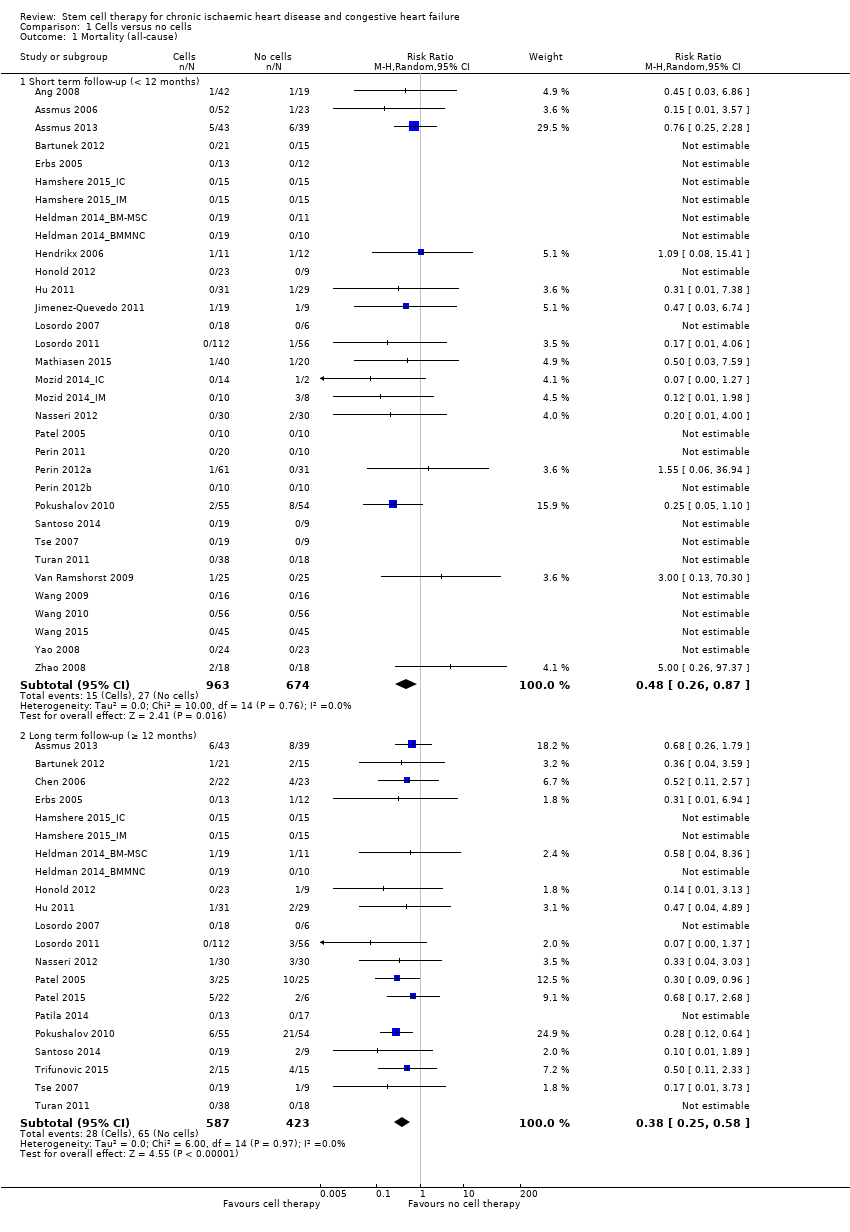
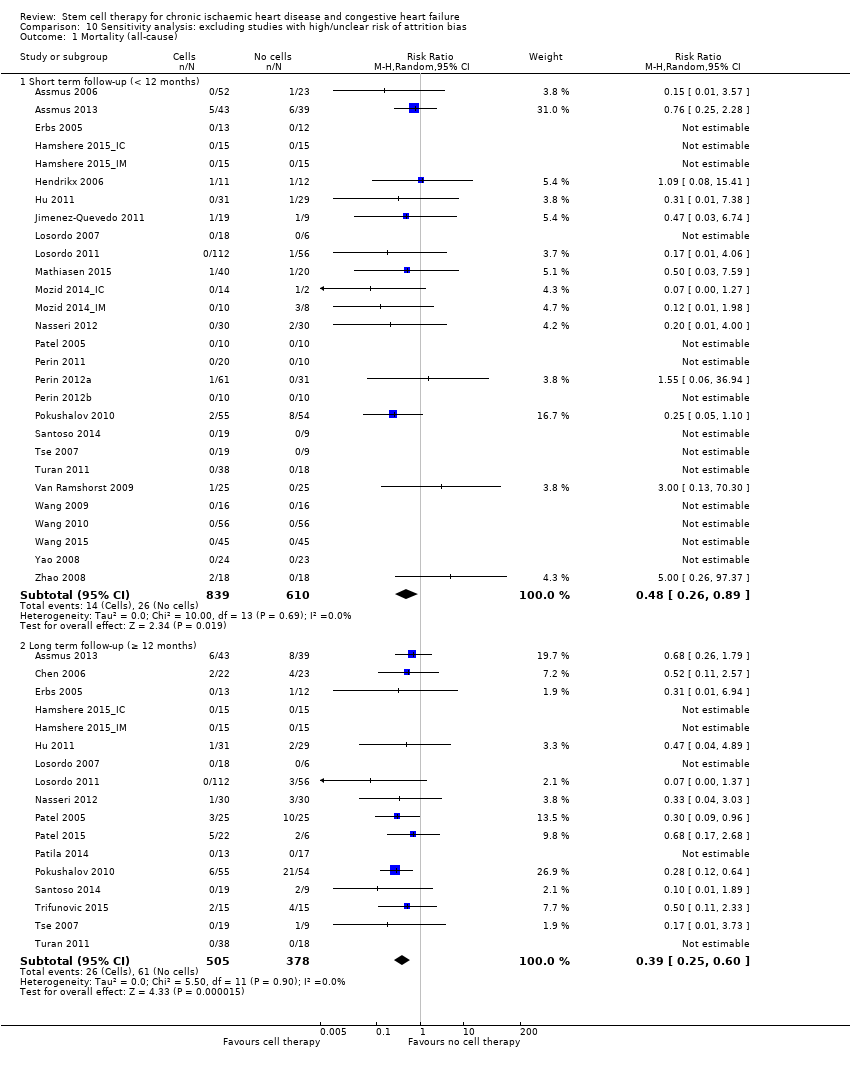
| 1 Mortality (all‐cause) Show forest plot | 37 | | Risk Ratio (M‐H, Random, 95% CI) | Subtotals only |
|
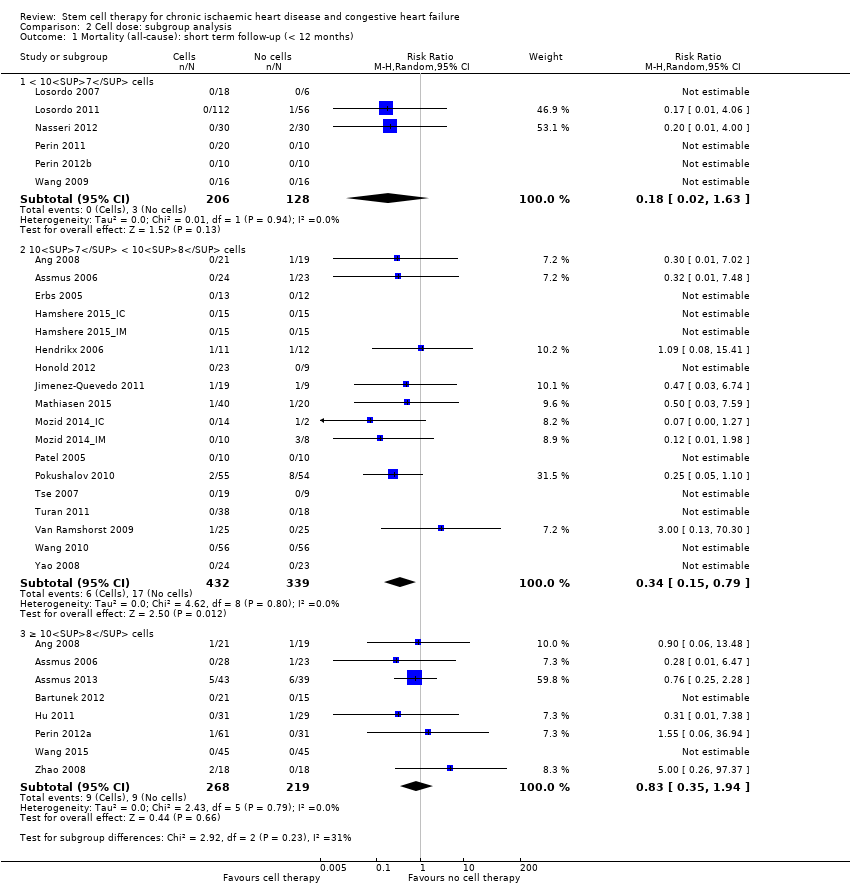
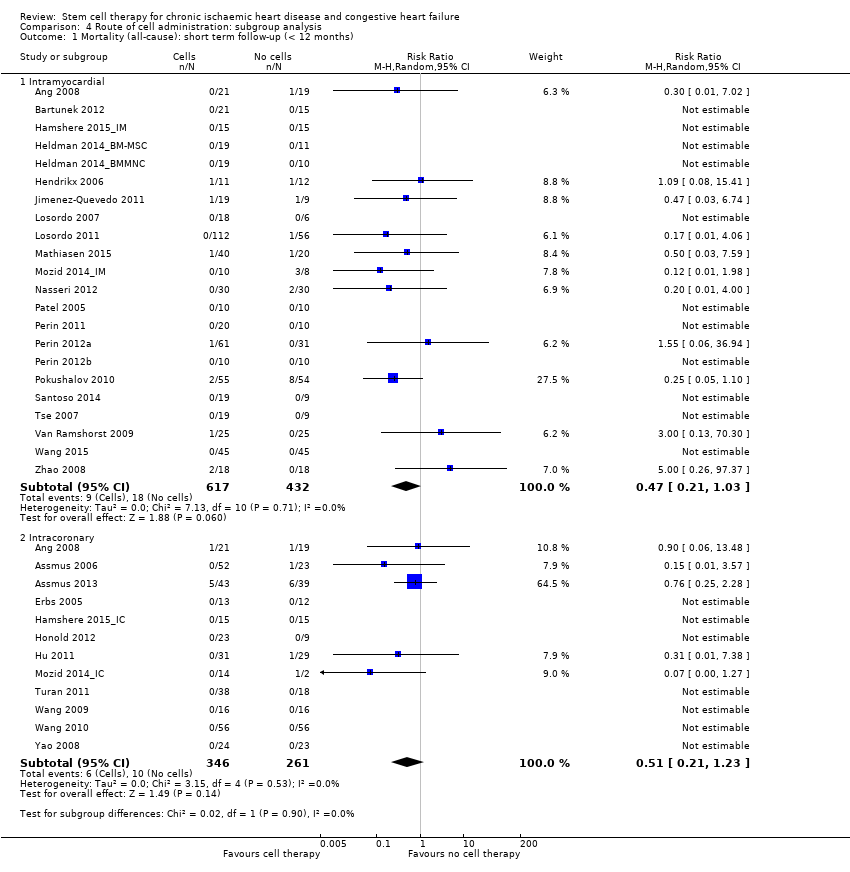
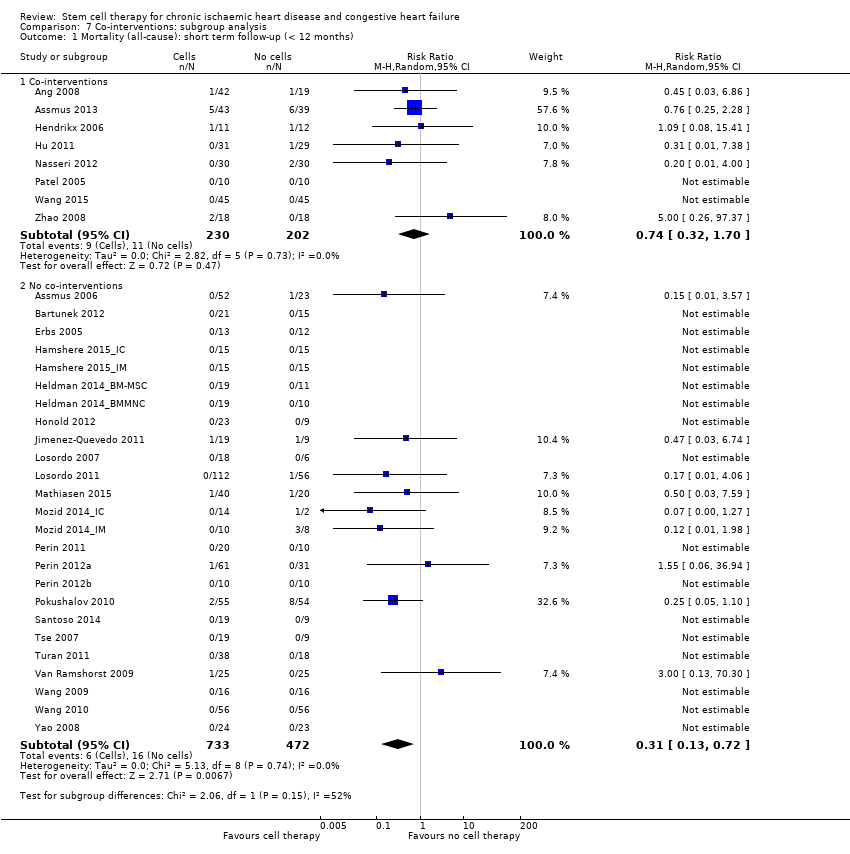
| 1.1 Short term follow‐up (< 12 months) | 33 | 1637 | Risk Ratio (M‐H, Random, 95% CI) | 0.48 [0.26, 0.87] |
| 1.2 Long term follow‐up (≥ 12 months) | 21 | 1010 | Risk Ratio (M‐H, Random, 95% CI) | 0.38 [0.25, 0.58] |
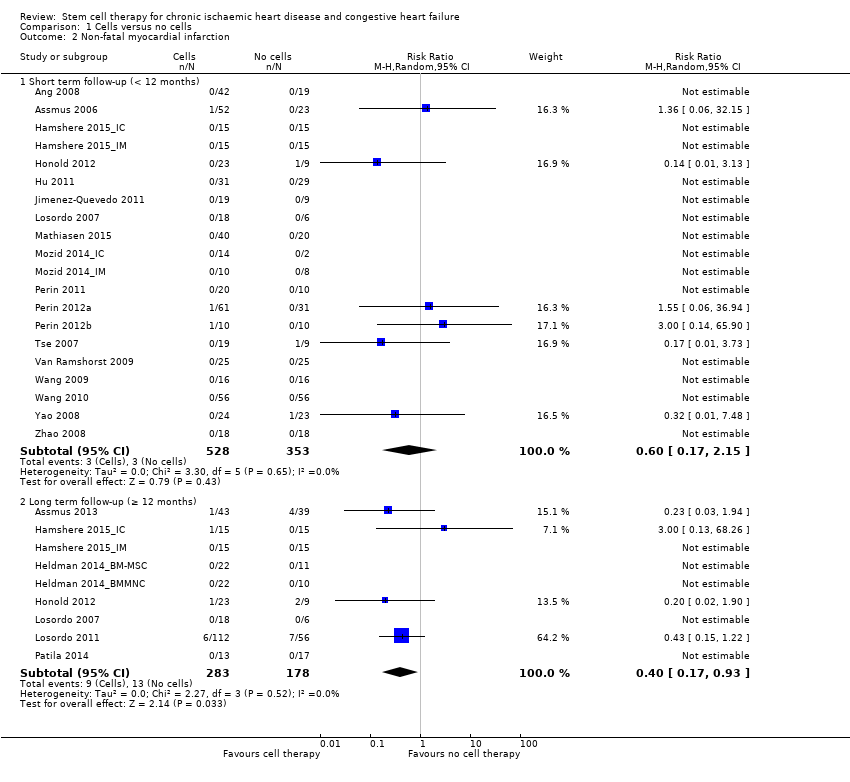
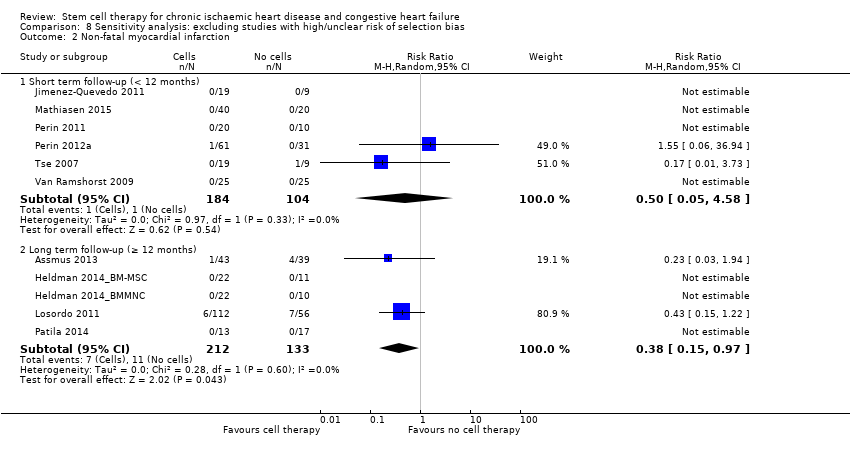
| 2 Non‐fatal myocardial infarction Show forest plot | 25 | | Risk Ratio (M‐H, Random, 95% CI) | Subtotals only |
|
| 2.1 Short term follow‐up (< 12 months) | 20 | 881 | Risk Ratio (M‐H, Random, 95% CI) | 0.60 [0.17, 2.15] |
| 2.2 Long term follow‐up (≥ 12 months) | 9 | 461 | Risk Ratio (M‐H, Random, 95% CI) | 0.40 [0.17, 0.93] |
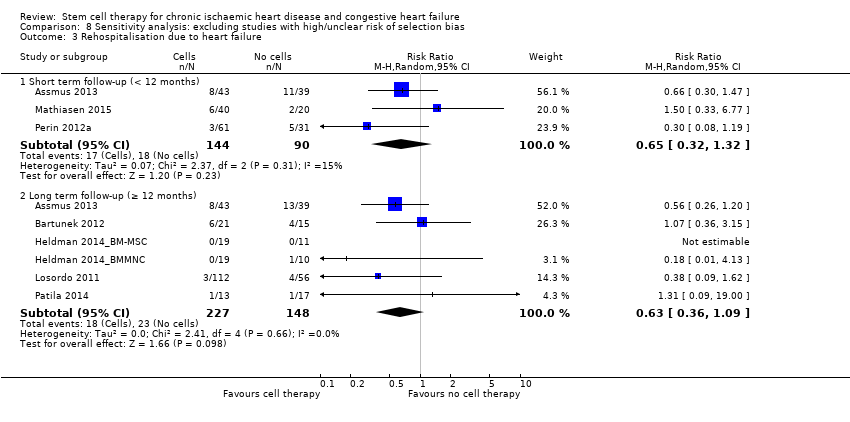
| 3 Rehospitalisation due to heart failure Show forest plot | 16 | | Risk Ratio (M‐H, Random, 95% CI) | Subtotals only |
|
| 3.1 Short term follow‐up (< 12 months) | 10 | 482 | Risk Ratio (M‐H, Random, 95% CI) | 0.63 [0.36, 1.12] |
| 3.2 Long term follow‐up (≥ 12 months) | 10 | 495 | Risk Ratio (M‐H, Random, 95% CI) | 0.62 [0.36, 1.04] |
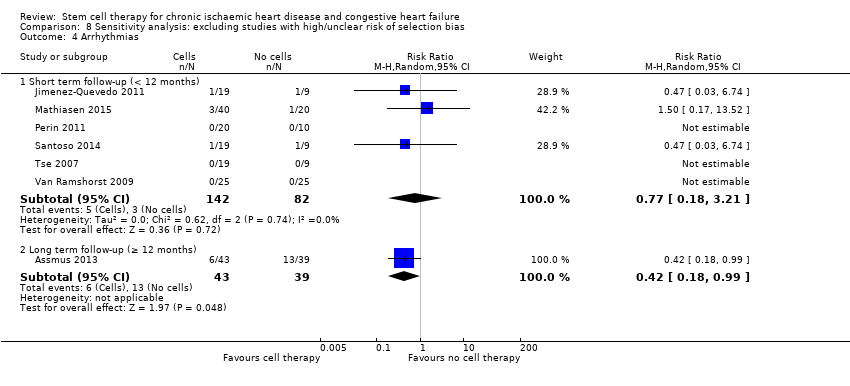
| 4 Arrhythmias Show forest plot | 24 | | Risk Ratio (M‐H, Random, 95% CI) | Subtotals only |
|
| 4.1 Short term follow‐up (< 12 months) | 22 | 959 | Risk Ratio (M‐H, Random, 95% CI) | 0.70 [0.33, 1.45] |
| 4.2 Long term follow‐up (≥ 12 months) | 7 | 363 | Risk Ratio (M‐H, Random, 95% CI) | 0.46 [0.22, 0.97] |
| 5 Composite MACE Show forest plot | 9 | | Risk Ratio (M‐H, Random, 95% CI) | Subtotals only |
|
| 5.1 Short term follow‐up (< 12 months) | 8 | 288 | Risk Ratio (M‐H, Random, 95% CI) | 0.51 [0.18, 1.42] |
| 5.2 Long term follow‐up (≥ 12 months) | 5 | 201 | Risk Ratio (M‐H, Random, 95% CI) | 0.68 [0.41, 1.12] |
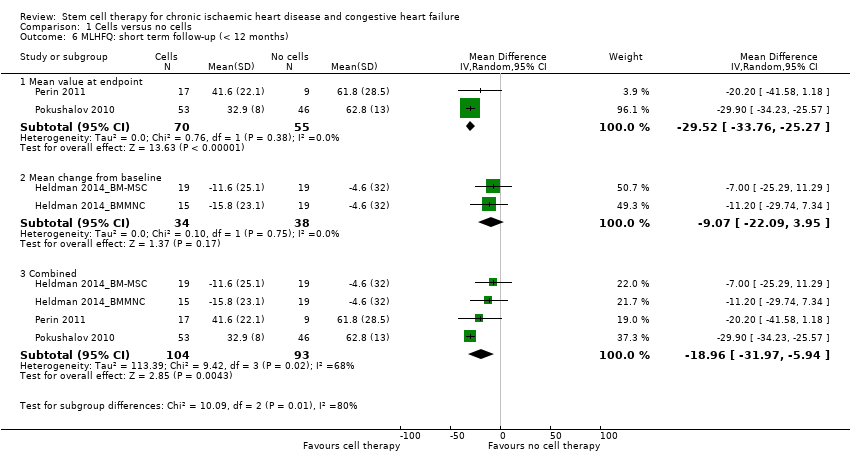
| 6 MLHFQ: short term follow‐up (< 12 months) Show forest plot | 4 | | Mean Difference (IV, Random, 95% CI) | Subtotals only |
|
| 6.1 Mean value at endpoint | 2 | 125 | Mean Difference (IV, Random, 95% CI) | ‐29.52 [‐33.76, ‐25.27] |
| 6.2 Mean change from baseline | 2 | 72 | Mean Difference (IV, Random, 95% CI) | ‐9.07 [‐22.09, 3.95] |
| 6.3 Combined | 4 | 197 | Mean Difference (IV, Random, 95% CI) | ‐18.96 [‐31.97, ‐5.94] |
| 7 MLHFQ: long term follow‐up (≥ 12 months) Show forest plot | 3 | | Mean Difference (IV, Random, 95% CI) | Subtotals only |
|
| 7.1 Mean value at endpoint | 1 | 82 | Mean Difference (IV, Random, 95% CI) | ‐36.5 [‐42.21, ‐30.79] |
| 7.2 Mean change from baseline | 2 | 69 | Mean Difference (IV, Random, 95% CI) | ‐7.63 [‐16.35, 1.09] |
| 7.3 Combined | 3 | 151 | Mean Difference (IV, Random, 95% CI) | ‐17.80 [‐39.87, 4.26] |
| 8 Seattle Angina Questionnaire: short term follow‐up (< 12 months) Show forest plot | 2 | | Mean Difference (IV, Random, 95% CI) | Subtotals only |
|
| 8.1 Mean value at endpoint | 1 | 49 | Mean Difference (IV, Random, 95% CI) | 5.0 [‐3.21, 13.21] |
| 8.2 Mean change from baseline | 2 | 211 | Mean Difference (IV, Random, 95% CI) | 9.34 [2.62, 16.07] |
| 8.3 Combined | 2 | 211 | Mean Difference (IV, Random, 95% CI) | 9.34 [2.62, 16.07] |
| 9 Angina episodes per week: short term follow‐up (< 12 months) Show forest plot | 5 | | Mean Difference (IV, Random, 95% CI) | Subtotals only |
|
| 9.1 Mean value at endpoint | 4 | 396 | Mean Difference (IV, Random, 95% CI) | ‐6.96 [‐11.99, ‐1.93] |
| 9.2 Mean change from baseline | 3 | 167 | Mean Difference (IV, Random, 95% CI) | ‐1.77 [‐14.61, 11.08] |
| 9.3 Combined | 5 | 428 | Mean Difference (IV, Random, 95% CI) | ‐5.11 [‐11.30, 1.09] |
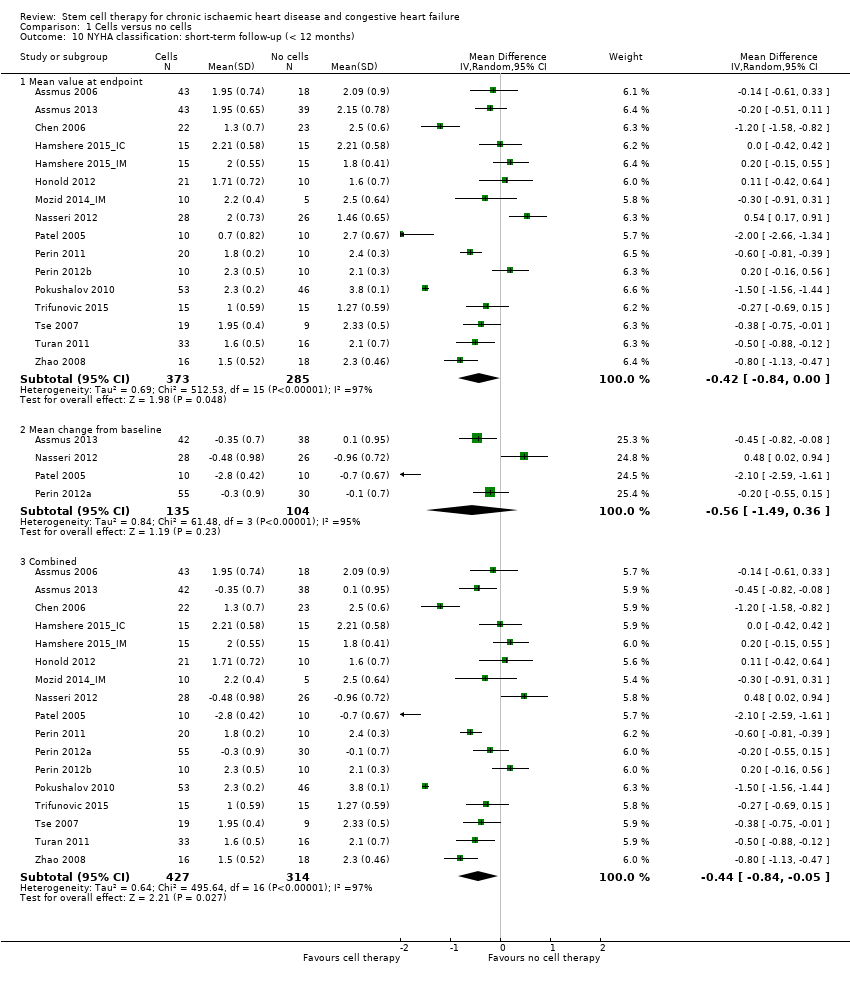
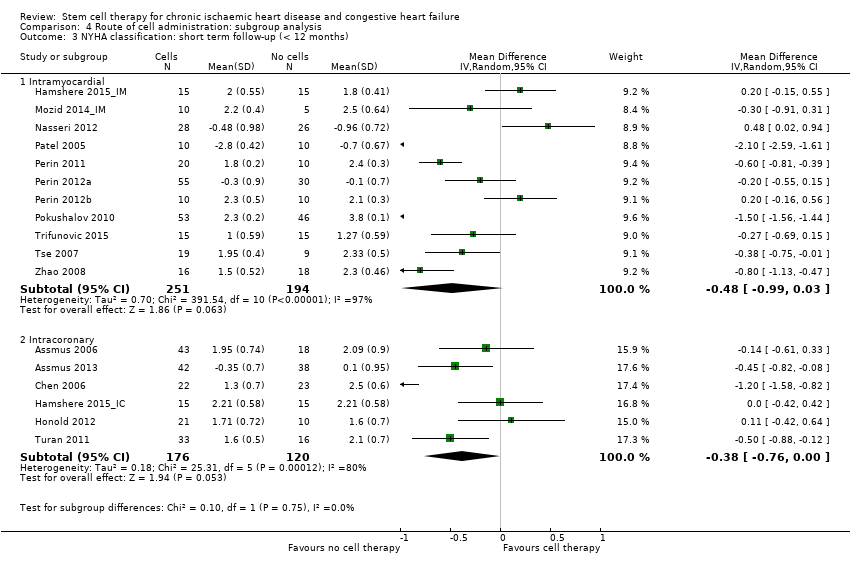
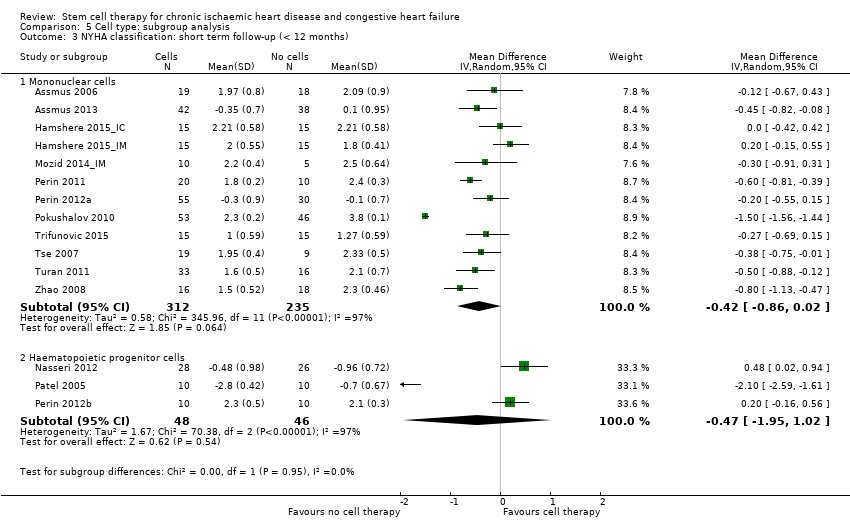
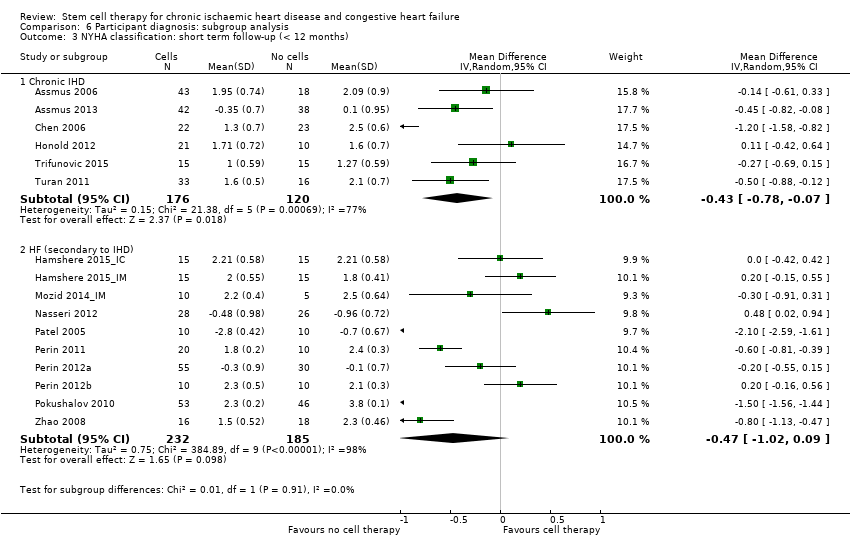
| 10 NYHA classification: short‐term follow‐up (< 12 months) Show forest plot | 17 | | Mean Difference (IV, Random, 95% CI) | Subtotals only |
|
| 10.1 Mean value at endpoint | 16 | 658 | Mean Difference (IV, Random, 95% CI) | ‐0.42 [‐0.84, ‐0.00] |
| 10.2 Mean change from baseline | 4 | 239 | Mean Difference (IV, Random, 95% CI) | ‐0.56 [‐1.49, 0.36] |
| 10.3 Combined | 17 | 741 | Mean Difference (IV, Random, 95% CI) | ‐0.44 [‐0.84, ‐0.05] |
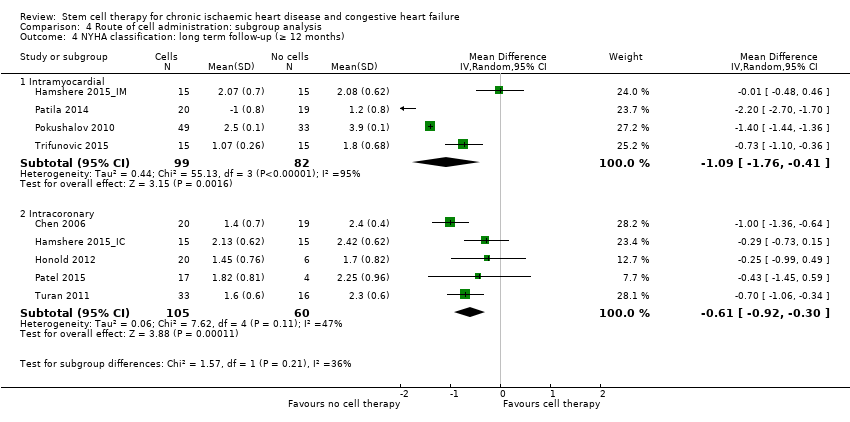
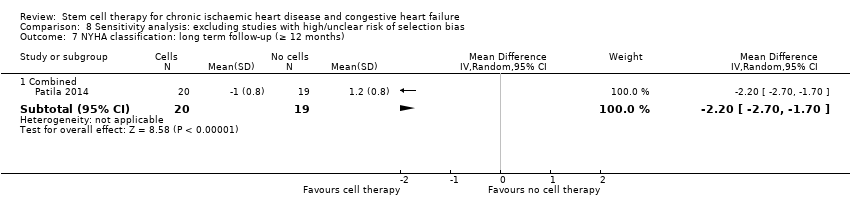
| 11 NYHA classification: long term follow‐up (≥ 12 months) Show forest plot | 9 | | Mean Difference (IV, Random, 95% CI) | Subtotals only |
|
| 11.1 Mean value at endpoint | 9 | 346 | Mean Difference (IV, Random, 95% CI) | ‐0.57 [‐1.03, ‐0.10] |
| 11.2 Mean change from baseline | 1 | 39 | Mean Difference (IV, Random, 95% CI) | ‐2.2 [‐2.70, ‐1.70] |
| 11.3 Combined | 9 | 346 | Mean Difference (IV, Random, 95% CI) | ‐0.81 [‐1.23, ‐0.39] |
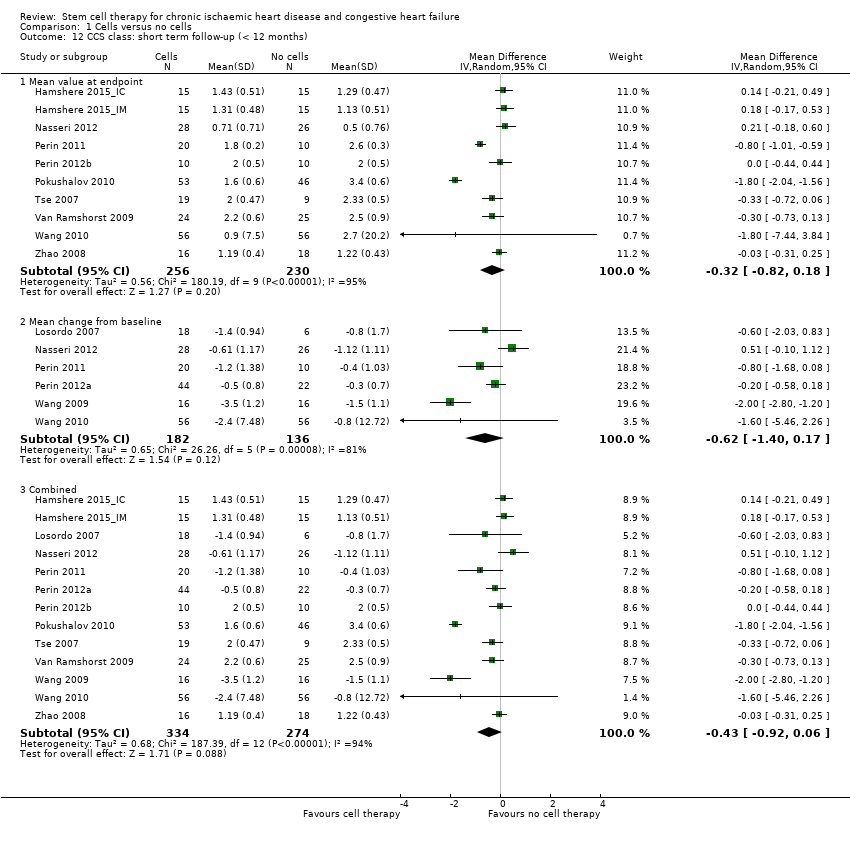
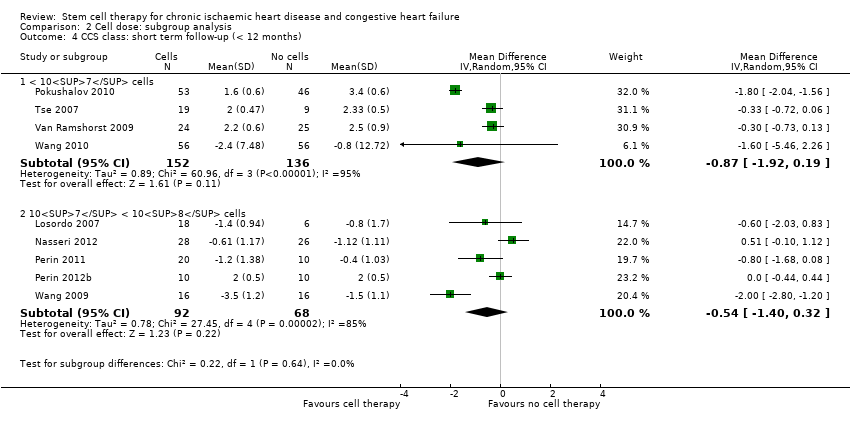
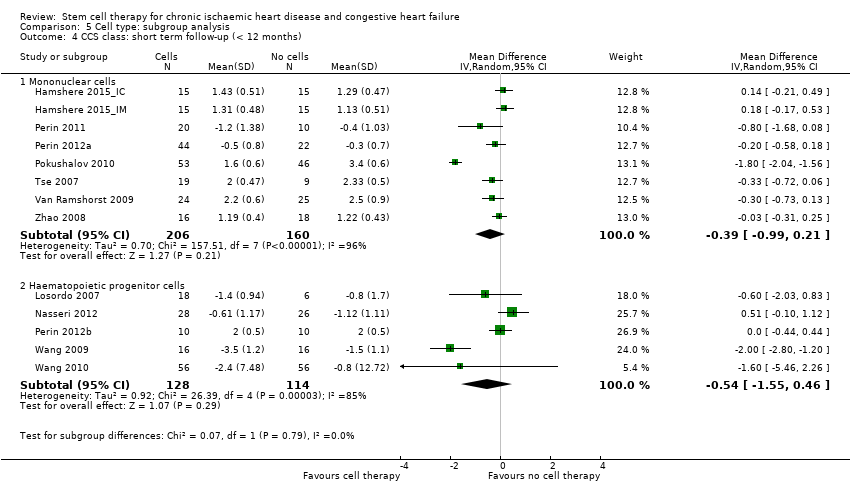
| 12 CCS class: short term follow‐up (< 12 months) Show forest plot | 13 | | Mean Difference (IV, Random, 95% CI) | Subtotals only |
|
| 12.1 Mean value at endpoint | 10 | 486 | Mean Difference (IV, Random, 95% CI) | ‐0.32 [‐0.82, 0.18] |
| 12.2 Mean change from baseline | 6 | 318 | Mean Difference (IV, Random, 95% CI) | ‐0.62 [‐1.40, 0.17] |
| 12.3 Combined | 13 | 608 | Mean Difference (IV, Random, 95% CI) | ‐0.43 [‐0.92, 0.06] |
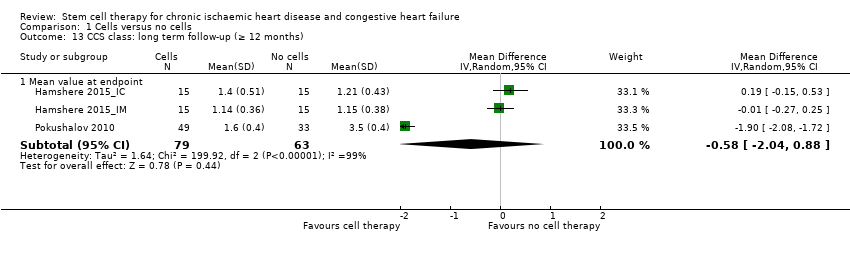
| 13 CCS class: long term follow‐up (≥ 12 months) Show forest plot | 3 | | Mean Difference (IV, Random, 95% CI) | Subtotals only |
|
| 13.1 Mean value at endpoint | 3 | 142 | Mean Difference (IV, Random, 95% CI) | ‐0.58 [‐2.04, 0.88] |
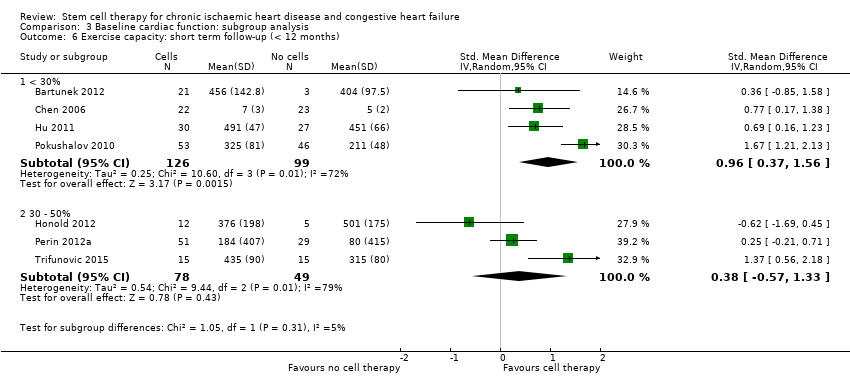
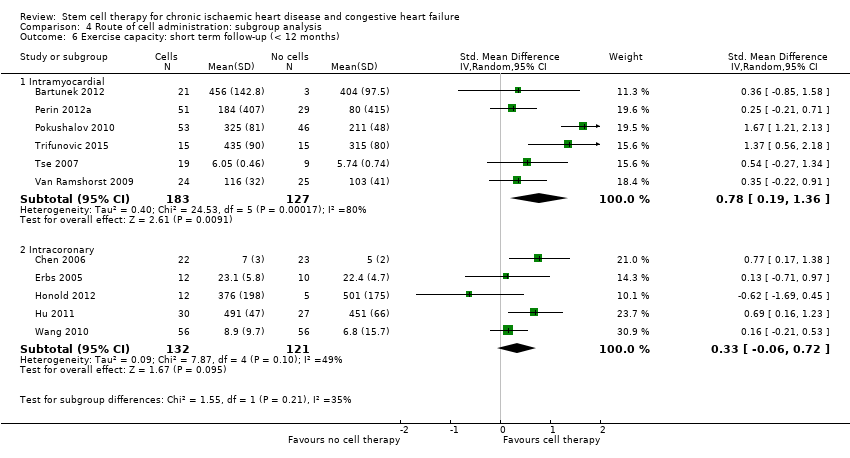
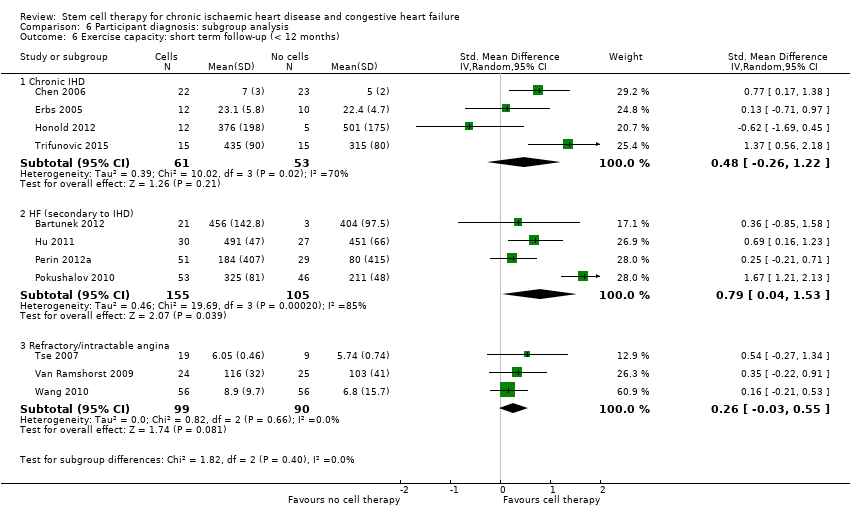
| 14 Exercise capacity: short term follow‐up (< 12 months) Show forest plot | 16 | | Std. Mean Difference (IV, Random, 95% CI) | Subtotals only |
|
| 14.1 Mean value at endpoint | 11 | 563 | Std. Mean Difference (IV, Random, 95% CI) | 0.56 [0.19, 0.93] |
| 14.2 Mean change from baseline | 9 | 535 | Std. Mean Difference (IV, Random, 95% CI) | 0.33 [0.05, 0.61] |
| 15 Exercise capacity: long term follow‐up (≥ 12 months) Show forest plot | 8 | | Std. Mean Difference (IV, Random, 95% CI) | Subtotals only |
|
| 15.1 Mean value at endpoint | 5 | 178 | Std. Mean Difference (IV, Random, 95% CI) | 1.14 [0.04, 2.25] |
| 15.2 Mean change from baseline | 3 | 227 | Std. Mean Difference (IV, Random, 95% CI) | 0.34 [0.07, 0.62] |
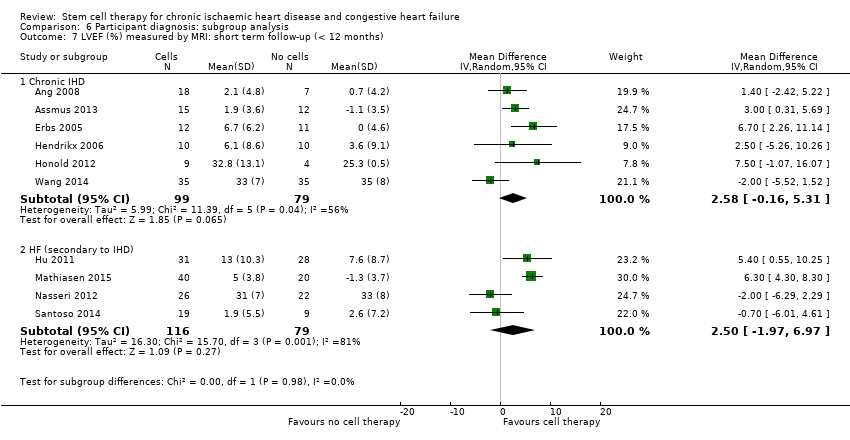
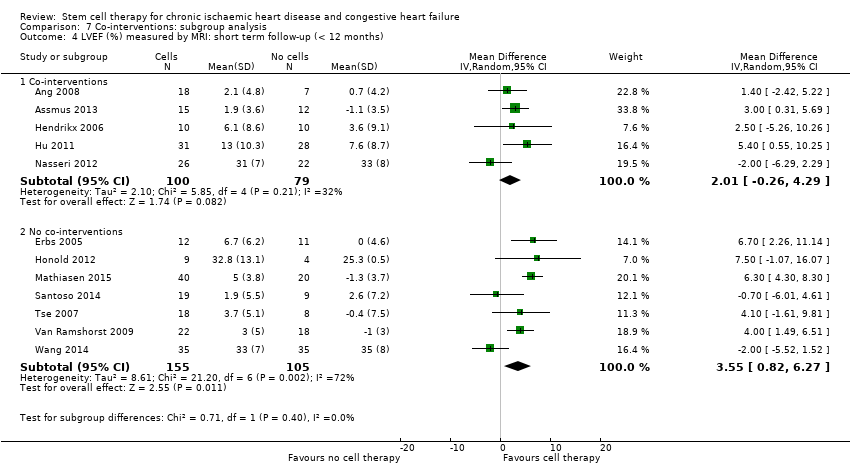
| 16 LVEF (%) measured by MRI: short term follow‐up (< 12 months) Show forest plot | 12 | | Mean Difference (IV, Random, 95% CI) | Subtotals only |
|
| 16.1 Mean value at endpoint | 10 | 352 | Mean Difference (IV, Random, 95% CI) | 3.01 [‐0.05, 6.07] |
| 16.2 Mean change from baseline | 9 | 308 | Mean Difference (IV, Random, 95% CI) | 4.05 [2.55, 5.55] |
| 16.3 Combined | 12 | 439 | Mean Difference (IV, Random, 95% CI) | 2.92 [1.03, 4.82] |
| 17 LVEF (%) measured by MRI: long term follow‐up (≥ 12 months) Show forest plot | 4 | | Mean Difference (IV, Random, 95% CI) | Subtotals only |
|
| 17.1 Mean value at endpoint | 4 | 110 | Mean Difference (IV, Random, 95% CI) | 2.37 [‐1.54, 6.29] |
| 17.2 Mean change from baseline | 3 | 97 | Mean Difference (IV, Random, 95% CI) | 3.83 [‐0.42, 8.08] |
| 17.3 Combined | 4 | 110 | Mean Difference (IV, Random, 95% CI) | 4.38 [0.82, 7.93] |
| 18 LVEF (%) measured by echocardiography: short term follow‐up (< 12 months) Show forest plot | 9 | | Mean Difference (IV, Random, 95% CI) | Subtotals only |
|
| 18.1 Mean value at endpoint | 8 | 388 | Mean Difference (IV, Random, 95% CI) | 5.16 [2.87, 7.44] |
| 18.2 Mean change from baseline | 3 | 161 | Mean Difference (IV, Random, 95% CI) | 3.47 [1.59, 5.34] |
| 18.3 Combined | 9 | 470 | Mean Difference (IV, Random, 95% CI) | 5.71 [4.29, 7.13] |
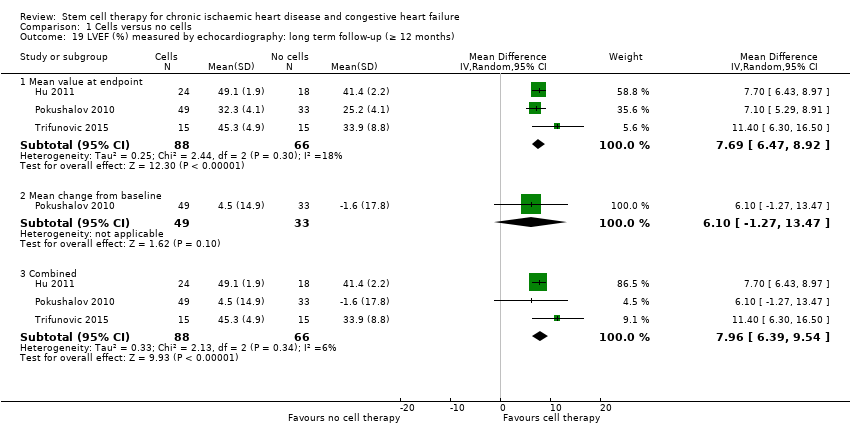
| 19 LVEF (%) measured by echocardiography: long term follow‐up (≥ 12 months) Show forest plot | 3 | | Mean Difference (IV, Random, 95% CI) | Subtotals only |
|
| 19.1 Mean value at endpoint | 3 | 154 | Mean Difference (IV, Random, 95% CI) | 7.69 [6.47, 8.92] |
| 19.2 Mean change from baseline | 1 | 82 | Mean Difference (IV, Random, 95% CI) | 6.1 [‐1.27, 13.47] |
| 19.3 Combined | 3 | 154 | Mean Difference (IV, Random, 95% CI) | 7.96 [6.39, 9.54] |
| 20 LVEF (%) measured by SPECT: short term follow‐up (< 12 months) Show forest plot | 4 | | Mean Difference (IV, Random, 95% CI) | Subtotals only |
|
| 20.1 Mean value at endpoint | 4 | 145 | Mean Difference (IV, Random, 95% CI) | 2.41 [‐2.65, 7.46] |
| 20.2 Mean change from baseline | 1 | 30 | Mean Difference (IV, Random, 95% CI) | ‐2.3 [‐17.33, 12.73] |
| 20.3 Combined | 4 | 145 | Mean Difference (IV, Random, 95% CI) | 5.22 [2.60, 7.85] |
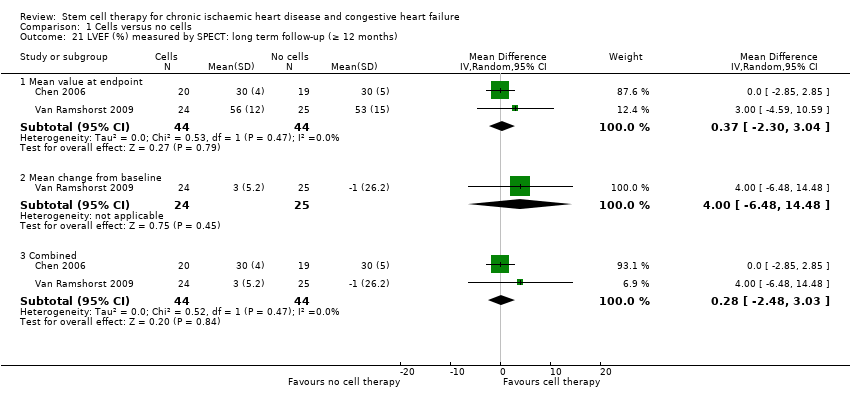
| 21 LVEF (%) measured by SPECT: long term follow‐up (≥ 12 months) Show forest plot | 2 | | Mean Difference (IV, Random, 95% CI) | Subtotals only |
|
| 21.1 Mean value at endpoint | 2 | 88 | Mean Difference (IV, Random, 95% CI) | 0.37 [‐2.30, 3.04] |
| 21.2 Mean change from baseline | 1 | 49 | Mean Difference (IV, Random, 95% CI) | 4.0 [‐6.48, 14.48] |
| 21.3 Combined | 2 | 88 | Mean Difference (IV, Random, 95% CI) | 0.28 [‐2.48, 3.03] |
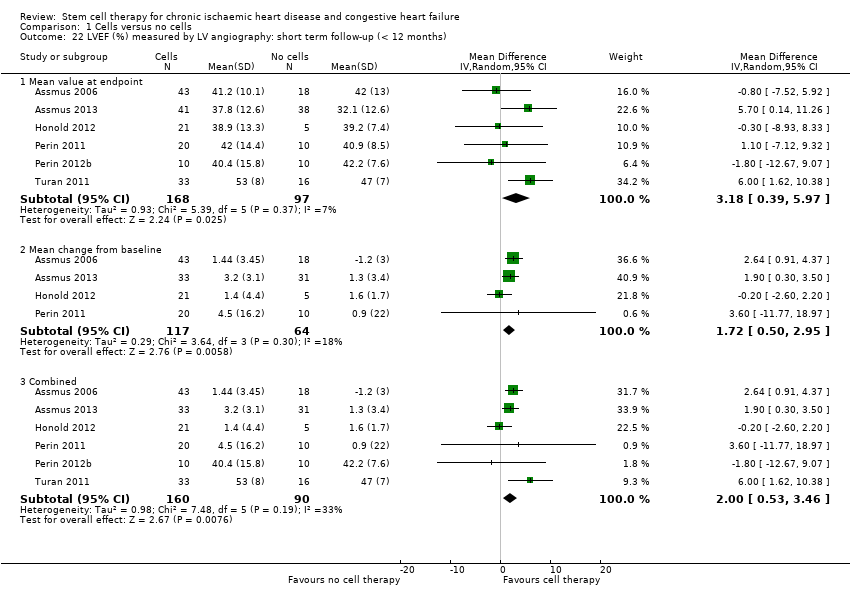
| 22 LVEF (%) measured by LV angiography: short term follow‐up (< 12 months) Show forest plot | 6 | | Mean Difference (IV, Random, 95% CI) | Subtotals only |
|
| 22.1 Mean value at endpoint | 6 | 265 | Mean Difference (IV, Random, 95% CI) | 3.18 [0.39, 5.97] |
| 22.2 Mean change from baseline | 4 | 181 | Mean Difference (IV, Random, 95% CI) | 1.72 [0.50, 2.95] |
| 22.3 Combined | 6 | 250 | Mean Difference (IV, Random, 95% CI) | 2.00 [0.53, 3.46] |
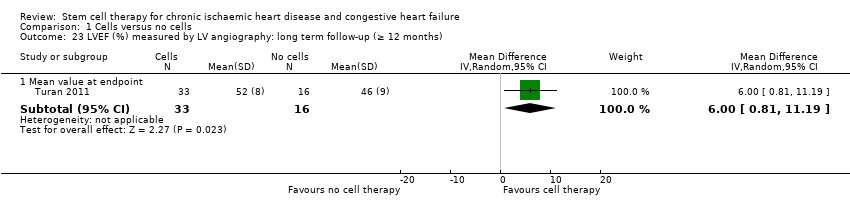
| 23 LVEF (%) measured by LV angiography: long term follow‐up (≥ 12 months) Show forest plot | 1 | | Mean Difference (IV, Random, 95% CI) | Subtotals only |
|
| 23.1 Mean value at endpoint | 1 | 49 | Mean Difference (IV, Random, 95% CI) | 6.0 [0.81, 11.19] |