Stem cell therapy for chronic ischaemic heart disease and congestive heart failure
Abstract
Background
A promising approach to the treatment of chronic ischaemic heart disease and congestive heart failure is the use of stem cells. The last decade has seen a plethora of randomised controlled trials developed worldwide, which have generated conflicting results.
Objectives
The critical evaluation of clinical evidence on the safety and efficacy of autologous adult bone marrow‐derived stem/progenitor cells as a treatment for chronic ischaemic heart disease and congestive heart failure.
Search methods
We searched CENTRAL in the Cochrane Library, MEDLINE, Embase, CINAHL, LILACS, and four ongoing trial databases for relevant trials up to 14 December 2015.
Selection criteria
Eligible studies were randomised controlled trials comparing autologous adult stem/progenitor cells with no cells in people with chronic ischaemic heart disease and congestive heart failure. We included co‐interventions, such as primary angioplasty, surgery, or administration of stem cell mobilising agents, when administered to treatment and control arms equally.
Data collection and analysis
Two review authors independently screened all references for eligibility, assessed trial quality, and extracted data. We undertook a quantitative evaluation of data using random‐effects meta‐analyses. We evaluated heterogeneity using the I2 statistic and explored substantial heterogeneity (I2 greater than 50%) through subgroup analyses. We assessed the quality of the evidence using the GRADE approach. We created a 'Summary of findings' table using GRADEprofiler (GRADEpro), excluding studies with a high or unclear risk of selection bias. We focused our summary of findings on long‐term follow‐up of mortality, morbidity outcomes, and left ventricular ejection fraction measured by magnetic resonance imaging.
Main results
We included 38 randomised controlled trials involving 1907 participants (1114 cell therapy, 793 controls) in this review update. Twenty‐three trials were at high or unclear risk of selection bias. Other sources of potential bias included lack of blinding of participants (12 trials) and full or partial commercial sponsorship (13 trials).
Cell therapy reduced the incidence of long‐term mortality (≥ 12 months) (risk ratio (RR) 0.42, 95% confidence interval (CI) 0.21 to 0.87; participants = 491; studies = 9; I2 = 0%; low‐quality evidence). Periprocedural adverse events associated with the mapping or cell/placebo injection procedure were infrequent. Cell therapy was also associated with a long‐term reduction in the incidence of non‐fatal myocardial infarction (RR 0.38, 95% CI 0.15 to 0.97; participants = 345; studies = 5; I2 = 0%; low‐quality evidence) and incidence of arrhythmias (RR 0.42, 95% CI 0.18 to 0.99; participants = 82; studies = 1; low‐quality evidence). However, we found no evidence that cell therapy affects the risk of rehospitalisation for heart failure (RR 0.63, 95% CI 0.36 to 1.09; participants = 375; studies = 6; I2 = 0%; low‐quality evidence) or composite incidence of mortality, non‐fatal myocardial infarction, and/or rehospitalisation for heart failure (RR 0.64, 95% CI 0.38 to 1.08; participants = 141; studies = 3; I2 = 0%; low‐quality evidence), or long‐term left ventricular ejection fraction when measured by magnetic resonance imaging (mean difference ‐1.60, 95% CI ‐8.70 to 5.50; participants = 25; studies = 1; low‐quality evidence).
Authors' conclusions
This systematic review and meta‐analysis found low‐quality evidence that treatment with bone marrow‐derived stem/progenitor cells reduces mortality and improves left ventricular ejection fraction over short‐ and long‐term follow‐up and may reduce the incidence of non‐fatal myocardial infarction and improve New York Heart Association (NYHA) Functional Classification in people with chronic ischaemic heart disease and congestive heart failure. These findings should be interpreted with caution, as event rates were generally low, leading to a lack of precision.
PICO
Plain language summary
Stem cell treatment for chronic ischaemic heart disease and congestive heart failure
Review question
Are adult stem/progenitor cells derived from bone marrow safe and effective as a treatment for chronic ischaemic heart disease and heart failure?
Background
The current treatment for people suffering from heart disease and heart failure is drugs and, when possible, restoration of the blood supply in the heart (revascularisation) either by opening the arteries with a tiny balloon in a procedure called primary angioplasty (or percutaneous coronary intervention) or by heart surgery (or coronary artery bypass graft). Revascularisation has reduced the death rate associated with these conditions. In some people, heart disease and heart failure symptoms persist even after revascularisation. Recently, bone marrow stem/progenitor cells have been investigated as a new treatment for people with heart disease and heart failure, whether or not they also undergo revascularisation.
Search date
We searched electronic databases for relevant randomised controlled trials to December 2015.
Study characteristics
We included 38 randomised controlled trials involving more than 1900 participants in this review, with 14 trials of chronic ischaemic heart disease, 17 trials of ischaemic heart failure secondary to heart disease, and seven trials of refractory or intractable angina. The mean age of participants ranged from 55 to 70 years, and the proportion of male participants ranged from 51% to 100%.
Key results
Results indicated that treatment with bone marrow‐derived cells can lead to a reduction in deaths in participants followed for at least 12 months. Adverse events occurring around the time of treatment were generally rare. Participants who received cell treatment also experienced fewer heart attacks and arrhythmias when compared to those who received no cells. However, cell therapy does not appear to reduce the risk of rehospitalisation for heart failure or the combined risk of death, non‐fatal heart attack, or rehospitalisation, and did not result in any improvement over standard treatment in tests of heart function. These results suggest that cell therapy may be of benefit in people with chronic ischaemic heart disease or heart failure, or both.
Quality of the evidence
The quality of the evidence was low, as the number of included studies and participants is not currently high enough to draw robust conclusions. Thirteen studies received commercial funding, of which four were fully commercially sponsored, and 12 studies did not report that participants were blinded to the treatment they received. Further research involving a larger number of participants is required to confirm our results.
Authors' conclusions
Summary of findings
| Bone marrow‐derived cell therapy for people with chronic ischaemic heart disease and congestive heart failure | ||||||
| Patient or population: people with chronic ischaemic heart disease and congestive heart failure Comparison: no cell therapy | ||||||
| Outcomes | Illustrative comparative risks* (95% CI) | Relative effect | No of Participants | Quality of the evidence | Comments | |
| Assumed risk | Corresponding risk | |||||
| No cell therapy | Bone marrow‐derived cell therapy | |||||
| Mortality (all cause) Long‐term follow‐up (≥ 12 months) | 102 per 1000 | 43 per 1000 | RR 0.42 | 491 | ⊕⊕⊝⊝ | The required information size of 1899 participants to detect a RRR of 35% has not been reached. |
| Periprocedural adverse events | See comment | See comment | Not estimable | 1695 (34 studies) | See comment | Adverse events occurring during the mapping or cell/placebo injection procedure included ventricular tachycardia (7), ventricular fibrillation (1), atrial fibrillation (1), transient complete heart block (1), transient pulmonary oedema (3), thrombus on mapping catheter tip (1), visual disturbances (2), myocardial perforation (2), limited retrograde catheter‐related dissection of the abdominal aorta (1). |
| Non‐fatal myocardial infarction Long‐term follow‐up (≥ 12 months) | 83 per 1000 | 31 per 1000 | RR 0.38 | 345 | ⊕⊕⊝⊝ | The required information size of 2383 participants to detect a RRR of 35% has not been reached. |
| Rehospitalisation due to heart failure Long‐term follow‐up (≥ 12 months) | 155 per 1000 | 98 per 1000 | RR 0.63 | 375 | ⊕⊕⊝⊝ | The required information size of 1193 participants to detect a RRR of 35% has not been reached. |
| Arrhythmias Long‐term follow‐up (≥ 12 months) | 333 per 1000 | 140 per 1000 | RR 0.42 | 82 | ⊕⊕⊝⊝ | The required information size of 461 participants to detect a RRR of 35% has not been reached. |
| Composite MACE Long‐term follow‐up (≥ 12 months) | 350 per 1000 | 224 per 1000 | RR 0.64 | 141 | ⊕⊕⊝⊝ | The required information size of 431 participants to detect a RRR of 35% has not been reached. |
| LVEF (%) measured by MRI Long‐term follow‐up (≥ 12 months) | ‐ | The mean LVEF (%) measured by MRI in the intervention groups was 1.6 lower (8.7 lower to 5.5 higher). | ‐ | 25 | ⊕⊕⊝⊝ | The required information size of 322 participants to detect a mean difference of 4% has not been reached. |
| *The risk in the intervention group (and its 95% confidence interval) is based on the assumed risk in the comparison group and the relative effect of the intervention (and its 95% CI). ¶Only studies with a low risk of selection bias are included. | ||||||
| GRADE Working Group grades of evidence | ||||||
| 1Six trials received full or partial commercial funding, which could have resulted in a biased assessment of the intervention effect and were therefore deemed to have a high risk of bias. One trial was not blinded (high risk of performance bias) and had a high risk of attrition bias. | ||||||
Background
Description of the condition
Ischaemic heart disease (IHD) is a major health burden worldwide (BHF 2014). Survival following myocardial infarction (MI) has increased in recent years due to state‐of‐the‐art revascularisation techniques such as percutaneous coronary intervention (PCI) and coronary artery bypass graft (CABG) (Skinner 2011). In contrast, the number of people with congestive heart failure (CHF) is rapidly becoming an epidemic (Ambrosy 2014; Lloyd‐Jones 2002). Preventing the progression of IHD and the development of CHF thus remains a challenge.
In IHD, there may be non‐contractile scar tissue that has replaced damaged myocardium, which could cause further damage. The heart also may prevent the death of more cardiomyocytes by reducing the energy demands of contraction, resulting in non‐contracting or hibernating myocardium. This typical physiological response to chronic hypoxic stress, which is identifiable by abnormalities in contractile function, can potentially be reversed by revascularisation of the hibernating myocardium in order to restore cardiac function (Taggart 2012). In some cases, revascularisation is not possible or may not be complete, and in cases with non‐ischaemic cardiomyopathy revascularisation is not relevant and symptoms of chronic myocardial ischaemia, sometimes with refractory angina pectoris, are still present (Taggart 2012).
Alternative and complementary approaches in the treatment of CHF are being developed in the form of cell‐based therapies for CHF. The rationale behind developing cell therapies as treatment for IHD is based on the notion that the heart has limited ability to repair itself following a major injury. Preclinical and clinical studies have suggested that cell therapies could potentially reverse left ventricular dysfunction in chronic IHD and CHF (Heldman 2014; Perin 2012a).
Description of the intervention
The procedure is currently as follows: either the bone marrow is harvested from the recipient, or bone marrow cells are mobilised into circulation by a growth factor stimulant (most commonly granulocyte colony‐stimulating factor (G‐CSF)) (Assmus 2006; Erbs 2005). In the former procedure, cells are usually collected (sometimes under general anaesthesia) from the pelvic bone using large suction needles. The stem/progenitor cells are thereafter separated from other bone marrow cells in sterile conditions (Assmus 2006). The bone marrow harvest and cell separation procedures may take several hours. In the G‐CSF mobilisation procedure, mononuclear cells or progenitor cells are collected as a blood sample and then separated from other blood cells in sterile conditions (Erbs 2005). In both procedures, the cells are infused directly into the recipient's coronary arteries or heart (Ang 2008; Hamshere 2015). The first procedure delivers the cells to the coronary arteries via a special balloon‐catheter during angioplasty (e.g. percutaneous coronary intervention) using a stop‐flow technique (Ang 2008; Hamshere 2015). The latter procedure administers the cells into the heart muscle during an angioplasty‐like procedure using electromechanical mapping and direct intramyocardial injection (e.g. NOGA system) or during cardiac surgery (e.g. coronary artery bypass grafting) (Ang 2008; Hamshere 2015), although this option may be limited by high costs associated with NOGA percutaneous procedure. The interval between the cell collection and their reinfusion varies; some are administered fresh, and others undergo some form of culture and expansion ex vivo that could take two to three weeks (Assmus 2006; Bartunek 2012; Mathiasen 2015).
A haematologist usually undertakes the collection of cells. A specialised technician or scientist undertakes the cell separation from the other bone marrow cells, and the cardiologist or cardiac surgeon peforms the infusion or intramyocardial injection of the cells.
Adverse effects associated with the administration of bone marrow or blood cells as a treatment for people with chronic IHD or CHF are infrequent and generally not serious (Behfar 2014). In those trials where G‐CSF has been administered prior to the cell harvest, transient complications arising from the G‐CSF treatment may occur. However, no long‐term adverse effects have been reported.
This treatment is currently only available in research‐associated facilities, but it is conceivable that, if long‐term effectiveness is confirmed, it might become available to some or all people with chronic heart disease, since bone marrow and peripheral blood harvest is a standard procedure used in bone marrow transplantation. The costs may be high, depending on the procedures used, and currently relate to the costs of cell collection and cell processing (approximately a 10th of the overall cost of the trial). The potential for a large multicentre randomised controlled trial (RCT) is limited by funds and by discordant results from previous RCTs.
How the intervention might work
Clinical trials that have administered bone marrow‐derived cells to people suffering from IHD or CHF have yielded divergent results, and therefore the mechanism of action of such therapies remains unclear. The selection of optimal cell type and the optimal patient cohort to be treated is thus a challenge. Although incorporation into blood vessels and direct generation of cardiomyocytes have been proposed as mechanisms of action (Beltrami 2003; Carr 2008; Martin‐Rendon 2008a; Mathur 2004; Stuckey 2006; Yoon 2005), it is now accepted that a paracrine mechanism may be the major contribution to promoting cardiac repair and limit fibrosis in the damaged myocardium (Ibrahim 2016; Li 2012).
Why it is important to do this review
Cell therapies have the potential to become an exciting new form of treatment for many diseases. Heart disease is one of the clinical settings in which to address this new form of therapy, although the exact clinical role for cell therapy remains to be defined. Cell therapy as treatment for ischaemic heart disease is an experimental therapy that is not widely available and is not part of standard clinical practice. Currently, there are no clinical guidelines on the use of cell therapies for ischaemic heart disease and heart failure. Evidence from early trials and systematic reviews has suggested that cell therapy may result in some improvements over conventional therapy as measured by surrogate tests of heart function (Abdel‐Latif 2007; Assmus 2006; Chen 2006; Jeevanantham 2012). More recent systematic reviews and meta‐analyses have shown conflicting results (Afzal 2015; Fisher 2015b). A recent Cochrane review concluded that there is insufficient evidence for a beneficial effect of cell therapy for people with acute myocardial infarction, with most evidence coming from small trials that showed no difference in clinically relevant outcomes (Fisher 2015a). However, there seems to be robust evidence to suggest that cell therapies have a beneficial effect on people with heart failure (Fisher 2016).
A Cochrane review of cell therapy for people with chronic IHD and CHF included 23 RCTs and found some evidence that bone marrow‐derived cells improve left ventricular ejection fraction (LVEF), reduce the number of deaths and are associated with improved measures of performance in the long term (Fisher 2014). Since publication of the original review, several key new trials have been published (Heldman 2014_BMMNC; Heldman 2014_BM‐MSC; Jimenez‐Quevedo 2011; Mathiasen 2015; Nasseri 2012; Patel 2015; Patila 2014; Santoso 2014; Trifunovic 2015; Wang 2014; Wang 2015). It is important to update the review with these new trials to re‐evaluate and improve the quality of the available evidence.
Objectives
The critical evaluation of clinical evidence on the safety and efficacy of autologous adult bone marrow‐derived stem/progenitor cells as a treatment for chronic IHD and CHF.
Methods
Criteria for considering studies for this review
Types of studies
Randomised controlled trials (RCTs).
Types of participants
Anyone with a clinical diagnosis of IHD or CHF, excluding people with acute myocardial infarction. We included studies evaluating both ischaemic and non‐ischaemic disease only if data for the participants with ischaemic disease could be extracted separately.
Types of interventions
Studies involving the administration of autologous adult bone marrow‐derived stem/progenitor cells on their own or in combination with co‐interventions, such as cardiac surgery, as treatment for IHD or CHF.
Participants in the comparator treatment arm of the trial received either no intervention or a placebo (e.g. the medium in which the cells were suspended or plasma). Trials where co‐interventions (e.g. CABG, PCI, G‐CSF, extracorporal shockwave therapy) were additionally administered were eligible as long as the co‐interventions were equal in both arms and administered to an equivalent proportion of participants.
In summary:
-
any autologous human adult bone marrow‐derived stem/progenitor cells
-
any single dose
-
any method of stem/progenitor cell isolation
-
any route of administration
-
any co‐intervention
-
repeated intervention or multiple doses
Types of outcome measures
Primary outcomes
-
Mortality
-
Periprocedural adverse events (defined as occurring at the time of bone marrow aspiration or administration of cell therapy (or placebo), or documented adverse events within 30 days of treatment)
Secondary outcomes
-
Morbidity: non‐fatal MI, rehospitalisation for heart failure (HF), arrhythmias, composite measure of major adverse clinical events (MACE, mortality, non‐fatal MI, and/or rehospitalisation for HF)
-
Health‐related quality of life (QoL)
-
Performance status (e.g. New York Heart Association (NYHA) classification, Canadian Cardiovascular Society (CCS) class, exercise capacity)
-
Left ventricular ejection fraction (LVEF).
We divided beneficial outcomes into clinically based and surrogate outcomes. At the protocol stage of this review, we had intended to consider clinical and surrogate outcome data at 30 days, 6 months, and 12 months after baseline; however, this was not possible due to the variation in follow‐up periods reported in individual studies. We therefore stratified outcome data into short term (up to 12 months) and long term (12 months or longer) follow‐up. The scope of this version of the review was to assess the clinical benefit or harm of cell therapies in people with ischaemic heart disease and heart failure, and we have therefore focused on clinical outcomes. However, the surrogate outcome of LVEF is a standard, widely reported surrogate for cardiac function and has been retained as a reference point in other trials and systematic reviews of IHD. We have excluded surrogate outcomes other than LVEF reported in previous versions of this review, namely engraftment and survival of the infused cells, end‐systolic volume, end‐diastolic volume, wall motion score, and stroke volume index, in agreement with the Cochrane Heart Group. However, we consider that relevant surrogate outcomes such as left ventricular volumes may be more meaningful than LVEF, and as such, we will consider these surrogate outcomes in the next update of this review.
Search methods for identification of studies
Electronic searches
We updated and expanded the electronic database searches, originally run in March 2013 (see Appendix 1 for details), in June 2014, March 2015, and December 2015 (Appendix 2). We identified relevant studies from searching the following:
-
Cochrane Central Register of Controlled Trials (CENTRAL) (the Cochrane Library, 2015 Issue 11);
-
MEDLINE (OvidSP, 1948 to 14 December 2015);
-
Embase (OvidSP, 1974 to 14 December 2015);
-
CINAHL (EBSCOHost, 1982 to 14 December 2015);
-
PubMed (in process and epublications ahead of print only, on 14 December 2015);
-
LILACS (1982 to 14 December 2015);
-
IndMED (1986 to 14 December 2015);
-
KoreaMed (1997 to 14 December 2015);
-
PakMediNet (1995 to 14 December 2015);
-
Web of Science: Conference Proceedings Citation Index ‐ Science (CPCI‐S) (1990 to 14 December 2015);
-
four databases of ongoing trials on 14 December 2015:
-
ClinicalTrials.gov (clinicaltrials.gov/);
-
ISRCTN Register (www.isrctn.com/);
-
World Health Organization International Clinical Trials Registry Platform (WHO ICTRP) (apps.who.int/trialsearch/);
-
HKU Clinical Trials Registry (www.hkuctr.com).
-
Searching other resources
We checked the reference lists of all identified eligible papers and relevant systematic reviews. We applied no language or date restrictions.
Data collection and analysis
Selection of studies
The Information Specialist (CD) conducted the electronic search for potentially relevant papers and removed references that were duplicates, clearly irrelevant, and/or included in previous search results. Two review authors (SF, EMR) independently screened all titles and abstracts identified by the review search strategy for relevance to the review question. We excluded studies that clearly did not meet the eligibility criteria at this stage. Two review authors (SF, EMR) independently assessed all other studies based on their full text for inclusion/exclusion using the criteria indicated above (type of studies, participants, interventions, and outcome measures). Disagreements were resolved through discussion.
Data extraction and management
Two review authors (SF, EMR) extracted data onto customised data extraction forms that were created and piloted specifically for this review and independently undertook data extraction for all eligible studies. Aside from details relating to the quality of the included studies, we extracted the following two groups of data.
-
Trial characteristics: place of publication, date of publication, population characteristics, setting, detailed nature of intervention, detailed nature of comparator, detailed nature of outcomes. A key purpose of these data was to explain clinical heterogeneity between included studies independently from analysis of the results.
-
Results of included studies for each of the main outcomes indicated in the review question. For dichotomous outcomes, we recorded the numbers of outcomes in treatment and control groups. For continuous outcomes, we recorded the mean and standard deviation. Where standard deviations of mean change from baseline values were not explicitly reported, where possible we calculated the standard deviation based on reported confidence intervals or P values as described in the Cochrane Handbook for Systematic Reviews of Interventions (Higgins 2011), and we used these values in the analysis.
Disagreements between the review authors over data extraction were resolved by consensus. When disagreements regarding any of the above could not be resolved through discussion, we attempted to contact authors of the original trials to provide further details. One review author (SF) then transcribed the data into the systematic review computer software Review Manager 5 (Review Manager 2014).
Assessment of risk of bias in included studies
The two review authors (SF, EMR) independently undertaking the data extraction assessed the risk of bias for each trial using the criteria outlined in the Cochrane Handbook for Systematic Reviews of Interventions (Higgins 2011). For trials included in the previous version of this review, we re‐evaluated the risk of bias in the context of the revised outcomes and long‐term follow‐up studies, and updated accordingly. Disagreements were resolved through discussion.
A study of trials published in Chinese medical journals that were described as randomised found that a high proportion of these trials did not adhere to accepted methodology for randomisation, and hence could not be deemed authentic RCTs (Wu 2009). It is now widely accepted that trials carried out in China may lack appropriate randomisation; we therefore deemed any Chinese studies for which methods of randomisation were not described and could not be clarified with trial authors to have a high risk of selection bias, and evaluated sensitivity to these trials through sensitivity analyses (see Sensitivity analysis section below).
Measures of treatment effect
We carried out separate analyses according to the duration of follow‐up after treatment: short term (less than 12 months) and long term (equal to or greater than 12 months). We expressed dichotomous data for each arm in a particular study as a proportion or risk and the treatment effect as a risk ratio (RR) with 95% confidence intervals (CIs), calculated using Mantel‐Haenszel methods. We expressed continuous data for each arm in a particular study as a mean and standard deviation, and the treatment effect as the mean difference (MD) if outcomes were measured in the same way across trials. For outcomes measured using different methods, we combined the treatment effect data and analysed them using the standardised mean difference (SMD).
Although we intended to analyse continuous outcomes as mean change from baseline, several studies only reported baseline and endpoint data. Where possible, we calculated the standard deviation of the mean change from baseline based on reported confidence intervals or P values, and used these values in the analysis. However, for several studies, insufficient information was reported to calculate the standard deviation. Since the mean difference based on the change from baseline can be assumed to address the same underlying intervention effects as an analysis based on final measures (i.e. the differences in mean final values will on average be the same as the differences in mean change scores), we combined studies reporting mean change from baseline values with those reporting endpoint values, but have presented mean change and endpoint values separately as well as in combined analyses for clarity, as suggested in the Cochrane Handbook (Higgins 2011). We did not conduct this pooling of studies by method of reporting of continuous measures for analyses of exercise capacity, since the assumption of consistent underlying effects does not hold for standardised mean differences.
Unit of analysis issues
Three published reports of trials randomised participants to one of two treatment arms, each with a comparator control group (Hamshere 2015_IC; Hamshere 2015_IM; Heldman 2014_BMMNC; Heldman 2014_BM‐MSC; Mozid 2014_IC; Mozid 2014_IM); we have considered each of these studies as reporting two separate trials within one publication and treat them as such throughout this review. In the first trial (Heldman 2014_BMMNC; Heldman 2014_BM‐MSC), exercise capacity, quality of life, and LVEF measures were reported pooled for both control groups; for these outcomes the pooled control data are used as the comparator for both intervention arms. In other studies in which there were multiple interventions in the same trial compared with a single control group, we combined the intervention trial arms for a single comparison with the comparator (control) arm to avoid double counting of participants and potential correlation of results. We thus pooled data across different methods of administration (intramyocardial/intracoronary) (Ang 2008), cell types (Assmus 2006), and cell doses (Losordo 2007; Losordo 2011). However, for subgroup and sensitivity analyses, where the two intervention arms were classified into different categories (e.g. type of cell, cell dose, route of administration of cells), we included results for each treatment arm in the corresponding group, with the control group included in both groups. In order to avoid unit of analysis issues, we treated cross‐over trials as parallel trials and included them in the review up to the point of cross‐over, i.e. first‐phase data only.
In the analysis of quality of life outcomes, we converted Minnesota Living with Heart Failure Questionnaire (MLHFQ) scores to negative values in order to include these in a meta‐analysis with other measures on different scales using the standardised mean difference.
Dealing with missing data
We attempted to contact the authors of 27 studies (describing 30 independent trials) by email for clarification of methods (randomisation, allocation concealment, and blinding), potential overlapping of studies, and/or requests for additional data. We failed to establish contact with the authors of 16 studies (17 independent trials) by email (Ang 2008; Bartunek 2012; Erbs 2005; Heldman 2014_BMMNC; Heldman 2014_BM‐MSC; Mathiasen 2015; Nasseri 2012; Patel 2015; Perin 2011; Perin 2012a; Perin 2012b; Pokushalov 2010; Santoso 2014; Tse 2007; Wang 2010; Yao 2008; Zhao 2008), and the authors of one study initially responded but did not reply to subsequent emails (Jimenez‐Quevedo 2011).
We are grateful to the authors of 10 studies (12 independent trials) who responded to our emails as follows:
-
Assmus 2006: results were reported for a pooled randomised cohort and a non‐randomised pilot study cohort; the authors provided full clinical and surrogate outcome data for the randomised cohort alone, as well as details of the method of randomisation used;
-
Assmus 2013: we received clarification of analysis sample sizes and confidence intervals for mean change in NYHA;
-
Hendrikx 2006: we received left ventricular end‐systolic volume (LVESV) and end‐diastolic volume (LVEDV) data (as only LVESV/LVEDV index values were reported) (see previous version of this review);
-
Hu 2011: the authors confirmed overlap of multiple publications and provided mean change from baseline data for exercise capacity, LVEF, and other surrogate outcome measures (see previous version of this review);
-
Mozid 2014_IC; Mozid 2014_IM: results were reported pooled across intervention arms; the authors provided mortality, MI, rehospitalisation and arrhythmia rates, and mean NYHA and CCS baseline, follow‐up, and change from baseline values separately for each randomised arm of the trial;
-
Hamshere 2015_IC; Hamshere 2015_IM: this study was published in abstract form only with limited presentation of results. The authors kindly provided data for mortality, morbidity, NYHA class, and CCS class;
-
Patel 2005: we received clarification of randomisation methods;
-
Patila 2014: we received mean (rather than reported median) values for LVEF and NYHA class;
-
Trifunovic 2015: LVEF data were reported graphically; the authors provided the actual data used to generate the graphs;
-
Turan 2011: a discrepancy in brain natriuretic peptide data between papers was resolved; overlap of multiple publications was confirmed.
Assessment of reporting biases
Although we made every effort to identify unpublished studies, we assessed publication bias for the primary outcome of mortality using a funnel plot and with a formal test for publication bias using Egger's test for asymmetry (Egger 1987), implemented with the statistical software programme R v2.14.1 (R Core Team 2013). We accept that asymmetry, one cause of which may be publication bias, is difficult to detect with the small numbers of studies (i.e. fewer than 10) often encountered in systematic reviews.
Data synthesis
We undertook meta‐analyses using Review Manager 5, employing random‐effects models throughout due to the anticipated heterogeneity arising from differences in participant characteristics, interventions, and duration of follow‐up (Review Manager 2014). This differs from the previous version of the review, in which fixed‐effect models were used for meta‐analyses in the first instance.
Although quantitative synthesis was the main method of analysis, we incorporated insights from a qualitative evaluation of studies for an overall interpretation of the data. We based conclusions on patterns of results identified across clearly tabulated results of included studies as well as summary measures, taking both direction and magnitude of any mean effect sizes from random‐effects models into account.
We included all studies in the main analyses irrespective of risk of bias and performed sensitivity analyses for risk of selection, performance, and attrition bias as described in the Sensitivity analysis section below. Periprocedural adverse events were summarised for each trial in tabular form and evaluated descriptively. We made no formal evaluation of the frequency of periprocedural adverse events in each treatment group due to the differences in definition and reporting of periprocedural adverse events between studies.
Within each included trial, all participants were analysed in the treatment groups to which they had been randomised. We undertook an available‐case analysis, including all participants who were randomised to treatment and were included in the analysis, irrespective of whether or not they had received their randomised treatment.
In two trials, no variation in NYHA class, in Trifunovic 2015, or CCS class, in Perin 2012b, between participants within the treatment group was observed (and hence the sample standard deviation was zero). For these outcomes, we estimated the standard deviation by that observed in the control group in order to incorporate these data into the meta‐analysis.
We constructed 'Summary of findings' tables using GRADEpro GDT (GRADEpro GDT). We focused our summary of findings on long‐term follow‐up of the primary outcome of mortality, morbidity (non‐fatal MI, rehospitalisation for HF, composite MACE, arrhythmias) and the surrogate outcome of LVEF measured by magnetic resonance imaging (MRI). We excluded studies with a high or unclear risk of selection bias from random sequence generation from the 'Summary of findings' tables and from summary results presented in the abstract. We made an assessment of the quality of the evidence based on study design limitations, inconsistency of results, indirectness of evidence, imprecision, and publication bias as described in the GRADE handbook (Schünemann 2013), with consideration of the optimal information size generated from trial sequential analysis (TSA).
Trial sequential analysis
Cumulative meta‐analyses may result in type I errors due to an increased risk of random error arising from repeated testing of accumulating data (Borm 2009; Hu 2007; Lan 2003). Trial sequential analysis provides a method of adjusting the thresholds for statistical significance while maintaining the overall desired type I error rate (Wettersley 2008). These adjusted thresholds are known as trial sequential monitoring boundaries (TSMBs). If the cumulative Z‐curve crosses the TSMB, then statistical significance has been reached whilst maintaining the overall type I error rate. Trial sequential analysis also provides a required information size, the meta‐analysis information size needed to detect a statistically significant effect with overall desired power and type I error given a defined underlying model. We calculated the required information size for the outcomes of all‐cause mortality (primary outcome), morbidity outcomes (non‐fatal MI, rehospitalisation for HF, composite MACE, and arrhythmias), and LVEF at long‐term follow‐up using the TSA program (TSA 2011). For dichotomous outcomes, the required information size was based on a DerSimonian and Laird random‐effects model for a relative risk reduction of 35% (equivalent to the reduced risk of mortality associated with PCI, Hartwell 2005, and less than that associated with CABG, Benedetto 2016). We acknowledge that this may be an overestimation of the effect of cell therapy, but as an arbitrary value it provides a benchmark comparison. Small treatment effects will require a larger information size. We assumed an incidence rate in the control group equal to that observed in our control data. For LVEF and NYHA class, we calculated the information size using a DerSimonian and Laird random‐effects model with a model variance‐based heterogeneity correction assuming an a priori absolute mean difference in change from baseline values of 4% (LVEF) or a mean difference of 1 (NYHA class). We excluded studies with a high or unclear risk of selection bias from random sequence generation from TSA. For outcomes demonstrating efficacy of cell therapy, cumulative Z‐scores (i.e. the Z‐statistics obtained after sequential inclusion of each trial) were constructed and assessed for significance against the trial sequential monitoring boundaries, calculated using the O'Brien‐Fleming β‐spending function for a reduced overall 5% type I error rate and 80% power.
Subgroup analysis and investigation of heterogeneity
A range of different methods (MRI, left ventricular angiography (LVA), single‐photon emission computed tomography (SPECT), echocardiography, and radionuclide ventriculography (RNV)) were used to measure LVEF across studies, with several studies reporting LVEF as an outcome using more than one method of measurement. The limitations of some of these methods are well known (Arnesen 2007). Consistent with the previous version of this review, we subgrouped analyses of LVEF according to the measurement method used.
We assessed the percentage of variability in effect estimates due to heterogeneity using the I2 statistic (Higgins 2002; Higgins 2003). We performed pre‐planned subgroup analysis for mortality (primary outcome). For outcomes with substantial observed heterogeneity (I2 ≥ 50%) in combined analyses (or separate analyses for outcomes reported as standardised mean difference) and a minimum of three studies in each subgroup, we investigated potential sources of heterogeneity by performing the subgroup analyses described below as exploratory analyses, and by visual inspection of forest plots with consideration of individual trial characteristics (Higgins 2003). Where possible, we based subgroup analyses on combined analyses of mean values at endpoint and mean change from baseline values, consistent with the main analyses as described in the Measures of treatment effectsection above. We performed subgroup analyses on all available trials irrespective of risk of bias.
Subgroup analysis considered the following factors:
-
mean dose of stem/progenitor cells administered (≤ 107, 107 to 108, or > 108);
-
route of cell administration (intramyocardial, intracoronary);
-
baseline cardiac function (mean baseline LVEF < 30%, 30% to 50%, or > 50%);
-
type of cell administered (mononuclear cells; circulating progenitor cells; haematopoietic progenitor cells; and mesenchymal stem cells);
-
participant diagnosis (chronic IHD; HF (secondary to IHD); intractable/refractory angina), classified in consultation with a clinical expert (AM);
-
use of co‐interventions (PCI or CABG or shockwave administered or not administered).
We regarded the last three subgroup comparisons listed above as hypothesis‐generating.
For trials with multiple active‐intervention arms, in subgroup analyses where the intervention arms were stratified across the subgrouping strata, we used the single control group as the comparator in each subgroup.
Sensitivity analysis
For the outcomes of mortality, non‐fatal MI, rehospitalisation for HF, composite major adverse clinical events, NYHA class, and LVEF measured by MRI, we assessed results for sensitivity to risk of selection bias (by excluding studies with a high or unclear risk of bias from random sequence generation). We also assessed the primary outcome of mortality for sensitivity to risk of attrition bias (by excluding studies with a high or unclear risk of attrition bias) and performance bias (by excluding studies with a high or unclear risk of performance bias due to known lack of blinding of participants and clinicians).
Results
Description of studies
Results of the search
We identified a total of 20,646 references from the electronic database searches. De‐duplication and removal of all clearly irrelevant references by the Information Specialist (CD) excluded 14,955 references. Initial screening of the remaining 5691 citations against inclusion criteria excluded a further 5486 references. Of the remaining 205 citations, we subsequently excluded 70 references (describing 54 independent studies), as they did not fully meet the inclusion criteria (see Excluded studies). Five further references described four independent study protocols (see Ongoing studies). Ten studies (12 references) were published in abstract form only, and although they appeared to meet the inclusion criteria, they did not contain sufficient data for inclusion; we have identified these as Studies awaiting classification. The remaining 118 citations describe a total of 38 independent RCTs (see Included studies). A summary of study classification is displayed in a PRISMA flow diagram (Figure 1).

PRISMA flow diagram.
Searching of ongoing trial databases identified 1302 trial records. De‐duplication and removal of clearly irrelevant trials by the Information Specialist (CD) excluded 949 records. Of the remaining 353 records, 22 described included studies and 31 were ongoing trials that met the eligibility criteria and are shown in Ongoing studies.
Included studies
Thirty‐eight studies met the inclusion criteria for this review, including a total of 1907 randomised participants (1114 bone marrow‐derived stem/progenitor cells and 793 controls) who were assessed for the primary outcomes of the study. Sixteen independent trials are new to this review update (Bartunek 2012; Hamshere 2015_IC; Hamshere 2015_IM; Heldman 2014_BMMNC; Heldman 2014_BM‐MSC; Jimenez‐Quevedo 2011; Mathiasen 2015; Mozid 2014_IC; Mozid 2014_IM; Nasseri 2012; Patel 2015; Patila 2014; Santoso 2014; Trifunovic 2015; Wang 2014; Wang 2015), representing an approximately 70% increase in the number of included participants from the previous version of the review. One study included in the original review was excluded in this update, as the co‐intervention of G‐CSF administered to the cell therapy group was not given to the control group (Kang 2006). See Table 1 for a summary of study participants.
| Study ID | Country of study | Patient population | Mean (SD) age of participants (years) | % Male | No. randomised participants receiving intervention | No. randomised participants receiving comparator | Mean duration of follow‐up |
| UK | CIHD (> 1 chronic myocardial scar; elective CABG) | BMMNC‐IM: 64.7 (8.7) BMMNC‐IC: 62.1 (8.7) Controls: 61.3 (8.3) | BMMNC‐IM: 71.4% BMMNC‐IC: 90.5% Controls: 90.0% | 42 (21 IM, 21 IC) | 21 | 6 months | |
| Germany | CIHD (MI > 3 months; LV dysfunction) | BMMNC: 59 (12) CPC: 54 (12) Controls: 61 (9) | BMMNC: 89% CPC: 79% Controls: 100% | 52 (28 MNC, 24 CPC) | 23 | 3 months | |
| Germany | CIHD (MI > 3 months; LVEF < 50%; NYHA class II or greater) | BMMNC‐LDSW: 65 (12) BMMNC‐HDSW: 58 (11) Controls‐LDSW: 60 (10) Controls‐HDSW: 63 (10) | BMMNC‐LDSW: 77% BMMNC‐HDSW: 86% Controls‐LDSW: 80% Controls‐HDSW: 90% | 43 (22 LDSW, 21 HDSW) | 39 (20 LDSW, 19 HDSW) | 45.7 (17) months | |
| Belgium/ Serbia/ Switzerland | HF (LVEF 15% to 40%; ischaemic event > 2 months) | BM‐MSC: 55.3 (SE 10.4) Controls: 58.7 (SE 8.2) | BM‐MSC: 90.5% Controls: 86.7% | 32 | 15 | 24 months | |
| China | CIHD (isolated, chronic LAD; LVEF < 40%) | BM‐MSC: 59.3 (6.8) Controls: 57.8 (7.2) | BM‐MSC: 88% Controls: 92% | 24 | 24 | 12 months | |
| Germany | CIHD (chronic total occlusion; myocardial ischaemia) | CPC: 63 (7) Controls: 61 (9) | CPC: 71% Controls: 86% | 14 | 14 | 15 months | |
| UK | HF (NYHA class II‐IV; no revascularisation options) | BMMNC: n/r Controls: n/r | BMMNC: n/r Controls: n/r | 15 | 15 | 12 months | |
| UK | HF (NYHA class II‐IV; no revascularisation options) | BMMNC: n/r Controls: n/r | BMMNC: n/r Controls: n/r | 15 | 15 | 12 months | |
| USA | CIHD (chronic MI; LV dysfunction) | BMMNC: 61.1 (8.4) Controls: 61.3 (9.0) | BMMNC: 89.5% Controls: 100% | 22 | 10 | 12 months | |
| USA | CIHD (chronic MI; LV dysfunction) | BM‐MSC: 57.1 (10.6) Controls: 60.0 (12.0) | BM‐MSC: 94.7% Controls: 90.9% | 22 | 11 | 12 months | |
| Belgium | CIHD (transmural MI; LV dysfunction; elective CABG) | BMMNC: 63.2 (8.5) Controls: 66.8 (9.2) | BMMNC: 100% Controls: 70% | 11 | 12 | 4 months | |
| Germany | CIHD (MI > 3 months; LV regional wall motion abnormality) | CPC: 53.4 (12.3) Controls: 58.8 (7.3) | CPC: 82% Controls: 100% | 23 | 10 | 60 months | |
| China | HF (MI > 3 months; LVEF < 30%; elective CABG) | BMMNC: 56.6 (9.7) Controls: 58.3 (8.9) | BMMNC: 88% Controls: 96% | 31 | 29 | 12 months | |
| Spain | Refractory angina (CCS class II‐IV) | CD133+: median 70.0 Controls: median 58.2 | CD133+: 78.9% Controls: 100% | 19 | 9 | 6 months | |
| USA | Refractory angina (CCS class III‐IV) | CD34+/controls pooled: 62.4 (range 48 to 84) | CD34+/controls pooled: 80% | 18 (6 LD, 6 MD 6, HD) | 6 | 6 months | |
| USA | Refractory angina (CCS class III‐IV) | CD34+/LD: 61.3 (9.1) CD34+/HD: 59.8 (9.2) Controls: 61.8 (8.5) | CD34+/LD: 83.6% CD34+/HD: 87.5% Controls: 89.3% | 112 (56 LD, 56 HD) | 56 | 12 months | |
| Denmark | HF (NYHA class II‐III; LVEF < 45%; no revascularisation options) | BM‐MSC: 66.1 (7.7) Controls: 64.2 (10.6) | BM‐MSC: 90% Controls: 70% | 40 | 20 | 6 months | |
| UK | HF (NYHA class II‐IV; no revascularisation options) | BMMNC/controls pooled (16 participants): 70 (10) | BMMNC/controls pooled (16 participants): 94% | 14 | 2 | 6 months | |
| UK | HF (NYHA class II‐IV; no revascularisation options) | BMMNC/controls pooled (18 participants): 64 (9) | BMMNC/controls pooled (18 participants): 100% | 10 | 8 | 6 months | |
| Germany | HF (LVEF < 35%; elective CABG) | CD133+: 61.9 (7.3) Controls: 62.7 (10.6) | CD133+: 93% Controls: 97% | 30 | 30 | 6 months | |
| Argentina | HF (LVEF < 35%; NYHA class III‐IV; elective CABG) | CD34+: 64.8 (7.1) Controls: 63.6 (5.2) | CD34+: 80% Controls: 80% | 25 | 25 | 10 years | |
| USA/Germany/India | HF (LVEF < 40%; NYHA class III‐IV) | BMAC: 58.5 (12.7) Controls: 52.7 (8.5) | BMAC: 91.7% Controls: 100% | 24 | 6 | 12 months | |
| Finland | HF (LVEF 15% to 40%; NYHA class II‐IV; elective CABG) | BMMNC: median 65 (range 57 to 73) Controls: median 64 (range 58 to 70) | BMMNC: 94.7% Controls: 95.0% | 20 | 19 | 12 months | |
| USA | HF (angina/HF symptoms; chronic CAD; LVEF < 40%; no revascularisation options) | BMMNC: 56.3 (8.6) Controls: 60.5 (6.4) | BMMNC: 50% Controls: 80% | 20 | 10 | 6 months | |
| USA | HF (CCS class II‐IV or NYHA class II‐III, or both; LVEF < 45%; no revascularisation options) | BMMNC: 64.0 (10.9) Controls: 62.3 (8.3) | BMMNC: 86.9% Controls: 93.7% | 61 | 31 | 6 months | |
| USA | HF (CCS class II‐IV or NYHA class II‐III, or both; LVEF < 45%; no revascularisation options) | ALDH+: 58.2 (6.1) Controls: 57.8 (5.5) | ALDH+: 90% Controls: 80% | 10 | 10 | 6 months | |
| Russia | HF (LVEF < 35%; no revascularisation options) | BMMNC: 61 (9) Controls: 62 (5) | BMMNC: 87% Controls: 85% | 55 | 54 | 12 months | |
| Indonesia/China | HF (NYHA class III‐IV; LVEF < 40%; no revascularisation options) | BMMNC: 58 (5.9) Controls: 60 (5.6) | BMMNC: 95% Controls: 100% | 19 | 9 | 6 months | |
| Serbia | CIHD (MI < 30 days; LVEF < 40%; NYHA class III‐IV; elective CABG) | BMMNC: 53.8 (10.1) Controls: 60.0 (6.8) | BMMNC: 93.3% Controls: 93.3% | 15 | 15 | Median 5 years (IQR 2.5 to 7.5) | |
| China/Australia | Refractory angina (CCS class III‐IV) | BMMNC: 65.2 (8.3) Controls: 68.9 (6.3) | BMMNC: 79% Controls: 88% | 19 | 9 | 6 months | |
| Germany | CIHD (MI > 3 months; LV dysfunction) | BMMNC: 62 (10) Controls: 60 (9) | BMMNC: 52.6% Controls: 55.6% | 38 | 18 | 12 months | |
| The Netherlands | Refractory angina (CCS class II‐IV) | BMMNC: 64 (8) Controls: 62 (9) | BMMNC: 92% Controls: 80% | 25 | 25 | 6 months | |
| China | Refractory angina (MI > 1 month) | CD34+: 60.6 (n/r) Controls: 60.0 (n/r) | CD34+: 56.3% Controls: 63.3% | 16 | 16 | 6 months | |
| China | Refractory angina (CCS class III‐IV) | CD34+: range 42 to 80 Controls: range 43 to 80 | CD34+: 51.8% Controls: 50.0% | 56 | 56 | 6 months | |
| China | CIHD (LVEF < 35%) | CD133+: n/r Controls: n/r | CD133+: n/r Controls: n/r | 35 | 35 | 6 months | |
| China | CIHD (multivessel disease; MI > 4 weeks; elective CABG) | BMMNC: 61.4 (7.5) Controls: 62.9 (6.9) | BMMNC: 82% Controls: 78% | 45 | 45 | 6 months | |
| China | CIHD (MI > 6 months) | BMMNC: 54.8 (11.5) Controls: 56.3 (7.9) | BMMNC: 96% Controls: 96% | 24 | 23 | 6 months | |
| China | HF (LVEF < 40%; elective CABG) | BMMNC: 60.3 (10.4) Controls: 59.1 (15.7) | BMMNC: 83.3% Controls: 83.3% | 18 | 18 | 6 months |
ALDH: aldehyde dehydrogenase
BMAC: bone marrow aspirate concentrate
BMMNC: bone marrow mononuclear cells
BM‐MSC: bone marrow‐derived mesenchymal stem cells
CABG: coronary artery bypass grafting
CCS: Canadian Cardiovascular Society
CIHD: chronic ischaemic heart disease
CPC: circulating progenitor cells
EF: ejection fraction
HD: high dose
HDSW: high dose shockwave
HF: heart failure
IC: intracoronary
IM: intramyocardial
IQR: interquartile range
LAD: left ventricular assist device
LD: low dose
LDSW: low dose shockwave
LV: left ventricular
LVEF: left ventricular ejection fraction
MD: medium dose
MI: myocardial infarction
MNC: mononuclear cells
n/r: not reported
NYHA: New York Heart Association
SD: standard deviation
SE: standard error
SW: shockwave
The mean age of participants ranged from 55 to 70 years, and the proportion of men ranged from 50.9% to 100%. All trials were presented as full journal articles, with the exception of three trials that were published in the form of a conference abstract (Hamshere 2015_IC; Hamshere 2015_IM; Wang 2014), and two trials that reported additional long‐term follow‐up results in abstract form only (Assmus 2013; Patel 2005). Nine studies were multicentre trials (Bartunek 2012; Jimenez‐Quevedo 2011; Losordo 2007; Losordo 2011; Patel 2015; Perin 2011; Perin 2012a; Santoso 2014; Tse 2007). Studies were based worldwide, including China (Chen 2006; Hu 2011; Wang 2009; Wang 2010; Wang 2014; Wang 2015; Yao 2008; Zhao 2008), Germany (Assmus 2006; Assmus 2013; Erbs 2005; Honold 2012; Nasseri 2012; Turan 2011), the United States (Heldman 2014_BMMNC; Heldman 2014_BM‐MSC; Losordo 2007; Losordo 2011; Perin 2011; Perin 2012a; Perin 2012b), the United Kingdom (Ang 2008; Hamshere 2015_IC; Hamshere 2015_IM; Mozid 2014_IC; Mozid 2014_IM), Spain (Jimenez‐Quevedo 2011), Belgium (Hendrikx 2006), Denmark (Mathiasen 2015), the Netherlands (Van Ramshorst 2009), Finland (Patila 2014), Serbia (Trifunovic 2015), Russia (Pokushalov 2010), Argentina (Patel 2005), Hong Kong/Australia (Tse 2007), Indonesia/China (Santoso 2014), Belgium/Serbia/Switzerland (Bartunek 2012), and USA/Germany/India (Patel 2015). Two studies included publications in Chinese (Hu 2011; Wang 2009), which were translated into English for this review.
Fourteen studies included participants with chronic IHD (Ang 2008; Assmus 2006; Assmus 2013; Chen 2006; Erbs 2005; Heldman 2014_BMMNC; Heldman 2014_BM‐MSC; Hendrikx 2006; Honold 2012; Trifunovic 2015; Turan 2011; Wang 2014; Wang 2015; Yao 2008), normally defined as multivessel disease with persistent ischaemia and at least 30 days from the last MI. Seventeen studies included participants with CHF, defined as severe ischaemic HF and postinfarction HF (secondary to IHD) (Bartunek 2012; Hamshere 2015_IC; Hamshere 2015_IM; Hu 2011; Mathiasen 2015; Mozid 2014_IC; Mozid 2014_IM; Nasseri 2012; Patel 2005; Patel 2015; Patila 2014; Perin 2011; Perin 2012a; Perin 2012b; Pokushalov 2010; Santoso 2014; Zhao 2008), and seven studies were of people with intractable or refractory angina (Jimenez‐Quevedo 2011; Losordo 2007; Losordo 2011; Tse 2007; Van Ramshorst 2009; Wang 2009; Wang 2010). One trial also included people with non‐ischaemic heart disease (Patel 2015), but reported results separately so that only participants with ischaemic disease are included in this review. All trials maintained participants with a standard set of drugs including aspirin, clopidogrel, heparin, blockers, statins, angiotensin converting enzyme (ACE) inhibitors, nitrates, and/or diuretics.
Duration of follow‐up ranged from three months (Assmus 2006), four months (Hendrikx 2006), six months (Ang 2008; Jimenez‐Quevedo 2011; Losordo 2007; Mathiasen 2015; Mozid 2014_IC; Mozid 2014_IM; Nasseri 2012; Perin 2011; Perin 2012a; Perin 2012b; Santoso 2014; Tse 2007; Van Ramshorst 2009; Wang 2009; Wang 2010; Wang 2014; Wang 2015; Yao 2008; Zhao 2008), 12 months (Chen 2006; Hamshere 2015_IC; Hamshere 2015_IM; Heldman 2014_BMMNC; Heldman 2014_BM‐MSC; Hu 2011; Losordo 2011; Patel 2015; Patila 2014; Pokushalov 2010; Turan 2011), 15 months (Erbs 2005), 24 months (Bartunek 2012) up to a median 45 (17) months (Assmus 2013), 60 months (Honold 2012; Trifunovic 2015), and 10 years (Patel 2005).
See Table 2 for a summary of study interventions. Twenty‐seven trials isolated the stem cells by bone marrow aspiration and further separation of the mononuclear cells using density gradient centrifugation (Ang 2008; Assmus 2006; Assmus 2013; Bartunek 2012; Chen 2006; Heldman 2014_BMMNC; Heldman 2014_BM‐MSC; Hendrikx 2006; Hu 2011; Mathiasen 2015; Nasseri 2012; Patel 2005; Patila 2014; Perin 2011; Perin 2012a; Perin 2012b; Pokushalov 2010; Santoso 2014; Trifunovic 2015; Tse 2007; Turan 2011; Van Ramshorst 2009; Wang 2009; Wang 2010; Wang 2015; Yao 2008; Zhao 2008), and one trial isolated and concentrated the mononuclear cell fraction (Patel 2015). Three of these trials enriched the stem cell fraction in CD34‐positive haematopoietic progenitors by magnetic separation (Patel 2005; Wang 2009; Wang 2010), whilst one trial enriched the stem cell fraction in CD133‐positive cells (Nasseri 2012), and one trial in aldehyde dehydrogenase (ALDH)‐positive haematopoietic progenitors (Perin 2012b). Three trials cultured the mononuclear cell population from bone marrow ex vivo to enrich in mesenchymal progenitors (Chen 2006; Heldman 2014_BM‐MSC; Mathiasen 2015), whereas one trial cultured mononuclear cells and enriched them in cardiopoietic cells by exposure to cardiopoietic factors (Bartunek 2012). In one three‐arm trial (Assmus 2006), bone marrow mononuclear cells were compared with circulating progenitor cells (CPCs), and with mononuclear cells isolated from venous peripheral blood. In the CPC arm, cells were isolated from peripheral blood by leukapheresis.
| Study ID | Co‐intervention | Intervention given by: | Route of cell administration | Intervention cell type | How are cells obtained? | What were they resuspended in? | Dose administered? | Comparator arm (placebo or control) |
| CABG | Cardiothoracic surgeon | IC or IM | BMMNC | BM aspiration (**) | Autologous serum | IM: 84 (56) million cells IC: 115 (73) million cells | No additional therapy (control) | |
| Standard medical therapy | Cardiologist | IC | BMMNC or CPC | BM aspiration (**) for BMMNC. Vein puncture, mononuclear cell isolation by gradient centrifugation and culture for 3 days for CPC | n/r | BMMNC: 205 (110) million cells CPC: 22 (11) million cells | No additional therapy (control) | |
| Shockwave | Cardiologist | IC | BMMNC | BM aspiration (**) | X‐VIVO 10 medium and autologous serum | HDSW: 123 (69) million cells LDSW: 150 (77) million cells | Placebo (10 mL X‐VIVO 10 medium and autologous serum) | |
| Standard medical therapy | Cardiologist | IC | BM‐MSC (cardiopoietic cells) | BM aspiration (**), culture for 6 days and exposure to cardiopoietic factors | Preservation solution (no details) | 733 (range 605 to 1168) million cells | No additional therapy (control) | |
| Standard medical therapy | Cardiologist | IC | BM‐MSC | BM aspiration (**), culture for 7 days to select MSC | Heparinised saline | 5 million cells | No additional therapy (control) | |
| G‐CSF | Cardiologist | IC | CPC | G‐CSF infusion for 4 days prior to vein puncture, mononuclear cell isolation by gradient centrifugation and culture for 3 days for CPC | Saline and 10% autologous serum | 69 (14) million cells | Placebo (cell‐free serum solution) | |
| G‐CSF | Cardiologist | IC | BMMNC | G‐CSF infusion for 5 days and BM aspiration (**) | Autologous serum | n/r | Placebo (10 mL autologous serum) | |
| G‐CSF | Cardiologist | IM | BMMNC | G‐CSF infusion for 5 days and BM aspiration (**) | Autologous serum | n/r | Placebo (2 mL autologous serum) | |
| Standard medical therapy | Cardiologist | IM | BMMNC | BM aspiration (**) | n/r | n/r | Placebo (vehicle medium) | |
| Standard medical therapy | Cardiologist | IM | BM‐MSC | BM aspiration (**), culture to select MSC | n/r | n/r | Placebo (vehicle medium) | |
| CABG | Cardiothoracic surgeon | IM | BMMNC | BM aspiration (**) | Heparinised saline | 60 (31) million cells | Placebo (heparinised saline) | |
| G‐CSF | Cardiologist | IC | CPC | G‐CSF infusion for 5 days prior to vein puncture, mononuclear cell isolation by gradient centrifugation and culture for 4 days for CPC | n/r | 29 (12) million cells | No additional therapy (control) | |
| CABG | Cardiothoracic surgeon | IC | BMMNC | BM aspiration (**) | Saline solution and 20% autologous serum | 132 (107) million cells | Placebo (8 mL saline; 2 mL autologous serum) | |
| G‐CSF | Cardiologist | IM | CD133+ | G‐CSF infusion for 5 days prior to leukapheresis, mononuclear cell isolation by gradient centrifugation immunomagnetic selection to isolate CD133+ cells | Normal saline solution | 20 to 30 million cells | No additional therapy (control) | |
| G‐CSF | Cardiologist | IM | CD34+ | G‐CSF infusion for 5 days prior to leukapheresis, mononuclear cell isolation by gradient centrifugation immunomagnetic selection to isolate CD34+ cells | Saline solution and 5% autologous serum | LD: 0.05 million cells MD: 0.1 million cells HD: 0.5 million cells | Placebo (0.9% sodium chloride; 5% autologous plasma) | |
| G‐CSF | Cardiologist | IM | CD34+ | G‐CSF infusion for 5 days prior to leukapheresis, mononuclear cell isolation by gradient centrifugation immunomagnetic selection to isolate CD34+ cells | Saline solution and 5% autologous serum | LD: 0.1 million cells HD: 0.5 million cells | Placebo (0.9% sodium chloride; 5% autologous plasma) | |
| Standard medical therapy | Cardiologist | IM | BM‐MSC | BM aspiration (**), culture for 14 to 35 days to select MSC | Phosphate buffered saline with a drop of the participant’s blood | 77.5 (68) million cells | Placebo (phosphate buffered saline mixed with drop of participant’s blood) | |
| G‐CSF | Cardiologist | IC | BMMNC | G‐CSF infusion for 5 days and BM aspiration (**) | Autologous serum | 86 (110) million cells | Placebo (10 mL autologous serum) | |
| G‐CSF | Cardiologist | IM | BMMNC | G‐CSF infusion for 5 days and BM aspiration (**) | Autologous serum | 52 (53) million cells | Placebo (2 mL autologous serum) | |
| CABG | Cardiothoracic surgeon | IM | CD133+ | BM aspiration (**), immunomagnetic selection to isolate CD133+ cells | Sodium chloride and 10% autologous serum | Median 5.1 million cells | Placebo (isotonic saline solution; 10% autologous serum) | |
| CABG | Cardiothoracic surgeon | IM | CD34+ | BM aspiration (**), immunomagnetic selection to isolate CD34+ cells | Heparinised saline and autologous serum | Median 22 million cells | No additional therapy (control) | |
| Standard medical therapy | Cardiologist | IC | BMAC | BM aspiration (**) and concentration | Autologous serum | 3700 (900) million cells | No additional therapy (control) | |
| CABG | Cardiothoracic surgeon | IM | BMMNC | BM aspiration (**) | Medium 199 containing albumin, heparin | Median 840 (range 52 to 135) million cells | Placebo (vehicle medium) | |
| Standard medical therapy | Cardiologist | IM | BMMNC | BM aspiration (**) | Saline containing 5% human serum albumin | 2 million cells | No additional therapy (control) | |
| Standard medical therapy | Cardiologist | IM | BMMNC | BM aspiration (**) | Saline containing 5% human serum albumin | 100 million cells | Placebo (cell‐free suspension in same volume) | |
| Standard medical therapy | Cardiologist | IM | ALDH+ | BM aspiration (**) and cell sorting | Pharmaceutical grade human serum albumin | 2.4 (1.3) million cells | Placebo (5% pharmaceutical serum albumin) | |
| Standard medical therapy | Cardiologist | IM | BMMNC | BM aspiration (**) | Heparinised saline | 41 (16) million cells | No additional therapy (control) | |
| Standard medical therapy | Cardiologist | IM | BMMNC | BM aspiration (**) | Phosphate buffered saline with 10% autologous plasma | n/r | Placebo (phosphate buffered saline; 10% autologous plasma) | |
| CABG | Cardiothoracic surgeon | IM | BMMNC | BM aspiration (**) | n/r | 70.7 (32.4) million cells | No additional therapy (control) | |
| Standard medical therapy | Cardiologist | IM | BMMNC | BM aspiration (**) | Phosphate buffered saline with 10% autologous plasma | 15 million cells | Placebo (8 ‐ 12 x 0.1 mL phosphate buffered saline with 10% autologous serum) | |
| Standard medical therapy | Cardiologist | IC | BMMNC | BM aspiration (**) | n/r | 99 (25) million cells | No additional therapy (control) | |
| Standard medical therapy | Cardiologist | IM | BMMNC | BM aspiration (**) | Phosphate buffered saline with 0.5% human serum albumin | 98 (6) million cells | Placebo (0.9% sodium chloride; 0.5% human serum albumin) | |
| Standard medical therapy | Cardiologist | IC | CD34+ | BM aspiration (**), immunomagnetic selection to isolate CD34+ cells | Normal saline | Range 1.0 to 6.1 million cells | No additional therapy (control) | |
| Standard medical therapy | Cardiologist | IC | CD34+ | BM aspiration (**), immunomagnetic selection to isolate CD34+ cells | Saline and human serum albumin | 56 (23) million cells | Placebo (saline; human serum albumin) | |
| Standard medical therapy | Cardiologist | IM | CD133+ | n/r | n/r | n/r | Placebo (n/r) | |
| CABG | Cardiothoracic surgeon | IM | BMMNC | BM aspiration (**) | Heparinised saline | 521 (44) million cells | Placebo (saline solution) | |
| Standard medical therapy | Cardiologist | IC | BMMNC | BM aspiration (**) | Heparinised saline | 72 million cells | Placebo (0.9% sodium chloride containing heparin) | |
| CABG | Cardiothoracic surgeon | IM | BMMNC | BM aspiration (**) | Heparinised saline | 659 (512) million cells | Placebo (saline) |
**BM aspiration ‐ bone marrow aspiration and isolation of bone marrow mononuclear cells by gradient centrifugation.
ALDH: aldehyde dehydrogenase
BM: bone marrow
BMAC: bone marrow aspirate concentrate
BMMNC: bone marrow mononuclear cells
BM‐MSC: bone marrow‐derived mesenchymal stem cells
CABG: coronary artery bypass grafting
CPC: circulating progenitor cells
G‐CSF: granulocyte colony‐stimulating factor
HD: high dose
HDSW: high dose shockwave
IC: intracoronary
IM: intramyocardial
LD: low dose
LDSW: low dose shockwave
MD: medium dose
MSC: mesenchymal stem cells
n/r: not reported
SW: shockwave
In five trials, bone marrow stem cells were mobilised into circulation with granulocyte colony‐stimulating factor (G‐CSF) and subsequently isolated from blood via leukapheresis (Erbs 2005; Honold 2012; Jimenez‐Quevedo 2011; Losordo 2007; Losordo 2011). Whilst previous trials reported severe but transient complications associated with G‐CSF treatment (Kang 2006), a recent pilot study demonstrated that G‐CSF can be safely administered to people suffering from IHD as none of the participants in this trial experienced the type of adverse events previously associated with G‐CSF treatment (Honold 2012). Two of these trials further enriched the stem cell population in CD34‐positive progenitors by magnetic separation (Losordo 2007; Losordo 2011). Four trials mobilised bone marrow cells into circulation with G‐CSF and isolated bone marrow mononuclear cells by density gradient centrifugation (Hamshere 2015_IC; Hamshere 2015_IM; Mozid 2014_IC; Mozid 2014_IM). Finally, one study administered CD133‐postive cells, but reported no details of cell isolation (Wang 2014).
All but six trials reported the mean (or median) dose of cells administered (Hamshere 2015_IC; Hamshere 2015_IM; Heldman 2014_BMMNC; Heldman 2014_BM‐MSC; Santoso 2014; Wang 2014). The mean dose of bone marrow mononuclear cells administered varied between 2 x 10⁶ cells, in Perin 2011, and 8.4 x 10⁸ cells, in Patila 2014, whilst bone marrow aspirate concentrate was administered at a mean dose of 3.7 x 10⁹ cells (Patel 2015). Mesenchymal progenitor cells were administered at mean doses of between 5.0 x 10⁶ cells, in Chen 2006, and 7.8 x 10⁷ cells, in Mathiasen 2015, with one study administering 7.3 x 10⁸ cardiopoietic cells (Bartunek 2012). Five studies that adminstered CD34‐positive cells gave mean doses of between 5.0 x 10⁴ cells, in Losordo 2007, and 5.6 x 10⁷ cells, in Wang 2010, and included two dose escalation studies comparing 5.0 x 10⁴ cells, 1.0 x 10⁵ cells, and 5.0 x 10⁵ cells or 1.0 x 10⁵ cells and 5.0 x 10⁵ cells (Losordo 2007; Losordo 2011). CD133‐positive cells were administered at a median dose of 5.1 x 10⁶ cells, in Nasseri 2012, or at doses of between 2 and 3 x 10⁷ cells (Jimenez‐Quevedo 2011). The doses of ALDH‐positive cells averaged 2.96 x 10⁶ cells (Perin 2012b). In the trial where bone marrow mononuclear cells were compared to CPCs, the mean dose of CPCs administered was between 2.9 x 10⁶ cells, in Honold 2012, and 2.2 x 10⁷ cells (Assmus 2006).
Thirteen trials administered the treatment via a coronary artery (intracoronarily (IC)) (Assmus 2006; Assmus 2013; Chen 2006; Erbs 2005; Hamshere 2015_IC; Honold 2012; Hu 2011; Mozid 2014_IC; Patel 2015; Turan 2011; Wang 2009; Wang 2010; Yao 2008), whilst 24 trials delivered the treatment intramyocardially (IM) (Bartunek 2012; Hamshere 2015_IM; Heldman 2014_BMMNC; Heldman 2014_BM‐MSC; Hendrikx 2006; Jimenez‐Quevedo 2011; Losordo 2007; Losordo 2011; Mathiasen 2015; Mozid 2014_IM; Nasseri 2012; Patel 2005; Patila 2014; Perin 2011; Perin 2012a; Perin 2012b; Pokushalov 2010; Santoso 2014; Trifunovic 2015; Tse 2007; Van Ramshorst 2009; Wang 2014; Wang 2015; Zhao 2008). Of these 24 studies, 22 aided delivery of the treatment into the heart muscle using electromechanical mapping of the heart. The other two studies did not report whether the IM delivery of stem cells was aided in any other way (Hendrikx 2006; Zhao 2008). One trial included three treatment arms comparing IC and IM delivery of stem cells with control (Ang 2008).
Apart from G‐CSF, 17 studies administered co‐interventions. In nine studies, participants underwent coronary artery bypass graft (CABG) (Ang 2008; Hendrikx 2006; Hu 2011; Nasseri 2012; Patel 2005; Patila 2014; Trifunovic 2015; Wang 2015; Zhao 2008), and in seven studies, percutaneous coronary intervention (PCI) was administered to all participants (Chen 2006; Erbs 2005; Turan 2011; Wang 2009), or to a subset of participants (Assmus 2006; Honold 2012; Yao 2008). One study administered shockwave targeted to the left ventricular anterior wall at either high or low dose (Assmus 2013).
Twenty‐five studies compared cell therapy with administration of a placebo consisting of a cell‐free solution, either a heparin saline solution or a saline solution containing the participant's own serum (Assmus 2013; Erbs 2005; Hamshere 2015_IC; Hamshere 2015_IM; Heldman 2014_BMMNC; Heldman 2014_BM‐MSC; Hendrikx 2006; Hu 2011; Losordo 2007; Losordo 2011; Mathiasen 2015; Mozid 2014_IC; Mozid 2014_IM; Nasseri 2012; Patila 2014; Perin 2012a; Perin 2012b; Santoso 2014; Tse 2007; Van Ramshorst 2009; Wang 2010; Wang 2014; Wang 2015; Yao 2008; Zhao 2008); two further studies used a simulated mock injection procedure for participants in the control arm, but without administering a placebo solution (Jimenez‐Quevedo 2011; Perin 2011). The remaining 11 trials compared treatment to no treatment (Ang 2008; Assmus 2006; Bartunek 2012; Chen 2006; Honold 2012; Patel 2005; Patel 2015; Pokushalov 2010; Trifunovic 2015; Turan 2011; Wang 2009).
Three studies included multiple comparisons involving two or three intervention arms, including intracoronary versus intramyocardial cell administration (Ang 2008), mononuclear cells versus circulating progenitor cells (Assmus 2006), and high versus medium or low (Losordo 2007), or high versus low cell dose (Losordo 2011). We combined data for multiple intervention arms for the main analyses, although we used individual intervention trial arms for subgroup analyses where applicable. One three‐arm trial was also a cross‐over study (Assmus 2006); we have included only data up to the point of cross‐over (three months) in this review.
One study described aortic cross‐clamping during surgery with clamp times exceeding 25 to 30 minutes (Hendrikx 2006). Aortic cross‐clamping isolates the systemic circulation during surgery but causes ischaemia. Although increasing times of aortic cross‐clamping have been identified as a predictor of mortality, the effect of cross‐clamping in this study was not as strong as might be expected. This may be due to the fact that the cause of cardiac damage is multifactorial, including coronary lesions.
All but one study published only in abstract form reported the primary clinical outcome of mortality (Wang 2014). All but three studies reported periprocedural adverse events (or lack of) (Hamshere 2015_IC; Hamshere 2015_IM; Wang 2014), and a fourth study reported adverse events for shockwave treatment but not for cell therapy (Assmus 2013). See the Characteristics of included studies tables for details of the included studies; see Table 3 for a summary of the reporting of outcomes considered in this review.
| Study ID | Primary outcomes | Secondary outcomes | ||||||||||||||||||||
| All‐cause mortality | Non‐fatal MI | Hospital readmission for HF | Composite MACEa | Arrhythmias | NYHA class | CCS class | Angina frequency | Exercise tolerance | Quality of life | LVEFb | ||||||||||||
| ST | LT | ST | LT | ST | LT | ST | LT | ST | LT | ST | LT | ST | LT | ST | LT | ST | LT | ST | LT | ST | LT | |
| FR | NR | PR* | NR | NR | NR | NR | NR | PR* | NR | PR | NR | PR | NR | NR | NR | NR | NR | NR | NR | FR | NR | |
| FR | NR | FR | NR | FR | NR | FR | NR | FR | NR | FR | NR | NR | NR | NR | NR | NR | NR | NR | NR | FR | NR | |
| FR | FR | NR | FR | FR | FR | NR | FR | NR | FR | FR | NR | NR | NR | NR | NR | NR | NR | NR | NR | FR | NR | |
| PR* | FR | NR | NR | NR | FR | NR | NR | PR | PR | PR | NR | NR | NR | NR | NR | FR | NR | PR | NR | FR | NR | |
| NR | FR | NR | NR | NR | NR | NR | NR | PR* | NR | FR | FR | NR | NR | NR | NR | FR | FR | NR | NR | FR | FR | |
| PR* | FR | NR | NR | NR | NR | NR | NR | NR | NR | NR | NR | NR | NR | NR | NR | FR | FR | NR | NR | FR | FR | |
| PR* | PR* | PR* | FR | PR* | PR* | PR* | FR | FR | FR | FR | FR | FR | FR | NR | NR | NR | NR | NR | NR | PR | PR | |
| PR* | PR* | PR* | PR* | FR | FR | FR | FR | FR | FR | FR | FR | FR | FR | NR | NR | NR | NR | NR | NR | PR | PR | |
| PR* | PR* | NR | PR* | NR | FR | PR* | FR | NR | NR | NR | PR | NR | NR | NR | NR | FR | FR | FR | FR | NR | PR | |
| PR* | FR | NR | PR* | NR | PR* | PR* | FR | NR | NR | NR | PR | NR | NR | NR | NR | FR | FR | FR | FR | NR | PR | |
| FR | NR | NR | NR | NR | NR | NR | NR | NR | NR | NR | NR | NR | NR | NR | NR | NR | NR | NR | NR | FR | NR | |
| PR* | FR | FR | FR | PR* | FR | NR | NR | NR | NR | FR | FR | NR | NR | NR | NR | FR | FR | NR | NR | FR | FR | |
| FR | FR | PR* | NR | NR | NR | FR | NR | PR* | FR | NR | NR | NR | NR | NR | NR | FR | NR | NR | NR | FR | FR | |
| FR | NR | PR* | NR | NR | NR | PR | NR | FR | NR | NR | NR | PR | NR | PR | NR | PR | NR | PR | NR | PR | NR | |
| PR* | PR* | PR* | PR* | NR | NR | NR | NR | FR | FR | NR | NR | FR | NR | FR | NR | FR | NR | PR | NR | NR | NR | |
| FR | FR | NR | FR | NR | FR | NR | PR | NR | NR | NR | NR | PR | PR | FR | NR | FR | FR | FR | FR | NR | NR | |
| FR | NR | PR* | NR | FR | NR | NR | NR | FR | NR | PR | NR | PR | NR | PR | NR | PR | NR | PR | NR | FR | NR | |
| FR | NR | PR* | NR | FR | NR | FR | NR | PR* | NR | FR | NR | FR | NR | NR | NR | NR | NR | NR | NR | NR | NR | |
| FR | NR | PR* | NR | PR* | NR | FR | NR | FR | NR | FR | NR | FR | NR | NR | NR | NR | NR | NR | NR | NR | NR | |
| FR | FR | NR | NR | NR | NR | NR | NR | NR | NR | FR | NR | FR | NR | NR | NR | PR | NR | PR | NR | FR | NR | |
| PR* | FR | NR | NR | NR | NR | NR | NR | PR* | NR | FR | NR | NR | NR | NR | NR | NR | NR | NR | NR | PR | PR | |
| NR | FR | NR | NR | NR | FR | NR | NR | NR | PR* | NR | FR | NR | PR | NR | NR | NR | NR | NR | PR | PR | PR | |
| NR | PR* | NR | PR* | NR | FR | NR | NR | NR | NR | NR | FR | NR | NR | NR | NR | NR | NR | NR | PR | NR | FR | |
| PR* | NR | PR* | NR | NR | NR | NR | NR | PR* | NR | FR | NR | FR | NR | NR | NR | NR | NR | FR | NR | FR | NR | |
| FR | NR | FR | NR | FR | NR | NR | NR | NR | NR | FR | NR | FR | NR | NR | NR | FR | NR | NR | NR | FR | NR | |
| PR* | NR | FR | NR | NR | NR | NR | NR | FR | NR | FR | NR | FR | NR | NR | NR | NR | NR | NR | NR | FR | NR | |
| FR | FR | NR | NR | NR | NR | NR | NR | PR* | PR* | FR | FR | FR | FR | FR | FR | FR | FR | FR | FR | FR | FR | |
| PR* | FR | NR | NR | NR | NR | NR | NR | FR | NR | PR | NR | NR | NR | NR | NR | PR | NR | NR | NR | FR | NR | |
| NR | FR | NR | NR | NR | NR | NR | NR | NR | NR | FR | FR | NR | NR | NR | NR | FR | FR | NR | NR | FR | FR | |
| PR* | FR | FR | NR | NR | NR | NR | NR | PR* | NR | FR | NR | FR | NR | NR | NR | FR | NR | NR | NR | FR | NR | |
| PR* | PR* | NR | NR | NR | NR | NR | NR | NR | NR | FR | FR | NR | NR | NR | NR | NR | NR | NR | NR | FR | FR | |
| FR | NR | PR* | NR | NR | NR | NR | NR | PR* | NR | NR | NR | FR | NR | NR | NR | FR | NR | FR | NR | FR | FR | |
| PR* | NR | PR* | NR | NR | NR | NR | NR | PR* | NR | NR | NR | FR | NR | FR | NR | FR | NR | NR | NR | NR | NR | |
| PR* | NR | PR* | NR | NR | NR | NR | NR | FR | NR | NR | NR | FR | NR | FR | NR | FR | NR | NR | NR | NR | NR | |
| NR | NR | NR | NR | NR | NR | NR | NR | NR | NR | PR | NR | NR | NR | NR | NR | PR | NR | NR | NR | FR | NR | |
| PR* | NR | NR | NR | NR | NR | NR | NR | PR | NR | NR | NR | NR | NR | NR | NR | NR | NR | NR | NR | FR | NR | |
| PR* | NR | FR | NR | FR | NR | NR | NR | PR* | NR | NR | NR | NR | NR | NR | NR | NR | NR | NR | NR | PR | NR | |
| FR | NR | PR* | NR | NR | NR | NR | NR | FR | NR | FR | NR | FR | NR | NR | NR | NR | NR | NR | NR | FR | NR | |
| Total (%) analysedc | 1637 (85.8) | 1010 (53.0) | 881 (46.2) | 461 (24.2) | 482 (25.3) | 495 (26.0) | 288 (15.1) | 201 (10.5) | 959 (50.3) | 363 (19.0) | 741 (38.9) | 346 (18.1) | 608 (31.9) | 142 (7.4) | 428 (22.4) | 82 (4.3)d | 535 (28.1) | 227 (11.9) | 197 (10.3)e | 151 (7.9)e | 439 (23.0)f | 110 (5.8)f |
CCS: Canadian Cardiovascular Society; FR: full reporting, outcome included in analysis; HF: heart failure; LT: long‐term follow‐up (≥ 12 months); LVEF: left ventricular ejection fraction; MACE: major adverse clinical events; MI: myocardial infarction; NR: outcome not reported; NYHA: New York Heart Association; PR: partial reporting with insufficient information on outcome reported for inclusion in analysis; PR*: no incidence of outcome observed; ST: short‐term follow‐up (< 12 months)
aComposite measure of mortality, reinfarction, or rehospitalisation for heart failure.
bLVEF measured by any method.
cTotal number of participants included in meta‐analysis of outcome (% of total number of participants from all included studies).
dNo meta‐analysis was performed, as only one study reported values suitable for inclusion.
eMinnesota Living with Heart Failure Questionnaire.
fTotal number analysed given for LVEF measured by magnetic resonance imaging.
Studies awaiting classification
Ten independent studies (12 references) met the eligibility criteria for this review but reported insufficient data for inclusion; these studies are awaiting classification (see Characteristics of studies awaiting classification).
Ongoing studies
We identified 28 ongoing trials described in five references and 31 ongoing trial records; see Characteristics of ongoing studies for details.
Excluded studies
We excluded 54 studies (described by 70 references and 15 ongoing trial records) from the review following full‐text assessment against the eligibility criteria (see Characteristics of excluded studies tables). In summary, we excluded studies for the following sequential reasons: 10 studies were of people with acute myocardial infarction (AMI); 16 studies were single‐arm trials; seven studies compared multiple interventions but with no control or placebo arm; eight studies did not randomise participants to treatment arm; two studies administered G‐CSF to the intervention arm but not the comparator group; one study measured outcomes not relevant to this review; six studies were terminated or withdrawn; one study included non‐bone marrow‐derived cells; one study compared allogeneic cells with a control group; one study was a literature review; and one study was performed in animals.
Risk of bias in included studies
A summary of the risk of bias in individual studies is given below and in Figure 2. Further details of our assessment of risk of bias can been found in the Characteristics of included studies tables. We considered only five trials to have a low risk of bias across all domains (Jimenez‐Quevedo 2011; Mathiasen 2015; Perin 2011; Perin 2012a; Van Ramshorst 2009).

Risk of bias summary: review authors' judgements about each risk of bias item for each included study.
Allocation
Twenty‐seven studies provided details of randomisation methods with a low risk of bias from random sequence generation. These methods included sequentially numbered, sealed envelopes (Hendrikx 2006; Patila 2014; Van Ramshorst 2009), simple randomisation table (Santoso 2014; Tse 2007), or randomisation codes generated electronically (Assmus 2006; Assmus 2013; Hamshere 2015_IC; Hamshere 2015_IM; Heldman 2014_BMMNC; Heldman 2014_BM‐MSC; Hu 2011; Mathiasen 2015; Mozid 2014_IC; Mozid 2014_IM; Patel 2015; Perin 2012a; Perin 2012b; Pokushalov 2010; Zhao 2008), by a study statistician (Losordo 2007; Perin 2011), by picking a coloured ball (Patel 2005), or via a centralised site‐independent process (Bartunek 2012; Jimenez‐Quevedo 2011; Losordo 2011; Nasseri 2012). Of these, 15 studies described appropriate methods of allocation concealment with a low risk of bias (Assmus 2013; Bartunek 2012; Heldman 2014_BMMNC; Heldman 2014_BM‐MSC; Hendrikx 2006; Jimenez‐Quevedo 2011; Losordo 2011; Mathiasen 2015; Nasseri 2012; Patila 2014; Perin 2011; Perin 2012a; Santoso 2014; Tse 2007; Van Ramshorst 2009), whilst in 12 studies allocation concealment was unclear (Assmus 2006; Hamshere 2015_IC; Hamshere 2015_IM; Hu 2011; Losordo 2007; Mozid 2014_IC; Mozid 2014_IM; Patel 2005; Patel 2015; Perin 2012b; Pokushalov 2010; Zhao 2008).
We found five trials in which no description was given as to what methods were used to generate the random sequence to be at unclear risk of selection bias (Ang 2008; Erbs 2005; Honold 2012; Trifunovic 2015; Turan 2011). The method of generation of randomisation sequence was also not reported in six Chinese trials, which we deemed to have a high risk of bias (Chen 2006; Wang 2009; Wang 2010; Wang 2014; Wang 2015; Yao 2008).
Blinding
In 24 studies, participants randomised to the control group received a placebo injection (Assmus 2013; Erbs 2005; Hamshere 2015_IC; Hamshere 2015_IM; Heldman 2014_BMMNC; Heldman 2014_BM‐MSC; Hendrikx 2006; Hu 2011; Losordo 2007; Losordo 2011; Mathiasen 2015; Mozid 2014_IC; Mozid 2014_IM; Nasseri 2012; Patila 2014; Perin 2012a; Perin 2012b; Santoso 2014; Tse 2007; Van Ramshorst 2009; Wang 2010; Wang 2015; Yao 2008; Zhao 2008), with all but one study reporting that the control group underwent bone marrow aspiration (Mathiasen 2015); we judged these trials to be at a low risk of performance bias. We deemed two additional trials to have a low risk of performance bias, as although no placebo was administered, participants in the control group underwent a sham procedure (Jimenez‐Quevedo 2011; Perin 2011).
We considered nine trials in which no placebo was administered to have a high risk of performance bias (Ang 2008; Assmus 2006; Bartunek 2012; Chen 2006; Honold 2012; Patel 2015; Pokushalov 2010; Trifunovic 2015; Turan 2011). Two trials were reported as "double‐blind" (Wang 2014), or as having blinded participants (Patel 2005), but no details of a placebo were given; a third trial reported no details of blinding (Wang 2009). We judged the risk of performance bias in these trials to be unclear.
We assessed two trials as having a high risk of detection bias: one was reported as an "open‐label" trial with no details of blinding given (Trifunovic 2015), and one trial reported that outcome assessors were not blinded (Wang 2009). We judged two trials in which which blinding of outcome assessors was not reported as at unclear risk of detection bias (Chen 2006; Wang 2014). All other trials reported the blinding of outcome assessors.
Incomplete outcome data
One trial had a high risk of attrition bias (Bartunek 2012): 11 participants randomised to the cell therapy group were excluded from the analyses as they did not receive the study intervention. In the study report, these participants were analysed as part of the control group (although in this review they have been excluded). The risk of attrition bias was unclear in four studies in which some participants were excluded from the analyses without sufficient explanation (Ang 2008; Heldman 2014_BMMNC; Heldman 2014_BM‐MSC; Honold 2012). We also attributed an unclear risk of attrition bias to one study reported in abstract form only (Wang 2014). In all other trials, any withdrawals or losses to follow‐up were similar in both treatment arms with reasons for withdrawals fully documented.
Selective reporting
We attributed a high risk of reporting bias to one study in which results have only been published as a conference abstract (Wang 2014). Twenty‐two trials were prospectively registered on a clinical trial database. Of these, 13 studies reported all outcomes described in the the trial protocol, with a low risk of reporting bias (Ang 2008; Assmus 2006; Assmus 2013; Hu 2011; Jimenez‐Quevedo 2011; Losordo 2011; Mathiasen 2015; Nasseri 2012; Patel 2015; Perin 2011; Perin 2012a; Perin 2012b; Van Ramshorst 2009), whilst in seven studies, we observed some differences between outcomes described in the study protocol and those reported. Specifically, three studies reported results for additional outcomes (Heldman 2014_BMMNC; Heldman 2014_BM‐MSC; Santoso 2014); two studies were a pilot study report of secondary outcomes only (Mozid 2014_IC; Mozid 2014_IM); one study failed to report six‐month results as described in the protocol (Patila 2014); and in one study, different definitions of primary and secondary outcomes were reported in the study protocol and the publication of results (Bartunek 2012). We deemed the risk of reporting bias in these seven studies to be unclear. For two trials reported in abstract form only (Hamshere 2015_IC; Hamshere 2015_IM), we requested and obtained data for all outcomes presented in the trial protocol from the authors, therefore we judged these trials to be at low risk of reporting bias.
We identified no prospectively registered trial protocol for the remaining 15 trials, and although the results of all outcomes described in the methods were reported, we judged the risk of reporting bias to be unclear.
We identified no obvious asymmetry from a funnel plot for mortality (Figure 3). In a regression test for asymmetry (Egger's test), the model intercept was ‐0.02 (P = 0.90) at short‐term follow‐up and ‐0.004 (P = 0.98) at long‐term follow‐up, with no evidence of publication bias. However, of 28 identified ongoing trials, 11 trials (787 participants) were recorded as having been completed or were due to have been completed in advance of our search date, but we identified no publications for them and no study results were posted on the trial database. We therefore cannot rule out the possibility of publication bias.

Funnel plot of comparison: 1 Stem cells versus no stem cells, outcome: 1.1 Mortality.
Other potential sources of bias
Twenty‐eight studies reported details of study funding or sponsorship (Ang 2008; Assmus 2006; Assmus 2013; Bartunek 2012; Erbs 2005; Hamshere 2015_IC; Hamshere 2015_IM; Heldman 2014_BMMNC; Heldman 2014_BM‐MSC; Hu 2011; Jimenez‐Quevedo 2011; Losordo 2007; Losordo 2011; Mathiasen 2015; Mozid 2014_IC; Mozid 2014_IM; Nasseri 2012; Patel 2015; Patila 2014; Perin 2011; Perin 2012a; Perin 2012b; Santoso 2014; Tse 2007; Van Ramshorst 2009; Wang 2015; Yao 2008; Zhao 2008. The majority of these studies were funded entirely by academic or healthcare research grants, or both and received no commercial sponsorship. Four studies acknowledged provision of equipment (Heldman 2014_BMMNC; Heldman 2014_BM‐MSC; Losordo 2007; Perin 2012a), and two studies acknowledged receipt of consultant fees, from Biosense Webster, in Tse 2007, and Cook Medical (Patel 2015). Four studies declared full commercial sponsorship: from Aldagen (Perin 2012b), Baxter Healthcare (Losordo 2011), Cardio3 BioSciences (Bartunek 2012), and Harvest Technologies (Patel 2015), and nine studies declared partial commercial funding: from Baxter Healthcare (Losordo 2007), Chugai Pharma UK and the Cordis Corporation (Hamshere 2015_IC; Hamshere 2015_IM; Mozid 2014_IC; Mozid 2014_IM), Miltenyi Biotec (Nasseri 2012), and BioCardia (Heldman 2014_BMMNC; Heldman 2014_BM‐MSC), and an unrestricted grant from t2cure GmbH (Assmus 2013). We judged all 13 studies that received some degree of commercial funding to be at high risk of bias. The primary investigator in four included trials is also an author of this review (Hamshere 2015_IC; Hamshere 2015_IM; Mozid 2014_IC; Mozid 2014_IM).
Effects of interventions
An overview of results for the primary outcomes of mortality and periprocedural adverse events, and for morbidity outcomes (non‐fatal MI, rehospitalisation for HF, arrhythmias, composite major adverse clinical events) and LVEF measured by MRI is given in summary of findings Table for the main comparison. We excluded quality of life and performance status outcomes since different measures are likely to be used for different participant diagnoses, and therefore fewer trials are likely to have reported each of these outcomes.
In one study (Yao 2008), continuous measures were reported as mean +/‐ standard deviation. However, visual inspection of the data revealed that the standard deviations were considerably lower than might be expected for all continuous outcomes. This study also reported P values for statistical comparisons between the baseline and follow‐up data using paired t‐tests. However, we could not identify the reported significance values, either using the standard deviations provided, or based on an assumption that the values were in fact standard errors. We therefore could not verify or include continuous data from this study.
Primary outcomes
Mortality
All but one study included mortality as an outcome (Wang 2014), which was published in abstract form only (see Table 3; Table 4).
| Study ID | Number of analysed participants | All‐cause mortality events | Non‐fatal MI events | Hospital readmission for HF | Composite MACEa | Arrhythmia events | |||||||||||
| Cells | No cells | Cells | No cells | Length of follow‐up | Cells | No cells | Length of follow‐up | Cells | No cells | Length of follow‐up | Cells | No cells | Length of follow‐up | Cells | No cells | Length of follow‐up | |
| 42 | 19 | 1 | 1 | 6 mthsa | 0 | 0 | 6 mths | n/r | n/r | n/r | n/r | n/r | n/r | 0 | 0 | 6 mths | |
| 52 | 23 | 0 | 1 | 3 mths | 1 | 0 | 3 mths | 1 | 1 | 3 mths | 1 | 1 | 3 mths | 0 | 1 | 3 mths | |
| 43 | 39 | 6 | 8 | 45.7 (17) mths | 1 | 4 | 45.7 (17) mths | 8 | 13 | 45.7 (17) mths | 14 | 19 | 45.7 (17) mths | 6 | 13 | 45.7 (17) mths | |
| 21 | 15 | 1 | 2 | 24 mths | n/r | n/r | n/r | 6 | 4 | 24 mths | n/r | n/r | n/r | n/r | n/r | n/r | |
| 22 | 23 | 2 | 4 | 12 mths | n/r | n/r | n/r | n/r | n/r | n/r | n/r | n/r | n/r | 0 | 0 | 6 mths | |
| 13 | 12 | 0 | 1 | 15 mths | n/r | n/r | n/r | n/r | n/r | n/r | n/r | n/r | n/r | n/r | n/r | n/r | |
| 15 | 15 | 0 | 0 | 12 mths | 1 | 0 | 12 mths | 0 | 0 | 12 mths | 1 | 0 | 12 mths | 1 | 1 | 12 mths | |
| 15 | 15 | 0 | 0 | 12 mths | 0 | 0 | 12 mths | 1 | 1 | 12 mths | 1 | 1 | 12 mths | 0 | 1 | 12 mths | |
| 19 | 10 | 0 | 0 | 12 mths | 0 | 0 | 12 mths | 0 | 1 | 12 mths | 0 | 1 | 12 mths | n/r | n/r | n/r | |
| 19 | 11 | 1 | 1 | 12 mths | 0 | 0 | 12 mths | 0 | 0 | 12 mths | 1 | 1 | 12 mths | n/r | n/r | n/r | |
| 11 | 12 | 1 | 1 | 4 mths | n/r | n/r | n/r | n/r | n/r | n/r | n/r | n/r | n/r | n/r | n/r | n/r | |
| 23 | 9 | 0 | 1 | 60 mths | 1 | 2 | 60 mths | 0 | 2 | 60 mths | n/r | n/r | n/r | n/r | n/r | n/r | |
| 31 | 29 | 1 | 2 | 12 mths | 0 | 0 | 6 mths | n/r | n/r | n/r | 3 | 4 | 6 mths | 1 | 0 | 12 mths | |
| 19 | 9 | 1 | 1 | 6 mths | 0 | 0 | 6 mths | n/r | n/r | n/r | n/r | n/r | n/r | 1 | 1 | 6 mths | |
| 18 | 6 | 0 | 0 | 12 mths | 0 | 0 | 12 mths | n/r | n/r | n/r | n/r | n/r | n/r | 0 | 1 | 12 mths | |
| 112 | 56 | 0 | 3 | 12 mths | 6 | 7 | 12 mths | 3 | 4 | 12 mths | n/r | n/r | n/r | n/r | n/r | n/r | |
| 40 | 20 | 1 | 1 | 6 mths | 0 | 0 | 6 mths | 6 | 2 | 6 mths | n/r | n/r | n/r | 3 | 1 | 6 mths | |
| 14 | 2 | 0 | 1 | 6 mths | 0 | 0 | 6 mths | 1 | 0 | 6 mths | 1 | 1 | 6 mths | 0 | 0 | 6 mths | |
| 10 | 8 | 0 | 3 | 6 mths | 0 | 0 | 6 mths | 0 | 0 | 6 mths | 0 | 3 | 6 mths | 2 | 2 | 6 mths | |
| 30 | 30 | 1 | 3 | 34 mthsb | n/r | n/r | n/r | n/r | n/r | n/r | n/r | n/r | n/r | n/r | n/r | n/r | |
| 25 | 25 | 3 | 10 | 10 yrs | n/r | n/r | n/r | n/r | n/r | n/r | n/r | n/r | n/r | 0 | 0 | 6 mths | |
| 22 | 6 | 5 | 2 | 12 mths | n/r | n/r | n/r | 2 | 0 | 12 mths | n/r | n/r | n/r | 0 | 0 | 12 mths | |
| 13c | 17c | 0 | 0 | Median 60 mths | 0 | 0 | Median 60 mths | 1 | 1 | Median 60 mths | n/r | n/r | n/r | n/r | n/r | n/r | |
| 20 | 10 | 0 | 0 | 6 mths | 0 | 0 | 6 mths | n/r | n/r | n/r | n/r | n/r | n/r | 0 | 0 | 6 mths | |
| 61 | 31 | 1 | 0 | 6 mths | 1 | 0 | 6 mths | 3 | 5 | 6 mths | n/r | n/r | n/r | n/r | n/r | n/r | |
| 10 | 10 | 0 | 0 | 6 mths | 1 | 0 | 6 mths | n/r | n/r | n/r | n/r | n/r | n/r | 3 | 2 | 6 mths | |
| 55 | 54 | 6 | 21 | 12 mths | n/r | n/r | n/r | n/r | n/r | n/r | n/r | n/r | n/r | 0 | 0 | 12 mths | |
| 19 | 9 | 0 | 2 | 23 (8) mths | n/r | n/r | n/r | n/r | n/r | n/r | n/r | n/r | n/r | 1 | 1 | 6 mths | |
| 15 | 15 | 2 | 4 | Median 5 yrs | n/r | n/r | n/r | n/r | n/r | n/r | n/r | n/r | n/r | n/r | n/r | n/r | |
| 19 | 9 | 0 | 1 | 19 (9) mths | 0 | 1 | 3 mths | n/r | n/r | n/r | n/r | n/r | n/r | 0 | 0 | 6 mths | |
| 38 | 18 | 0 | 0 | 12 mths | n/r | n/r | n/r | n/r | n/r | n/r | n/r | n/r | n/r | n/r | n/r | n/r | |
| 25 | 25 | 1 | 0 | 6 mths | 0 | 0 | 6 mths | n/r | n/r | n/r | n/r | n/r | n/r | 0 | 0 | 6 mths | |
| 16 | 16 | 0 | 0 | 6 mths | 0 | 0 | 6 mths | n/r | n/r | n/r | n/r | n/r | n/r | 0 | 0 | 6 mths | |
| 56 | 56 | 0 | 0 | 6 mths | 0 | 0 | 6 mths | n/r | n/r | n/r | n/r | n/r | n/r | 0 | 1 | 6 mthsd | |
| n/r | n/r | n/r | n/r | n/r | n/r | n/r | n/r | n/r | n/r | n/r | n/r | n/r | n/r | n/r | n/r | n/r | |
| 45 | 45 | 0 | 0 | 6 mths | n/r | n/r | n/r | n/r | n/r | n/r | n/r | n/r | n/r | n/r | n/r | n/r | |
| 24 | 23 | 0 | 0 | 6 mths | 0 | 1 | 6 mths | 1 | 2 | 6 mths | n/r | n/r | n/r | 0 | 0 | 6 mths | |
| 18 | 18 | 2 | 0 | 6 mths | 0 | 0 | 6 mths | n/r | n/r | n/r | n/r | n/r | n/r | 1 | 0 | 6 mths | |
HF: heart failure; MACE: major adverse clinical events; MI: myocardial infarction; n/r: not reported
aAng 2008: participants followed up for six months; mortality reported as “death within 30 days of treatment”.
bNasseri 2012: deaths reported “beyond follow‐up period” occurred at 31 and 34 months.
cPatila 2014: mortality rates reported in 20/19 participants at 12 months and 13/17 participants at 60 months.
dWang 2010: values are for ventricular arrhythmia (atrial arrhythmia also reported but unclear whether any participant overlap).
Of 33 studies that reported mortality rates during short‐term follow‐up (< 12 months), 15 trials reported deaths (Ang 2008; Assmus 2006; Assmus 2013; Hendrikx 2006; Hu 2011; Jimenez‐Quevedo 2011; Losordo 2011; Mathiasen 2015; Mozid 2014_IC; Mozid 2014_IM; Nasseri 2012; Perin 2012a; Pokushalov 2010; Van Ramshorst 2009; Zhao 2008), whilst the remaining 18 trials reported no deaths. In all trials, over short‐term follow‐up, the mortality rate of 1.6% (15/963) in participants who received cell therapy was lower than that observed in participants who received no cells (4.0%, 27/674) (risk ratio (RR) 0.48, 95% confidence interval (CI) 0.26 to 0.87; participants = 1637; studies = 33; I2 = 0%) (Analysis 1.1). However, in the subset of trials with a low risk of selection bias, the effect of cell therapy on short‐term mortality was no longer seen (RR 0.69, 95% CI 0.32 to 1.50; participants = 744; studies = 14; I2 = 0%) (Analysis 8.1). Similarly, no effect of cell therapy on short‐term mortality was shown when studies with a high or unclear risk of performance bias were excluded (RR 0.58, 95% CI 0.29 to 1.16; participants = 1216; studies = 25; I2 = 0%) (Analysis 9.1). However, results appeared to be robust to attrition bias (RR 0.48, 95% CI 0.26 to 0.89; participants = 1449; studies = 28; I2 = 0%) (Analysis 10.1).
Seven studies reported reasons for short‐term mortality in participants who had received cell therapy, which included perforated oesophageal ulcer complicated by mediastinitis seven days postoperatively (Hendrikx 2006), cardiogenic shock (Jimenez‐Quevedo 2011), death on day 158 shortly after surgery for intestinal ischaemia (Mathiasen 2015), pump failure leading to death on day 29 after therapy (Perin 2012a), myocardial ischaemia leading to acute HF at 2.5 months (Van Ramshorst 2009), ventricular fibrillation five hours postoperatively leading to death on day three (Zhao 2008), and cerebral vessel accident during six‐month follow‐up (Zhao 2008). Cause of death in one study was not specified in detail but reported as "cardiac" in four participants and "non‐cardiac" in one participant (Assmus 2013). In participants who did not receive cell therapy, reasons for short‐term mortality included multiple organ failure secondary to low cardiac output syndrome (Hendrikx 2006), fatal MI at 3.5 months (Jimenez‐Quevedo 2011), death during injection (Losordo 2007), terminal HF at day 182 (Mathiasen 2015), pneumonia, mediastinitis and sepsis with death on day 22 (Nasseri 2012), candida sepsis on day 8 after left ventricular failure (Nasseri 2012), and death reported as "cardiac" (five participants) or "non‐cardiac" (one participant) (Assmus 2013).
Of the 21 studies reporting mortality over long‐term follow‐up (≥ 12 months), 15 studies reported deaths (Assmus 2013; Bartunek 2012; Chen 2006; Erbs 2005; Heldman 2014_BM‐MSC; Honold 2012; Hu 2011; Losordo 2011; Nasseri 2012; Patel 2005; Patel 2015; Pokushalov 2010; Santoso 2014; Trifunovic 2015; Tse 2007), with a mortality rate of 4.8% (28/587) in participants who received cell therapy compared with 15.4% (65/423) in those who received no cells. Meta‐analysis of all available trials showed that cell therapy reduced the risk of long‐term mortality (RR 0.38, 95% CI 0.25 to 0.58; participants = 1010; studies = 21; I2 = 0%) (Analysis 1.1). Sensitivity analyses restricted to those trials with a low risk of bias from randomisation sequence generation and allocation concealment showed that the reduced risk of mortality at long‐term follow‐up in participants who received cell therapy was robust to selection bias (RR 0.42, 95% CI 0.21 to 0.87; participants = 491; studies = 9; I2 = 0%; low‐quality evidence) (Analysis 8.1). Similarly, analysis of the subset of trials that blinded participants and clinicians showed that the effect of cell therapy on long‐term mortality was robust to performance bias (RR 0.43, 95% CI 0.21 to 0.86; participants = 624; studies = 13; I2 = 0%) (Analysis 9.1). The effect of cell therapy also remained when trials with a high or unclear risk of attrition bias were excluded (RR 0.39, 95% CI 0.25 to 0.60; participants = 883; studies = 17; I2 = 0%) (Analysis 10.1).
Eleven studies reported reasons for mortality at long‐term follow‐up. In participants who received cell therapy, reported causes of death were sepsis after elective cardiac transplant at 21 months (Bartunek 2012), lung cancer at seven months (Hu 2011), cerebrovascular haemorrhage at six years (Trifunovic 2015), pulmonary malignancy at six years (Trifunovic 2015), HF or sudden cardiac death, or both at 31 months (Nasseri 2012), cardiac death on day 239 (Heldman 2014_BM‐MSC), "sudden death" (Chen 2006), and death due to cardiac (three participants) or non‐cardiac causes (two participants) (Patel 2015). Reported deaths in participants who did not receive cell therapy were due to ventricular fibrillation, sudden death, and HF (two participants) (Chen 2006), angina followed by sudden death secondary to AMI (Erbs 2005), progressive HF (Honold 2012), AMI (Tse 2007), HF deterioration (Bartunek 2012), sudden cardiac death (Bartunek 2012; Santoso 2014), systemic infection (Hu 2011), gastrointestinal bleeding (Hu 2011), cardiac death on day 115 (Heldman 2014_BM‐MSC), HF and/or sudden cardiac death at 34 months (Nasseri 2012), "cardiac" death (Patel 2015), gastrointestinal bleeding from carcinoma of the colon (Santoso 2014), and cardiac events in four participants (Trifunovic 2015).
Subgroup analyses
Although primary analyses of mortality showed no evidence for heterogeneity, values of I2 are known to be underestimated, especially when there are few events or a limited number of studies included in a meta‐analysis (Huedo‐Medina 2006; Ioannidis 2007). We therefore performed prespecified subgroup analyses on the primary outcome of mortality as described in the Methods section. Tests for differences between subgroups revealed no differences in mortality between treatment groups, either at short‐term or long‐term follow‐up when participants were grouped according to cell dose (test for subgroup differences, short term: P = 0.23 (Analysis 2.1); long term: P = 0.29 (Analysis 2.2)), baseline cardiac function (short term: P = 0.13 (Analysis 3.1); long term: P = 0.35 (Analysis 3.2)), route of cell administration (short term: P = 0.90 (Analysis 4.1); long term: P = 0.12 (Analysis 4.2)), cell type (short term: P = 0.89 (Analysis 5.1); long term: P = 0.65 (Analysis 5.2)), participant diagnosis (short term: P = 0.57 (Analysis 6.1); long term: P = 0.29 (Analysis 6.2)), or use of co‐interventions (short term: P = 0.15 (Analysis 7.1); long term: P = 0.37 (Analysis 7.2)). Notably, subgroup analysis by participant diagnosis revealed a lower risk of long‐term mortality associated with cell therapy in participants irrespective of diagnosis: chronic ischaemic heart disease (CIHD) (RR 0.52, 95% CI 0.27 to 0.99; participants = 389; studies = 9; I2 = 0%), HF secondary to IHD (RR 0.33, 95% CI 0.19 to 0.58; participants = 401; studies = 9; I2 = 0%), and refractory angina (RR 0.11, 95% CI 0.01 to 0.91; participants = 220; studies = 3; I2 = 0%) (Analysis 6.2), and irrespective of whether co‐interventions were used (co‐interventions: RR 0.47, 95% CI 0.26 to 0.88; participants = 312; studies = 6; I2 = 0%; no co‐interventions: RR 0.32, 95% CI 0.19 to 0.56; participants = 698; studies = 15; I2 = 0%) (Analysis 7.2).
Trial sequential analyses
In trial sequential analysis of long‐term mortality, the cumulative Z‐curve crossed both the conventional threshold but not the adjusted trial sequential monitoring boundary, which may be indicative of an inflated type I error rate (see Figure 4). Furthermore, the existing evidence, based on a total of 432 participants, falls considerably short of the required information size of 1899, suggesting that the apparent beneficial effect of cell therapy on long‐term mortality based on the existing evidence lacks robustness.

Trial sequential analysis: Mortality at long‐term follow‐up (≥ 12 months). TSMB = trial sequential monitoring boundary; horizontal red lines indicate conventional significance threshold.
Periprocedural adverse events
A summary of periprocedural adverse events in each study is included in Table 5. All but three studies reported periprocedural adverse events (or lack of) (Hamshere 2015_IC; Hamshere 2015_IM; Wang 2014), and a fourth study reported adverse events for shockwave treatment but not cell therapy (Assmus 2013).
| Study ID | Periprocedural adverse events |
| 2 deaths (1 control, 1 intracoronary cell therapy) occurred within 30 days of treatment. Reasons were not given, but neither was considered to be related to cell therapy. | |
| In‐hospital events: MI occurred in 1 CPC participant and ventricular arrhythmia detected during monitoring in 1 control participant. | |
| n/r (only safety of shockwave procedure reported) | |
| In the cell therapy group, 1 participant had ventricular tachycardia during procedure which was resolved by cardioversion, and 1 participant had blurred vision after intervention (participant had pre‐existing ophthalmic migraines). Other reported adverse events (gastrointestinal, hepatobiliary, respiratory, thoracic, mediastinal, and peripheral vascular disorders) were not considered to be related to cell therapy. | |
| 3 participants in cell therapy group experienced a transient episode of pulmonary oedema during the injection of stem cells. No sustained arrhythmias were monitored during the procedure. | |
| 1 cell therapy and 1 control participant reported headache, and 1 control participant developed fever during G‐CSF stimulation. G‐CSF resulted in comparable increases in serum C‐reactive protein levels and blood leukocyte count in both CPC and control groups (returned to baseline values within 4 days after G‐CSF). Neither G‐CSF injection nor intracoronary transplantation of CPC caused any elevation in troponin T levels. | |
| n/r | |
| n/r | |
| No participant had significant postprocedural pericardial effusion. Small transient increases in CK‐MB and serum troponin I were observed. There were no treatment emergent serious adverse events among any of participants who received cell therapy. | |
| No participant had significant postprocedural pericardial effusion. Small transient increases in CK‐MB and serum troponin I were observed. There were no treatment emergent serious adverse events among any of participants who received cell therapy. | |
| 1 cell therapy participant died on postoperative day 7 from a perforated oesophageal ulcer complicated by mediastinitis. 1 control participant died on the 5th postoperative day from multiorgan failure secondary to low cardiac output syndrome. | |
| Mild cephalgies and episodes of mild to moderate bone and muscular pain were reported during 5‐day course of G‐CSF. No participant developed chest pain episodes or clinical signs of decompensated HF. No novel ischaemia‐related ECG changes were observed during G‐CSF treatment and after intracoronary CPC infusion. Troponin T levels remained unchanged. Moreover, no specific G‐CSF‐mediated severe complications occurred. Intracoronary infusions were successfully performed without any procedural complications. | |
| 2 participants (unclear which treatment arm) had neurological complications but recovered and were discharged. No participants had arrhythmia. | |
| G‐CSF treatment was well tolerated, all participants presented bone pain as the only symptom. After cell injection, none of the participants had a significant rise in creatine phosphokinase, symptoms, ECG changes, or echocardiographic abnormalities. | |
| 13 participants reported transient increase in angina frequency after administration of G‐CSF. There were no cardiac enzyme elevations, MIs, acute coronary syndromes, or deaths. 1 participant in the placebo group developed ventricular tachycardia during the mapping procedure. No arrhythmias were detected by implantable cardioverter defibrillator, LifeVest, or Holter monitoring in any participant during or after the injection procedure. | |
| Administration of G‐CSF was associated with bone pain (20.1%), angina (17.4%), CHF (2 participants), and 8 participants had troponin elevations consistent with non‐STEMI. In 1 participant a thrombus was observed on the mapping catheter tip as it was removed. 2 participants experienced an apparent myocardial perforation during the injection procedure (1 resulted in haemothorax, which was successfully treated; 1 resulted in cardiac tamponade; this participant died after unsuccessful pericardiocentesis procedure). Elevated troponin levels were observed in 28% of participants at some point during the mobilisation and injection period, all of which were minor and subclinical except for those mentioned above. | |
| 1 participant with a history of episodic ventricular tachycardia developed ventricular tachycardia during the NOGA mapping procedure. Another participant experienced double vision and dizziness during the injection procedure; cerebral‐CT afterwards was normal, but the incident was diagnosed as a minor stroke by the neurologist. 1 participant from the treatment group suffered a stroke 12 days after treatment. | |
| The most common side effects from G‑CSF were bone pain (22%) and low grade pyrexia (65%) (reported in all G‐CSF groups combined). Bleeding from the arterial access site did not differ significantly between the 2 intervention arms. All episodes were minor and resolved with conservative treatment within 24 h of the procedure. As expected, there were increases in troponin and creatine kinase levels postprocedure in both arms. | |
| The most common side effects from G‑CSF were bone pain (22%) and low grade pyrexia (65%) (reported in all G‐CSF groups combined). There were 3 cases of arrhythmia during the intramyocardial procedure that required treatment. Of these, 1 participant developed atrial fibrillation, which reverted to sinus rhythm within 24 h of the procedure. Another participant developed transient complete heart block periprocedure requiring temporary pacing only. The final participant suffered an episode of pulseless ventricular tachycardia following intramyocardial injection, which was successfully cardioverted with a single 200 J external defibrillation and remained haemodynamically stable afterwards. 1 participant died from suspected acute LV failure 6 days after discharge. Bleeding from the arterial access site did not differ significantly between the two intervention arms. All episodes were minor and resolved with conservative treatment within 24 h of the procedure. As expected, there were increases in troponin and creatine kinase levels postprocedure in both arms. | |
| 2 participants in the placebo group died early postoperatively: 1 died on day 8 after developing Candida sepsis following LV failure despite intra‐aortic balloon pump and catecholamine treatment and mechanical assist device implantation, and 1 died on day 22 (reason not given). | |
| 1 participant in the OPCAB plus stem cell therapy group had a haematoma at the bone marrow harvest site. There were no other adverse events in either group (i.e. neurologic, haematologic, vascular, death, or infection events). No participants had any postoperative arrhythmias. | |
| 5 participants who received BMAC experienced “non‐serious adverse events possibly related to the procedure”. Procedure‐related complications included haematomas at the catheterisation site and elevated serum creatinine levels. | |
| There were no differences between treatment groups in participants’ haemodynamics, arterial blood gases, systemic vein oxygen level, blood glucose, acid–base balance, lactate, haemoglobin, body temperature, and diuresis, as well as medications needed. Perioperative measures are reported in detail in Lehtinen 2014. | |
| No perforations or arrhythmias were associated with cell injection procedures. Postprocedural transient left bundle‐branch block (resolved in 24 h) was seen in 1 treated and 1 control participant. 1 treated participant had non‐significant pericardial effusion. No sustained ventricular arrhythmias were observed by Holter monitoring in any participant. Transient fever but no sepsis occurred in 1 control participant. | |
| 1 participant experienced a limited retrograde catheter‐related dissection of the abdominal aorta (withdrawn from study). 1 participant experienced recurrent ventricular tachycardia with hypotension (and received only a small volume of cell product). | |
| No major adverse clinical cardiac events were associated with the cell injection procedures, including no perforations. Electromechanical mapping–related ventricular tachycardia occurred in 2 control participants, and ventricular fibrillation occurred in 1 control participant. No deaths occurred, and HF was not exacerbated in any participant. Holter monitoring showed no sustained ventricular arrhythmia in any participant. | |
| No periprocedural complications occurred in participants who received cell therapy. 2‐dimensional echocardiography did not reveal postprocedural pericardial effusion. Creatine kinase activity and peak troponin T level remained unaltered. No new periprocedural arrhythmias were recorded during 24 h of consecutive electrocardiographic monitoring. An implantable cardioverter defibrillator was implanted to 2 participants with ventricular tachycardia prior to cell injections. | |
| There were no acute procedural‐related complications, including stroke, transient ischaemic attack, ECG changes, sustained ventricular or atrial arrhythmias, and elevation of CPK‐MB. There was also no echocardiographic evidence of pericardial effusion in any participant within the first 24 h of the procedure. | |
| The early postoperative course was uneventful in both groups with no significant differences between them with regard to adverse side effects during hospital stay. There were no significant differences in cardiac‐specific enzymes activities after the operation or the number of atrial fibrillation episodes or appearance of pericardial effusion between the groups. | |
| There were no acute procedure‐related complications, including stroke, transient ischaemic attack, ECG changes, sustained ventricular or atrial arrhythmias, elevation of CPK‐MB, or echocardiographic evidence of pericardial effusion within the first 24 h after the procedure. | |
| There was no inflammatory response or myocardial reaction (white blood cell count, C‐reactive protein, CK, troponin) after cell therapy. There were no immediate pre‐ or postprocedure adverse complications, new electrocardiographic changes, or significant elevations in CK or troponin, and no inflammatory response was observed in participants with bone marrow cell transplant. | |
| In the placebo group, a greater than 0.5‐centimetre pericardial effusion was detected on 2‐dimensional echocardiography in an asymptomatic participant 2 days after the injection procedure, and pericardiocentesis was subsequently performed. | |
| No periprocedural adverse events; cardiac proteins in normal range. | |
| No increase in angina frequency or usage of sublingual NTG was observed in participants of either group. There were no cardiac enzyme elevations, MIs, acute coronary syndromes, or deaths. No participants from either group developed ventricular tachycardia during the cell or saline infusion procedure. No arrhythmias were detected by Holter monitoring in any participant during or after the infusion process. | |
| n/r | |
| Predischarge arrhythmias were reported (as number of events) in both cell therapy and control participants. | |
| Intracoronary application of BMC was performed without any acute or long‐term side effects. There was no inflammatory response or myocardial reaction (i.e. white blood cell count, C‐reactive protein, and creatinine phosphokinase) after cell therapy. | |
| In the perioperative period, sporadic ventricular premature beats and self terminating bouts of rapid atrial fibrillation were observed in both groups. However, 2 participants developed VF, and 1 died in the BMMNC group: 1 participant developed VF on the 5th day postoperatively but was successfully resuscitated and VF well‐controlled, and the other developed refractory VF 5 hours' postoperatively with death on postoperative day 3. There were no ventricular arrhythmias in the control group. |
AMI: acute myocardial infarction
BM: bone marrow
BMAC: bone marrow aspirate concentrate
BMC: bone marrow cells
BMMNC: bone marrow mononuclear cells
CHF: congestive heart failure
CK‐MB: creatine kinase‐MB
CPC: circulating progenitor cells
CPK‐MB: creatine phosphokinase‐MB
CT: computed tomography
ECG: electrocardiogram
G‐CSF: granulocyte colony‐stimulating factor
HF: heart failure
LV: left ventricular
MI: myocardial infarction
MSC: mesenchymal stem cells
non‐STEMI: non‐ST elevation myocardial infarction
n/r: not reported
NTG: nitroglycerine
OPCAB: off‐pump coronary artery bypass
PCI: percutaneous coronary intervention
ULN: upper limit of normal
VF: ventricular fibrillation
Seven studies reported adverse events associated with the administration of G‐CSF. The most common reactions were bone or muscular pain (Honold 2012; Jimenez‐Quevedo 2011; Losordo 2011; Mozid 2014_IC; Mozid 2014_IM), headache (Erbs 2005; Honold 2012), and pyrexia (Erbs 2005; Mozid 2014_IC; Mozid 2014_IM). Two studies reported increased frequency or severity of angina, or both associated with G‐CSF administration (Losordo 2007; Losordo 2011), and one study reported that two participants developed CHF (Losordo 2011).
Reactions associated with bone marrow aspiration were rare: only two studies reported participants with haematomas at the bone marrow harvest site (Patel 2005; Patel 2015). Adverse events during the mapping or injection procedure included ventricular tachycardia in seven participants (three cell therapy (Bartunek 2012; Mathiasen 2015; Perin 2012a), three placebo (Losordo 2007; Perin 2012b), one unknown (Mozid 2014_IM)); ventricular fibrillation in one control participant (Perin 2012b); atrial fibrillation in one participant (Mozid 2014_IM); and the development of transient complete heart block periprocedure requiring temporary pacing only in one participant (Mozid 2014_IM).
Three cell therapy participants experienced transient pulmonary oedema during injection of cells (Chen 2006); a thrombus was observed in one participant on mapping catheter tip as removed (Losordo 2011); and two participants experienced visual disturbances: one reported double vision and dizziness during the injection procedure (Mathiasen 2015), and one participant with pre‐existing ophthalmic migraines experienced blurred vision after the intervention (Bartunek 2012). Two participants experienced a myocardial perforation: one with haemothorax (successfully treated) (Losordo 2011), and one resulting in cardiac tamponade followed by death (Losordo 2011). One participant experienced a limited retrograde catheter‐related dissection of the abdominal aorta (Perin 2012a).
Serious early postoperative adverse events were rare. In the cell therapy group, one participant died on postoperative day 7 from a perforated oesophageal ulcer complicated my mediastinitis (Hendrikx 2006); one participant developed refractory ventricular fibrillation five hours postoperatively and died on day 3 (Zhao 2008); and one death was reported within 30 days of treatment (cause of death not reported but not considered to be related to cell therapy) (Ang 2008). Postprocedural transient left bundle branch block (resolved in 24 hours) was seen in one participant (Perin 2011); in‐hospital MI occurred in one participant (Assmus 2006); one participant suffered a stroke on postoperative day 12 (Mathiasen 2015); and one participant developed ventricular fibrillation on day 5 but was successfully resuscitated (Zhao 2008). In the control group, one participant died on day 5 from multiorgan failure secondary to low cardiac output syndrome (Hendrikx 2006); one participant died on day 8 after developing Candida sepsis following left ventricular failure (Nasseri 2012); one participant died on day 22, no reason given (Nasseri 2012); one participant died from suspected acute left ventricular failure six days after discharge (Mozid 2014_IM); and one participant died within 30 days of treatment with no reason given (Ang 2008). Postprocedural transient left bundle branch block (resolved in 24 hours) was seen in one participant (Perin 2011); one participant developed a pericardial effusion two days after the procedure, and pericardiocentesis was performed (Van Ramshorst 2009); and ventricular arrhythmia was detected during monitoring in one participant (Assmus 2006). Transient fever but no sepsis occurred in one control participant (Perin 2011). One study reported that two participants (unclear which treatment arm) experienced neurological complications but recovered (Hu 2011).
We made no formal comparisons of periprocedural adverse events due to differences in the definition and reporting of adverse events between studies. We acknowledge that there may be a risk of reporting bias for this outcome, as few studies clearly defined periprocedural events.
Secondary outcomes
Morbidity
(a) Non‐fatal myocardial infarction
Twenty studies reported infarction as an outcome at short‐term follow‐up (see Table 3; Table 4) (Ang 2008; Assmus 2006; Hamshere 2015_IC; Hamshere 2015_IM; Honold 2012; Hu 2011; Jimenez‐Quevedo 2011; Losordo 2007; Mathiasen 2015; Mozid 2014_IC; Mozid 2014_IM; Perin 2011; Perin 2012a; Perin 2012b; Tse 2007; Van Ramshorst 2009; Wang 2009; Wang 2010; Yao 2008; Zhao 2008). There was no evidence of a difference in the risk of non‐fatal MI between participants who received cell therapy and those who did not (RR 0.60, 95% CI 0.17 to 2.15; participants = 881; studies = 20; I2 = 0%) (Analysis 1.2), consistent with findings when studies were restricted to those with a low risk of selection bias (RR 0.50, 95% CI 0.05 to 4.58; participants = 288; studies = 6; I2 = 0%) (Analysis 8.2).
Of the nine studies reporting infarction as an outcome at long‐term follow‐up (Assmus 2013; Hamshere 2015_IC; Hamshere 2015_IM; Heldman 2014_BMMNC; Heldman 2014_BM‐MSC; Honold 2012; Losordo 2007; Losordo 2011; Patila 2014), meta‐analysis showed that cell therapy was associated with a lower risk of non‐fatal MI at long‐term follow‐up (RR 0.40, 95% CI 0.17 to 0.93; participants = 461; studies = 9; I2 = 0%) (Analysis 1.2). Sensitivity analysis showed that the effect of cell therapy was robust to risk of selection bias (RR 0.38, 95% CI 0.15 to 0.97; participants = 345; studies = 5; I2 = 0%) (Analysis 8.2).
Trial sequential analysis
Trial sequential analysis applied to non‐fatal MI at long‐term follow‐up (Figure 5) showed that the cumulative Z‐curve crossed conventional significance thresholds but not the adjusted trial sequential monitoring boundaries, which may be indicative of an inflated type I error rate. Furthermore, the existing evidence falls considerably short of the required information size of 2383, suggesting that the apparent beneficial effect of cell therapy on non‐fatal MI at long‐term follow‐up based on existing evidence lacks robustness.
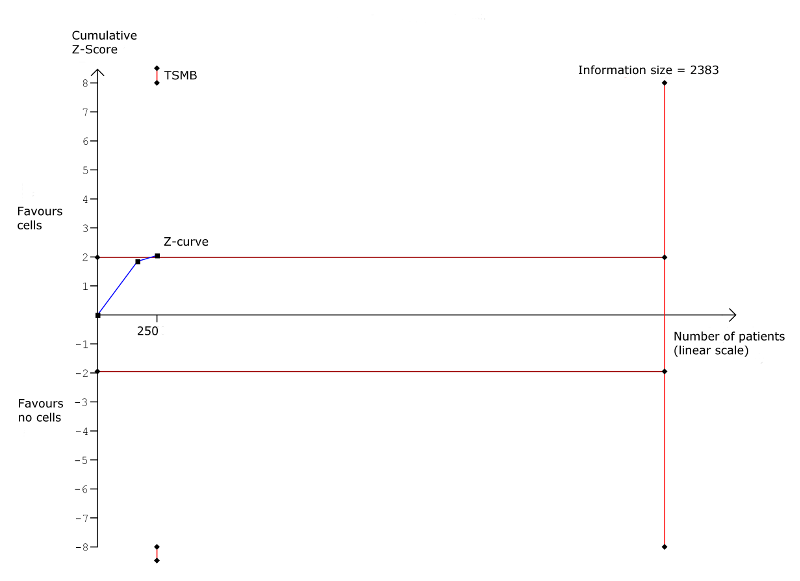
Trial sequential analysis: Non‐fatal myocardial infarction at long‐term follow‐up (≥ 12 months). TSMB = trial sequential monitoring boundary; horizontal red lines indicate conventional significance threshold.
(b) Rehospitalisation due to heart failure
Ten studies reported hospital readmission for HF at short‐term follow‐up (see Table 3; Table 4) (Assmus 2006; Assmus 2013; Hamshere 2015_IC; Hamshere 2015_IM; Honold 2012; Mathiasen 2015; Mozid 2014_IC; Mozid 2014_IM; Perin 2012a; Yao 2008). In participants who received cell therapy, 21/297 (7.0%) were rehospitalised for HF compared with 22/185 (11.9%) who did not, with no evidence of a difference between groups (RR 0.63, 95% CI 0.36 to 1.12; participants = 482; studies = 10; I2 = 0%) (Analysis 1.3).
Of the 10 studies reporting this outcome at long‐term follow‐up (Assmus 2013; Bartunek 2012; Hamshere 2015_IC; Hamshere 2015_IM; Heldman 2014_BMMNC; Heldman 2014_BM‐MSC; Honold 2012; Losordo 2011; Patel 2015; Patila 2014), incidences of rehospitalisation occurred in 21/302 participants (7.0%) who received cell therapy compared with 26/193 (13.5%) who did not (RR 0.62, 95% CI 0.36 to 1.04; participants = 495; studies = 10; I2 = 0%) (Analysis 1.3).
In trials with a low risk of selection bias, sensitivity analysis showed no effect of cell therapy on rehospitalisation due to heart failure at either short‐term (RR 0.65, 95% CI 0.32 to 1.32; participants = 234; studies = 3; I2 = 15%) or long‐term follow‐up (RR 0.63, 95% CI 0.36 to 1.09; participants = 375; studies = 6; I2 = 0%) (Analysis 8.3).
Trial sequential analysis
Trial sequential analysis applied to rehospitalisation due to HF at long‐term follow‐up (Figure 6) showed that the cumulative Z‐curve crossed neither the conventional significance thresholds nor the adjusted trial sequential monitoring boundaries. The existing evidence from 345 participants falls considerably short of the required information size of 1193 to draw reliable conclusions about the effect of cell therapy on rehospitalisation for HF.

Trial sequential analysis: Rehospitalisation due to heart failure at long‐term follow‐up (≥ 12 months). TSMB = trial sequential monitoring boundary; horizontal red lines indicate conventional significance threshold.
(c) Incidence of arrhythmias
Twenty‐four studies reported arrhythmias as an outcome at short‐term follow‐up (see Table 3; Table 4), although one study reported arrhythmias as the number of cumulative events rather than incidence (Wang 2015), and another included nine participants in the control group who were randomised to the treatment arm (Bartunek 2012), and was therefore excluded from the analysis. In trials that defined arrhythmia, the majority reported ventricular arrhythmia (ventricular tachycardia or ventricular fibrillation); two trials reported incidences of atrial fibrillation (Hu 2011; Mathiasen 2015). In the remaining 22 studies, 11 reported incidences of arrhythmias (Assmus 2006; Hamshere 2015_IC; Hamshere 2015_IM; Jimenez‐Quevedo 2011; Losordo 2007; Mathiasen 2015; Mozid 2014_IM; Perin 2012b; Santoso 2014; Wang 2010; Zhao 2008). Arrhythmias occurred in 11/550 participants (2.0%) who received cell therapy compared with 12/409 (2.9%) who did not (RR 0.70, 95% CI 0.33 to 1.45; participants = 959; studies = 22; I2 = 0%) (Analysis 1.4). In trials with a low risk of selection bias, sensitivity analysis showed no effect of cell therapy on incidence of arrhythmias at short‐term follow‐up (RR 0.77, 95% CI 0.18 to 3.21; participants = 224; studies = 6; I2 = 0%) (Analysis 8.4).
Of five studies reporting incidences of arrhythmia at long‐term follow‐up (Assmus 2013; Hamshere 2015_IC; Hamshere 2015_IM; Hu 2011; Losordo 2007), 8/199 participants (4.0%) in the cell therapy group experienced arrhythmias compared with 16/164 (9.8%) in the control group (RR 0.46, 95% CI 0.22 to 0.97; participants = 363; studies = 7; I2 = 0%) (Analysis 1.4); this finding occurred in one study with a low risk of selection bias (RR 0.42, 95% CI 0.18 to 0.99; participants = 82; studies = 1; I2 = 0%) (Analysis 8.3).
Trial sequential analysis
Trial sequential analysis applied to incidence of arrhythmias at long‐term follow‐up (Figure 7) showed that the cumulative Z‐curve from a single trial with a low risk of selection bias crossed the conventional significance thresholds but not the adjusted trial sequential monitoring boundaries. The evidence from this single trial of 82 participants falls considerably short of the required information size of 461 to draw reliable conclusions about the effect of cell therapy on incidence of arrhythmias.
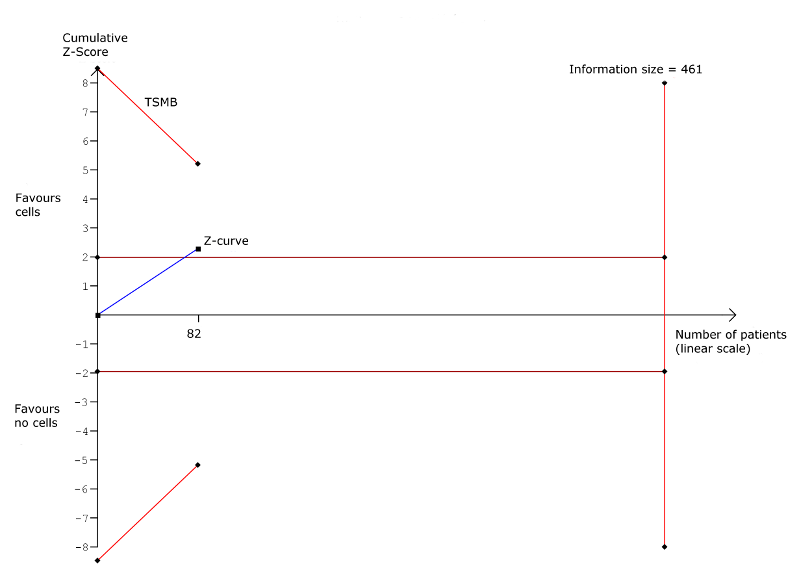
Trial sequential analysis: Arrhythmias at long‐term follow‐up (≥ 12 months). TSMB = trial sequential monitoring boundary; horizontal red lines indicate conventional significance threshold.
(d) Composite measure of mortality, non‐fatal MI, and rehospitalisation for HF
Nine studies reported composite measures of major adverse clinical events, defined here as mortality, non‐fatal MI, and rehospitalisation for HF (see Table 3; Table 4), of which seven reported the composite of mortality, non‐fatal MI, and rehospitalisation for HF (Assmus 2006; Assmus 2013; Hamshere 2015_IC; Hamshere 2015_IM; Heldman 2014_BMMNC; Heldman 2014_BM‐MSC; Hu 2011; Mozid 2014_IC; Mozid 2014_IM). One study defined composite major adverse clinical events (MACE) as cardiovascular death, non‐fatal MI, ischaemic stroke, need for revascularisation, and procedure‐related complications (Jimenez‐Quevedo 2011), and another reported the composite of death, MI, urgent revascularisation, worsening HF, and acute coronary syndrome (Losordo 2011); we excluded these studies from analyses. There was no evidence of a difference between treatment arms at either short‐term (RR 0.51, 95% CI 0.18 to 1.42; participants = 288; studies = 8; I2 = 0%) or long‐term follow‐up (RR 0.68, 95% CI 0.41 to 1.12; participants = 201; studies = 5; I2 = 0%) (Analysis 1.5). These findings were consistent with those from sensitivity analyses of studies with a low risk of selection bias at long‐term follow‐up (RR 0.64, 95% CI 0.38 to 1.08; participants = 141; studies = 3; I2 = 0%) (Analysis 8.5). No studies at low risk of selection bias reported this outcome.
Trial sequential analysis
Trial sequential analysis applied to the composite measure of MACE at long‐term follow‐up (Figure 8) showed that the cumulative Z‐curve crossed neither the conventional significance thresholds nor the adjusted trial sequential monitoring boundaries. The existing evidence from 141 participants falls considerably short of the required information size of 431 to draw reliable conclusions about the effect of cell therapy on rehospitalisation for HF.

Trial sequential analysis: Composite MACE at long‐term follow‐up (≥ 12 months). TSMB = trial sequential monitoring boundary; horizontal red lines indicate conventional significance threshold.
Quality of life
(a) Minnesota Living with Heart Failure Questionnaire (MLHFQ)
Seven studies reported MLHFQ scores as a measure of quality of life (Bartunek 2012; Heldman 2014_BMMNC; Heldman 2014_BM‐MSC; Nasseri 2012; Patel 2015; Perin 2011; Pokushalov 2010), although one study reported results graphically as the percentage of participants showing improvement or deterioration (Bartunek 2012), another reported summary results only (Patel 2015), and in a third study, it was unclear whether mean or median values were reported (Nasseri 2012) (see Table 3; Table 6).
| Study ID | No. analysed participants | Performance assessment | Mean follow‐up | No. analysed participants | Quality of life assessment | Mean follow‐up | ||||
| Cells | No cells | ST | LT | Cells | No cells | ST | LT | |||
| 21 | 21 | NYHA class (SR)a | 6 mths | n/r | ‐ | ‐ | ‐ | ‐ | ‐ | |
| 21 | 21 | CCS class (SR)b | 6 mths | n/r | ‐ | ‐ | ‐ | ‐ | ‐ | |
| 43 | 18 | NYHA class (EP) | 3 mths | n/r | ‐ | ‐ | ‐ | ‐ | ‐ | |
| 43 | 39 | NYHA class (EP/MC) | 4 mths | n/r | ‐ | ‐ | ‐ | ‐ | ‐ | |
| 21 | 15 | NYHA class (SR)c | 6 mths | n/r | 21 | 15 | MLHFQ (SR)c | 6 mths | n/r | |
| 21 | 15 | 6MWT (distance) (EP) | 6 mths | n/r | ‐ | ‐ | ‐ | ‐ | ‐ | |
| 22d | 23d | NYHA class (EP) | 6 mths | 12 mths | ‐ | ‐ | ‐ | ‐ | ‐ | |
| 22d | 23d | ETT (METs) (EP) | 6 mths | 12 mths | ‐ | ‐ | ‐ | ‐ | ‐ | |
| 12 | 10 | Bike test (max O2 update) (EP) | 3 mths | 15 mths | ‐ | ‐ | ‐ | ‐ | ‐ | |
| 15 | 15 | NYHA class (EP) | 6 mths | 12 mths | ‐ | ‐ | ‐ | ‐ | ‐ | |
| 15 | 15 | CCS class (EP) | 6 mths | 12 mths | ‐ | ‐ | ‐ | ‐ | ‐ | |
| 15 | 15 | NYHA class (EP) | 6 mths | 12 mths | ‐ | ‐ | ‐ | ‐ | ‐ | |
| 15 | 15 | CCS class (EP) | 6 mths | 12 mths | ‐ | ‐ | ‐ | ‐ | ‐ | |
| 17 | 16 | NYHA class (SR)e | n/r | 12 mths | 15 | 19 | MLHFQ (MC) | 6 mths | 12 mths | |
| 15f | 19f | 6MWT (distance) (MC) | 6 mths | 12 mths | ‐ | ‐ | ‐ | ‐ | ‐ | |
| 17 | 16 | NYHA class (SR)e | n/r | 12 mths | 19g | 19g | MLHFQ (MC) | 6 mths | 12 mths | |
| 18h | 19h | 6MWT (distance) (MC) | 6 mths | 12 mths | ‐ | ‐ | ‐ | ‐ | ‐ | |
| 21j | 10j | NYHA class (EP) | 3 mths | 60 mths | ‐ | ‐ | ‐ | ‐ | ‐ | |
| 12k | 5k | Bike test (sec) (EP) | 3 mths | 12 mths | ‐ | ‐ | ‐ | ‐ | ‐ | |
| 30 | 27 | 6MWT (distance) (EP/MC) | 6 mths | n/r | ‐ | ‐ | ‐ | ‐ | ‐ | |
| 19 | 9 | CCS class (median)m | 6 mths | n/r | n/r | n/r | SAQ (median)m | 6 mths | n/r | |
| 15 | 7 | ETT (time; METs) (median)m | 6 mths | n/r | 19 | 9 | Angina frequency (median)n | 6 mths | n/r | |
| 18 | 6 | CCS class (MC) | 6 mths | n/r | 18 | 6 | SAQ (SR)p | 6 mths | n/r | |
| 18 | 6 | ETT (time) (MC) | 6 mths | n/r | 17 | 6 | Angina frequency (EP/MC) | 6 mths | n/r | |
| 109q | 53q | CCS class (SR)r | 6 mths | 12 mths | 109q | 53q | SAQ (MC) | 6 mths | 12 mths | |
| 109q | 53q | ETT (time) (MC) | 6 mths | 12 mths | 109 | 53 | Angina frequency (EP) | 6 mths | n/r | |
| 40 | 40 | NYHA class (SR)s | 6 mths | n/r | 40 | 40 | KCCQ‐QOL (SR)s | 6 mths | n/r | |
| 40 | 40 | CCS class (SR)s | 6 mths | n/r | 40 | 40 | SAQ (SR)s | 6 mths | n/r | |
| 40 | 40 | 6MWT (SR)s | 6 mths | n/r | 40 | 40 | Angina frequency (SR)s | 6 mths | n/r | |
| 14 | 2 | NYHA class (EP) | 6 mths | n/r | ‐ | ‐ | ‐ | ‐ | ‐ | |
| 14 | 2 | CCS class (SR) | 6 mths | n/r | ‐ | ‐ | ‐ | ‐ | ‐ | |
| 10 | 8 | NYHA class (EP) | 6 mths | n/r | ‐ | ‐ | ‐ | ‐ | ‐ | |
| 10 | 8 | CCS class (SR) | 6 mths | n/r | ‐ | ‐ | ‐ | ‐ | ‐ | |
| 28 | 26 | NYHA class (EP/MC)t | 6 mths | n/r | 28 | 26 | MLHFQu | 6 mths | n/r | |
| 28 | 26 | 6MWTu | 6 mths | n/r | ‐ | ‐ | ‐ | ‐ | ‐ | |
| 28 | 26 | CCS class (EP/MC)t | 6 mths | n/r | ‐ | ‐ | ‐ | ‐ | ‐ | |
| 10 | 10 | NYHA class (EP/MC)t | 6 mths | n/r | ‐ | ‐ | ‐ | ‐ | ‐ | |
| 17 | 4 | NYHA class (EP)t | n/r | 12 mths | 17 | 4 | MLHFQ (SR) | n/r | 12 mths | |
| 17 | 4 | CCS class (SR) | n/r | 12 mths | ‐ | ‐ | ‐ | ‐ | ‐ | |
| 20 | 19 | NYHA class (EP/MC) | n/r | 12 mthsv | 20 | 19 | SF‐36w | n/r | 60 mths | |
| 20 | 10 | NYHA class (EP) | 6 mths | n/r | 17 | 9 | MLHFQ (EP) | 6 mths | n/r | |
| 20 | 10 | CCS class (EP/MC) | 6 mths | n/r | 13 | 10 | SF‐36 (physical/mental) (EP) | 6 mths | n/r | |
| 55 | 30 | NYHA class (MC) | 6 mths | n/r | ‐ | ‐ | ‐ | ‐ | ‐ | |
| 44 | 22 | CCS class (MC) | 6 mths | n/r | ‐ | ‐ | ‐ | ‐ | ‐ | |
| 51 | 29 | 6MWT (distance) (EP) | 6 mths | n/r | ‐ | ‐ | ‐ | ‐ | ‐ | |
| 10 | 10 | NYHA class (EP) | 6 mths | n/r | ‐ | ‐ | ‐ | ‐ | ‐ | |
| 10 | 10 | CCS class (EP) | 6 mths | n/r | ‐ | ‐ | ‐ | ‐ | ‐ | |
| 53x | 46x | NYHA class (EP) | 6 mths | 12 mths | 53x | 46x | MLHFQ (EP) | 6 mths | 12 mths | |
| 53x | 46x | CCS class (EP) | 6 mths | 12 mths | 53x | 46x | Angina frequency (EP) | 6 mths | 12 mths | |
| 53x | 46x | 6MWT (distance) (EP) | 6 mths | 12 mths | ‐ | ‐ | ‐ | ‐ | ‐ | |
| 19 | 9 | NYHA class (EP)y | 6 mths | n/r | ‐ | ‐ | ‐ | ‐ | ‐ | |
| 19 | 9 | 6MWT (distance) (EP)y | 6 mths | n/r | ‐ | ‐ | ‐ | ‐ | ‐ | |
| 15 | 15 | NYHA class (EP) | 6 mths | 12 mths | ‐ | ‐ | ‐ | ‐ | ‐ | |
| 15 | 15 | 6MWT (distance) (EP) | 6 mths | 12 mths | ‐ | ‐ | ‐ | ‐ | ‐ | |
| 19 | 9 | NYHA class (EP)t | 6 mths | n/r | ‐ | ‐ | ‐ | ‐ | ‐ | |
| 19 | 9 | CCS class (EP)t | 6 mths | n/r | ‐ | ‐ | ‐ | ‐ | ‐ | |
| 19 | 9 | Treadmill test (time; METs) (EP/MC) | 6 mths | n/r | ‐ | ‐ | ‐ | ‐ | ‐ | |
| 33 | 16 | NYHA class (EP) | 6 mths | 12 mths | ‐ | ‐ | ‐ | ‐ | ‐ | |
| 24 | 25 | CCS class (EP) | 6 mths | n/r | 24 | 25 | SAQ (EP/MC) | 6 mths | n/r | |
| 24 | 25 | Bike test (workload) (EP/MC) | 6 mths | n/r | ‐ | ‐ | ‐ | ‐ | ‐ | |
| 16 | 16 | CCS class (MC) | 6 mths | n/r | 16 | 16 | Angina frequency (MC) | 6 mths | n/r | |
| 16 | 16 | ETT (min) (MC) | 6 mths | n/r | ‐ | ‐ | ‐ | ‐ | ‐ | |
| 56 | 56 | CCS class (EP/MC) | 6 mths | n/r | 56 | 56 | Angina frequency (EP/MC) | 6 mths | n/r | |
| 56 | 56 | ETT (min) (EP/MC) | 6 mths | n/r | ‐ | ‐ | ‐ | ‐ | ‐ | |
| n/r | n/r | NYHA class (SR) | 6 mths | n/r | ‐ | ‐ | ‐ | ‐ | ‐ | |
| n/r | n/r | 5MWT (distance) (SR) | 6 mths | n/r | ‐ | ‐ | ‐ | ‐ | ‐ | |
| 16 | 18 | NYHA class (EP) | 6 mths | n/r | ‐ | ‐ | ‐ | ‐ | ‐ | |
| 16 | 18 | CCS class (EP) | 6 mths | n/r | ‐ | ‐ | ‐ | ‐ | ‐ | |
CCS: Canadian Cardiovascular Society; EP: endpoint; ETT: exercise tolerance test; KCCQ‐QOL: Kansas City Cardiomyopathy Questionnaire – Quality of Life; LT: long term; MC: mean change from baseline; MET: metabolic equivalent test (mL/kg/min); MLHFQ: Minnesota Living with Heart Failure Questionnaire; n/r: not reported; NYHA: New York Heart Association; SAQ: Seattle Angina Questionnaire; SF‐36: 36‐Item Short Form Health Survey; SR: summary results; ST: short term; 5MWT: 5‐minute walk test; 6MWT: 6‐minute walk test
aReported as number of participants in NYHA class III/IV.
bReported as number of participants in CCS class II or greater.
cReported graphically as percentage of participants showing improvement or deterioration.
d20/19 at 12 months.
eReported as number who improved/did not change/deteriorated.
f17/19 at 12 months.
g16/19 at 12 months.
h16/19 at 12 months.
j20/6 at 5 years.
k10/5 at 12 months.
mReported as median absolute difference with 95% confidence interval.
nMedian time to onset of angina also reported.
pResults presented graphically.
q106/50 at 12 months.
rReported as percentage of participants changed.
sResults presented graphically with P values for differences between groups.
tCalculated from frequency data.
uUnclear whether mean or median values are reported.
vAlso reported: median values at 60 months.
wReported graphically for each of eight components of SF‐36 at 60 months.
x49/33 at 12 months.
yReported as difference between groups at endpoint.
At short‐term follow‐up, two studies reported MLHFQ values at endpoint (Perin 2011; Pokushalov 2010), and two reported mean change from baseline values (Heldman 2014_BMMNC; Heldman 2014_BM‐MSC). Combined analysis showed that quality of life measured by the MLHFQ was higher in participants who had received cell therapy than in those who had not (mean difference (MD) ‐18.96, 95% CI ‐31.97 to ‐5.94; participants = 197; studies = 4; I2 = 68%) (Analysis 1.6). All but one of these studies also reported MLHFQ at long‐term follow‐up (Perin 2011), but there was insufficient evidence to show that the difference observed at short‐term follow‐up was maintained over long‐term follow‐up (MD ‐17.80, 95% CI ‐39.87 to 4.26; participants = 151; studies = 3; I2 = 93%) (Analysis 1.7).
The number of studies reporting this outcome precluded further investigation of the substantial observed heterogeneity at both short‐term and long‐term follow‐up through subgroup analyses.
(b) Seattle Angina Questionnaire (SAQ)
Five studies reported quality of life measured by the SAQ (Jimenez‐Quevedo 2011; Losordo 2007; Losordo 2011; Mathiasen 2015; Van Ramshorst 2009), although two studies presented results graphically (Losordo 2007; Mathiasen 2015), and one reported median values (Jimenez‐Quevedo 2011) (see Table 3; Table 6). Evidence from two studies that reported mean change from baseline values found a higher quality of life associated with cell therapy (MD 9.34, 95% CI 2.62 to 16.07; participants = 211; studies = 2; I2 = 16%) (Analysis 1.8) (Losordo 2011; Van Ramshorst 2009). A single study reporting mean change in SAQ values from baseline at long‐term follow‐up found no difference between treatment arms (Losordo 2011).
Other reported measures of quality of life included the 36‐Item Short Form Health Survey (SF‐36) physical and mental scores (Perin 2011), SF‐36 (eight dimensions) (Patila 2014), and the Kansas City Cardiomyopathy Questionnaire (Mathiasen 2015).
(c) Angina frequency
Seven studies measured angina frequency, which has been shown to be strongly associated with health‐related quality of life outcomes in people with chronic heart disease (Arnold 2014), and can therefore be considered a surrogate measure of quality of life. Angina frequency was reported as the number of episodes per day (Pokushalov 2010), per week (Losordo 2007; Losordo 2011; Mathiasen 2015; Wang 2009; Wang 2010), or per month (Jimenez‐Quevedo 2011) (see Table 3; Table 6). One study reported median values at endpoint (Jimenez‐Quevedo 2011), and another reported results graphically (Mathiasen 2015). Meta‐analysis of four studies reporting angina frequency at follow‐up showed that participants who received cell therapy experienced fewer episodes of angina per week than the control group (MD ‐6.96, 95% CI ‐11.99 to ‐1.93; participants = 396; studies = 4; I2 = 44%), although we observed no difference in three studies reporting mean change from baseline values (MD ‐1.77, 95% CI ‐14.61 to 11.08; participants = 167; studies = 3; I2 = 76%) (Analysis 1.9). There were insufficient studies to explore potential reasons for the substantial observed heterogeneity through subgroup analyses.
Only one study reported angina frequency at long‐term follow‐up; this study reported fewer angina episodes associated with cell therapy (Pokushalov 2010).
Performance status
(a) New York Heart Association (NYHA) classification
Twenty‐three studies reported NYHA classification at short‐term follow‐up (see Table 3; Table 6). Two studies reported results graphically (Bartunek 2012; Mathiasen 2015); one study reported the number of participants in NYHA class III or IV (Ang 2008); two studies only reported summary results (Santoso 2014; Wang 2014); and in one study there was only one participant in the control group (Mozid 2014_IC); we have therefore excluded these studies from meta‐analysis. In 17 studies reporting mean NYHA class at short‐term follow‐up (Assmus 2006; Assmus 2013; Chen 2006; Hamshere 2015_IC; Hamshere 2015_IM; Honold 2012; Mozid 2014_IM; Nasseri 2012; Patel 2005; Perin 2011; Perin 2012a; Perin 2012b; Pokushalov 2010; Trifunovic 2015; Tse 2007; Turan 2011; Zhao 2008), combined meta‐analysis of mean change from baseline and endpoint values showed cell therapy to be associated with a lower NYHA classification (MD ‐0.44, 95% CI ‐0.84 to ‐0.05; participants = 741; studies = 17; I2 = 97%). This was also demonstrated in the analysis of endpoint values only (MD ‐0.42, 95% CI ‐0.84 to ‐0.00; participants = 658; studies = 16; I2 = 97%), but not in four studies that reported mean change from baseline values (MD ‐0.56, 95% CI ‐1.49 to 0.36; participants = 239; studies = 4; I2 = 95%) (Analysis 1.10). Sensitivity analysis omitting those studies with a high or unclear risk of selection bias indicated that the difference in NYHA class between treatment groups in favour of cell therapy may be subject to selection bias (MD ‐0.26, 95% CI ‐0.59 to 0.07; participants = 277; studies = 5; I2 = 79%) (Analysis 8.6).
Eleven studies reported NYHA class at long‐term follow‐up, although two studies only reported the number of participants who improved or worsened (Heldman 2014_BMMNC; Heldman 2014_BM‐MSC). Meta‐analysis of nine studies showed that a lower NYHA class was associated with cell therapy (MD ‐0.81, 95% CI ‐1.23 to ‐0.39; participants = 346; studies = 9; I2 = 93%) (Analysis 1.11) (Chen 2006; Hamshere 2015_IC; Hamshere 2015_IM; Honold 2012; Patel 2015; Patila 2014; Pokushalov 2010; Trifunovic 2015; Turan 2011). This improvement in NYHA class associated with cell therapy was demonstrated in one study with a low risk of selection bias (MD ‐2.20, 95% CI ‐2.70 to ‐1.70; participants = 39; studies = 1; I2 = 0%) (Analysis 8.7).
Subgroup analyses
In view of the high level of heterogeneity across studies measuring NYHA class at both short‐ and long‐term follow‐up, we conducted exploratory subgroup analyses. At short‐term follow‐up, tests for subgroup differences showed no difference in the effect of cell therapy on NYHA class between studies grouped according to cell dose (P = 0.69) (Analysis 2.3), baseline cardiac function (P = 0.86) (Analysis 3.3), route of cell administration (P = 0.75) (Analysis 4.3), cell type (P = 0.95) (Analysis 5.3), participant diagnosis (P = 0.91) (Analysis 6.3), or use of co‐interventions (P = 0.62) (Analysis 7.3). Visual inspection of forest plots revealed two study outliers at short‐term follow‐up (Patel 2005; Pokushalov 2010); however, substantial heterogeneity (I2 = 80%) remained when these two studies were omitted from the analysis.
At long‐term follow‐up, the number of studies reporting NYHA classification precluded subgroup analysis by cell dose or cell type. We observed no differences from tests of subgroup differences when participants were grouped according to baseline cardiac function (P = 0.51) (Analysis 3.4), route of cell administration (P = 0.21) (Analysis 4.4), or participant diagnosis (P = 0.41) (Analysis 6.4). Of note, the mean NYHA class was significantly lower both in participants with CIHD (MD ‐0.66, 95% CI ‐0.91 to ‐0.42; participants = 105; studies = 3; I2 = 0%) and participants with HF secondary to IHD (MD ‐0.92, 95% CI ‐1.47 to ‐0.37; participants = 241; studies = 6; I2 = 93%) when compared to the respective control groups (Analysis 6.4).
Trial sequential analysis
Trial sequential analysis of NYHA class at short‐term follow‐up showed that the cumulative Z‐curve did not cross the threshold for significance despite exceeding the information size of 522 participants required to detect a mean difference in NYHA class of 1. However, the required information size to detect a small difference would be substantially higher (e.g. 2025 participants would be required to detect a mean difference in NYHA class between groups of 0.5). Over long‐term follow‐up, the cumulative Z‐curve crossed the adjusted trials sequential monitoring boundaries, although the required information size of 380 to detect a difference between groups of 1 was not reached. Further evidence is required before this result can been considered robust.
(b) Canadian Cardiovascular Society (CCS) angina classification
Twenty studies reported CCS angina classification (see Table 3; Table 6). However, mean values at follow‐up or as change from baseline values were not available in seven studies: one reported median values (Jimenez‐Quevedo 2011); one reported results graphically (Mathiasen 2015); one reported the number of participants with CCS class greater than 2 (Ang 2008); one reported the percentage of participants who changed CCS class (Losordo 2011); two reported results pooled across multiple trial arms (Mozid 2014_IC; Mozid 2014_IM); and one reported summary results only (Patel 2015).
At short‐term follow‐up, combined meta‐analysis of 13 studies found no difference in mean CCS class at follow‐up between participants who had received cell therapy and those who had not (MD ‐0.43, 95% CI ‐0.92 to 0.06; participants = 608; studies = 13; I2 = 94%) (Analysis 1.12). Similarly, there was no difference between treatment arms at long‐term follow‐up in three studies (all of which reported mean CCS class at endpoint) (MD ‐0.58, 95% CI ‐2.04 to 0.88; participants = 142; studies = 3; I2 = 99%) (Analysis 1.13).
Subgroup analyses
We observed substantial heterogeneity at short‐ and long‐term follow‐up. Exploratory subgroup analyses of CCS class at short‐term follow‐up revealed no differences between studies grouped according to cell dose (P = 0.64) (Analysis 2.4), baseline cardiac function (P = 0.82) (Analysis 3.5), route of cell administration (P = 0.50) (Analysis 4.5), cell type (P = 0.79) (Analysis 5.4), or participant diagnosis (P = 0.27) (Analysis 6.5). Although we observed no difference in CCS class between treatment groups at short‐term follow‐up overall, subgroup analysis showed that in five studies of refractory angina (Losordo 2007; Tse 2007; Van Ramshorst 2009; Wang 2009; Wang 2010), a higher CCS class was observed in participants who had received cell therapy compared with those who had not (MD ‐0.78, 95% CI ‐1.44 to ‐0.11; participants = 245; studies = 5; I2 = 74%) (Analysis 6.5).
(c) Exercise capacity
Twenty‐one studies reported exercise capacity (see Table 3; Table 6). Measures of exercise capacity included an exercise tolerance test measured as metabolic equivalents, in Chen 2006 and Jimenez‐Quevedo 2011, or as time in minutes (Losordo 2007; Wang 2009; Wang 2010), seconds (Losordo 2011), log seconds (Tse 2007), or unspecified (Jimenez‐Quevedo 2011); a bicycle test measured as maximum O2 update, in Erbs 2005 and Honold 2012, or by workload (Van Ramshorst 2009); and by a five‐minute, in Wang 2014, or six‐minute walk test measured as distance (Bartunek 2012; Heldman 2014_BMMNC; Heldman 2014_BM‐MSC; Hu 2011; Mathiasen 2015; Nasseri 2012; Perin 2012a; Pokushalov 2010; Santoso 2014; Trifunovic 2015). All but five trials reported either mean values at follow‐up or mean change from baseline values. One study reported data as median values (Jimenez‐Quevedo 2011); one reported results graphically (Mathiasen 2015); two reported summary descriptive results only (Santoso 2014; Wang 2014); and in one study it was unclear whether mean or median values were reported (Nasseri 2012).
We have described results for exercise capacity using the standardised mean difference, allowing outcomes of different measurement scales to be combined in a meta‐analysis. This method of analysis does not allow mean change from baseline and endpoint data to be combined, and we therefore have presented separate analyses of mean change from baseline and endpoint data.
In 11 studies that reported exercise capacity as mean values at follow‐up (Bartunek 2012; Chen 2006; Erbs 2005; Honold 2012; Hu 2011; Perin 2012a; Pokushalov 2010; Trifunovic 2015; Tse 2007; Van Ramshorst 2009; Wang 2010), participants who received cell therapy showed a greater exercise capacity than those who did not (standardised mean difference (SMD) 0.56, 95% CI 0.19 to 0.93; participants = 563; studies = 11; I2 = 75%). Similarly, meta‐analysis of nine studies with mean change from baseline values showed greater performance levels associated with cell therapy (SMD 0.33, 95% CI 0.05 to 0.61; participants = 535; studies = 9; I2 = 52%) (Analysis 1.14) (Heldman 2014_BMMNC; Heldman 2014_BM‐MSC; Hu 2011; Losordo 2007; Losordo 2011; Tse 2007; Van Ramshorst 2009; Wang 2009; Wang 2010).
We also saw the difference in performance levels between participants who had received cell therapy and the control group at long‐term follow‐up, in five studies that reported mean values at endpoint (SMD 1.14, 95% CI 0.04 to 2.25; participants = 178; studies = 5; I2 = 89%) (Chen 2006; Erbs 2005; Honold 2012; Pokushalov 2010; Trifunovic 2015), and in three studies with mean change from baseline values (SMD 0.34, 95% CI 0.07 to 0.62; participants = 227; studies = 3; I2 = 0%) (Analysis 1.15) (Heldman 2014_BMMNC; Heldman 2014_BM‐MSC; Losordo 2011).
Subgroup analyses
We investigated the substantial observed heterogeneity at short‐term follow‐up through exploratory subgroup analysis. Tests for subgroup differences found no differences in measures of exercise performance at follow‐up between studies grouped according to cell dose (P = 0.72) (Analysis 2.5), baseline cardiac function (P = 0.31) (Analysis 3.6), route of cell administration (P = 0.21) (Analysis 4.6), or participant diagnosis (P = 0.40) (Analysis 6.6). The number of studies reporting exercise capacity was insufficient to perform subgroup analysis according to the type of cells infused.
Left ventricular ejection fraction (LVEF)
In order to limit possible heterogeneity, we have subgrouped trials reporting LVEF by the method of measurement. Results are shown in forest plots for the combined analyses of mean change from baseline and endpoint values as well as separately, as described in the Methods section. Baseline LVEF values for each trial are given in Table 7 for each method of measurement reported. One study measured LVEF by either single‐photon emission computed tomography (SPECT) or echocardiography and was therefore excluded from the analyses (Patel 2005).
| Study ID | No. randomised participants | No. analysed participants | Baseline LVEF: Mean (SD) | Mean follow‐up of LVEF | ||||
| Cells | No cells | Cells | No cells | Cells | No cells | ST | LT | |
| Measured by MRI | ||||||||
| 42 | 21 | 18 | 7 | IM: 25.4 (8.1) IC: 28.5 (6.5) | 20.9 (8.9) | 6 mths | ‐ | |
| 43 | 39 | 15 | 12 | n/r | n/r | 4 mths | ‐ | |
| 14 | 14 | 12a | 11a | 51.0 (12.1) | 55.8 (12.4) | 3 mths | 15 mths | |
| 11 | 12 | 10 | 10 | 42.9 (10.3) | 39.5 (5.5) | 4 mths | ‐ | |
| 23 | 10 | 9 | 4 | 33.4 (SEM 12.7) | 23.3 (SEM 7.2) | 3 mths | 12 mths | |
| 31 | 29 | 31b | 28b | 23.5 (6.7) | 24.8 (5.2) | 6 mths | 12 mths | |
| 40 | 20 | 40 | 20 | 28.2 (9.3) | 25.1 (8.5) | 6 mths | ‐ | |
| 30 | 30 | 26 | 22 | 27 (6) | 26 (6) | 6 mths | ‐ | |
| 20 | 19 | 18 | 7 | 37.1 (9.5) | 38.5 (13.5) | ‐ | 60 mths | |
| 19 | 9 | 19 | 9 | 23.6 (8.4) | 26.8 (8.8) | 6 mths | ‐ | |
| 19 | 9 | 18 | 8 | 51.9 (8.5) | 45.7 (8.3) | 6 mths | ‐ | |
| 25 | 25 | 22 | 18 | 56 (12) | 54 (10) | 6 mths | ‐ | |
| 35 | 35 | 35 | 35 | 29 (7) | 28 (6) | 6 mths | ‐ | |
| Measured by echocardiography | ||||||||
| 32 | 15 | 21 | 15 | 27.5 (95% CI 25.5, 29.5) | 27.8 (95% CI 25.9, 29.8) | 6 mths | ‐ | |
| 31 | 29 | 24 | 18 | 36.0 (1.2) | 34.7 (1.4) | ‐ | 12 mths | |
| 20 | 10 | 20 | 10 | 37.0 (10.6) | 39.0 (9.1) | 6 mths | ‐ | |
| 61 | 31 | 54 | 28 | 34.7 (8.8) | 32.3 (8.6) | 6 mths | ‐ | |
| 10 | 10 | 10 | 10 | 36.1 (10.9) | 32.1 (10.6) | 6 mths | ‐ | |
| 55 | 54 | 53c | 46c | 27.8 (3.4) | 26.8 (3.8) | 6 mths | 12 mths | |
| 15 | 15 | 15 | 15 | 35.3 (3.9) | 36.5 (5.3) | 6 mths | 12 mths | |
| 25 | 25 | 24 | 25 | 50 (5) | 52 (5) | 6 mths | ‐ | |
| 45 | 45 | 45 | 45 | 39.3 (6.2) | 38.2 (8.0) | 6 mths | ‐ | |
| 18 | 18 | 16 | 18 | 35.8 (7.3) | 36.7 (9.2) | 6 mths | ‐ | |
| Measured by SPECT | ||||||||
| 24 | 24 | 22d | 23d | 26 (6) | 23 (8) | 6 mths | 12 mths | |
| 20 | 10 | 20 | 10 | 41.5 (11.2) | 43.0 (10.4) | 6 mths | ‐ | |
| 25 | 25 | 24 | 25 | 53 (12) | 54 (12) | 6 mths | 12 mths | |
| Measured by LV angiography | ||||||||
| 52 | 23 | 43 | 18 | BMMNC: 41 (11) CPC: 39 (10) | 43 (13) | 3 mths | ‐ | |
| 43 | 39 | 41 | 38 | LDSW: 37.2 (95% CI 31.7, 42.7) HDSW: 32.4 (95% CI 26.9, 37.9) | LDSW: 29.9 (95% CI 24.0, 35.7) HDSW: 32.3 (95% CI 26.5, 38.1) | 4 mths | ‐ | |
| 23 | 10 | 21 | 5 | 37.5 (SEM 12.9) | 37.6 (SEM 7.5) | 3 mths | ‐ | |
| 20 | 10 | 20 | 10 | 37.5 (8.2) | 40.0 (3.2) | 6 mths | ‐ | |
| 10 | 10 | 10 | 10 | 38.0 (17.5) | 41.9 (11.8) | 6 mths | ‐ | |
| 38 | 18 | 33 | 16 | 46 (10) | 46 (10) | 3 mths | 12 mths | |
95% CI: 95% confidence interval; BMMNC: bone marrow mononuclear cells; CPC: circulating progenitor cells; HDSW: high‐dose shockwave; IC: intracoronary; IM: intramyocardial; LDSW: low‐dose shockwave; LT: long term; LV: left ventricular; LVEF: left ventricular ejection fraction; SD: standard deviation; SEM: standard error of the mean; SPECT: single‐photon emission computed tomography; ST: short term
a12/10 at 15 months.
b25/25 at 12 months.
c20/19 at 12 months.
d49/33 at 12 months.
(a) Magnetic resonance imaging (MRI)
Fifteen studies reported LVEF measured by MRI at short‐term follow‐up, although two studies reported summary results only (Hamshere 2015_IC; Hamshere 2015_IM), and we excluded one study, Yao 2008, from analysis due to data inconsistencies as described above (Ang 2008; Assmus 2013; Erbs 2005; Hendrikx 2006; Honold 2012; Hu 2011; Mathiasen 2015; Nasseri 2012; Santoso 2014; Tse 2007; Van Ramshorst 2009; Wang 2014). Meta‐analysis showed that cell therapy was associated with improved LVEF at short‐term follow‐up (MD 2.92, 95% CI 1.03 to 4.82; participants = 439; studies = 12; I2 = 64%). This was also demonstrated in separate analyses of nine studies with mean change from baseline data (MD 4.05, 95% CI 2.55 to 5.55; participants = 308; studies = 9; I2 = 33%), but not in 10 studies that reported mean LVEF values at follow‐up (MD 3.01, 95% CI ‐0.05 to 6.07; participants = 352; studies = 10; I2 = 59%) (Analysis 1.16).
Sensitivity analysis excluding studies with a high or unclear risk of selection bias confirmed the improved LVEF observed in participants who had received cell therapy compared with those who had not (MD 2.92, 95% CI 0.67 to 5.17; participants = 249; studies = 7; I2 = 63%) (Analysis 8.8).
Six studies reported LVEF measured by MRI at long‐term follow‐up, although two reported results graphically (Heldman 2014_BMMNC; Heldman 2014_BM‐MSC). Meta‐analysis of the remaining four studies showed cell therapy to be associated with higher LVEF values (combined analysis: MD 4.38, 95% CI 0.82 to 7.93; participants = 110; studies = 4; I2 = 17%) (Erbs 2005; Honold 2012; Hu 2011; Patila 2014), although this was not demonstrated in separate analyses of mean LVEF at endpoint and mean change from baseline values (Analysis 1.17), and was not found in one study with a low risk of selection bias (MD ‐1.60, 95% CI ‐8.70 to 5.50; participants = 25; studies = 1; I2 = 0%) (Analysis 8.9).
Subgroup analyses
In view of the substantial heterogeneity observed at short‐term follow‐up, we performed exploratory subgroup analyses. Tests for subgroup differences revealed no differences between subgroups defined by cell dose (P = 0.08) (Analysis 2.6), baseline cardiac function (P = 0.38) (Analysis 3.7), route of cell administration (P = 0.46) (Analysis 4.7), cell type (P = 0.95) (Analysis 6.7), or use of co‐interventions (P = 0.42) (Analysis 7.4).
Trial sequential analysis
Trial sequential analysis of LVEF at long‐term follow‐up based on evidence from a single trial with low risk of selection bias showed that the cumulative Z‐curve crossed neither the conventional threshold nor the adjusted trials sequential monitoring boundaries (Figure 9). The available evidence from 25 participants falls considerably short of the required information size of 322 participants.

Trial sequential analysis: Left ventricular ejection fraction measured by MRI at long‐term follow‐up (≥ 12 months). TSMB = trial sequential monitoring boundary; horizontal red lines indicate conventional significance threshold.
(b) Echocardiography
Twelve studies reported LVEF measured by echocardiography at short‐term follow‐up, although one reported median values (Jimenez‐Quevedo 2011), and two studies, Nasseri 2012 and Patel 2015, reported results graphically (Bartunek 2012; Jimenez‐Quevedo 2011; Nasseri 2012; Patel 2015; Perin 2011; Perin 2012a; Perin 2012b; Pokushalov 2010; Trifunovic 2015; Van Ramshorst 2009; Wang 2015; Zhao 2008). Meta‐analysis of nine studies showed cell therapy to be associated with LVEF (combined analysis: MD 5.71, 95% CI 4.29 to 7.13; participants = 470; studies = 9; I2 = 28%) (Analysis 1.18). This was also observed in separate analyses of mean LVEF values at follow‐up (MD 5.16, 95% CI 2.87 to 7.44; participants = 388; studies = 8; I2 = 64%) and mean change from baseline values (MD 3.47, 95% CI 1.59 to 5.34; participants = 161; studies = 3; I2 = 0%) (Analysis 1.18).
At long‐term follow‐up, five studies reported LVEF measured by echocardiography, although one reported results graphically (Patel 2015), and one did not report any measures of variation (Patel 2005). Meta‐analysis of three studies showed that the improvement in LVEF associated with cell therapy extended to long‐term follow‐up (MD 7.96, 95% CI 6.39 to 9.54; participants = 154; studies = 3; I2 = 6%) (Analysis 1.19).
(c) Single‐photon emission computed tomography (SPECT)
Five studies reported LVEF measured by SPECT at short‐term follow‐up (Chen 2006; Jimenez‐Quevedo 2011; Patel 2015; Perin 2011; Van Ramshorst 2009), although one study reported median values (Jimenez‐Quevedo 2011). Meta‐analysis of the remaining four studies showed cell therapy to be associated with improved LVEF when measured by SPECT (MD 5.22, 95% CI 2.60 to 7.85; participants = 145; studies = 4; I2 = 0%) (Analysis 1.20). Only two studies reported LVEF measured by SPECT at long‐term follow‐up (Chen 2006; Van Ramshorst 2009): we observed no difference in LVEF between participants who had received cell therapy and controls (MD 0.28, 95% CI ‐2.48 to 3.03; participants = 88; studies = 2; I2 = 0%) (Analysis 1.21).
(d) Left ventricular (LV) angiography
Seven studies reported LVEF measured by LV angiography (Assmus 2006; Assmus 2013; Honold 2012; Jimenez‐Quevedo 2011; Perin 2011; Perin 2012b; Turan 2011), although one study reported median values (Jimenez‐Quevedo 2011). Meta‐analysis showed that cell therapy improved LVEF at short‐term follow‐up (MD 2.00, 95% CI 0.53 to 3.46; participants = 250; studies = 6; I2 = 33%). We observed this result in separate analysis of both mean LVEF at follow‐up (MD 3.18, 95% CI 0.39 to 5.97; participants = 265; studies = 6; I2 = 7%) and mean change in LVEF from baseline (MD 1.72, 95% CI 0.50 to 2.95; participants = 181; studies = 4; I2 = 18%) (Analysis 1.22). Only one study reported LVEF measured by LV angiography at long‐term follow‐up (Turan 2011): this study found higher LVEF values at long‐term follow‐up in participants who had received cell therapy compared with those who had not (MD 6.00, 95% CI 0.81 to 11.19; participants = 49; studies = 1; I2 = 0%) (Analysis 1.23).
Discussion
Mortality rates following MI have decreased in recent years due to state‐of‐the‐art revascularisation procedures and optimal medical care (Hartwell 2005). Consequently, the incidence of HF secondary to IHD is increasing. RCTs involving the administration of cell therapies as adjunctive therapies to revascularisation for patients with chronic IHD and HF have developed over the last 15 years (for review see Afzal 2015; Fisher 2014; Jeevanantham 2012). We have updated the original version of this review (Fisher 2014), incorporating data from 15 new trials to increase the quality of available evidence and draw more robust conclusions.
Trials compared cell therapy to no cells (control or placebo) and administered standard primary interventions consisting of medical therapy only or medical therapy and revascularisation (PCI or CABG) or shockwave. Included participants were diagnosed with chronic IHD, generally including chronic symptoms of ischaemia that persisted for at least 30 days since the last MI, HF secondary to IHD, or refractory angina. Cell type and dose administered and route of administration are detailed in Table 2. All trials reported short‐term follow‐up of between three and six months, and 17 trials reported follow‐up of 12 months and longer. We defined mortality and adverse events as primary outcomes and morbidity, composite measure of mortality, non‐fatal MI, and rehospitalisation for HF; performance status; health‐related quality of life measures; and LVEF as secondary outcomes.
Summary of main results
This update includes 38 RCTs with a total of 1907 participants (1114 cell therapy, 793 no cell therapy). We have drawn the main conclusions of this version of the review from those studies with a low risk of selection bias; they are as follows.
-
We found low‐quality evidence that cell therapy reduces the risk of all‐cause mortality at long‐term follow‐up in people with CIHD, HF secondary to IHD, and refractory angina. However, trial sequential analysis showed that this result may be subject to an inflated type I error rate. The available evidence has not met the overall number of participants required to draw robust conclusions (the information size); a further large trial of around 1899 participants is required before this result can be considered robust and conclusive.
-
Periprocedural adverse events were infrequent, and serious adverse events were rare.
-
Analysis of morbidity produced low‐quality evidence that cell therapy may reduce the risk of both non‐fatal MI and arrhythmias at long‐term follow‐up. However, as for mortality, these findings may be subject to an inflated type I error rate. Trial sequential analysis showed that the available evidence has not met the number of participants (2383 for non‐fatal MI and 461 for arrhythmias) required to draw robust conclusions. The current evidence does not support a beneficial effect of cell therapy on rehospitalisation for HF or morbidity defined as a composite measure of mortality, non‐fatal MI, and rehospitalisation for HF.
-
In studies with a low risk of selection bias, we found no effect of cell therapy for either mortality or morbidity outcomes at short‐term follow‐up.
-
Cell therapy is associated with an improvement in LVEF measured by MRI at short‐term follow‐up, but not at long‐term follow‐up. Trial sequential analysis of LVEF at long‐term follow‐up showed that the evidence is not robust, as the meta‐analysis did not reach the required information size of 322 participants.
-
Quality of life and performance status outcomes were infrequently reported, often with different measures used for different participant diagnoses, and with limitations in reporting (e.g. different summary measures reported, results reported graphically), minimising the data available for formal meta‐analysis, therefore results should be interpreted with caution.
-
Subgroup analyses found no evidence for differences in the effect of cell therapy between subgroups when studies were grouped according to cell dose, route of cell administration, cell type, participant diagnosis, or use of co‐interventions. Notably, cell therapy was effective on long‐term mortality irrespective of participant diagnosis (CIHD, HF secondary to IHD, refractory angina) and irrespective of whether co‐interventions were used.
Overall completeness and applicability of evidence
We found low‐quality evidence that cell therapy is associated with a reduced risk of mortality over long‐term follow‐up, although more evidence is required before this finding can been considered robust. The number of studies reporting morbidity outcomes was generally low. There was evidence that cell therapy reduces the risk of non‐fatal MI and arrhythmias during long‐term follow‐up, but meta‐analyses were underpowered due to the number of included studies (and participants), as well as the low number of observed events. Composite measures of mortality and morbidity are infrequently reported, despite the increased statistical power obtained from such measures.
We detected no differences between different cell types, doses, or routes of administration. This contrasts with a recent systematic review that found evidence of greater efficacy associated with more than 50 million cells in a combined analysis of trials of both AMI and IHD (Afzal 2015), although it should be said that the subgroup analyses performed here were considerably underpowered to detect subgroup effects, with few studies in each group. Notably, subgroup analysis by participant diagnosis showed that cell therapy appears to reduce the risk of long‐term mortality in people with the following diagnoses: chronic IHD, HF secondary to IHD, and refractory angina, and is also effective both in people who are given co‐interventions (PCI, CABG, or shockwave) and in those who receive no such co‐interventions.
We have included trial sequential analysis in the present update of this systematic review. We acknowledge that the assumption of a relative risk reduction in mortality of 35% is arbitrary and only compares with the effect size associated with revascularisation using PCI. This may indeed seem optimistic, considering the expectation that cell therapies may have a more modest effect. However, if we consider a relative risk reduction in mortality of 25% as an acceptable clinically relevant effect (Yusuf 2002), clearly the required meta‐analysis information size will increase.
This systematic review and meta‐analysis aimed at evaluating the clinical effect of cell therapies in IHD and HF because these outcomes are more likely to be free of risk of performance bias. However, this review also reports changes in LVEF as a surrogate for heart function. Although a great majority of included trials report LVEF as an outcome measure, its use as surrogate for heart function is questionable in the setting of heart failure. Changes in LV volumes (LVESV and LVEDV) may be more meaningful measures to assess the effect of these therapies on heart function. Future trials and future updates of this systematic review should report changes in LV volume in preference to LVEF.
Quality of the evidence
Although the summary of findings is promising, we deemed the quality of the available evidence as low for all outcomes. The included studies were small: only three studies included more than 100 participants in total, and the majority were considerably smaller, leading to a risk of small‐study bias and spuriously inflated effect sizes. Furthermore, where pooling of trial results was possible, meta‐analytical findings were based on small numbers of events (e.g. 93 deaths out of 1010 participants, 22 non‐fatal MIs out of 461 participants, 47 rehospitalisations for HF out of 495 participants over long‐term follow‐up), with the composite measure of mortality, non‐fatal MI, and rehospitalisation for HF reported in only five studies.
We have conducted subgroup analyses as defined in the protocol of the review. However, results from subgroup analyses should be considered with caution, as the number of studies in each subgroup and the number of events were reduced even further.
The GRADE approach aims to evaluate the quality of the evidence for each major outcome. It also takes into consideration results from the trial sequential analyses (see summary of findings Table for the main comparison). For the outcomes of mortality, morbidity, and LVEF, we deemed the quality of the evidence as generally low due to imprecision, as the required information size had not been reached. We further downgraded quality due to the risk of bias from a lack of blinding, a high attrition rate, and commercial sponsorship of some studies.
Overall, the results of this systematic review should be interpreted with caution, as it appears that for most outcomes the meta‐analyses were underpowered to detect the expected treatment effect. Larger, adequately powered studies are needed to confirm these results. As suggested by trial sequential analyses, a further trial of approximately 700 participants with long‐term mortality data may be needed to reach the required information size of 1899 participants based on a relative risk reduction of 35%. Similarly, the number of participants with long‐term follow‐up of LVEF measured by MRI (currently only 25 participants in one study with a low risk of selection bias) falls considerably short of the information size required to detect an improvement in LVEF of 4% (322 participants).
Potential biases in the review process
This systematic review was based on a comprehensive search strategy. We undertook formal tests for publication bias for the primary outcome of mortality and found no evidence of asymmetry, but we accept that the possibility of publication and reporting bias cannot be ruled out completely. There was a risk of small‐study bias, as all included studies were small (as discussed above), which could lead to spurious inflated results.
Risk of bias was present in the included trials, as summarised in Figure 2. We assessed the robustness of results for outcomes that showed evidence of a beneficial effect of cell therapy through sensitivity analyses, restricting analyses to those studies with a low risk of selection, performance, and attrition bias. Our summary of findings and conclusions are based only on those studies with a low risk of selection bias.
The reporting and analysis of multiple outcomes considered in this review could increase the likelihood of observing type I (false positives) or type II (false negatives) random errors due to multiple testing. In order to reduce the chance of observing random errors, we have applied trial sequential analysis to major outcome measures and have reported the information size required to give robust and conclusive findings.
Finally, although the review authors have limited the selection of studies to those administering bone marrow‐derived cells, variation remains in the type of cells utilised among the various clinical trials (e.g. bone marrow mononuclear cells, bone marrow mesenchymal stromal cells), which may be a potential source of bias.
Agreements and disagreements with other studies or reviews
In this Cochrane review update we have focused on the outcomes of mortality and periprocedural adverse events. Our results suggest that cell therapy may reduce the risk of long‐term mortality in people with IHD and congestive HF and that there are no major adverse events associated with the treatment. This is in agreement with the original version of the review, Fisher 2014, and other previous systematic reviews (Fisher 2015b; Wen 2011; Xu 2014). However, our data is discordant with results obtained in systematic reviews and meta‐analysis where cell therapies have been administered to people with AMI (de Jong 2014;Delewi 2014; Fisher 2015a; Gyöngyösi 2015). This suggests that people with chronic IHD or HF, or both may benefit more from such treatments than AMI patients.
The efficacy of cell therapy in reducing LVEF is consistent with the findings of a recent review of 11 systematic reviews of cell therapy, which reported that the mean difference in change from baseline LVEF between treatment groups (random‐effects) ranged from 2.6% to 5.6% across the included systematic reviews, and that meta‐analytical results were broadly similar irrespective of how follow‐up was defined and which patient population was studied (Harvey 2015). However, in a recent trial sequential analysis of HF trials (Fisher 2016), no difference in LVEF was observed between treatment arms, and the available evidence led us to reject the hypothesis of a mean difference in change from baseline LVEF of 4% between treatment arms in this patient cohort.
These apparently conflicting results are certainly intriguing. Could the effect of cell therapy be reduced in the presence of co‐interventions? Of the eight trials included in the trial sequential analysis of LVEF (Fisher 2016), all but two (accounting for over 70% of the analysed participants) administered co‐interventions (CABG: 4 trials, PCI: 1 trial, shockwave: 1 trial), whereas in the current review, these co‐interventions were only administered in 11 out of 39 studies (28.5% of participants). Meta‐analyses of people with HF with no option for revascularisation and refractory angina have reported significantly improved LVEF associated with cell therapy (Fisher 2013; Khan 2016). Here, we found no evidence for subgroup differences in the effect of cell therapy on outcomes between studies that administered co‐interventions and those that did not, although the subgroup analyses here were considerably underpowered, and it is worth noting that the estimated effect size for both mortality and LVEF was smaller in participants who had received co‐interventions. We regard this possible explanation as hypothesis‐generating, and potential differences in the efficacy of cell therapy between studies that administer co‐interventions and those that do not should be considered in the design of future trials and systematic reviews.
Limitations of the review
Our conclusions are based on evidence that is of low quality due to the lack of precision for the majority of reported outcomes and possible small‐study bias, as well as risk of bias due to lack of blinding, high levels of attrition, and commercially funded trials. The information size derived from trial sequential analyses for key outcomes showed that meta‐analyses are currently considerably underpowered, and further large randomised trials are needed before findings can been considered to be robust and conclusive.
The aim of this review was to assess the effect of cell therapies on main clinical outcomes, because these are less likely to be affected by risk of performance bias (blinding). We have assessed all‐cause mortality. Our predefined outcomes did not include cardiac‐related mortality; this will be considered as an outcome in future updates of the review.
We have summarised any periprocedural adverse events reported in individual studies descriptively and concluded that serious periprocedural adverse events are rare. A formal assessment of cumulative adverse events related to cell therapy, both periprocedurally and over long‐term follow‐up, is beyond the scope of this review.
In summary, the results of this review may be clinically relevant, but the evidence for the reduction in the number of deaths with cell treatment relative to controls needs to be confirmed in larger clinical trials. To this end, the first Phase II/III and Phase III clinical trials for severe IHD (NCT00362388; NCT00747708; NCT01727063), HF (NCT01768702), and refractory angina are currently ongoing (NCT01508910). Research should also focus on a better understanding of the best types of cells to use and why some people respond to treatment and others do not.

PRISMA flow diagram.

Risk of bias summary: review authors' judgements about each risk of bias item for each included study.
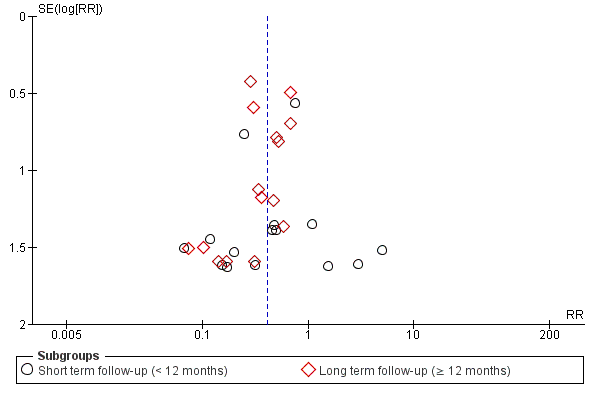
Funnel plot of comparison: 1 Stem cells versus no stem cells, outcome: 1.1 Mortality.
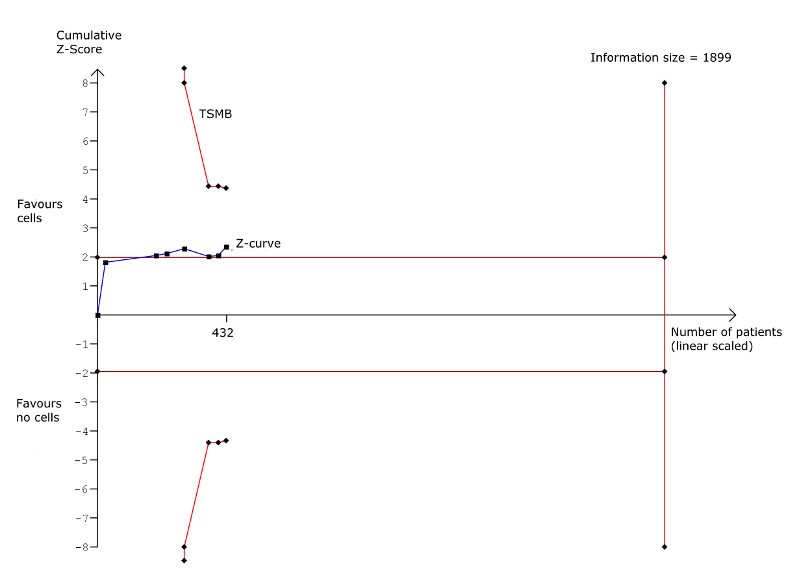
Trial sequential analysis: Mortality at long‐term follow‐up (≥ 12 months). TSMB = trial sequential monitoring boundary; horizontal red lines indicate conventional significance threshold.

Trial sequential analysis: Non‐fatal myocardial infarction at long‐term follow‐up (≥ 12 months). TSMB = trial sequential monitoring boundary; horizontal red lines indicate conventional significance threshold.

Trial sequential analysis: Rehospitalisation due to heart failure at long‐term follow‐up (≥ 12 months). TSMB = trial sequential monitoring boundary; horizontal red lines indicate conventional significance threshold.

Trial sequential analysis: Arrhythmias at long‐term follow‐up (≥ 12 months). TSMB = trial sequential monitoring boundary; horizontal red lines indicate conventional significance threshold.

Trial sequential analysis: Composite MACE at long‐term follow‐up (≥ 12 months). TSMB = trial sequential monitoring boundary; horizontal red lines indicate conventional significance threshold.

Trial sequential analysis: Left ventricular ejection fraction measured by MRI at long‐term follow‐up (≥ 12 months). TSMB = trial sequential monitoring boundary; horizontal red lines indicate conventional significance threshold.
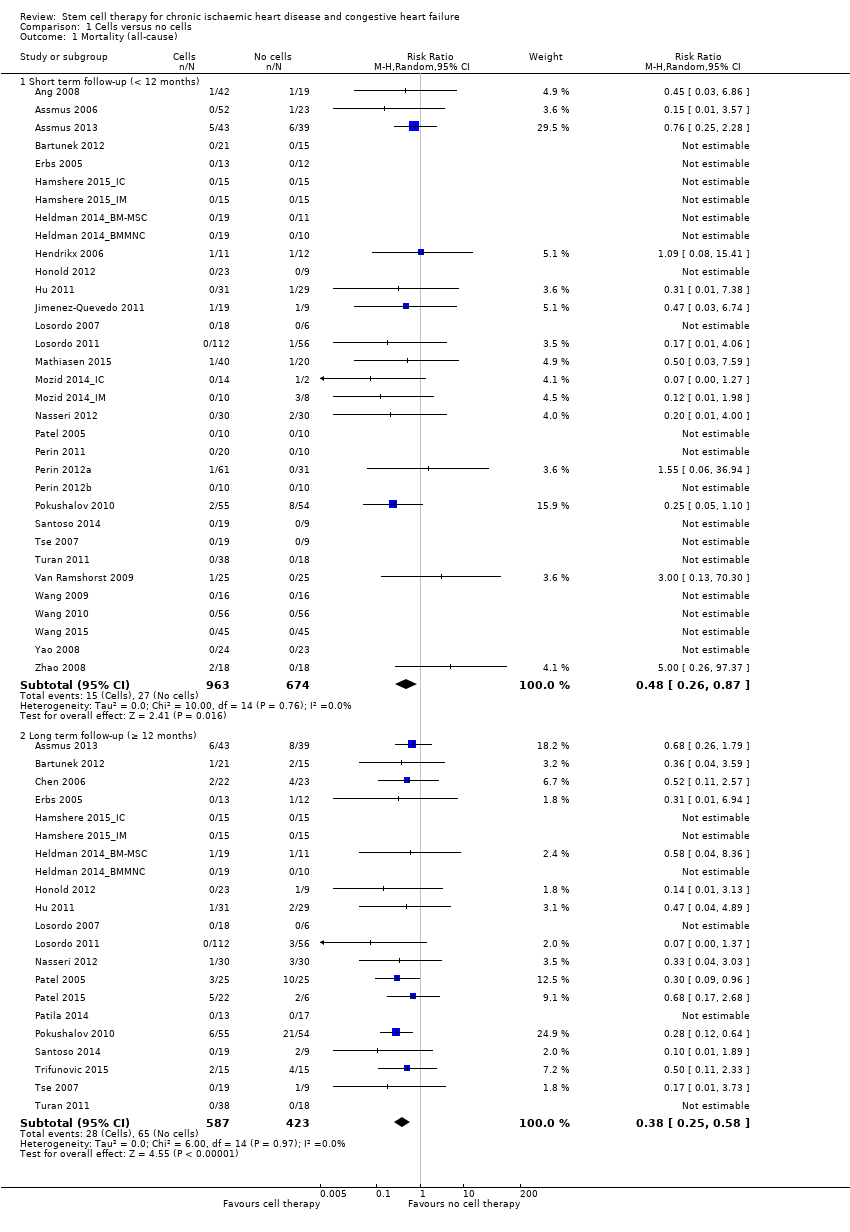
Comparison 1 Cells versus no cells, Outcome 1 Mortality (all‐cause).
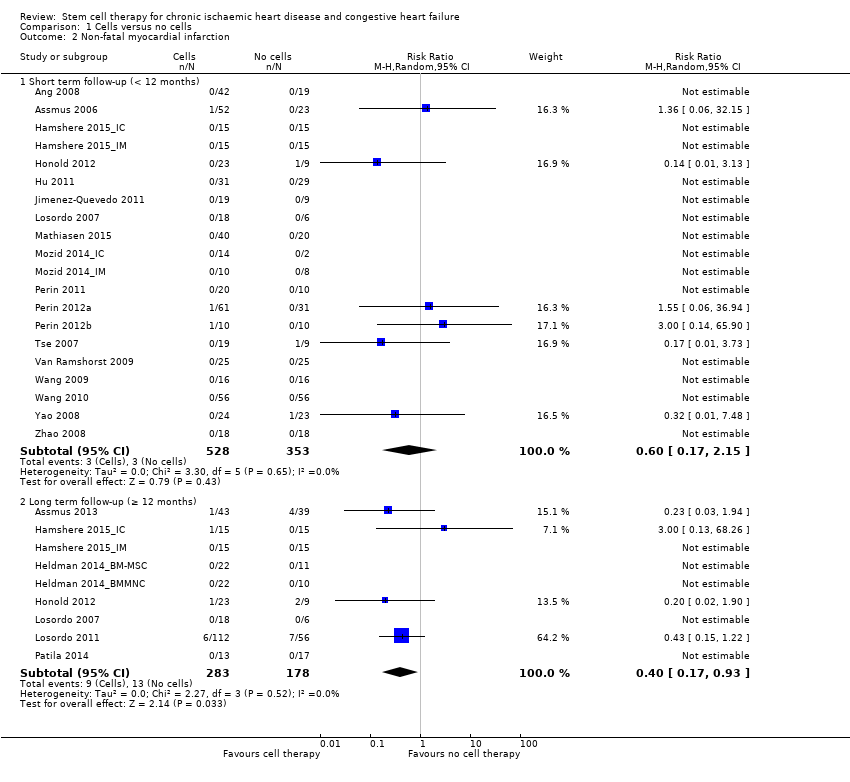
Comparison 1 Cells versus no cells, Outcome 2 Non‐fatal myocardial infarction.

Comparison 1 Cells versus no cells, Outcome 3 Rehospitalisation due to heart failure.

Comparison 1 Cells versus no cells, Outcome 4 Arrhythmias.

Comparison 1 Cells versus no cells, Outcome 5 Composite MACE.
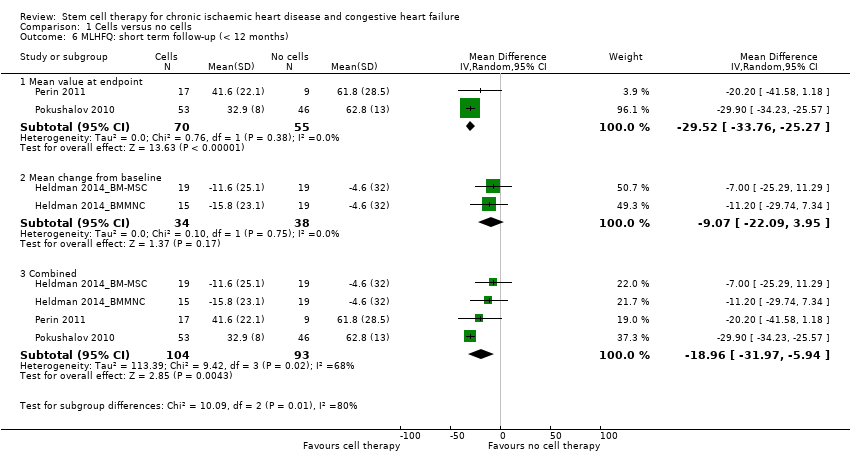
Comparison 1 Cells versus no cells, Outcome 6 MLHFQ: short term follow‐up (< 12 months).

Comparison 1 Cells versus no cells, Outcome 7 MLHFQ: long term follow‐up (≥ 12 months).

Comparison 1 Cells versus no cells, Outcome 8 Seattle Angina Questionnaire: short term follow‐up (< 12 months).

Comparison 1 Cells versus no cells, Outcome 9 Angina episodes per week: short term follow‐up (< 12 months).
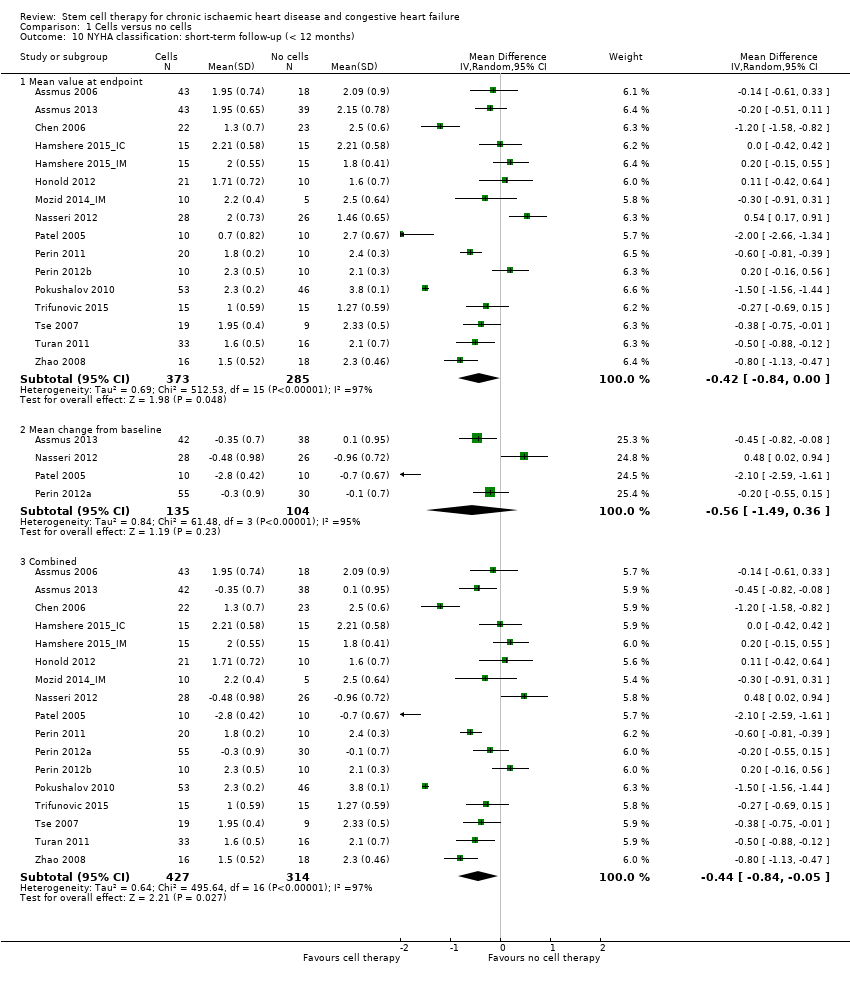
Comparison 1 Cells versus no cells, Outcome 10 NYHA classification: short‐term follow‐up (< 12 months).

Comparison 1 Cells versus no cells, Outcome 11 NYHA classification: long term follow‐up (≥ 12 months).
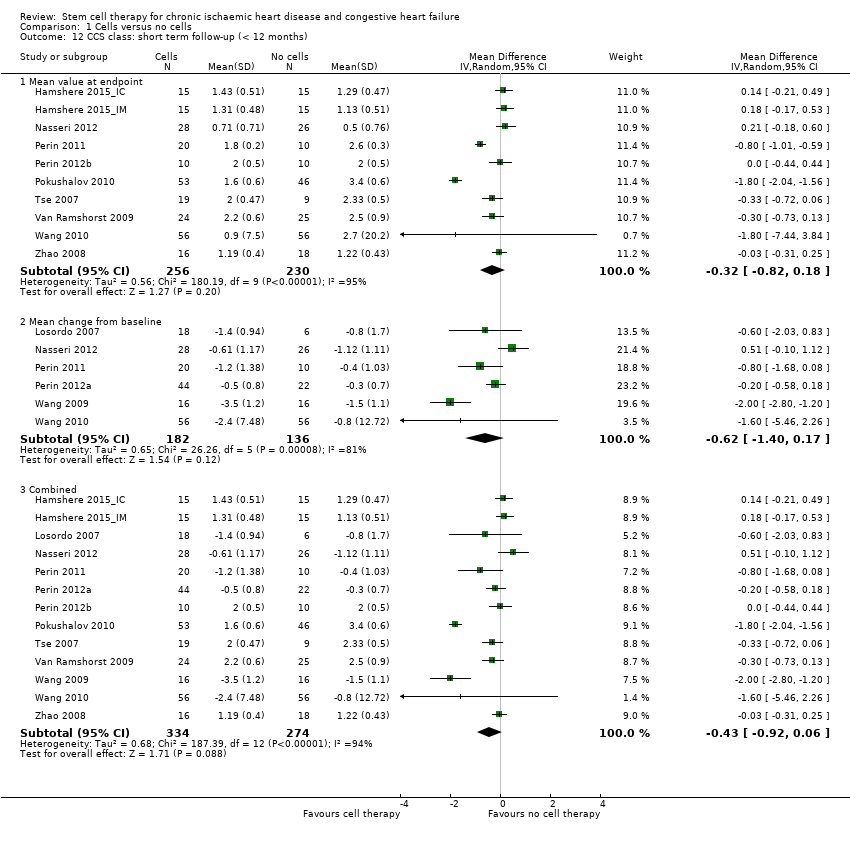
Comparison 1 Cells versus no cells, Outcome 12 CCS class: short term follow‐up (< 12 months).
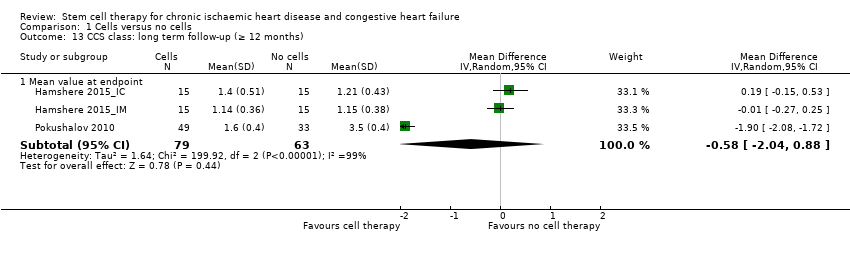
Comparison 1 Cells versus no cells, Outcome 13 CCS class: long term follow‐up (≥ 12 months).

Comparison 1 Cells versus no cells, Outcome 14 Exercise capacity: short term follow‐up (< 12 months).

Comparison 1 Cells versus no cells, Outcome 15 Exercise capacity: long term follow‐up (≥ 12 months).

Comparison 1 Cells versus no cells, Outcome 16 LVEF (%) measured by MRI: short term follow‐up (< 12 months).

Comparison 1 Cells versus no cells, Outcome 17 LVEF (%) measured by MRI: long term follow‐up (≥ 12 months).

Comparison 1 Cells versus no cells, Outcome 18 LVEF (%) measured by echocardiography: short term follow‐up (< 12 months).
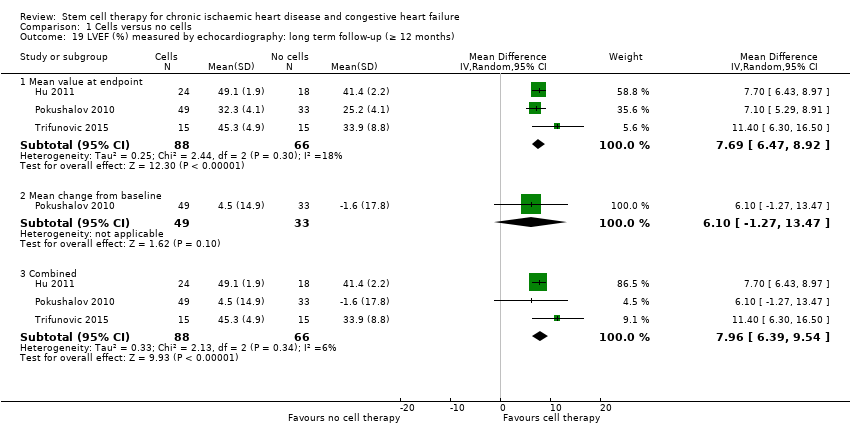
Comparison 1 Cells versus no cells, Outcome 19 LVEF (%) measured by echocardiography: long term follow‐up (≥ 12 months).

Comparison 1 Cells versus no cells, Outcome 20 LVEF (%) measured by SPECT: short term follow‐up (< 12 months).
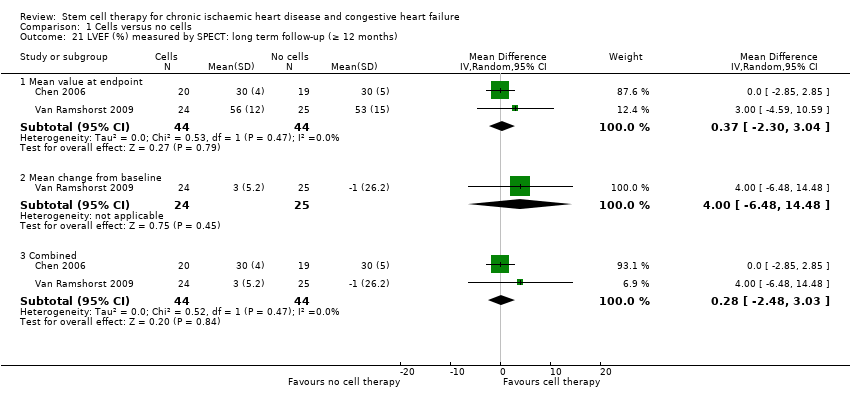
Comparison 1 Cells versus no cells, Outcome 21 LVEF (%) measured by SPECT: long term follow‐up (≥ 12 months).
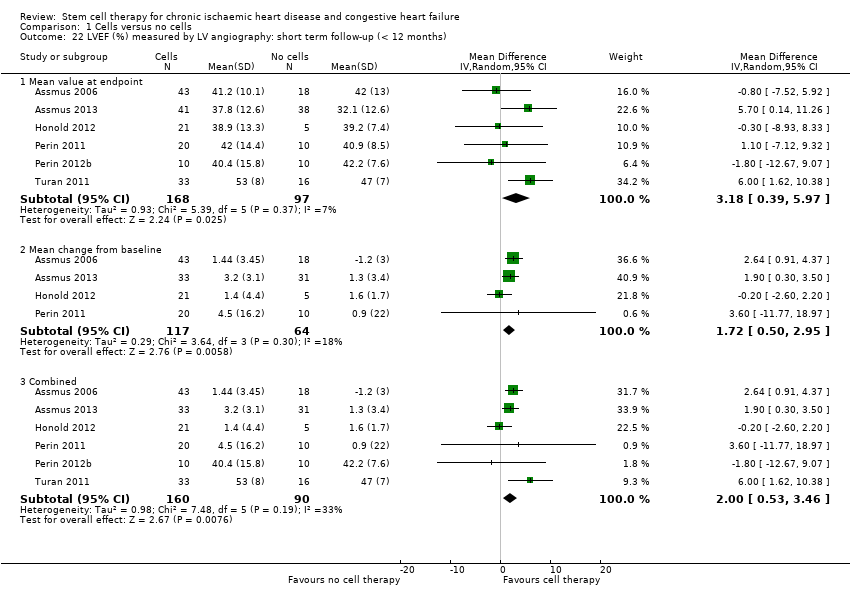
Comparison 1 Cells versus no cells, Outcome 22 LVEF (%) measured by LV angiography: short term follow‐up (< 12 months).
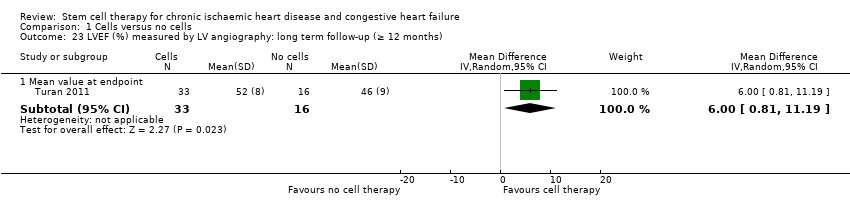
Comparison 1 Cells versus no cells, Outcome 23 LVEF (%) measured by LV angiography: long term follow‐up (≥ 12 months).
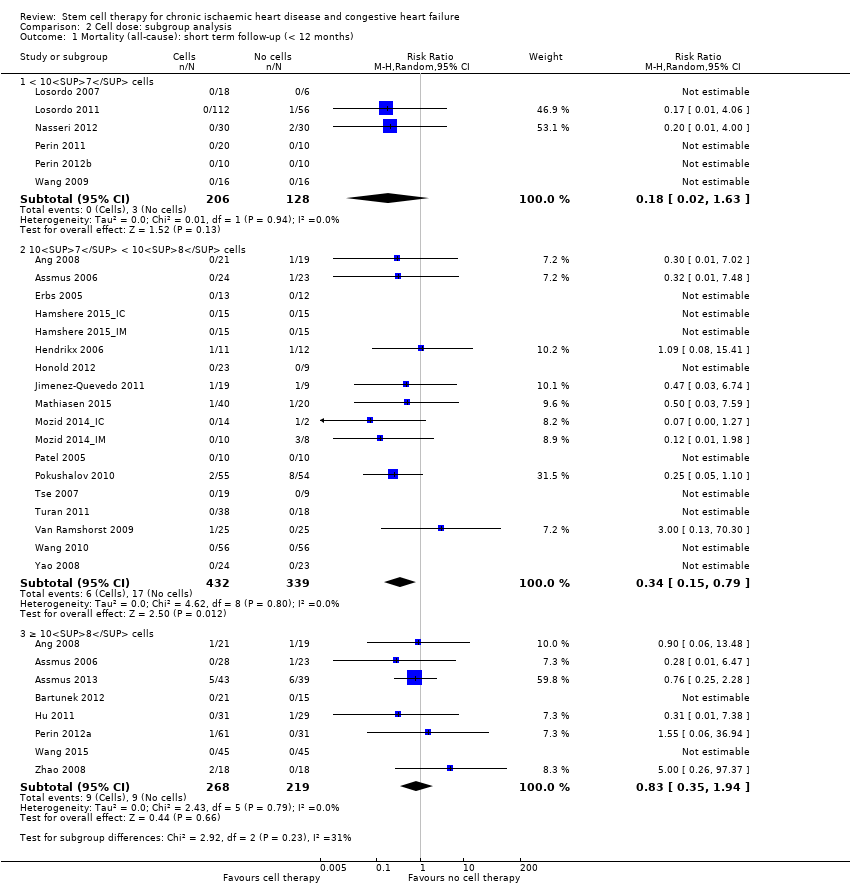
Comparison 2 Cell dose: subgroup analysis, Outcome 1 Mortality (all‐cause): short term follow‐up (< 12 months).

Comparison 2 Cell dose: subgroup analysis, Outcome 2 Mortality (all‐cause): long term follow‐up (≥ 12 months).

Comparison 2 Cell dose: subgroup analysis, Outcome 3 NYHA classification: short term follow‐up (< 12 months).
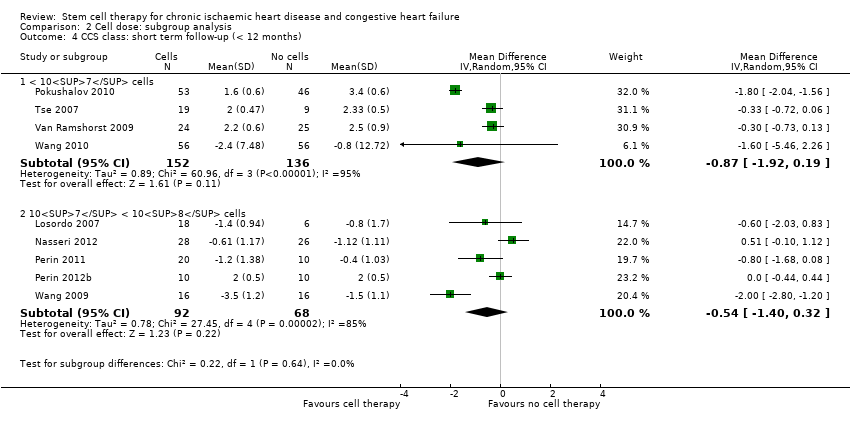
Comparison 2 Cell dose: subgroup analysis, Outcome 4 CCS class: short term follow‐up (< 12 months).

Comparison 2 Cell dose: subgroup analysis, Outcome 5 Exercise capacity: short term follow‐up (< 12 months).

Comparison 2 Cell dose: subgroup analysis, Outcome 6 LVEF (%) measured by MRI: short term follow‐up (< 12 months).

Comparison 3 Baseline cardiac function: subgroup analysis, Outcome 1 Mortality (all‐cause): short term follow‐up (< 12 months).

Comparison 3 Baseline cardiac function: subgroup analysis, Outcome 2 Mortality (all‐cause): long term follow‐up (≥ 12 months).

Comparison 3 Baseline cardiac function: subgroup analysis, Outcome 3 NYHA classification: short term follow‐up (< 12 months).

Comparison 3 Baseline cardiac function: subgroup analysis, Outcome 4 NYHA classification: long term follow‐up (≥ 12 months).

Comparison 3 Baseline cardiac function: subgroup analysis, Outcome 5 CCS class: short term follow‐up (< 12 months).
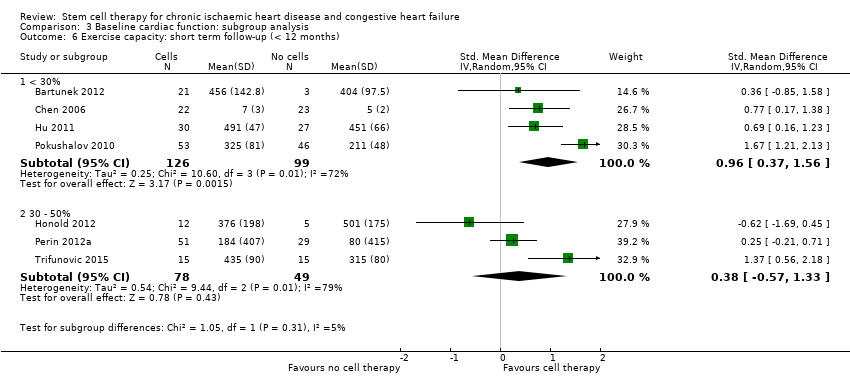
Comparison 3 Baseline cardiac function: subgroup analysis, Outcome 6 Exercise capacity: short term follow‐up (< 12 months).

Comparison 3 Baseline cardiac function: subgroup analysis, Outcome 7 LVEF (%) measured by MRI: short term follow‐up (< 12 months).
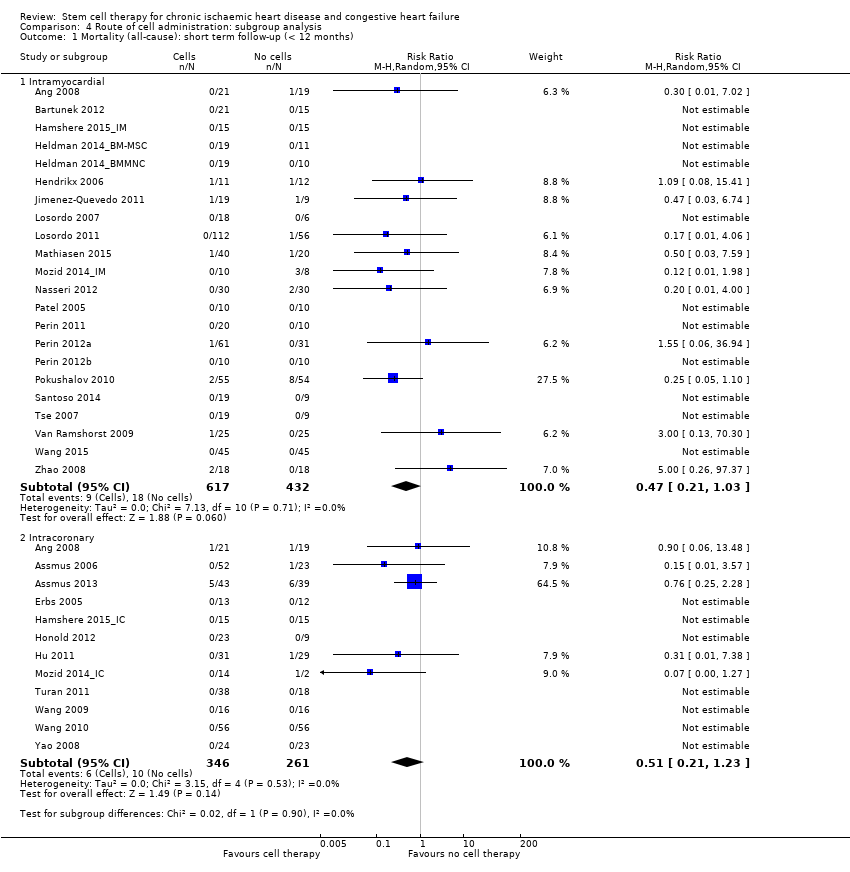
Comparison 4 Route of cell administration: subgroup analysis, Outcome 1 Mortality (all‐cause): short term follow‐up (< 12 months).

Comparison 4 Route of cell administration: subgroup analysis, Outcome 2 Mortality (all‐cause): long term follow‐up (≥ 12 months).
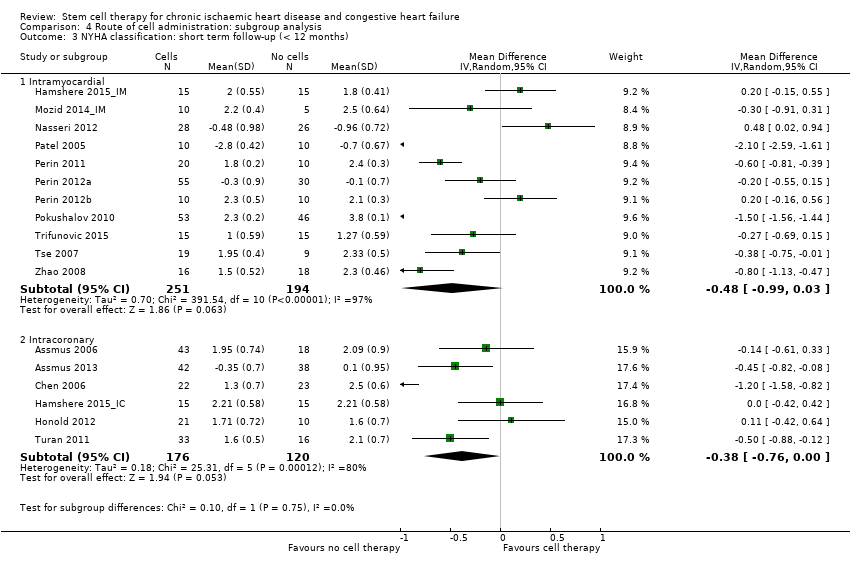
Comparison 4 Route of cell administration: subgroup analysis, Outcome 3 NYHA classification: short term follow‐up (< 12 months).
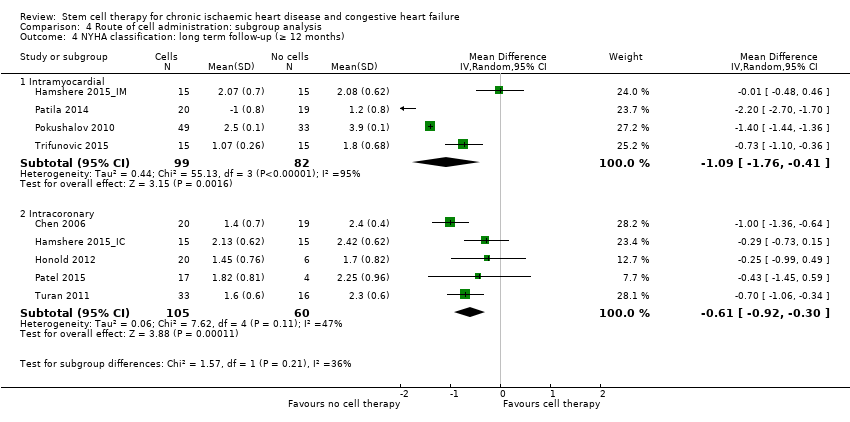
Comparison 4 Route of cell administration: subgroup analysis, Outcome 4 NYHA classification: long term follow‐up (≥ 12 months).

Comparison 4 Route of cell administration: subgroup analysis, Outcome 5 CCS class: short term follow‐up (< 12 months).
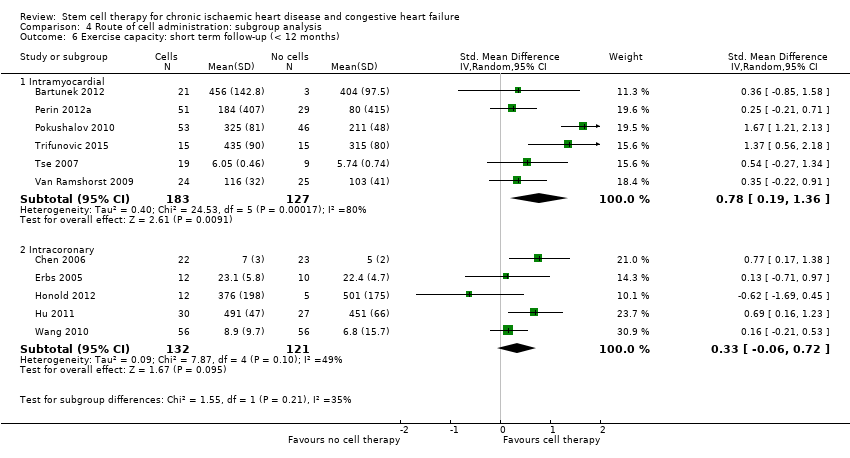
Comparison 4 Route of cell administration: subgroup analysis, Outcome 6 Exercise capacity: short term follow‐up (< 12 months).

Comparison 4 Route of cell administration: subgroup analysis, Outcome 7 LVEF (%) measured by MRI: short term follow‐up (< 12 months).

Comparison 5 Cell type: subgroup analysis, Outcome 1 Mortality (all‐cause): short term follow‐up (< 12 months).

Comparison 5 Cell type: subgroup analysis, Outcome 2 Mortality (all‐cause): long term follow‐up (≥ 12 months).
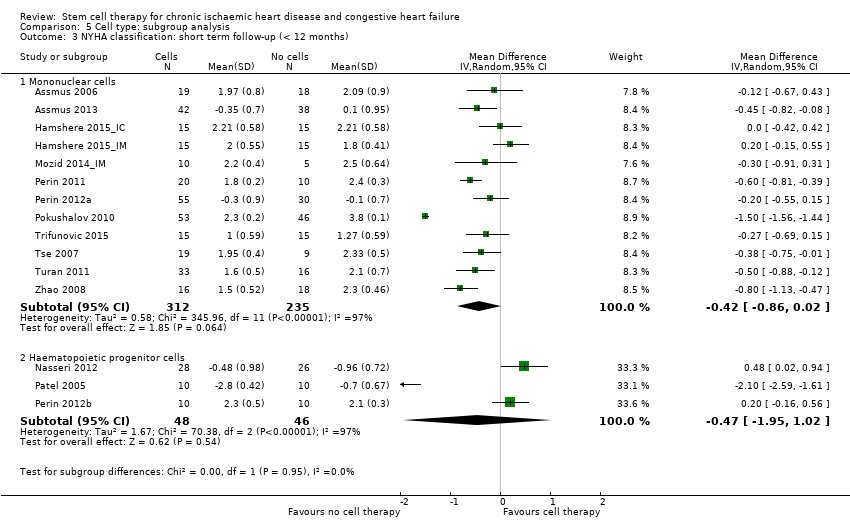
Comparison 5 Cell type: subgroup analysis, Outcome 3 NYHA classification: short term follow‐up (< 12 months).
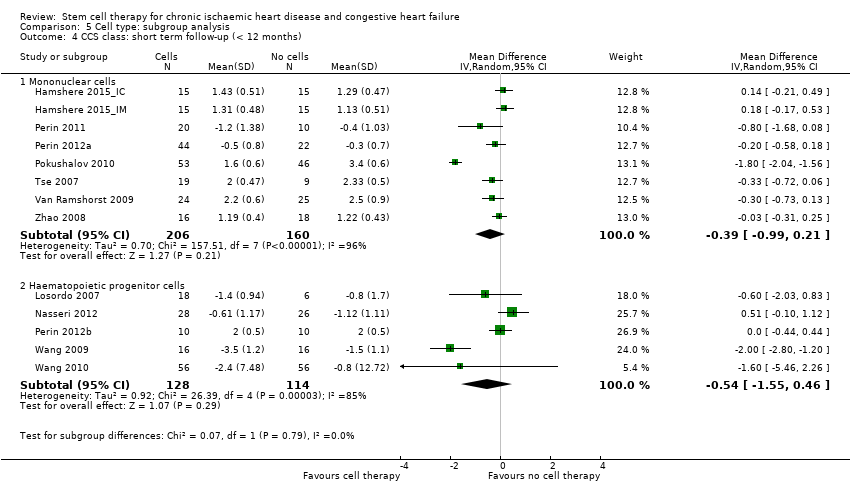
Comparison 5 Cell type: subgroup analysis, Outcome 4 CCS class: short term follow‐up (< 12 months).

Comparison 6 Participant diagnosis: subgroup analysis, Outcome 1 Mortality (all‐cause): short term follow‐up (< 12 months).

Comparison 6 Participant diagnosis: subgroup analysis, Outcome 2 Mortality (all‐cause): long term follow‐up (≥ 12 months).
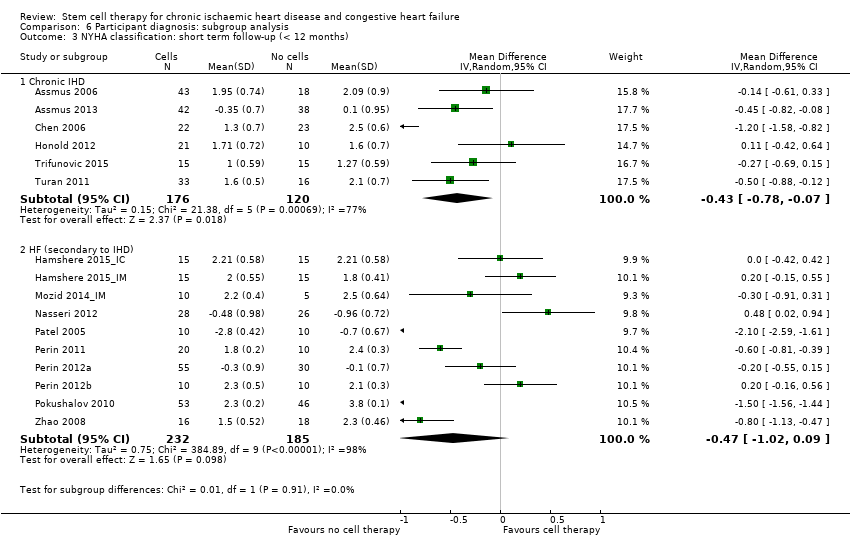
Comparison 6 Participant diagnosis: subgroup analysis, Outcome 3 NYHA classification: short term follow‐up (< 12 months).

Comparison 6 Participant diagnosis: subgroup analysis, Outcome 4 NYHA classification: long term follow‐up (≥ 12 months).

Comparison 6 Participant diagnosis: subgroup analysis, Outcome 5 CCS class: short term follow‐up (< 12 months).
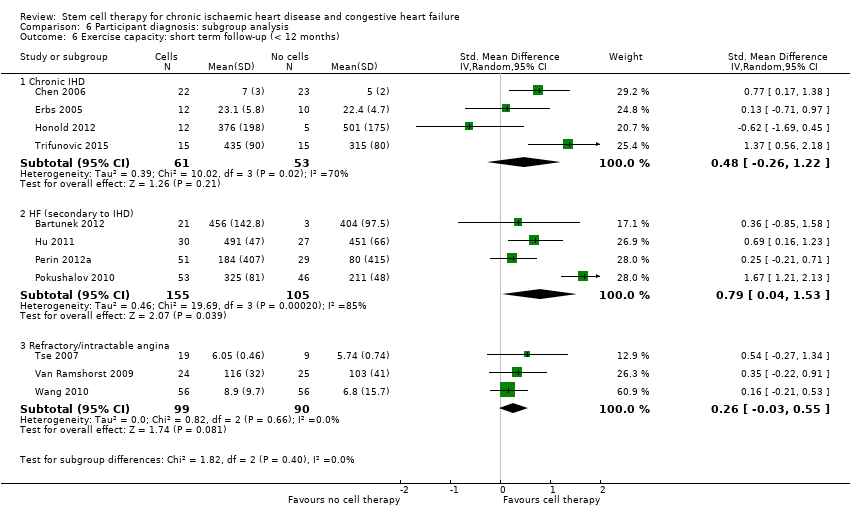
Comparison 6 Participant diagnosis: subgroup analysis, Outcome 6 Exercise capacity: short term follow‐up (< 12 months).
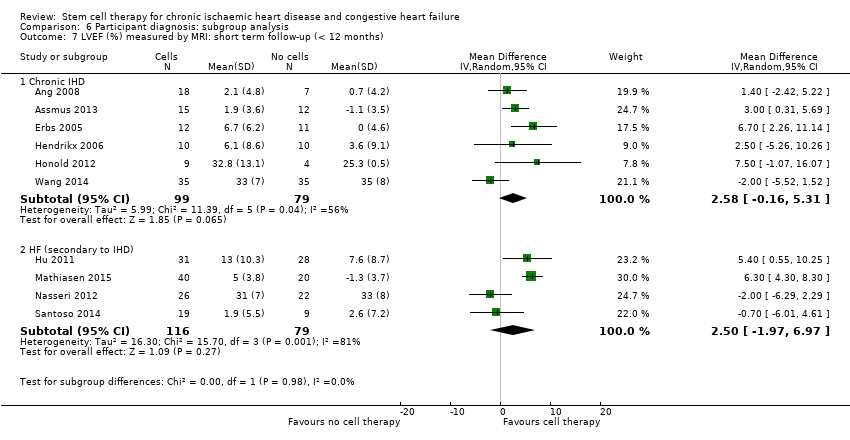
Comparison 6 Participant diagnosis: subgroup analysis, Outcome 7 LVEF (%) measured by MRI: short term follow‐up (< 12 months).
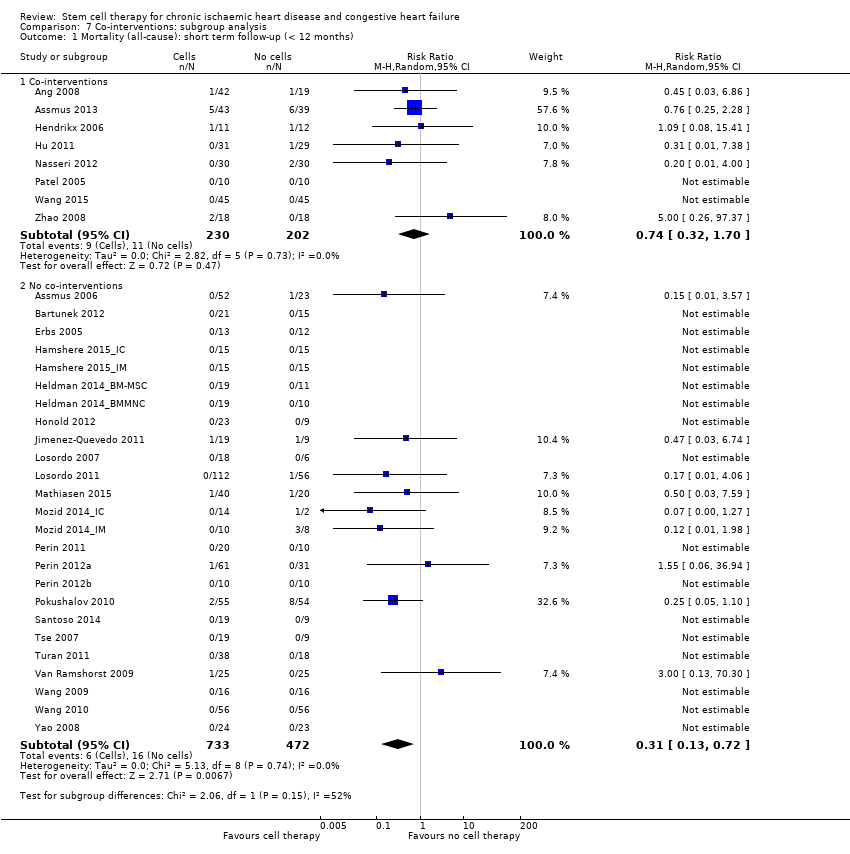
Comparison 7 Co‐interventions: subgroup analysis, Outcome 1 Mortality (all‐cause): short term follow‐up (< 12 months).

Comparison 7 Co‐interventions: subgroup analysis, Outcome 2 Mortality (all‐cause): long term follow‐up (≥ 12 months).

Comparison 7 Co‐interventions: subgroup analysis, Outcome 3 NYHA classification: short term follow‐up (< 12 months).
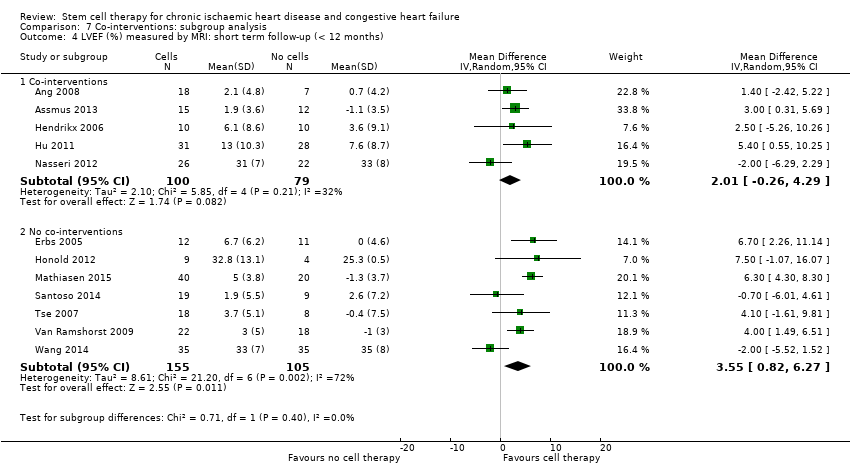
Comparison 7 Co‐interventions: subgroup analysis, Outcome 4 LVEF (%) measured by MRI: short term follow‐up (< 12 months).

Comparison 8 Sensitivity analysis: excluding studies with high/unclear risk of selection bias, Outcome 1 Mortality (all‐cause).
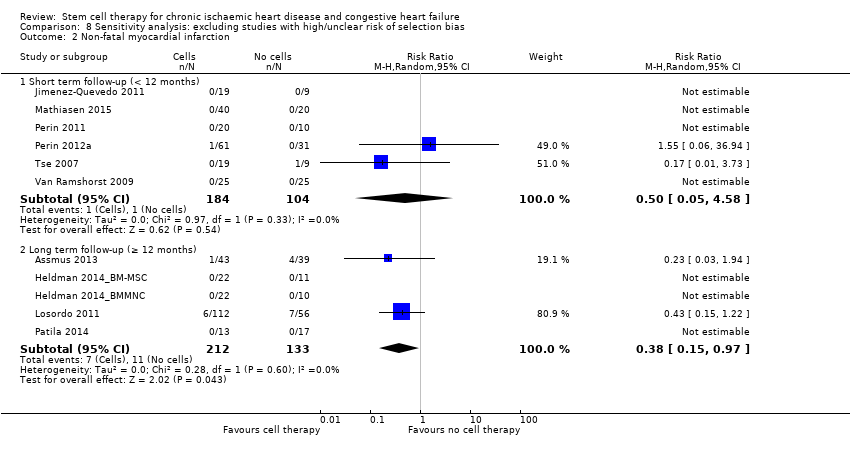
Comparison 8 Sensitivity analysis: excluding studies with high/unclear risk of selection bias, Outcome 2 Non‐fatal myocardial infarction.
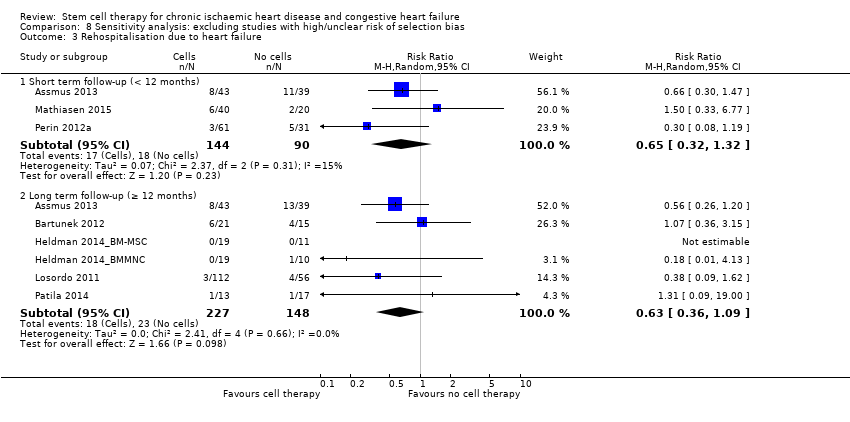
Comparison 8 Sensitivity analysis: excluding studies with high/unclear risk of selection bias, Outcome 3 Rehospitalisation due to heart failure.
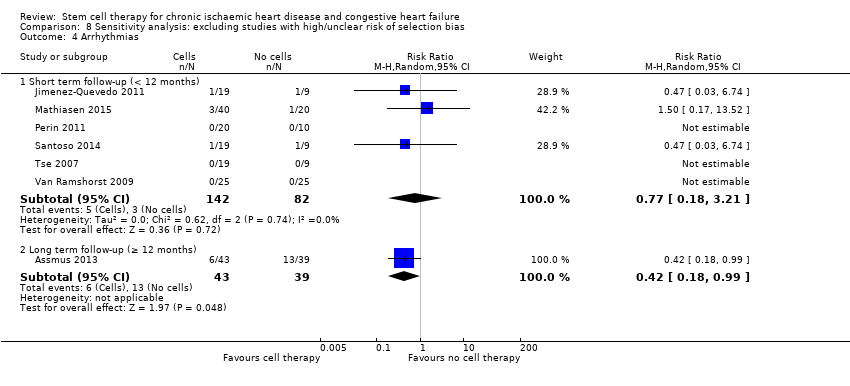
Comparison 8 Sensitivity analysis: excluding studies with high/unclear risk of selection bias, Outcome 4 Arrhythmias.

Comparison 8 Sensitivity analysis: excluding studies with high/unclear risk of selection bias, Outcome 5 Composite MACE.

Comparison 8 Sensitivity analysis: excluding studies with high/unclear risk of selection bias, Outcome 6 NYHA classification: short term follow‐up (< 12 months).
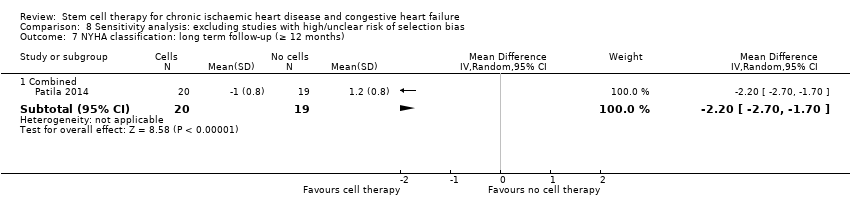
Comparison 8 Sensitivity analysis: excluding studies with high/unclear risk of selection bias, Outcome 7 NYHA classification: long term follow‐up (≥ 12 months).

Comparison 8 Sensitivity analysis: excluding studies with high/unclear risk of selection bias, Outcome 8 LVEF (%) measured by MRI: short term follow‐up (< 12 months).

Comparison 8 Sensitivity analysis: excluding studies with high/unclear risk of selection bias, Outcome 9 LVEF (%) measured by MRI: long term follow‐up (≥ 12 months).

Comparison 9 Sensitivity analysis: excluding studies with high/unclear risk of performance bias, Outcome 1 Mortality (all‐cause).
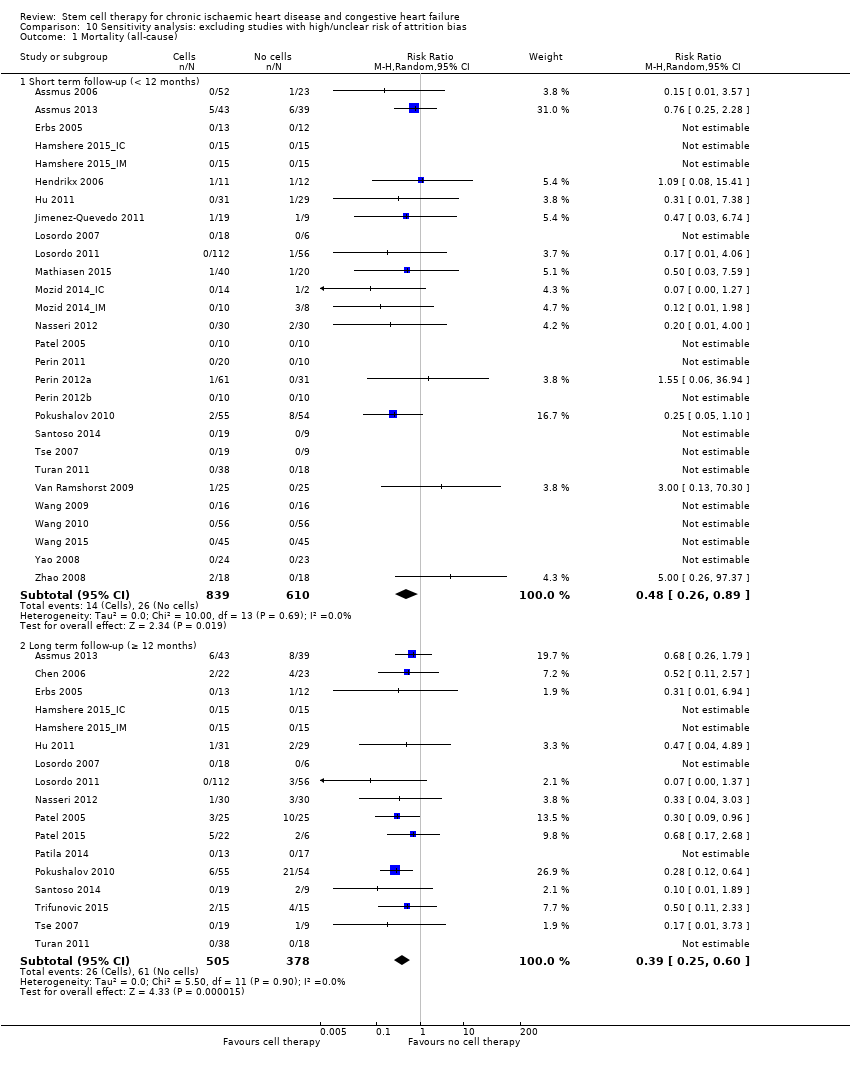
Comparison 10 Sensitivity analysis: excluding studies with high/unclear risk of attrition bias, Outcome 1 Mortality (all‐cause).
| Bone marrow‐derived cell therapy for people with chronic ischaemic heart disease and congestive heart failure | ||||||
| Patient or population: people with chronic ischaemic heart disease and congestive heart failure Comparison: no cell therapy | ||||||
| Outcomes | Illustrative comparative risks* (95% CI) | Relative effect | No of Participants | Quality of the evidence | Comments | |
| Assumed risk | Corresponding risk | |||||
| No cell therapy | Bone marrow‐derived cell therapy | |||||
| Mortality (all cause) Long‐term follow‐up (≥ 12 months) | 102 per 1000 | 43 per 1000 | RR 0.42 | 491 | ⊕⊕⊝⊝ | The required information size of 1899 participants to detect a RRR of 35% has not been reached. |
| Periprocedural adverse events | See comment | See comment | Not estimable | 1695 (34 studies) | See comment | Adverse events occurring during the mapping or cell/placebo injection procedure included ventricular tachycardia (7), ventricular fibrillation (1), atrial fibrillation (1), transient complete heart block (1), transient pulmonary oedema (3), thrombus on mapping catheter tip (1), visual disturbances (2), myocardial perforation (2), limited retrograde catheter‐related dissection of the abdominal aorta (1). |
| Non‐fatal myocardial infarction Long‐term follow‐up (≥ 12 months) | 83 per 1000 | 31 per 1000 | RR 0.38 | 345 | ⊕⊕⊝⊝ | The required information size of 2383 participants to detect a RRR of 35% has not been reached. |
| Rehospitalisation due to heart failure Long‐term follow‐up (≥ 12 months) | 155 per 1000 | 98 per 1000 | RR 0.63 | 375 | ⊕⊕⊝⊝ | The required information size of 1193 participants to detect a RRR of 35% has not been reached. |
| Arrhythmias Long‐term follow‐up (≥ 12 months) | 333 per 1000 | 140 per 1000 | RR 0.42 | 82 | ⊕⊕⊝⊝ | The required information size of 461 participants to detect a RRR of 35% has not been reached. |
| Composite MACE Long‐term follow‐up (≥ 12 months) | 350 per 1000 | 224 per 1000 | RR 0.64 | 141 | ⊕⊕⊝⊝ | The required information size of 431 participants to detect a RRR of 35% has not been reached. |
| LVEF (%) measured by MRI Long‐term follow‐up (≥ 12 months) | ‐ | The mean LVEF (%) measured by MRI in the intervention groups was 1.6 lower (8.7 lower to 5.5 higher). | ‐ | 25 | ⊕⊕⊝⊝ | The required information size of 322 participants to detect a mean difference of 4% has not been reached. |
| *The risk in the intervention group (and its 95% confidence interval) is based on the assumed risk in the comparison group and the relative effect of the intervention (and its 95% CI). ¶Only studies with a low risk of selection bias are included. | ||||||
| GRADE Working Group grades of evidence | ||||||
| 1Six trials received full or partial commercial funding, which could have resulted in a biased assessment of the intervention effect and were therefore deemed to have a high risk of bias. One trial was not blinded (high risk of performance bias) and had a high risk of attrition bias. | ||||||
| Study ID | Country of study | Patient population | Mean (SD) age of participants (years) | % Male | No. randomised participants receiving intervention | No. randomised participants receiving comparator | Mean duration of follow‐up |
| UK | CIHD (> 1 chronic myocardial scar; elective CABG) | BMMNC‐IM: 64.7 (8.7) BMMNC‐IC: 62.1 (8.7) Controls: 61.3 (8.3) | BMMNC‐IM: 71.4% BMMNC‐IC: 90.5% Controls: 90.0% | 42 (21 IM, 21 IC) | 21 | 6 months | |
| Germany | CIHD (MI > 3 months; LV dysfunction) | BMMNC: 59 (12) CPC: 54 (12) Controls: 61 (9) | BMMNC: 89% CPC: 79% Controls: 100% | 52 (28 MNC, 24 CPC) | 23 | 3 months | |
| Germany | CIHD (MI > 3 months; LVEF < 50%; NYHA class II or greater) | BMMNC‐LDSW: 65 (12) BMMNC‐HDSW: 58 (11) Controls‐LDSW: 60 (10) Controls‐HDSW: 63 (10) | BMMNC‐LDSW: 77% BMMNC‐HDSW: 86% Controls‐LDSW: 80% Controls‐HDSW: 90% | 43 (22 LDSW, 21 HDSW) | 39 (20 LDSW, 19 HDSW) | 45.7 (17) months | |
| Belgium/ Serbia/ Switzerland | HF (LVEF 15% to 40%; ischaemic event > 2 months) | BM‐MSC: 55.3 (SE 10.4) Controls: 58.7 (SE 8.2) | BM‐MSC: 90.5% Controls: 86.7% | 32 | 15 | 24 months | |
| China | CIHD (isolated, chronic LAD; LVEF < 40%) | BM‐MSC: 59.3 (6.8) Controls: 57.8 (7.2) | BM‐MSC: 88% Controls: 92% | 24 | 24 | 12 months | |
| Germany | CIHD (chronic total occlusion; myocardial ischaemia) | CPC: 63 (7) Controls: 61 (9) | CPC: 71% Controls: 86% | 14 | 14 | 15 months | |
| UK | HF (NYHA class II‐IV; no revascularisation options) | BMMNC: n/r Controls: n/r | BMMNC: n/r Controls: n/r | 15 | 15 | 12 months | |
| UK | HF (NYHA class II‐IV; no revascularisation options) | BMMNC: n/r Controls: n/r | BMMNC: n/r Controls: n/r | 15 | 15 | 12 months | |
| USA | CIHD (chronic MI; LV dysfunction) | BMMNC: 61.1 (8.4) Controls: 61.3 (9.0) | BMMNC: 89.5% Controls: 100% | 22 | 10 | 12 months | |
| USA | CIHD (chronic MI; LV dysfunction) | BM‐MSC: 57.1 (10.6) Controls: 60.0 (12.0) | BM‐MSC: 94.7% Controls: 90.9% | 22 | 11 | 12 months | |
| Belgium | CIHD (transmural MI; LV dysfunction; elective CABG) | BMMNC: 63.2 (8.5) Controls: 66.8 (9.2) | BMMNC: 100% Controls: 70% | 11 | 12 | 4 months | |
| Germany | CIHD (MI > 3 months; LV regional wall motion abnormality) | CPC: 53.4 (12.3) Controls: 58.8 (7.3) | CPC: 82% Controls: 100% | 23 | 10 | 60 months | |
| China | HF (MI > 3 months; LVEF < 30%; elective CABG) | BMMNC: 56.6 (9.7) Controls: 58.3 (8.9) | BMMNC: 88% Controls: 96% | 31 | 29 | 12 months | |
| Spain | Refractory angina (CCS class II‐IV) | CD133+: median 70.0 Controls: median 58.2 | CD133+: 78.9% Controls: 100% | 19 | 9 | 6 months | |
| USA | Refractory angina (CCS class III‐IV) | CD34+/controls pooled: 62.4 (range 48 to 84) | CD34+/controls pooled: 80% | 18 (6 LD, 6 MD 6, HD) | 6 | 6 months | |
| USA | Refractory angina (CCS class III‐IV) | CD34+/LD: 61.3 (9.1) CD34+/HD: 59.8 (9.2) Controls: 61.8 (8.5) | CD34+/LD: 83.6% CD34+/HD: 87.5% Controls: 89.3% | 112 (56 LD, 56 HD) | 56 | 12 months | |
| Denmark | HF (NYHA class II‐III; LVEF < 45%; no revascularisation options) | BM‐MSC: 66.1 (7.7) Controls: 64.2 (10.6) | BM‐MSC: 90% Controls: 70% | 40 | 20 | 6 months | |
| UK | HF (NYHA class II‐IV; no revascularisation options) | BMMNC/controls pooled (16 participants): 70 (10) | BMMNC/controls pooled (16 participants): 94% | 14 | 2 | 6 months | |
| UK | HF (NYHA class II‐IV; no revascularisation options) | BMMNC/controls pooled (18 participants): 64 (9) | BMMNC/controls pooled (18 participants): 100% | 10 | 8 | 6 months | |
| Germany | HF (LVEF < 35%; elective CABG) | CD133+: 61.9 (7.3) Controls: 62.7 (10.6) | CD133+: 93% Controls: 97% | 30 | 30 | 6 months | |
| Argentina | HF (LVEF < 35%; NYHA class III‐IV; elective CABG) | CD34+: 64.8 (7.1) Controls: 63.6 (5.2) | CD34+: 80% Controls: 80% | 25 | 25 | 10 years | |
| USA/Germany/India | HF (LVEF < 40%; NYHA class III‐IV) | BMAC: 58.5 (12.7) Controls: 52.7 (8.5) | BMAC: 91.7% Controls: 100% | 24 | 6 | 12 months | |
| Finland | HF (LVEF 15% to 40%; NYHA class II‐IV; elective CABG) | BMMNC: median 65 (range 57 to 73) Controls: median 64 (range 58 to 70) | BMMNC: 94.7% Controls: 95.0% | 20 | 19 | 12 months | |
| USA | HF (angina/HF symptoms; chronic CAD; LVEF < 40%; no revascularisation options) | BMMNC: 56.3 (8.6) Controls: 60.5 (6.4) | BMMNC: 50% Controls: 80% | 20 | 10 | 6 months | |
| USA | HF (CCS class II‐IV or NYHA class II‐III, or both; LVEF < 45%; no revascularisation options) | BMMNC: 64.0 (10.9) Controls: 62.3 (8.3) | BMMNC: 86.9% Controls: 93.7% | 61 | 31 | 6 months | |
| USA | HF (CCS class II‐IV or NYHA class II‐III, or both; LVEF < 45%; no revascularisation options) | ALDH+: 58.2 (6.1) Controls: 57.8 (5.5) | ALDH+: 90% Controls: 80% | 10 | 10 | 6 months | |
| Russia | HF (LVEF < 35%; no revascularisation options) | BMMNC: 61 (9) Controls: 62 (5) | BMMNC: 87% Controls: 85% | 55 | 54 | 12 months | |
| Indonesia/China | HF (NYHA class III‐IV; LVEF < 40%; no revascularisation options) | BMMNC: 58 (5.9) Controls: 60 (5.6) | BMMNC: 95% Controls: 100% | 19 | 9 | 6 months | |
| Serbia | CIHD (MI < 30 days; LVEF < 40%; NYHA class III‐IV; elective CABG) | BMMNC: 53.8 (10.1) Controls: 60.0 (6.8) | BMMNC: 93.3% Controls: 93.3% | 15 | 15 | Median 5 years (IQR 2.5 to 7.5) | |
| China/Australia | Refractory angina (CCS class III‐IV) | BMMNC: 65.2 (8.3) Controls: 68.9 (6.3) | BMMNC: 79% Controls: 88% | 19 | 9 | 6 months | |
| Germany | CIHD (MI > 3 months; LV dysfunction) | BMMNC: 62 (10) Controls: 60 (9) | BMMNC: 52.6% Controls: 55.6% | 38 | 18 | 12 months | |
| The Netherlands | Refractory angina (CCS class II‐IV) | BMMNC: 64 (8) Controls: 62 (9) | BMMNC: 92% Controls: 80% | 25 | 25 | 6 months | |
| China | Refractory angina (MI > 1 month) | CD34+: 60.6 (n/r) Controls: 60.0 (n/r) | CD34+: 56.3% Controls: 63.3% | 16 | 16 | 6 months | |
| China | Refractory angina (CCS class III‐IV) | CD34+: range 42 to 80 Controls: range 43 to 80 | CD34+: 51.8% Controls: 50.0% | 56 | 56 | 6 months | |
| China | CIHD (LVEF < 35%) | CD133+: n/r Controls: n/r | CD133+: n/r Controls: n/r | 35 | 35 | 6 months | |
| China | CIHD (multivessel disease; MI > 4 weeks; elective CABG) | BMMNC: 61.4 (7.5) Controls: 62.9 (6.9) | BMMNC: 82% Controls: 78% | 45 | 45 | 6 months | |
| China | CIHD (MI > 6 months) | BMMNC: 54.8 (11.5) Controls: 56.3 (7.9) | BMMNC: 96% Controls: 96% | 24 | 23 | 6 months | |
| China | HF (LVEF < 40%; elective CABG) | BMMNC: 60.3 (10.4) Controls: 59.1 (15.7) | BMMNC: 83.3% Controls: 83.3% | 18 | 18 | 6 months | |
| ALDH: aldehyde dehydrogenase | |||||||
| Study ID | Co‐intervention | Intervention given by: | Route of cell administration | Intervention cell type | How are cells obtained? | What were they resuspended in? | Dose administered? | Comparator arm (placebo or control) |
| CABG | Cardiothoracic surgeon | IC or IM | BMMNC | BM aspiration (**) | Autologous serum | IM: 84 (56) million cells IC: 115 (73) million cells | No additional therapy (control) | |
| Standard medical therapy | Cardiologist | IC | BMMNC or CPC | BM aspiration (**) for BMMNC. Vein puncture, mononuclear cell isolation by gradient centrifugation and culture for 3 days for CPC | n/r | BMMNC: 205 (110) million cells CPC: 22 (11) million cells | No additional therapy (control) | |
| Shockwave | Cardiologist | IC | BMMNC | BM aspiration (**) | X‐VIVO 10 medium and autologous serum | HDSW: 123 (69) million cells LDSW: 150 (77) million cells | Placebo (10 mL X‐VIVO 10 medium and autologous serum) | |
| Standard medical therapy | Cardiologist | IC | BM‐MSC (cardiopoietic cells) | BM aspiration (**), culture for 6 days and exposure to cardiopoietic factors | Preservation solution (no details) | 733 (range 605 to 1168) million cells | No additional therapy (control) | |
| Standard medical therapy | Cardiologist | IC | BM‐MSC | BM aspiration (**), culture for 7 days to select MSC | Heparinised saline | 5 million cells | No additional therapy (control) | |
| G‐CSF | Cardiologist | IC | CPC | G‐CSF infusion for 4 days prior to vein puncture, mononuclear cell isolation by gradient centrifugation and culture for 3 days for CPC | Saline and 10% autologous serum | 69 (14) million cells | Placebo (cell‐free serum solution) | |
| G‐CSF | Cardiologist | IC | BMMNC | G‐CSF infusion for 5 days and BM aspiration (**) | Autologous serum | n/r | Placebo (10 mL autologous serum) | |
| G‐CSF | Cardiologist | IM | BMMNC | G‐CSF infusion for 5 days and BM aspiration (**) | Autologous serum | n/r | Placebo (2 mL autologous serum) | |
| Standard medical therapy | Cardiologist | IM | BMMNC | BM aspiration (**) | n/r | n/r | Placebo (vehicle medium) | |
| Standard medical therapy | Cardiologist | IM | BM‐MSC | BM aspiration (**), culture to select MSC | n/r | n/r | Placebo (vehicle medium) | |
| CABG | Cardiothoracic surgeon | IM | BMMNC | BM aspiration (**) | Heparinised saline | 60 (31) million cells | Placebo (heparinised saline) | |
| G‐CSF | Cardiologist | IC | CPC | G‐CSF infusion for 5 days prior to vein puncture, mononuclear cell isolation by gradient centrifugation and culture for 4 days for CPC | n/r | 29 (12) million cells | No additional therapy (control) | |
| CABG | Cardiothoracic surgeon | IC | BMMNC | BM aspiration (**) | Saline solution and 20% autologous serum | 132 (107) million cells | Placebo (8 mL saline; 2 mL autologous serum) | |
| G‐CSF | Cardiologist | IM | CD133+ | G‐CSF infusion for 5 days prior to leukapheresis, mononuclear cell isolation by gradient centrifugation immunomagnetic selection to isolate CD133+ cells | Normal saline solution | 20 to 30 million cells | No additional therapy (control) | |
| G‐CSF | Cardiologist | IM | CD34+ | G‐CSF infusion for 5 days prior to leukapheresis, mononuclear cell isolation by gradient centrifugation immunomagnetic selection to isolate CD34+ cells | Saline solution and 5% autologous serum | LD: 0.05 million cells MD: 0.1 million cells HD: 0.5 million cells | Placebo (0.9% sodium chloride; 5% autologous plasma) | |
| G‐CSF | Cardiologist | IM | CD34+ | G‐CSF infusion for 5 days prior to leukapheresis, mononuclear cell isolation by gradient centrifugation immunomagnetic selection to isolate CD34+ cells | Saline solution and 5% autologous serum | LD: 0.1 million cells HD: 0.5 million cells | Placebo (0.9% sodium chloride; 5% autologous plasma) | |
| Standard medical therapy | Cardiologist | IM | BM‐MSC | BM aspiration (**), culture for 14 to 35 days to select MSC | Phosphate buffered saline with a drop of the participant’s blood | 77.5 (68) million cells | Placebo (phosphate buffered saline mixed with drop of participant’s blood) | |
| G‐CSF | Cardiologist | IC | BMMNC | G‐CSF infusion for 5 days and BM aspiration (**) | Autologous serum | 86 (110) million cells | Placebo (10 mL autologous serum) | |
| G‐CSF | Cardiologist | IM | BMMNC | G‐CSF infusion for 5 days and BM aspiration (**) | Autologous serum | 52 (53) million cells | Placebo (2 mL autologous serum) | |
| CABG | Cardiothoracic surgeon | IM | CD133+ | BM aspiration (**), immunomagnetic selection to isolate CD133+ cells | Sodium chloride and 10% autologous serum | Median 5.1 million cells | Placebo (isotonic saline solution; 10% autologous serum) | |
| CABG | Cardiothoracic surgeon | IM | CD34+ | BM aspiration (**), immunomagnetic selection to isolate CD34+ cells | Heparinised saline and autologous serum | Median 22 million cells | No additional therapy (control) | |
| Standard medical therapy | Cardiologist | IC | BMAC | BM aspiration (**) and concentration | Autologous serum | 3700 (900) million cells | No additional therapy (control) | |
| CABG | Cardiothoracic surgeon | IM | BMMNC | BM aspiration (**) | Medium 199 containing albumin, heparin | Median 840 (range 52 to 135) million cells | Placebo (vehicle medium) | |
| Standard medical therapy | Cardiologist | IM | BMMNC | BM aspiration (**) | Saline containing 5% human serum albumin | 2 million cells | No additional therapy (control) | |
| Standard medical therapy | Cardiologist | IM | BMMNC | BM aspiration (**) | Saline containing 5% human serum albumin | 100 million cells | Placebo (cell‐free suspension in same volume) | |
| Standard medical therapy | Cardiologist | IM | ALDH+ | BM aspiration (**) and cell sorting | Pharmaceutical grade human serum albumin | 2.4 (1.3) million cells | Placebo (5% pharmaceutical serum albumin) | |
| Standard medical therapy | Cardiologist | IM | BMMNC | BM aspiration (**) | Heparinised saline | 41 (16) million cells | No additional therapy (control) | |
| Standard medical therapy | Cardiologist | IM | BMMNC | BM aspiration (**) | Phosphate buffered saline with 10% autologous plasma | n/r | Placebo (phosphate buffered saline; 10% autologous plasma) | |
| CABG | Cardiothoracic surgeon | IM | BMMNC | BM aspiration (**) | n/r | 70.7 (32.4) million cells | No additional therapy (control) | |
| Standard medical therapy | Cardiologist | IM | BMMNC | BM aspiration (**) | Phosphate buffered saline with 10% autologous plasma | 15 million cells | Placebo (8 ‐ 12 x 0.1 mL phosphate buffered saline with 10% autologous serum) | |
| Standard medical therapy | Cardiologist | IC | BMMNC | BM aspiration (**) | n/r | 99 (25) million cells | No additional therapy (control) | |
| Standard medical therapy | Cardiologist | IM | BMMNC | BM aspiration (**) | Phosphate buffered saline with 0.5% human serum albumin | 98 (6) million cells | Placebo (0.9% sodium chloride; 0.5% human serum albumin) | |
| Standard medical therapy | Cardiologist | IC | CD34+ | BM aspiration (**), immunomagnetic selection to isolate CD34+ cells | Normal saline | Range 1.0 to 6.1 million cells | No additional therapy (control) | |
| Standard medical therapy | Cardiologist | IC | CD34+ | BM aspiration (**), immunomagnetic selection to isolate CD34+ cells | Saline and human serum albumin | 56 (23) million cells | Placebo (saline; human serum albumin) | |
| Standard medical therapy | Cardiologist | IM | CD133+ | n/r | n/r | n/r | Placebo (n/r) | |
| CABG | Cardiothoracic surgeon | IM | BMMNC | BM aspiration (**) | Heparinised saline | 521 (44) million cells | Placebo (saline solution) | |
| Standard medical therapy | Cardiologist | IC | BMMNC | BM aspiration (**) | Heparinised saline | 72 million cells | Placebo (0.9% sodium chloride containing heparin) | |
| CABG | Cardiothoracic surgeon | IM | BMMNC | BM aspiration (**) | Heparinised saline | 659 (512) million cells | Placebo (saline) | |
| **BM aspiration ‐ bone marrow aspiration and isolation of bone marrow mononuclear cells by gradient centrifugation. ALDH: aldehyde dehydrogenase | ||||||||
| Study ID | Primary outcomes | Secondary outcomes | ||||||||||||||||||||
| All‐cause mortality | Non‐fatal MI | Hospital readmission for HF | Composite MACEa | Arrhythmias | NYHA class | CCS class | Angina frequency | Exercise tolerance | Quality of life | LVEFb | ||||||||||||
| ST | LT | ST | LT | ST | LT | ST | LT | ST | LT | ST | LT | ST | LT | ST | LT | ST | LT | ST | LT | ST | LT | |
| FR | NR | PR* | NR | NR | NR | NR | NR | PR* | NR | PR | NR | PR | NR | NR | NR | NR | NR | NR | NR | FR | NR | |
| FR | NR | FR | NR | FR | NR | FR | NR | FR | NR | FR | NR | NR | NR | NR | NR | NR | NR | NR | NR | FR | NR | |
| FR | FR | NR | FR | FR | FR | NR | FR | NR | FR | FR | NR | NR | NR | NR | NR | NR | NR | NR | NR | FR | NR | |
| PR* | FR | NR | NR | NR | FR | NR | NR | PR | PR | PR | NR | NR | NR | NR | NR | FR | NR | PR | NR | FR | NR | |
| NR | FR | NR | NR | NR | NR | NR | NR | PR* | NR | FR | FR | NR | NR | NR | NR | FR | FR | NR | NR | FR | FR | |
| PR* | FR | NR | NR | NR | NR | NR | NR | NR | NR | NR | NR | NR | NR | NR | NR | FR | FR | NR | NR | FR | FR | |
| PR* | PR* | PR* | FR | PR* | PR* | PR* | FR | FR | FR | FR | FR | FR | FR | NR | NR | NR | NR | NR | NR | PR | PR | |
| PR* | PR* | PR* | PR* | FR | FR | FR | FR | FR | FR | FR | FR | FR | FR | NR | NR | NR | NR | NR | NR | PR | PR | |
| PR* | PR* | NR | PR* | NR | FR | PR* | FR | NR | NR | NR | PR | NR | NR | NR | NR | FR | FR | FR | FR | NR | PR | |
| PR* | FR | NR | PR* | NR | PR* | PR* | FR | NR | NR | NR | PR | NR | NR | NR | NR | FR | FR | FR | FR | NR | PR | |
| FR | NR | NR | NR | NR | NR | NR | NR | NR | NR | NR | NR | NR | NR | NR | NR | NR | NR | NR | NR | FR | NR | |
| PR* | FR | FR | FR | PR* | FR | NR | NR | NR | NR | FR | FR | NR | NR | NR | NR | FR | FR | NR | NR | FR | FR | |
| FR | FR | PR* | NR | NR | NR | FR | NR | PR* | FR | NR | NR | NR | NR | NR | NR | FR | NR | NR | NR | FR | FR | |
| FR | NR | PR* | NR | NR | NR | PR | NR | FR | NR | NR | NR | PR | NR | PR | NR | PR | NR | PR | NR | PR | NR | |
| PR* | PR* | PR* | PR* | NR | NR | NR | NR | FR | FR | NR | NR | FR | NR | FR | NR | FR | NR | PR | NR | NR | NR | |
| FR | FR | NR | FR | NR | FR | NR | PR | NR | NR | NR | NR | PR | PR | FR | NR | FR | FR | FR | FR | NR | NR | |
| FR | NR | PR* | NR | FR | NR | NR | NR | FR | NR | PR | NR | PR | NR | PR | NR | PR | NR | PR | NR | FR | NR | |
| FR | NR | PR* | NR | FR | NR | FR | NR | PR* | NR | FR | NR | FR | NR | NR | NR | NR | NR | NR | NR | NR | NR | |
| FR | NR | PR* | NR | PR* | NR | FR | NR | FR | NR | FR | NR | FR | NR | NR | NR | NR | NR | NR | NR | NR | NR | |
| FR | FR | NR | NR | NR | NR | NR | NR | NR | NR | FR | NR | FR | NR | NR | NR | PR | NR | PR | NR | FR | NR | |
| PR* | FR | NR | NR | NR | NR | NR | NR | PR* | NR | FR | NR | NR | NR | NR | NR | NR | NR | NR | NR | PR | PR | |
| NR | FR | NR | NR | NR | FR | NR | NR | NR | PR* | NR | FR | NR | PR | NR | NR | NR | NR | NR | PR | PR | PR | |
| NR | PR* | NR | PR* | NR | FR | NR | NR | NR | NR | NR | FR | NR | NR | NR | NR | NR | NR | NR | PR | NR | FR | |
| PR* | NR | PR* | NR | NR | NR | NR | NR | PR* | NR | FR | NR | FR | NR | NR | NR | NR | NR | FR | NR | FR | NR | |
| FR | NR | FR | NR | FR | NR | NR | NR | NR | NR | FR | NR | FR | NR | NR | NR | FR | NR | NR | NR | FR | NR | |
| PR* | NR | FR | NR | NR | NR | NR | NR | FR | NR | FR | NR | FR | NR | NR | NR | NR | NR | NR | NR | FR | NR | |
| FR | FR | NR | NR | NR | NR | NR | NR | PR* | PR* | FR | FR | FR | FR | FR | FR | FR | FR | FR | FR | FR | FR | |
| PR* | FR | NR | NR | NR | NR | NR | NR | FR | NR | PR | NR | NR | NR | NR | NR | PR | NR | NR | NR | FR | NR | |
| NR | FR | NR | NR | NR | NR | NR | NR | NR | NR | FR | FR | NR | NR | NR | NR | FR | FR | NR | NR | FR | FR | |
| PR* | FR | FR | NR | NR | NR | NR | NR | PR* | NR | FR | NR | FR | NR | NR | NR | FR | NR | NR | NR | FR | NR | |
| PR* | PR* | NR | NR | NR | NR | NR | NR | NR | NR | FR | FR | NR | NR | NR | NR | NR | NR | NR | NR | FR | FR | |
| FR | NR | PR* | NR | NR | NR | NR | NR | PR* | NR | NR | NR | FR | NR | NR | NR | FR | NR | FR | NR | FR | FR | |
| PR* | NR | PR* | NR | NR | NR | NR | NR | PR* | NR | NR | NR | FR | NR | FR | NR | FR | NR | NR | NR | NR | NR | |
| PR* | NR | PR* | NR | NR | NR | NR | NR | FR | NR | NR | NR | FR | NR | FR | NR | FR | NR | NR | NR | NR | NR | |
| NR | NR | NR | NR | NR | NR | NR | NR | NR | NR | PR | NR | NR | NR | NR | NR | PR | NR | NR | NR | FR | NR | |
| PR* | NR | NR | NR | NR | NR | NR | NR | PR | NR | NR | NR | NR | NR | NR | NR | NR | NR | NR | NR | FR | NR | |
| PR* | NR | FR | NR | FR | NR | NR | NR | PR* | NR | NR | NR | NR | NR | NR | NR | NR | NR | NR | NR | PR | NR | |
| FR | NR | PR* | NR | NR | NR | NR | NR | FR | NR | FR | NR | FR | NR | NR | NR | NR | NR | NR | NR | FR | NR | |
| Total (%) analysedc | 1637 (85.8) | 1010 (53.0) | 881 (46.2) | 461 (24.2) | 482 (25.3) | 495 (26.0) | 288 (15.1) | 201 (10.5) | 959 (50.3) | 363 (19.0) | 741 (38.9) | 346 (18.1) | 608 (31.9) | 142 (7.4) | 428 (22.4) | 82 (4.3)d | 535 (28.1) | 227 (11.9) | 197 (10.3)e | 151 (7.9)e | 439 (23.0)f | 110 (5.8)f |
| CCS: Canadian Cardiovascular Society; FR: full reporting, outcome included in analysis; HF: heart failure; LT: long‐term follow‐up (≥ 12 months); LVEF: left ventricular ejection fraction; MACE: major adverse clinical events; MI: myocardial infarction; NR: outcome not reported; NYHA: New York Heart Association; PR: partial reporting with insufficient information on outcome reported for inclusion in analysis; PR*: no incidence of outcome observed; ST: short‐term follow‐up (< 12 months) aComposite measure of mortality, reinfarction, or rehospitalisation for heart failure. | ||||||||||||||||||||||
| Study ID | Number of analysed participants | All‐cause mortality events | Non‐fatal MI events | Hospital readmission for HF | Composite MACEa | Arrhythmia events | |||||||||||
| Cells | No cells | Cells | No cells | Length of follow‐up | Cells | No cells | Length of follow‐up | Cells | No cells | Length of follow‐up | Cells | No cells | Length of follow‐up | Cells | No cells | Length of follow‐up | |
| 42 | 19 | 1 | 1 | 6 mthsa | 0 | 0 | 6 mths | n/r | n/r | n/r | n/r | n/r | n/r | 0 | 0 | 6 mths | |
| 52 | 23 | 0 | 1 | 3 mths | 1 | 0 | 3 mths | 1 | 1 | 3 mths | 1 | 1 | 3 mths | 0 | 1 | 3 mths | |
| 43 | 39 | 6 | 8 | 45.7 (17) mths | 1 | 4 | 45.7 (17) mths | 8 | 13 | 45.7 (17) mths | 14 | 19 | 45.7 (17) mths | 6 | 13 | 45.7 (17) mths | |
| 21 | 15 | 1 | 2 | 24 mths | n/r | n/r | n/r | 6 | 4 | 24 mths | n/r | n/r | n/r | n/r | n/r | n/r | |
| 22 | 23 | 2 | 4 | 12 mths | n/r | n/r | n/r | n/r | n/r | n/r | n/r | n/r | n/r | 0 | 0 | 6 mths | |
| 13 | 12 | 0 | 1 | 15 mths | n/r | n/r | n/r | n/r | n/r | n/r | n/r | n/r | n/r | n/r | n/r | n/r | |
| 15 | 15 | 0 | 0 | 12 mths | 1 | 0 | 12 mths | 0 | 0 | 12 mths | 1 | 0 | 12 mths | 1 | 1 | 12 mths | |
| 15 | 15 | 0 | 0 | 12 mths | 0 | 0 | 12 mths | 1 | 1 | 12 mths | 1 | 1 | 12 mths | 0 | 1 | 12 mths | |
| 19 | 10 | 0 | 0 | 12 mths | 0 | 0 | 12 mths | 0 | 1 | 12 mths | 0 | 1 | 12 mths | n/r | n/r | n/r | |
| 19 | 11 | 1 | 1 | 12 mths | 0 | 0 | 12 mths | 0 | 0 | 12 mths | 1 | 1 | 12 mths | n/r | n/r | n/r | |
| 11 | 12 | 1 | 1 | 4 mths | n/r | n/r | n/r | n/r | n/r | n/r | n/r | n/r | n/r | n/r | n/r | n/r | |
| 23 | 9 | 0 | 1 | 60 mths | 1 | 2 | 60 mths | 0 | 2 | 60 mths | n/r | n/r | n/r | n/r | n/r | n/r | |
| 31 | 29 | 1 | 2 | 12 mths | 0 | 0 | 6 mths | n/r | n/r | n/r | 3 | 4 | 6 mths | 1 | 0 | 12 mths | |
| 19 | 9 | 1 | 1 | 6 mths | 0 | 0 | 6 mths | n/r | n/r | n/r | n/r | n/r | n/r | 1 | 1 | 6 mths | |
| 18 | 6 | 0 | 0 | 12 mths | 0 | 0 | 12 mths | n/r | n/r | n/r | n/r | n/r | n/r | 0 | 1 | 12 mths | |
| 112 | 56 | 0 | 3 | 12 mths | 6 | 7 | 12 mths | 3 | 4 | 12 mths | n/r | n/r | n/r | n/r | n/r | n/r | |
| 40 | 20 | 1 | 1 | 6 mths | 0 | 0 | 6 mths | 6 | 2 | 6 mths | n/r | n/r | n/r | 3 | 1 | 6 mths | |
| 14 | 2 | 0 | 1 | 6 mths | 0 | 0 | 6 mths | 1 | 0 | 6 mths | 1 | 1 | 6 mths | 0 | 0 | 6 mths | |
| 10 | 8 | 0 | 3 | 6 mths | 0 | 0 | 6 mths | 0 | 0 | 6 mths | 0 | 3 | 6 mths | 2 | 2 | 6 mths | |
| 30 | 30 | 1 | 3 | 34 mthsb | n/r | n/r | n/r | n/r | n/r | n/r | n/r | n/r | n/r | n/r | n/r | n/r | |
| 25 | 25 | 3 | 10 | 10 yrs | n/r | n/r | n/r | n/r | n/r | n/r | n/r | n/r | n/r | 0 | 0 | 6 mths | |
| 22 | 6 | 5 | 2 | 12 mths | n/r | n/r | n/r | 2 | 0 | 12 mths | n/r | n/r | n/r | 0 | 0 | 12 mths | |
| 13c | 17c | 0 | 0 | Median 60 mths | 0 | 0 | Median 60 mths | 1 | 1 | Median 60 mths | n/r | n/r | n/r | n/r | n/r | n/r | |
| 20 | 10 | 0 | 0 | 6 mths | 0 | 0 | 6 mths | n/r | n/r | n/r | n/r | n/r | n/r | 0 | 0 | 6 mths | |
| 61 | 31 | 1 | 0 | 6 mths | 1 | 0 | 6 mths | 3 | 5 | 6 mths | n/r | n/r | n/r | n/r | n/r | n/r | |
| 10 | 10 | 0 | 0 | 6 mths | 1 | 0 | 6 mths | n/r | n/r | n/r | n/r | n/r | n/r | 3 | 2 | 6 mths | |
| 55 | 54 | 6 | 21 | 12 mths | n/r | n/r | n/r | n/r | n/r | n/r | n/r | n/r | n/r | 0 | 0 | 12 mths | |
| 19 | 9 | 0 | 2 | 23 (8) mths | n/r | n/r | n/r | n/r | n/r | n/r | n/r | n/r | n/r | 1 | 1 | 6 mths | |
| 15 | 15 | 2 | 4 | Median 5 yrs | n/r | n/r | n/r | n/r | n/r | n/r | n/r | n/r | n/r | n/r | n/r | n/r | |
| 19 | 9 | 0 | 1 | 19 (9) mths | 0 | 1 | 3 mths | n/r | n/r | n/r | n/r | n/r | n/r | 0 | 0 | 6 mths | |
| 38 | 18 | 0 | 0 | 12 mths | n/r | n/r | n/r | n/r | n/r | n/r | n/r | n/r | n/r | n/r | n/r | n/r | |
| 25 | 25 | 1 | 0 | 6 mths | 0 | 0 | 6 mths | n/r | n/r | n/r | n/r | n/r | n/r | 0 | 0 | 6 mths | |
| 16 | 16 | 0 | 0 | 6 mths | 0 | 0 | 6 mths | n/r | n/r | n/r | n/r | n/r | n/r | 0 | 0 | 6 mths | |
| 56 | 56 | 0 | 0 | 6 mths | 0 | 0 | 6 mths | n/r | n/r | n/r | n/r | n/r | n/r | 0 | 1 | 6 mthsd | |
| n/r | n/r | n/r | n/r | n/r | n/r | n/r | n/r | n/r | n/r | n/r | n/r | n/r | n/r | n/r | n/r | n/r | |
| 45 | 45 | 0 | 0 | 6 mths | n/r | n/r | n/r | n/r | n/r | n/r | n/r | n/r | n/r | n/r | n/r | n/r | |
| 24 | 23 | 0 | 0 | 6 mths | 0 | 1 | 6 mths | 1 | 2 | 6 mths | n/r | n/r | n/r | 0 | 0 | 6 mths | |
| 18 | 18 | 2 | 0 | 6 mths | 0 | 0 | 6 mths | n/r | n/r | n/r | n/r | n/r | n/r | 1 | 0 | 6 mths | |
| HF: heart failure; MACE: major adverse clinical events; MI: myocardial infarction; n/r: not reported aAng 2008: participants followed up for six months; mortality reported as “death within 30 days of treatment”. | |||||||||||||||||
| Study ID | Periprocedural adverse events |
| 2 deaths (1 control, 1 intracoronary cell therapy) occurred within 30 days of treatment. Reasons were not given, but neither was considered to be related to cell therapy. | |
| In‐hospital events: MI occurred in 1 CPC participant and ventricular arrhythmia detected during monitoring in 1 control participant. | |
| n/r (only safety of shockwave procedure reported) | |
| In the cell therapy group, 1 participant had ventricular tachycardia during procedure which was resolved by cardioversion, and 1 participant had blurred vision after intervention (participant had pre‐existing ophthalmic migraines). Other reported adverse events (gastrointestinal, hepatobiliary, respiratory, thoracic, mediastinal, and peripheral vascular disorders) were not considered to be related to cell therapy. | |
| 3 participants in cell therapy group experienced a transient episode of pulmonary oedema during the injection of stem cells. No sustained arrhythmias were monitored during the procedure. | |
| 1 cell therapy and 1 control participant reported headache, and 1 control participant developed fever during G‐CSF stimulation. G‐CSF resulted in comparable increases in serum C‐reactive protein levels and blood leukocyte count in both CPC and control groups (returned to baseline values within 4 days after G‐CSF). Neither G‐CSF injection nor intracoronary transplantation of CPC caused any elevation in troponin T levels. | |
| n/r | |
| n/r | |
| No participant had significant postprocedural pericardial effusion. Small transient increases in CK‐MB and serum troponin I were observed. There were no treatment emergent serious adverse events among any of participants who received cell therapy. | |
| No participant had significant postprocedural pericardial effusion. Small transient increases in CK‐MB and serum troponin I were observed. There were no treatment emergent serious adverse events among any of participants who received cell therapy. | |
| 1 cell therapy participant died on postoperative day 7 from a perforated oesophageal ulcer complicated by mediastinitis. 1 control participant died on the 5th postoperative day from multiorgan failure secondary to low cardiac output syndrome. | |
| Mild cephalgies and episodes of mild to moderate bone and muscular pain were reported during 5‐day course of G‐CSF. No participant developed chest pain episodes or clinical signs of decompensated HF. No novel ischaemia‐related ECG changes were observed during G‐CSF treatment and after intracoronary CPC infusion. Troponin T levels remained unchanged. Moreover, no specific G‐CSF‐mediated severe complications occurred. Intracoronary infusions were successfully performed without any procedural complications. | |
| 2 participants (unclear which treatment arm) had neurological complications but recovered and were discharged. No participants had arrhythmia. | |
| G‐CSF treatment was well tolerated, all participants presented bone pain as the only symptom. After cell injection, none of the participants had a significant rise in creatine phosphokinase, symptoms, ECG changes, or echocardiographic abnormalities. | |
| 13 participants reported transient increase in angina frequency after administration of G‐CSF. There were no cardiac enzyme elevations, MIs, acute coronary syndromes, or deaths. 1 participant in the placebo group developed ventricular tachycardia during the mapping procedure. No arrhythmias were detected by implantable cardioverter defibrillator, LifeVest, or Holter monitoring in any participant during or after the injection procedure. | |
| Administration of G‐CSF was associated with bone pain (20.1%), angina (17.4%), CHF (2 participants), and 8 participants had troponin elevations consistent with non‐STEMI. In 1 participant a thrombus was observed on the mapping catheter tip as it was removed. 2 participants experienced an apparent myocardial perforation during the injection procedure (1 resulted in haemothorax, which was successfully treated; 1 resulted in cardiac tamponade; this participant died after unsuccessful pericardiocentesis procedure). Elevated troponin levels were observed in 28% of participants at some point during the mobilisation and injection period, all of which were minor and subclinical except for those mentioned above. | |
| 1 participant with a history of episodic ventricular tachycardia developed ventricular tachycardia during the NOGA mapping procedure. Another participant experienced double vision and dizziness during the injection procedure; cerebral‐CT afterwards was normal, but the incident was diagnosed as a minor stroke by the neurologist. 1 participant from the treatment group suffered a stroke 12 days after treatment. | |
| The most common side effects from G‑CSF were bone pain (22%) and low grade pyrexia (65%) (reported in all G‐CSF groups combined). Bleeding from the arterial access site did not differ significantly between the 2 intervention arms. All episodes were minor and resolved with conservative treatment within 24 h of the procedure. As expected, there were increases in troponin and creatine kinase levels postprocedure in both arms. | |
| The most common side effects from G‑CSF were bone pain (22%) and low grade pyrexia (65%) (reported in all G‐CSF groups combined). There were 3 cases of arrhythmia during the intramyocardial procedure that required treatment. Of these, 1 participant developed atrial fibrillation, which reverted to sinus rhythm within 24 h of the procedure. Another participant developed transient complete heart block periprocedure requiring temporary pacing only. The final participant suffered an episode of pulseless ventricular tachycardia following intramyocardial injection, which was successfully cardioverted with a single 200 J external defibrillation and remained haemodynamically stable afterwards. 1 participant died from suspected acute LV failure 6 days after discharge. Bleeding from the arterial access site did not differ significantly between the two intervention arms. All episodes were minor and resolved with conservative treatment within 24 h of the procedure. As expected, there were increases in troponin and creatine kinase levels postprocedure in both arms. | |
| 2 participants in the placebo group died early postoperatively: 1 died on day 8 after developing Candida sepsis following LV failure despite intra‐aortic balloon pump and catecholamine treatment and mechanical assist device implantation, and 1 died on day 22 (reason not given). | |
| 1 participant in the OPCAB plus stem cell therapy group had a haematoma at the bone marrow harvest site. There were no other adverse events in either group (i.e. neurologic, haematologic, vascular, death, or infection events). No participants had any postoperative arrhythmias. | |
| 5 participants who received BMAC experienced “non‐serious adverse events possibly related to the procedure”. Procedure‐related complications included haematomas at the catheterisation site and elevated serum creatinine levels. | |
| There were no differences between treatment groups in participants’ haemodynamics, arterial blood gases, systemic vein oxygen level, blood glucose, acid–base balance, lactate, haemoglobin, body temperature, and diuresis, as well as medications needed. Perioperative measures are reported in detail in Lehtinen 2014. | |
| No perforations or arrhythmias were associated with cell injection procedures. Postprocedural transient left bundle‐branch block (resolved in 24 h) was seen in 1 treated and 1 control participant. 1 treated participant had non‐significant pericardial effusion. No sustained ventricular arrhythmias were observed by Holter monitoring in any participant. Transient fever but no sepsis occurred in 1 control participant. | |
| 1 participant experienced a limited retrograde catheter‐related dissection of the abdominal aorta (withdrawn from study). 1 participant experienced recurrent ventricular tachycardia with hypotension (and received only a small volume of cell product). | |
| No major adverse clinical cardiac events were associated with the cell injection procedures, including no perforations. Electromechanical mapping–related ventricular tachycardia occurred in 2 control participants, and ventricular fibrillation occurred in 1 control participant. No deaths occurred, and HF was not exacerbated in any participant. Holter monitoring showed no sustained ventricular arrhythmia in any participant. | |
| No periprocedural complications occurred in participants who received cell therapy. 2‐dimensional echocardiography did not reveal postprocedural pericardial effusion. Creatine kinase activity and peak troponin T level remained unaltered. No new periprocedural arrhythmias were recorded during 24 h of consecutive electrocardiographic monitoring. An implantable cardioverter defibrillator was implanted to 2 participants with ventricular tachycardia prior to cell injections. | |
| There were no acute procedural‐related complications, including stroke, transient ischaemic attack, ECG changes, sustained ventricular or atrial arrhythmias, and elevation of CPK‐MB. There was also no echocardiographic evidence of pericardial effusion in any participant within the first 24 h of the procedure. | |
| The early postoperative course was uneventful in both groups with no significant differences between them with regard to adverse side effects during hospital stay. There were no significant differences in cardiac‐specific enzymes activities after the operation or the number of atrial fibrillation episodes or appearance of pericardial effusion between the groups. | |
| There were no acute procedure‐related complications, including stroke, transient ischaemic attack, ECG changes, sustained ventricular or atrial arrhythmias, elevation of CPK‐MB, or echocardiographic evidence of pericardial effusion within the first 24 h after the procedure. | |
| There was no inflammatory response or myocardial reaction (white blood cell count, C‐reactive protein, CK, troponin) after cell therapy. There were no immediate pre‐ or postprocedure adverse complications, new electrocardiographic changes, or significant elevations in CK or troponin, and no inflammatory response was observed in participants with bone marrow cell transplant. | |
| In the placebo group, a greater than 0.5‐centimetre pericardial effusion was detected on 2‐dimensional echocardiography in an asymptomatic participant 2 days after the injection procedure, and pericardiocentesis was subsequently performed. | |
| No periprocedural adverse events; cardiac proteins in normal range. | |
| No increase in angina frequency or usage of sublingual NTG was observed in participants of either group. There were no cardiac enzyme elevations, MIs, acute coronary syndromes, or deaths. No participants from either group developed ventricular tachycardia during the cell or saline infusion procedure. No arrhythmias were detected by Holter monitoring in any participant during or after the infusion process. | |
| n/r | |
| Predischarge arrhythmias were reported (as number of events) in both cell therapy and control participants. | |
| Intracoronary application of BMC was performed without any acute or long‐term side effects. There was no inflammatory response or myocardial reaction (i.e. white blood cell count, C‐reactive protein, and creatinine phosphokinase) after cell therapy. | |
| In the perioperative period, sporadic ventricular premature beats and self terminating bouts of rapid atrial fibrillation were observed in both groups. However, 2 participants developed VF, and 1 died in the BMMNC group: 1 participant developed VF on the 5th day postoperatively but was successfully resuscitated and VF well‐controlled, and the other developed refractory VF 5 hours' postoperatively with death on postoperative day 3. There were no ventricular arrhythmias in the control group. | |
| AMI: acute myocardial infarction | |
| Study ID | No. analysed participants | Performance assessment | Mean follow‐up | No. analysed participants | Quality of life assessment | Mean follow‐up | ||||
| Cells | No cells | ST | LT | Cells | No cells | ST | LT | |||
| 21 | 21 | NYHA class (SR)a | 6 mths | n/r | ‐ | ‐ | ‐ | ‐ | ‐ | |
| 21 | 21 | CCS class (SR)b | 6 mths | n/r | ‐ | ‐ | ‐ | ‐ | ‐ | |
| 43 | 18 | NYHA class (EP) | 3 mths | n/r | ‐ | ‐ | ‐ | ‐ | ‐ | |
| 43 | 39 | NYHA class (EP/MC) | 4 mths | n/r | ‐ | ‐ | ‐ | ‐ | ‐ | |
| 21 | 15 | NYHA class (SR)c | 6 mths | n/r | 21 | 15 | MLHFQ (SR)c | 6 mths | n/r | |
| 21 | 15 | 6MWT (distance) (EP) | 6 mths | n/r | ‐ | ‐ | ‐ | ‐ | ‐ | |
| 22d | 23d | NYHA class (EP) | 6 mths | 12 mths | ‐ | ‐ | ‐ | ‐ | ‐ | |
| 22d | 23d | ETT (METs) (EP) | 6 mths | 12 mths | ‐ | ‐ | ‐ | ‐ | ‐ | |
| 12 | 10 | Bike test (max O2 update) (EP) | 3 mths | 15 mths | ‐ | ‐ | ‐ | ‐ | ‐ | |
| 15 | 15 | NYHA class (EP) | 6 mths | 12 mths | ‐ | ‐ | ‐ | ‐ | ‐ | |
| 15 | 15 | CCS class (EP) | 6 mths | 12 mths | ‐ | ‐ | ‐ | ‐ | ‐ | |
| 15 | 15 | NYHA class (EP) | 6 mths | 12 mths | ‐ | ‐ | ‐ | ‐ | ‐ | |
| 15 | 15 | CCS class (EP) | 6 mths | 12 mths | ‐ | ‐ | ‐ | ‐ | ‐ | |
| 17 | 16 | NYHA class (SR)e | n/r | 12 mths | 15 | 19 | MLHFQ (MC) | 6 mths | 12 mths | |
| 15f | 19f | 6MWT (distance) (MC) | 6 mths | 12 mths | ‐ | ‐ | ‐ | ‐ | ‐ | |
| 17 | 16 | NYHA class (SR)e | n/r | 12 mths | 19g | 19g | MLHFQ (MC) | 6 mths | 12 mths | |
| 18h | 19h | 6MWT (distance) (MC) | 6 mths | 12 mths | ‐ | ‐ | ‐ | ‐ | ‐ | |
| 21j | 10j | NYHA class (EP) | 3 mths | 60 mths | ‐ | ‐ | ‐ | ‐ | ‐ | |
| 12k | 5k | Bike test (sec) (EP) | 3 mths | 12 mths | ‐ | ‐ | ‐ | ‐ | ‐ | |
| 30 | 27 | 6MWT (distance) (EP/MC) | 6 mths | n/r | ‐ | ‐ | ‐ | ‐ | ‐ | |
| 19 | 9 | CCS class (median)m | 6 mths | n/r | n/r | n/r | SAQ (median)m | 6 mths | n/r | |
| 15 | 7 | ETT (time; METs) (median)m | 6 mths | n/r | 19 | 9 | Angina frequency (median)n | 6 mths | n/r | |
| 18 | 6 | CCS class (MC) | 6 mths | n/r | 18 | 6 | SAQ (SR)p | 6 mths | n/r | |
| 18 | 6 | ETT (time) (MC) | 6 mths | n/r | 17 | 6 | Angina frequency (EP/MC) | 6 mths | n/r | |
| 109q | 53q | CCS class (SR)r | 6 mths | 12 mths | 109q | 53q | SAQ (MC) | 6 mths | 12 mths | |
| 109q | 53q | ETT (time) (MC) | 6 mths | 12 mths | 109 | 53 | Angina frequency (EP) | 6 mths | n/r | |
| 40 | 40 | NYHA class (SR)s | 6 mths | n/r | 40 | 40 | KCCQ‐QOL (SR)s | 6 mths | n/r | |
| 40 | 40 | CCS class (SR)s | 6 mths | n/r | 40 | 40 | SAQ (SR)s | 6 mths | n/r | |
| 40 | 40 | 6MWT (SR)s | 6 mths | n/r | 40 | 40 | Angina frequency (SR)s | 6 mths | n/r | |
| 14 | 2 | NYHA class (EP) | 6 mths | n/r | ‐ | ‐ | ‐ | ‐ | ‐ | |
| 14 | 2 | CCS class (SR) | 6 mths | n/r | ‐ | ‐ | ‐ | ‐ | ‐ | |
| 10 | 8 | NYHA class (EP) | 6 mths | n/r | ‐ | ‐ | ‐ | ‐ | ‐ | |
| 10 | 8 | CCS class (SR) | 6 mths | n/r | ‐ | ‐ | ‐ | ‐ | ‐ | |
| 28 | 26 | NYHA class (EP/MC)t | 6 mths | n/r | 28 | 26 | MLHFQu | 6 mths | n/r | |
| 28 | 26 | 6MWTu | 6 mths | n/r | ‐ | ‐ | ‐ | ‐ | ‐ | |
| 28 | 26 | CCS class (EP/MC)t | 6 mths | n/r | ‐ | ‐ | ‐ | ‐ | ‐ | |
| 10 | 10 | NYHA class (EP/MC)t | 6 mths | n/r | ‐ | ‐ | ‐ | ‐ | ‐ | |
| 17 | 4 | NYHA class (EP)t | n/r | 12 mths | 17 | 4 | MLHFQ (SR) | n/r | 12 mths | |
| 17 | 4 | CCS class (SR) | n/r | 12 mths | ‐ | ‐ | ‐ | ‐ | ‐ | |
| 20 | 19 | NYHA class (EP/MC) | n/r | 12 mthsv | 20 | 19 | SF‐36w | n/r | 60 mths | |
| 20 | 10 | NYHA class (EP) | 6 mths | n/r | 17 | 9 | MLHFQ (EP) | 6 mths | n/r | |
| 20 | 10 | CCS class (EP/MC) | 6 mths | n/r | 13 | 10 | SF‐36 (physical/mental) (EP) | 6 mths | n/r | |
| 55 | 30 | NYHA class (MC) | 6 mths | n/r | ‐ | ‐ | ‐ | ‐ | ‐ | |
| 44 | 22 | CCS class (MC) | 6 mths | n/r | ‐ | ‐ | ‐ | ‐ | ‐ | |
| 51 | 29 | 6MWT (distance) (EP) | 6 mths | n/r | ‐ | ‐ | ‐ | ‐ | ‐ | |
| 10 | 10 | NYHA class (EP) | 6 mths | n/r | ‐ | ‐ | ‐ | ‐ | ‐ | |
| 10 | 10 | CCS class (EP) | 6 mths | n/r | ‐ | ‐ | ‐ | ‐ | ‐ | |
| 53x | 46x | NYHA class (EP) | 6 mths | 12 mths | 53x | 46x | MLHFQ (EP) | 6 mths | 12 mths | |
| 53x | 46x | CCS class (EP) | 6 mths | 12 mths | 53x | 46x | Angina frequency (EP) | 6 mths | 12 mths | |
| 53x | 46x | 6MWT (distance) (EP) | 6 mths | 12 mths | ‐ | ‐ | ‐ | ‐ | ‐ | |
| 19 | 9 | NYHA class (EP)y | 6 mths | n/r | ‐ | ‐ | ‐ | ‐ | ‐ | |
| 19 | 9 | 6MWT (distance) (EP)y | 6 mths | n/r | ‐ | ‐ | ‐ | ‐ | ‐ | |
| 15 | 15 | NYHA class (EP) | 6 mths | 12 mths | ‐ | ‐ | ‐ | ‐ | ‐ | |
| 15 | 15 | 6MWT (distance) (EP) | 6 mths | 12 mths | ‐ | ‐ | ‐ | ‐ | ‐ | |
| 19 | 9 | NYHA class (EP)t | 6 mths | n/r | ‐ | ‐ | ‐ | ‐ | ‐ | |
| 19 | 9 | CCS class (EP)t | 6 mths | n/r | ‐ | ‐ | ‐ | ‐ | ‐ | |
| 19 | 9 | Treadmill test (time; METs) (EP/MC) | 6 mths | n/r | ‐ | ‐ | ‐ | ‐ | ‐ | |
| 33 | 16 | NYHA class (EP) | 6 mths | 12 mths | ‐ | ‐ | ‐ | ‐ | ‐ | |
| 24 | 25 | CCS class (EP) | 6 mths | n/r | 24 | 25 | SAQ (EP/MC) | 6 mths | n/r | |
| 24 | 25 | Bike test (workload) (EP/MC) | 6 mths | n/r | ‐ | ‐ | ‐ | ‐ | ‐ | |
| 16 | 16 | CCS class (MC) | 6 mths | n/r | 16 | 16 | Angina frequency (MC) | 6 mths | n/r | |
| 16 | 16 | ETT (min) (MC) | 6 mths | n/r | ‐ | ‐ | ‐ | ‐ | ‐ | |
| 56 | 56 | CCS class (EP/MC) | 6 mths | n/r | 56 | 56 | Angina frequency (EP/MC) | 6 mths | n/r | |
| 56 | 56 | ETT (min) (EP/MC) | 6 mths | n/r | ‐ | ‐ | ‐ | ‐ | ‐ | |
| n/r | n/r | NYHA class (SR) | 6 mths | n/r | ‐ | ‐ | ‐ | ‐ | ‐ | |
| n/r | n/r | 5MWT (distance) (SR) | 6 mths | n/r | ‐ | ‐ | ‐ | ‐ | ‐ | |
| 16 | 18 | NYHA class (EP) | 6 mths | n/r | ‐ | ‐ | ‐ | ‐ | ‐ | |
| 16 | 18 | CCS class (EP) | 6 mths | n/r | ‐ | ‐ | ‐ | ‐ | ‐ | |
| CCS: Canadian Cardiovascular Society; EP: endpoint; ETT: exercise tolerance test; KCCQ‐QOL: Kansas City Cardiomyopathy Questionnaire – Quality of Life; LT: long term; MC: mean change from baseline; MET: metabolic equivalent test (mL/kg/min); MLHFQ: Minnesota Living with Heart Failure Questionnaire; n/r: not reported; NYHA: New York Heart Association; SAQ: Seattle Angina Questionnaire; SF‐36: 36‐Item Short Form Health Survey; SR: summary results; ST: short term; 5MWT: 5‐minute walk test; 6MWT: 6‐minute walk test aReported as number of participants in NYHA class III/IV. | ||||||||||
| Study ID | No. randomised participants | No. analysed participants | Baseline LVEF: Mean (SD) | Mean follow‐up of LVEF | ||||
| Cells | No cells | Cells | No cells | Cells | No cells | ST | LT | |
| Measured by MRI | ||||||||
| 42 | 21 | 18 | 7 | IM: 25.4 (8.1) IC: 28.5 (6.5) | 20.9 (8.9) | 6 mths | ‐ | |
| 43 | 39 | 15 | 12 | n/r | n/r | 4 mths | ‐ | |
| 14 | 14 | 12a | 11a | 51.0 (12.1) | 55.8 (12.4) | 3 mths | 15 mths | |
| 11 | 12 | 10 | 10 | 42.9 (10.3) | 39.5 (5.5) | 4 mths | ‐ | |
| 23 | 10 | 9 | 4 | 33.4 (SEM 12.7) | 23.3 (SEM 7.2) | 3 mths | 12 mths | |
| 31 | 29 | 31b | 28b | 23.5 (6.7) | 24.8 (5.2) | 6 mths | 12 mths | |
| 40 | 20 | 40 | 20 | 28.2 (9.3) | 25.1 (8.5) | 6 mths | ‐ | |
| 30 | 30 | 26 | 22 | 27 (6) | 26 (6) | 6 mths | ‐ | |
| 20 | 19 | 18 | 7 | 37.1 (9.5) | 38.5 (13.5) | ‐ | 60 mths | |
| 19 | 9 | 19 | 9 | 23.6 (8.4) | 26.8 (8.8) | 6 mths | ‐ | |
| 19 | 9 | 18 | 8 | 51.9 (8.5) | 45.7 (8.3) | 6 mths | ‐ | |
| 25 | 25 | 22 | 18 | 56 (12) | 54 (10) | 6 mths | ‐ | |
| 35 | 35 | 35 | 35 | 29 (7) | 28 (6) | 6 mths | ‐ | |
| Measured by echocardiography | ||||||||
| 32 | 15 | 21 | 15 | 27.5 (95% CI 25.5, 29.5) | 27.8 (95% CI 25.9, 29.8) | 6 mths | ‐ | |
| 31 | 29 | 24 | 18 | 36.0 (1.2) | 34.7 (1.4) | ‐ | 12 mths | |
| 20 | 10 | 20 | 10 | 37.0 (10.6) | 39.0 (9.1) | 6 mths | ‐ | |
| 61 | 31 | 54 | 28 | 34.7 (8.8) | 32.3 (8.6) | 6 mths | ‐ | |
| 10 | 10 | 10 | 10 | 36.1 (10.9) | 32.1 (10.6) | 6 mths | ‐ | |
| 55 | 54 | 53c | 46c | 27.8 (3.4) | 26.8 (3.8) | 6 mths | 12 mths | |
| 15 | 15 | 15 | 15 | 35.3 (3.9) | 36.5 (5.3) | 6 mths | 12 mths | |
| 25 | 25 | 24 | 25 | 50 (5) | 52 (5) | 6 mths | ‐ | |
| 45 | 45 | 45 | 45 | 39.3 (6.2) | 38.2 (8.0) | 6 mths | ‐ | |
| 18 | 18 | 16 | 18 | 35.8 (7.3) | 36.7 (9.2) | 6 mths | ‐ | |
| Measured by SPECT | ||||||||
| 24 | 24 | 22d | 23d | 26 (6) | 23 (8) | 6 mths | 12 mths | |
| 20 | 10 | 20 | 10 | 41.5 (11.2) | 43.0 (10.4) | 6 mths | ‐ | |
| 25 | 25 | 24 | 25 | 53 (12) | 54 (12) | 6 mths | 12 mths | |
| Measured by LV angiography | ||||||||
| 52 | 23 | 43 | 18 | BMMNC: 41 (11) CPC: 39 (10) | 43 (13) | 3 mths | ‐ | |
| 43 | 39 | 41 | 38 | LDSW: 37.2 (95% CI 31.7, 42.7) HDSW: 32.4 (95% CI 26.9, 37.9) | LDSW: 29.9 (95% CI 24.0, 35.7) HDSW: 32.3 (95% CI 26.5, 38.1) | 4 mths | ‐ | |
| 23 | 10 | 21 | 5 | 37.5 (SEM 12.9) | 37.6 (SEM 7.5) | 3 mths | ‐ | |
| 20 | 10 | 20 | 10 | 37.5 (8.2) | 40.0 (3.2) | 6 mths | ‐ | |
| 10 | 10 | 10 | 10 | 38.0 (17.5) | 41.9 (11.8) | 6 mths | ‐ | |
| 38 | 18 | 33 | 16 | 46 (10) | 46 (10) | 3 mths | 12 mths | |
| 95% CI: 95% confidence interval; BMMNC: bone marrow mononuclear cells; CPC: circulating progenitor cells; HDSW: high‐dose shockwave; IC: intracoronary; IM: intramyocardial; LDSW: low‐dose shockwave; LT: long term; LV: left ventricular; LVEF: left ventricular ejection fraction; SD: standard deviation; SEM: standard error of the mean; SPECT: single‐photon emission computed tomography; ST: short term a12/10 at 15 months. | ||||||||
| Outcome or subgroup title | No. of studies | No. of participants | Statistical method | Effect size |
| 1 Mortality (all‐cause) Show forest plot | 37 | Risk Ratio (M‐H, Random, 95% CI) | Subtotals only | |
| 1.1 Short term follow‐up (< 12 months) | 33 | 1637 | Risk Ratio (M‐H, Random, 95% CI) | 0.48 [0.26, 0.87] |
| 1.2 Long term follow‐up (≥ 12 months) | 21 | 1010 | Risk Ratio (M‐H, Random, 95% CI) | 0.38 [0.25, 0.58] |
| 2 Non‐fatal myocardial infarction Show forest plot | 25 | Risk Ratio (M‐H, Random, 95% CI) | Subtotals only | |
| 2.1 Short term follow‐up (< 12 months) | 20 | 881 | Risk Ratio (M‐H, Random, 95% CI) | 0.60 [0.17, 2.15] |
| 2.2 Long term follow‐up (≥ 12 months) | 9 | 461 | Risk Ratio (M‐H, Random, 95% CI) | 0.40 [0.17, 0.93] |
| 3 Rehospitalisation due to heart failure Show forest plot | 16 | Risk Ratio (M‐H, Random, 95% CI) | Subtotals only | |
| 3.1 Short term follow‐up (< 12 months) | 10 | 482 | Risk Ratio (M‐H, Random, 95% CI) | 0.63 [0.36, 1.12] |
| 3.2 Long term follow‐up (≥ 12 months) | 10 | 495 | Risk Ratio (M‐H, Random, 95% CI) | 0.62 [0.36, 1.04] |
| 4 Arrhythmias Show forest plot | 24 | Risk Ratio (M‐H, Random, 95% CI) | Subtotals only | |
| 4.1 Short term follow‐up (< 12 months) | 22 | 959 | Risk Ratio (M‐H, Random, 95% CI) | 0.70 [0.33, 1.45] |
| 4.2 Long term follow‐up (≥ 12 months) | 7 | 363 | Risk Ratio (M‐H, Random, 95% CI) | 0.46 [0.22, 0.97] |
| 5 Composite MACE Show forest plot | 9 | Risk Ratio (M‐H, Random, 95% CI) | Subtotals only | |
| 5.1 Short term follow‐up (< 12 months) | 8 | 288 | Risk Ratio (M‐H, Random, 95% CI) | 0.51 [0.18, 1.42] |
| 5.2 Long term follow‐up (≥ 12 months) | 5 | 201 | Risk Ratio (M‐H, Random, 95% CI) | 0.68 [0.41, 1.12] |
| 6 MLHFQ: short term follow‐up (< 12 months) Show forest plot | 4 | Mean Difference (IV, Random, 95% CI) | Subtotals only | |
| 6.1 Mean value at endpoint | 2 | 125 | Mean Difference (IV, Random, 95% CI) | ‐29.52 [‐33.76, ‐25.27] |
| 6.2 Mean change from baseline | 2 | 72 | Mean Difference (IV, Random, 95% CI) | ‐9.07 [‐22.09, 3.95] |
| 6.3 Combined | 4 | 197 | Mean Difference (IV, Random, 95% CI) | ‐18.96 [‐31.97, ‐5.94] |
| 7 MLHFQ: long term follow‐up (≥ 12 months) Show forest plot | 3 | Mean Difference (IV, Random, 95% CI) | Subtotals only | |
| 7.1 Mean value at endpoint | 1 | 82 | Mean Difference (IV, Random, 95% CI) | ‐36.5 [‐42.21, ‐30.79] |
| 7.2 Mean change from baseline | 2 | 69 | Mean Difference (IV, Random, 95% CI) | ‐7.63 [‐16.35, 1.09] |
| 7.3 Combined | 3 | 151 | Mean Difference (IV, Random, 95% CI) | ‐17.80 [‐39.87, 4.26] |
| 8 Seattle Angina Questionnaire: short term follow‐up (< 12 months) Show forest plot | 2 | Mean Difference (IV, Random, 95% CI) | Subtotals only | |
| 8.1 Mean value at endpoint | 1 | 49 | Mean Difference (IV, Random, 95% CI) | 5.0 [‐3.21, 13.21] |
| 8.2 Mean change from baseline | 2 | 211 | Mean Difference (IV, Random, 95% CI) | 9.34 [2.62, 16.07] |
| 8.3 Combined | 2 | 211 | Mean Difference (IV, Random, 95% CI) | 9.34 [2.62, 16.07] |
| 9 Angina episodes per week: short term follow‐up (< 12 months) Show forest plot | 5 | Mean Difference (IV, Random, 95% CI) | Subtotals only | |
| 9.1 Mean value at endpoint | 4 | 396 | Mean Difference (IV, Random, 95% CI) | ‐6.96 [‐11.99, ‐1.93] |
| 9.2 Mean change from baseline | 3 | 167 | Mean Difference (IV, Random, 95% CI) | ‐1.77 [‐14.61, 11.08] |
| 9.3 Combined | 5 | 428 | Mean Difference (IV, Random, 95% CI) | ‐5.11 [‐11.30, 1.09] |
| 10 NYHA classification: short‐term follow‐up (< 12 months) Show forest plot | 17 | Mean Difference (IV, Random, 95% CI) | Subtotals only | |
| 10.1 Mean value at endpoint | 16 | 658 | Mean Difference (IV, Random, 95% CI) | ‐0.42 [‐0.84, ‐0.00] |
| 10.2 Mean change from baseline | 4 | 239 | Mean Difference (IV, Random, 95% CI) | ‐0.56 [‐1.49, 0.36] |
| 10.3 Combined | 17 | 741 | Mean Difference (IV, Random, 95% CI) | ‐0.44 [‐0.84, ‐0.05] |
| 11 NYHA classification: long term follow‐up (≥ 12 months) Show forest plot | 9 | Mean Difference (IV, Random, 95% CI) | Subtotals only | |
| 11.1 Mean value at endpoint | 9 | 346 | Mean Difference (IV, Random, 95% CI) | ‐0.57 [‐1.03, ‐0.10] |
| 11.2 Mean change from baseline | 1 | 39 | Mean Difference (IV, Random, 95% CI) | ‐2.2 [‐2.70, ‐1.70] |
| 11.3 Combined | 9 | 346 | Mean Difference (IV, Random, 95% CI) | ‐0.81 [‐1.23, ‐0.39] |
| 12 CCS class: short term follow‐up (< 12 months) Show forest plot | 13 | Mean Difference (IV, Random, 95% CI) | Subtotals only | |
| 12.1 Mean value at endpoint | 10 | 486 | Mean Difference (IV, Random, 95% CI) | ‐0.32 [‐0.82, 0.18] |
| 12.2 Mean change from baseline | 6 | 318 | Mean Difference (IV, Random, 95% CI) | ‐0.62 [‐1.40, 0.17] |
| 12.3 Combined | 13 | 608 | Mean Difference (IV, Random, 95% CI) | ‐0.43 [‐0.92, 0.06] |
| 13 CCS class: long term follow‐up (≥ 12 months) Show forest plot | 3 | Mean Difference (IV, Random, 95% CI) | Subtotals only | |
| 13.1 Mean value at endpoint | 3 | 142 | Mean Difference (IV, Random, 95% CI) | ‐0.58 [‐2.04, 0.88] |
| 14 Exercise capacity: short term follow‐up (< 12 months) Show forest plot | 16 | Std. Mean Difference (IV, Random, 95% CI) | Subtotals only | |
| 14.1 Mean value at endpoint | 11 | 563 | Std. Mean Difference (IV, Random, 95% CI) | 0.56 [0.19, 0.93] |
| 14.2 Mean change from baseline | 9 | 535 | Std. Mean Difference (IV, Random, 95% CI) | 0.33 [0.05, 0.61] |
| 15 Exercise capacity: long term follow‐up (≥ 12 months) Show forest plot | 8 | Std. Mean Difference (IV, Random, 95% CI) | Subtotals only | |
| 15.1 Mean value at endpoint | 5 | 178 | Std. Mean Difference (IV, Random, 95% CI) | 1.14 [0.04, 2.25] |
| 15.2 Mean change from baseline | 3 | 227 | Std. Mean Difference (IV, Random, 95% CI) | 0.34 [0.07, 0.62] |
| 16 LVEF (%) measured by MRI: short term follow‐up (< 12 months) Show forest plot | 12 | Mean Difference (IV, Random, 95% CI) | Subtotals only | |
| 16.1 Mean value at endpoint | 10 | 352 | Mean Difference (IV, Random, 95% CI) | 3.01 [‐0.05, 6.07] |
| 16.2 Mean change from baseline | 9 | 308 | Mean Difference (IV, Random, 95% CI) | 4.05 [2.55, 5.55] |
| 16.3 Combined | 12 | 439 | Mean Difference (IV, Random, 95% CI) | 2.92 [1.03, 4.82] |
| 17 LVEF (%) measured by MRI: long term follow‐up (≥ 12 months) Show forest plot | 4 | Mean Difference (IV, Random, 95% CI) | Subtotals only | |
| 17.1 Mean value at endpoint | 4 | 110 | Mean Difference (IV, Random, 95% CI) | 2.37 [‐1.54, 6.29] |
| 17.2 Mean change from baseline | 3 | 97 | Mean Difference (IV, Random, 95% CI) | 3.83 [‐0.42, 8.08] |
| 17.3 Combined | 4 | 110 | Mean Difference (IV, Random, 95% CI) | 4.38 [0.82, 7.93] |
| 18 LVEF (%) measured by echocardiography: short term follow‐up (< 12 months) Show forest plot | 9 | Mean Difference (IV, Random, 95% CI) | Subtotals only | |
| 18.1 Mean value at endpoint | 8 | 388 | Mean Difference (IV, Random, 95% CI) | 5.16 [2.87, 7.44] |
| 18.2 Mean change from baseline | 3 | 161 | Mean Difference (IV, Random, 95% CI) | 3.47 [1.59, 5.34] |
| 18.3 Combined | 9 | 470 | Mean Difference (IV, Random, 95% CI) | 5.71 [4.29, 7.13] |
| 19 LVEF (%) measured by echocardiography: long term follow‐up (≥ 12 months) Show forest plot | 3 | Mean Difference (IV, Random, 95% CI) | Subtotals only | |
| 19.1 Mean value at endpoint | 3 | 154 | Mean Difference (IV, Random, 95% CI) | 7.69 [6.47, 8.92] |
| 19.2 Mean change from baseline | 1 | 82 | Mean Difference (IV, Random, 95% CI) | 6.1 [‐1.27, 13.47] |
| 19.3 Combined | 3 | 154 | Mean Difference (IV, Random, 95% CI) | 7.96 [6.39, 9.54] |
| 20 LVEF (%) measured by SPECT: short term follow‐up (< 12 months) Show forest plot | 4 | Mean Difference (IV, Random, 95% CI) | Subtotals only | |
| 20.1 Mean value at endpoint | 4 | 145 | Mean Difference (IV, Random, 95% CI) | 2.41 [‐2.65, 7.46] |
| 20.2 Mean change from baseline | 1 | 30 | Mean Difference (IV, Random, 95% CI) | ‐2.3 [‐17.33, 12.73] |
| 20.3 Combined | 4 | 145 | Mean Difference (IV, Random, 95% CI) | 5.22 [2.60, 7.85] |
| 21 LVEF (%) measured by SPECT: long term follow‐up (≥ 12 months) Show forest plot | 2 | Mean Difference (IV, Random, 95% CI) | Subtotals only | |
| 21.1 Mean value at endpoint | 2 | 88 | Mean Difference (IV, Random, 95% CI) | 0.37 [‐2.30, 3.04] |
| 21.2 Mean change from baseline | 1 | 49 | Mean Difference (IV, Random, 95% CI) | 4.0 [‐6.48, 14.48] |
| 21.3 Combined | 2 | 88 | Mean Difference (IV, Random, 95% CI) | 0.28 [‐2.48, 3.03] |
| 22 LVEF (%) measured by LV angiography: short term follow‐up (< 12 months) Show forest plot | 6 | Mean Difference (IV, Random, 95% CI) | Subtotals only | |
| 22.1 Mean value at endpoint | 6 | 265 | Mean Difference (IV, Random, 95% CI) | 3.18 [0.39, 5.97] |
| 22.2 Mean change from baseline | 4 | 181 | Mean Difference (IV, Random, 95% CI) | 1.72 [0.50, 2.95] |
| 22.3 Combined | 6 | 250 | Mean Difference (IV, Random, 95% CI) | 2.00 [0.53, 3.46] |
| 23 LVEF (%) measured by LV angiography: long term follow‐up (≥ 12 months) Show forest plot | 1 | Mean Difference (IV, Random, 95% CI) | Subtotals only | |
| 23.1 Mean value at endpoint | 1 | 49 | Mean Difference (IV, Random, 95% CI) | 6.0 [0.81, 11.19] |
| Outcome or subgroup title | No. of studies | No. of participants | Statistical method | Effect size |
| 1 Mortality (all‐cause): short term follow‐up (< 12 months) Show forest plot | 30 | Risk Ratio (M‐H, Random, 95% CI) | Subtotals only | |
| 1.1 < 107 cells | 6 | 334 | Risk Ratio (M‐H, Random, 95% CI) | 0.18 [0.02, 1.63] |
| 1.2 107 < 108 cells | 18 | 771 | Risk Ratio (M‐H, Random, 95% CI) | 0.34 [0.15, 0.79] |
| 1.3 ≥ 108 cells | 8 | 487 | Risk Ratio (M‐H, Random, 95% CI) | 0.83 [0.35, 1.94] |
| 2 Mortality (all‐cause): long term follow‐up (≥ 12 months) Show forest plot | 16 | Risk Ratio (M‐H, Random, 95% CI) | Subtotals only | |
| 2.1 < 107 cells | 4 | 297 | Risk Ratio (M‐H, Random, 95% CI) | 0.33 [0.10, 1.09] |
| 2.2 107 < 108 cells | 7 | 330 | Risk Ratio (M‐H, Random, 95% CI) | 0.30 [0.17, 0.53] |
| 2.3 ≥ 108 cells | 5 | 236 | Risk Ratio (M‐H, Random, 95% CI) | 0.62 [0.30, 1.26] |
| 3 NYHA classification: short term follow‐up (< 12 months) Show forest plot | 15 | Mean Difference (IV, Random, 95% CI) | Subtotals only | |
| 3.1 < 107 cells | 4 | 149 | Mean Difference (IV, Random, 95% CI) | ‐0.29 [‐0.94, 0.36] |
| 3.2 107 < 108 cells | 8 | 309 | Mean Difference (IV, Random, 95% CI) | ‐0.65 [‐1.22, ‐0.08] |
| 3.3 ≥ 108 cells | 4 | 241 | Mean Difference (IV, Random, 95% CI) | ‐0.41 [‐0.72, ‐0.11] |
| 4 CCS class: short term follow‐up (< 12 months) Show forest plot | 9 | Mean Difference (IV, Random, 95% CI) | Subtotals only | |
| 4.1 < 107 cells | 4 | 288 | Mean Difference (IV, Random, 95% CI) | ‐0.87 [‐1.92, 0.19] |
| 4.2 107 < 108 cells | 5 | 160 | Mean Difference (IV, Random, 95% CI) | ‐0.54 [‐1.40, 0.32] |
| 5 Exercise capacity: short term follow‐up (< 12 months) Show forest plot | 10 | Std. Mean Difference (IV, Random, 95% CI) | Subtotals only | |
| 5.1 107 < 108 cells | 7 | 357 | Std. Mean Difference (IV, Random, 95% CI) | 0.56 [‐0.03, 1.14] |
| 5.2 ≥ 108 cells | 3 | 161 | Std. Mean Difference (IV, Random, 95% CI) | 0.43 [0.10, 0.77] |
| 6 LVEF (%) measured by MRI: short term follow‐up (< 12 months) Show forest plot | 9 | Mean Difference (IV, Random, 95% CI) | Subtotals only | |
| 6.1 107 < 108 cells | 7 | 199 | Mean Difference (IV, Random, 95% CI) | 5.23 [3.91, 6.54] |
| 6.2 ≥ 108 cells | 3 | 101 | Mean Difference (IV, Random, 95% CI) | 2.37 [‐0.92, 5.66] |
| Outcome or subgroup title | No. of studies | No. of participants | Statistical method | Effect size |
| 1 Mortality (all‐cause): short term follow‐up (< 12 months) Show forest plot | 28 | Risk Ratio (M‐H, Random, 95% CI) | Subtotals only | |
| 1.1 < 30% | 11 | 508 | Risk Ratio (M‐H, Random, 95% CI) | 0.23 [0.09, 0.59] |
| 1.2 30 ‐ 50% | 13 | 642 | Risk Ratio (M‐H, Random, 95% CI) | 0.87 [0.36, 2.11] |
| 1.3 > 50% | 4 | 271 | Risk Ratio (M‐H, Random, 95% CI) | 0.61 [0.11, 3.35] |
| 2 Mortality (all‐cause): long term follow‐up (≥ 12 months) Show forest plot | 16 | Risk Ratio (M‐H, Random, 95% CI) | Subtotals only | |
| 2.1 < 30% | 9 | 426 | Risk Ratio (M‐H, Random, 95% CI) | 0.36 [0.20, 0.64] |
| 2.2 30 ‐ 50% | 7 | 289 | Risk Ratio (M‐H, Random, 95% CI) | 0.57 [0.27, 1.21] |
| 3 NYHA classification: short term follow‐up (< 12 months) Show forest plot | 15 | Mean Difference (IV, Random, 95% CI) | Subtotals only | |
| 3.1 < 30% | 6 | 273 | Mean Difference (IV, Random, 95% CI) | ‐0.40 [‐1.22, 0.43] |
| 3.2 30 ‐ 50% | 9 | 420 | Mean Difference (IV, Random, 95% CI) | ‐0.32 [‐0.54, ‐0.10] |
| 4 NYHA classification: long term follow‐up (≥ 12 months) Show forest plot | 9 | Mean Difference (IV, Random, 95% CI) | Subtotals only | |
| 4.1 < 30% | 5 | 202 | Mean Difference (IV, Random, 95% CI) | ‐0.66 [‐1.28, ‐0.04] |
| 4.2 30 ‐ 50% | 4 | 144 | Mean Difference (IV, Random, 95% CI) | ‐0.98 [‐1.72, ‐0.25] |
| 5 CCS class: short term follow‐up (< 12 months) Show forest plot | 8 | Mean Difference (IV, Random, 95% CI) | Subtotals only | |
| 5.1 < 30% | 4 | 213 | Mean Difference (IV, Random, 95% CI) | ‐0.25 [‐1.47, 0.97] |
| 5.2 30 ‐ 50% | 4 | 150 | Mean Difference (IV, Random, 95% CI) | ‐0.11 [‐0.31, 0.09] |
| 6 Exercise capacity: short term follow‐up (< 12 months) Show forest plot | 7 | Std. Mean Difference (IV, Random, 95% CI) | Subtotals only | |
| 6.1 < 30% | 4 | 225 | Std. Mean Difference (IV, Random, 95% CI) | 0.96 [0.37, 1.56] |
| 6.2 30 ‐ 50% | 3 | 127 | Std. Mean Difference (IV, Random, 95% CI) | 0.38 [‐0.57, 1.33] |
| 7 LVEF (%) measured by MRI: short term follow‐up (< 12 months) Show forest plot | 9 | Mean Difference (IV, Random, 95% CI) | Subtotals only | |
| 7.1 < 30% | 6 | 290 | Mean Difference (IV, Random, 95% CI) | 1.54 [‐1.96, 5.03] |
| 7.2 30 ‐ 50% | 3 | 60 | Mean Difference (IV, Random, 95% CI) | 3.31 [0.88, 5.75] |
| Outcome or subgroup title | No. of studies | No. of participants | Statistical method | Effect size |
| 1 Mortality (all‐cause): short term follow‐up (< 12 months) Show forest plot | 33 | Risk Ratio (M‐H, Random, 95% CI) | Subtotals only | |
| 1.1 Intramyocardial | 22 | 1049 | Risk Ratio (M‐H, Random, 95% CI) | 0.47 [0.21, 1.03] |
| 1.2 Intracoronary | 12 | 607 | Risk Ratio (M‐H, Random, 95% CI) | 0.51 [0.21, 1.23] |
| 2 Mortality (all‐cause): long term follow‐up (≥ 12 months) Show forest plot | 21 | Risk Ratio (M‐H, Random, 95% CI) | Subtotals only | |
| 2.1 Intramyocardial | 13 | 652 | Risk Ratio (M‐H, Random, 95% CI) | 0.29 [0.17, 0.50] |
| 2.2 Intracoronary | 8 | 358 | Risk Ratio (M‐H, Random, 95% CI) | 0.57 [0.30, 1.09] |
| 3 NYHA classification: short term follow‐up (< 12 months) Show forest plot | 17 | Mean Difference (IV, Random, 95% CI) | Subtotals only | |
| 3.1 Intramyocardial | 11 | 445 | Mean Difference (IV, Random, 95% CI) | ‐0.48 [‐0.99, 0.03] |
| 3.2 Intracoronary | 6 | 296 | Mean Difference (IV, Random, 95% CI) | ‐0.38 [‐0.76, 0.00] |
| 4 NYHA classification: long term follow‐up (≥ 12 months) Show forest plot | 9 | Mean Difference (IV, Random, 95% CI) | Subtotals only | |
| 4.1 Intramyocardial | 4 | 181 | Mean Difference (IV, Random, 95% CI) | ‐1.09 [‐1.76, ‐0.41] |
| 4.2 Intracoronary | 5 | 165 | Mean Difference (IV, Random, 95% CI) | ‐0.61 [‐0.92, ‐0.30] |
| 5 CCS class: short term follow‐up (< 12 months) Show forest plot | 13 | Mean Difference (IV, Random, 95% CI) | Subtotals only | |
| 5.1 Intramyocardial | 10 | 434 | Mean Difference (IV, Random, 95% CI) | ‐0.33 [‐0.87, 0.22] |
| 5.2 Intracoronary | 3 | 174 | Mean Difference (IV, Random, 95% CI) | ‐1.00 [‐2.87, 0.86] |
| 6 Exercise capacity: short term follow‐up (< 12 months) Show forest plot | 11 | Std. Mean Difference (IV, Random, 95% CI) | Subtotals only | |
| 6.1 Intramyocardial | 6 | 310 | Std. Mean Difference (IV, Random, 95% CI) | 0.78 [0.19, 1.36] |
| 6.2 Intracoronary | 5 | 253 | Std. Mean Difference (IV, Random, 95% CI) | 0.33 [‐0.06, 0.72] |
| 7 LVEF (%) measured by MRI: short term follow‐up (< 12 months) Show forest plot | 12 | Mean Difference (IV, Random, 95% CI) | Subtotals only | |
| 7.1 Intramyocardial | 8 | 309 | Mean Difference (IV, Random, 95% CI) | 2.18 [‐0.41, 4.77] |
| 7.2 Intracoronary | 5 | 137 | Mean Difference (IV, Random, 95% CI) | 3.72 [0.86, 6.57] |
| Outcome or subgroup title | No. of studies | No. of participants | Statistical method | Effect size |
| 1 Mortality (all‐cause): short term follow‐up (< 12 months) Show forest plot | 33 | Risk Ratio (M‐H, Random, 95% CI) | Subtotals only | |
| 1.1 Mononuclear cells | 20 | 966 | Risk Ratio (M‐H, Random, 95% CI) | 0.54 [0.28, 1.04] |
| 1.2 Circulating progenitor cells | 3 | 104 | Risk Ratio (M‐H, Random, 95% CI) | 0.32 [0.01, 7.48] |
| 1.3 Haematopoietic progenitor cells | 8 | 464 | Risk Ratio (M‐H, Random, 95% CI) | 0.27 [0.05, 1.46] |
| 1.4 Mesenchymal stem cells | 3 | 126 | Risk Ratio (M‐H, Random, 95% CI) | 0.5 [0.03, 7.59] |
| 2 Mortality (all‐cause): long term follow‐up (≥ 12 months) Show forest plot | 19 | Risk Ratio (M‐H, Random, 95% CI) | Subtotals only | |
| 2.1 Mononuclear cells | 12 | 540 | Risk Ratio (M‐H, Random, 95% CI) | 0.42 [0.25, 0.70] |
| 2.2 Haematopoietic progenitor cells | 4 | 302 | Risk Ratio (M‐H, Random, 95% CI) | 0.26 [0.10, 0.69] |
| 2.3 Mesenchymal stem cells | 3 | 111 | Risk Ratio (M‐H, Random, 95% CI) | 0.48 [0.15, 1.57] |
| 3 NYHA classification: short term follow‐up (< 12 months) Show forest plot | 15 | Mean Difference (IV, Random, 95% CI) | Subtotals only | |
| 3.1 Mononuclear cells | 12 | 547 | Mean Difference (IV, Random, 95% CI) | ‐0.42 [‐0.86, 0.02] |
| 3.2 Haematopoietic progenitor cells | 3 | 94 | Mean Difference (IV, Random, 95% CI) | ‐0.47 [‐1.95, 1.02] |
| 4 CCS class: short term follow‐up (< 12 months) Show forest plot | 13 | Mean Difference (IV, Random, 95% CI) | Subtotals only | |
| 4.1 Mononuclear cells | 8 | 366 | Mean Difference (IV, Random, 95% CI) | ‐0.39 [‐0.99, 0.21] |
| 4.2 Haematopoietic progenitor cells | 5 | 242 | Mean Difference (IV, Random, 95% CI) | ‐0.54 [‐1.55, 0.46] |
| Outcome or subgroup title | No. of studies | No. of participants | Statistical method | Effect size |
| 1 Mortality (all‐cause): short term follow‐up (< 12 months) Show forest plot | 33 | Risk Ratio (M‐H, Random, 95% CI) | Subtotals only | |
| 1.1 Chronic IHD | 11 | 550 | Risk Ratio (M‐H, Random, 95% CI) | 0.65 [0.26, 1.62] |
| 1.2 HF (secondary to IHD) | 15 | 645 | Risk Ratio (M‐H, Random, 95% CI) | 0.33 [0.14, 0.82] |
| 1.3 Refractory/intractable angina | 7 | 442 | Risk Ratio (M‐H, Random, 95% CI) | 0.61 [0.11, 3.35] |
| 2 Mortality (all‐cause): long term follow‐up (≥ 12 months) Show forest plot | 21 | Risk Ratio (M‐H, Random, 95% CI) | Subtotals only | |
| 2.1 Chronic IHD | 9 | 389 | Risk Ratio (M‐H, Random, 95% CI) | 0.52 [0.27, 0.99] |
| 2.2 HF (secondary to IHD) | 9 | 401 | Risk Ratio (M‐H, Random, 95% CI) | 0.33 [0.19, 0.58] |
| 2.3 Refractory/intractable angina | 3 | 220 | Risk Ratio (M‐H, Random, 95% CI) | 0.11 [0.01, 0.91] |
| 3 NYHA classification: short term follow‐up (< 12 months) Show forest plot | 16 | Mean Difference (IV, Random, 95% CI) | Subtotals only | |
| 3.1 Chronic IHD | 6 | 296 | Mean Difference (IV, Random, 95% CI) | ‐0.43 [‐0.78, ‐0.07] |
| 3.2 HF (secondary to IHD) | 10 | 417 | Mean Difference (IV, Random, 95% CI) | ‐0.47 [‐1.02, 0.09] |
| 4 NYHA classification: long term follow‐up (≥ 12 months) Show forest plot | 9 | Mean Difference (IV, Random, 95% CI) | Subtotals only | |
| 4.1 Chronic IHD | 3 | 105 | Mean Difference (IV, Random, 95% CI) | ‐0.66 [‐0.91, ‐0.42] |
| 4.2 HF (secondary to IHD) | 6 | 241 | Mean Difference (IV, Random, 95% CI) | ‐0.92 [‐1.47, ‐0.37] |
| 5 CCS class: short term follow‐up (< 12 months) Show forest plot | 13 | Mean Difference (IV, Random, 95% CI) | Subtotals only | |
| 5.1 HF (secondary to IHD) | 8 | 363 | Mean Difference (IV, Random, 95% CI) | ‐0.25 [‐0.90, 0.40] |
| 5.2 Refractory/intractable angina | 5 | 245 | Mean Difference (IV, Random, 95% CI) | ‐0.78 [‐1.44, ‐0.11] |
| 6 Exercise capacity: short term follow‐up (< 12 months) Show forest plot | 11 | Std. Mean Difference (IV, Random, 95% CI) | Subtotals only | |
| 6.1 Chronic IHD | 4 | 114 | Std. Mean Difference (IV, Random, 95% CI) | 0.48 [‐0.26, 1.22] |
| 6.2 HF (secondary to IHD) | 4 | 260 | Std. Mean Difference (IV, Random, 95% CI) | 0.79 [0.04, 1.53] |
| 6.3 Refractory/intractable angina | 3 | 189 | Std. Mean Difference (IV, Random, 95% CI) | 0.26 [‐0.03, 0.55] |
| 7 LVEF (%) measured by MRI: short term follow‐up (< 12 months) Show forest plot | 10 | Mean Difference (IV, Random, 95% CI) | Subtotals only | |
| 7.1 Chronic IHD | 6 | 178 | Mean Difference (IV, Random, 95% CI) | 2.58 [‐0.16, 5.31] |
| 7.2 HF (secondary to IHD) | 4 | 195 | Mean Difference (IV, Random, 95% CI) | 2.50 [‐1.97, 6.97] |
| Outcome or subgroup title | No. of studies | No. of participants | Statistical method | Effect size |
| 1 Mortality (all‐cause): short term follow‐up (< 12 months) Show forest plot | 33 | Risk Ratio (M‐H, Random, 95% CI) | Subtotals only | |
| 1.1 Co‐interventions | 8 | 432 | Risk Ratio (M‐H, Random, 95% CI) | 0.74 [0.32, 1.70] |
| 1.2 No co‐interventions | 25 | 1205 | Risk Ratio (M‐H, Random, 95% CI) | 0.31 [0.13, 0.72] |
| 2 Mortality (all‐cause): long term follow‐up (≥ 12 months) Show forest plot | 21 | Risk Ratio (M‐H, Random, 95% CI) | Subtotals only | |
| 2.1 Co‐interventions | 6 | 312 | Risk Ratio (M‐H, Random, 95% CI) | 0.47 [0.26, 0.88] |
| 2.2 No co‐interventions | 15 | 698 | Risk Ratio (M‐H, Random, 95% CI) | 0.32 [0.19, 0.56] |
| 3 NYHA classification: short term follow‐up (< 12 months) Show forest plot | 17 | Mean Difference (IV, Random, 95% CI) | Subtotals only | |
| 3.1 Co‐interventions | 6 | 233 | Mean Difference (IV, Random, 95% CI) | ‐0.57 [‐1.20, 0.05] |
| 3.2 No co‐interventions | 11 | 508 | Mean Difference (IV, Random, 95% CI) | ‐0.37 [‐0.87, 0.13] |
| 4 LVEF (%) measured by MRI: short term follow‐up (< 12 months) Show forest plot | 12 | Mean Difference (IV, Random, 95% CI) | Subtotals only | |
| 4.1 Co‐interventions | 5 | 179 | Mean Difference (IV, Random, 95% CI) | 2.01 [‐0.26, 4.29] |
| 4.2 No co‐interventions | 7 | 260 | Mean Difference (IV, Random, 95% CI) | 3.55 [0.82, 6.27] |
| Outcome or subgroup title | No. of studies | No. of participants | Statistical method | Effect size |
| 1 Mortality (all‐cause) Show forest plot | 15 | Risk Ratio (M‐H, Random, 95% CI) | Subtotals only | |
| 1.1 Short term follow‐up (< 12 months) | 14 | 744 | Risk Ratio (M‐H, Random, 95% CI) | 0.69 [0.32, 1.50] |
| 1.2 Long term follow‐up (≥ 12 months) | 9 | 491 | Risk Ratio (M‐H, Random, 95% CI) | 0.42 [0.21, 0.87] |
| 2 Non‐fatal myocardial infarction Show forest plot | 11 | Risk Ratio (M‐H, Random, 95% CI) | Subtotals only | |
| 2.1 Short term follow‐up (< 12 months) | 6 | 288 | Risk Ratio (M‐H, Random, 95% CI) | 0.50 [0.05, 4.58] |
| 2.2 Long term follow‐up (≥ 12 months) | 5 | 345 | Risk Ratio (M‐H, Random, 95% CI) | 0.38 [0.15, 0.97] |
| 3 Rehospitalisation due to heart failure Show forest plot | 8 | Risk Ratio (M‐H, Random, 95% CI) | Subtotals only | |
| 3.1 Short term follow‐up (< 12 months) | 3 | 234 | Risk Ratio (M‐H, Random, 95% CI) | 0.65 [0.32, 1.32] |
| 3.2 Long term follow‐up (≥ 12 months) | 6 | 375 | Risk Ratio (M‐H, Random, 95% CI) | 0.63 [0.36, 1.09] |
| 4 Arrhythmias Show forest plot | 7 | Risk Ratio (M‐H, Random, 95% CI) | Subtotals only | |
| 4.1 Short term follow‐up (< 12 months) | 6 | 224 | Risk Ratio (M‐H, Random, 95% CI) | 0.77 [0.18, 3.21] |
| 4.2 Long term follow‐up (≥ 12 months) | 1 | 82 | Risk Ratio (M‐H, Random, 95% CI) | 0.42 [0.18, 0.99] |
| 5 Composite MACE Show forest plot | 3 | Risk Ratio (M‐H, Random, 95% CI) | Subtotals only | |
| 5.1 Short term follow‐up (< 12 months) | 2 | 59 | Risk Ratio (M‐H, Random, 95% CI) | 0.0 [0.0, 0.0] |
| 5.2 Long term follow‐up (≥ 12 months) | 3 | 141 | Risk Ratio (M‐H, Random, 95% CI) | 0.64 [0.38, 1.08] |
| 6 NYHA classification: short term follow‐up (< 12 months) Show forest plot | 5 | Mean Difference (IV, Random, 95% CI) | Subtotals only | |
| 6.1 Combined | 5 | 277 | Mean Difference (IV, Random, 95% CI) | ‐0.26 [‐0.59, 0.07] |
| 7 NYHA classification: long term follow‐up (≥ 12 months) Show forest plot | 1 | Mean Difference (IV, Random, 95% CI) | Subtotals only | |
| 7.1 Combined | 1 | 39 | Mean Difference (IV, Random, 95% CI) | ‐2.2 [‐2.70, ‐1.70] |
| 8 LVEF (%) measured by MRI: short term follow‐up (< 12 months) Show forest plot | 7 | Mean Difference (IV, Random, 95% CI) | Subtotals only | |
| 8.1 Combined | 7 | 249 | Mean Difference (IV, Random, 95% CI) | 2.92 [0.67, 5.17] |
| 9 LVEF (%) measured by MRI: long term follow‐up (≥ 12 months) Show forest plot | 1 | Mean Difference (IV, Random, 95% CI) | Subtotals only | |
| 9.1 Combined | 1 | 25 | Mean Difference (IV, Random, 95% CI) | ‐1.60 [‐8.70, 5.50] |
| Outcome or subgroup title | No. of studies | No. of participants | Statistical method | Effect size |
| 1 Mortality (all‐cause) Show forest plot | 26 | Risk Ratio (M‐H, Random, 95% CI) | Subtotals only | |
| 1.1 Short term follow‐up (< 12 months) | 25 | 1216 | Risk Ratio (M‐H, Random, 95% CI) | 0.58 [0.29, 1.16] |
| 1.2 Long term follow‐up (≥ 12 months) | 13 | 624 | Risk Ratio (M‐H, Random, 95% CI) | 0.43 [0.21, 0.86] |
| Outcome or subgroup title | No. of studies | No. of participants | Statistical method | Effect size |
| 1 Mortality (all‐cause) Show forest plot | 32 | Risk Ratio (M‐H, Random, 95% CI) | Subtotals only | |
| 1.1 Short term follow‐up (< 12 months) | 28 | 1449 | Risk Ratio (M‐H, Random, 95% CI) | 0.48 [0.26, 0.89] |
| 1.2 Long term follow‐up (≥ 12 months) | 17 | 883 | Risk Ratio (M‐H, Random, 95% CI) | 0.39 [0.25, 0.60] |