Tratamiento con células madre para la cardiopatía isquémica crónica y la insuficiencia cardíaca congestiva
Resumen
Antecedentes
El uso de células madre constituye un enfoque alentador en el tratamiento de la cardiopatía isquémica crónica y la insuficiencia cardíaca congestiva. En la última década se ha realizado un gran número de ensayos controlados aleatorios en todo el mundo que han generado resultados contradictorios.
Objetivos
La evaluación crítica de las pruebas clínicas sobre la seguridad y la eficacia de las células madre/progenitoras derivadas de la médula ósea adulta y autólogas como tratamiento para la cardiopatía isquémica crónica y la insuficiencia cardíaca congestiva.
Métodos de búsqueda
Se hicieron búsquedas de ensayos relevantes en CENTRAL en la Cochrane Library, MEDLINE, Embase, CINAHL, LILACS, y en cuatro bases de datos de ensayos en curso hasta el 14 diciembre 2015.
Criterios de selección
Fueron elegibles los ensayos controlados aleatorios que compararon las células madre/progenitoras derivadas de la médula ósea adulta y autólogas con ninguna célula en pacientes con cardiopatía isquémica crónica e insuficiencia cardíaca congestiva. Cointervenciones como la angioplastia primaria, la cirugía o la administración de agentes movilizadores de células madre, se incluyeron cuando se administraron por igual a los brazos de tratamiento y control.
Obtención y análisis de los datos
Dos autores de la revisión examinaron de forma independiente todas las referencias según su elegibilidad, evaluaron la calidad de los ensayos y extrajeron los datos. Para realizar la evaluación cuantitativa de los datos se utilizaron metanálisis de efectos aleatorios. La heterogeneidad se evaluó mediante la estadística I2 y la heterogeneidad significativa (I2 mayor del 50%) se exploró mediante análisis de subgrupos. La calidad de las pruebas se evaluó mediante el enfoque GRADE. Se creó la tabla "Resumen de los hallazgos" mediante GRADEprofiler (GRADEpro), y se excluyeron los estudios con un riesgo alto o incierto de sesgo de selección. El resumen de los hallazgos se centró en el seguimiento a largo plazo de la mortalidad, los resultados de morbilidad y la fracción de eyección del ventrículo izquierdo medida con imagenología de resonancia magnética.
Resultados principales
En esta actualización de la revisión se incluyeron 38 ensayos controlados aleatorios con 1907 participantes (1114 recibieron tratamiento con células, 793 controles). El riesgo de selección en 23 ensayos fue alto o incierto. Otras fuentes de sesgo potencial incluyeron la falta de cegamiento de los participantes (12 ensayos) y el patrocinio total o parcial por la industria (13 ensayos).
El tratamiento con células redujo la incidencia de mortalidad a largo plazo (≥ 12 meses) (cociente de riesgos [CR] 0,42; intervalo de confianza [IC] del 95%: 0,21 a 0,87; participantes = 491; estudios = 9; I2 = 0%; pruebas de baja calidad). Los eventos adversos relacionados con el procedimiento asociados con el mapeo o con el procedimiento de inyección de células/placebo fueron poco frecuentes. El tratamiento con células también se asoció con una reducción a largo plazo en la incidencia de infarto de miocardio no mortal (CR 0,38; IC del 95%: 0,15 a 0,97; participantes = 345; estudios = 5; I2 = 0%; pruebas de baja calidad) y en la incidencia de arritmias (CR 0,42; IC del 95%: 0,18 a 0,99; participantes = 82; estudios = 1; pruebas de baja calidad). Sin embargo, no se encontraron pruebas de que el tratamiento con células afectara el riesgo de rehospitalización por insuficiencia cardíaca (CR 0,63; IC del 95%: 0,36 a 1,09; participantes = 375; estudios = 6; I2 = 0%; pruebas de baja calidad) ni de incidencia compuesta de mortalidad, infarto de miocardio no mortal o rehospitalización por insuficiencia cardíaca (CR 0,64; IC del 95%: 0,38 a 1,08; participantes = 141; estudios = 3; I2 = 0%; pruebas de baja calidad), ni afectara la fracción de eyección del ventrículo izquierdo a largo plazo cuando se midió con imagenología de resonancia magnética (diferencia de medias ‐1,60; IC del 95%: ‐8,70 a 5,50; participantes = 25; estudios = 1; pruebas de baja calidad).
Conclusiones de los autores
Esta revisión sistemática y metanálisis encontraron pruebas de baja calidad de que el tratamiento con células madre/progenitoras derivadas de la médula ósea reduce la mortalidad y mejora la fracción de eyección del ventrículo izquierdo al seguimiento a corto y a largo plazo, y puede reducir la incidencia del infarto de miocardio no mortal y mejorar la New York Heart Association (NYHA) Functional Classification en los pacientes con cardiopatía isquémica crónica e insuficiencia cardíaca congestiva. Estos resultados se deben interpretar con cuidado porque las tasas de eventos fueron generalmente bajas, lo que dio lugar a falta de precisión.
PICOs
Resumen en términos sencillos
Tratamiento con células madre para la cardiopatía isquémica crónica y la insuficiencia cardíaca congestiva
Pregunta de la revisión
¿Las células adultas madre/progenitoras derivadas de la médula ósea son seguras y efectivas como tratamiento para la cardiopatía isquémica crónica y la insuficiencia cardíaca?
Antecedentes
El tratamiento actual de los pacientes que presentan cardiopatía e insuficiencia cardíaca se basa en medicamentos y, cuando es posible, la restauración de la irrigación de sangre en el corazón (revascularización) mediante la abertura de las arterias con un globo diminuto en un procedimiento llamado angioplastia primaria (o intervención coronaria percutánea) o mediante cirugía cardíaca (o injerto de derivación de las arterias coronarias). La revascularización ha reducido la tasa de mortalidad asociada con estos trastornos. En algunos pacientes la cardiopatía y los síntomas de insuficiencia cardíaca persisten incluso después de la revascularización. Recientemente, las células madre/progenitoras de la médula ósea se han investigado como un nuevo tratamiento para los pacientes con cardiopatía e insuficiencia cardíaca, reciban o no también tratamiento de revascularización.
Fecha de la búsqueda
Se efectuaron búsquedas en las bases de datos electrónicas de los ensayos controlados aleatorios relevantes hasta diciembre de 2015.
Características de los estudios
En esta revisión se incluyeron 38 ensayos controlados aleatorios con más de 1900 participantes, con 14 ensayos de cardiopatía isquémica crónica, 17 ensayos de insuficiencia cardíaca isquémica secundaria a cardiopatía y siete ensayos de angina resistente al tratamiento o intratable. La media de edad de los participantes varió de 55 a 70 años, y la proporción de participantes masculinos varió del 51% al 100%.
Resultados clave
Los resultados indicaron que el tratamiento con células derivadas de la médula ósea puede dar lugar a una reducción en las muertes de los participantes seguidos durante al menos 12 meses. En general los eventos adversos que ocurrieron alrededor del momento del tratamiento fueron poco frecuentes. Los participantes que recibieron tratamiento con células también presentaron menos ataques cardíacos y arritmias en comparación con los que no recibieron células. Sin embargo, el tratamiento con células no parece reducir el riesgo de rehospitalización por insuficiencia cardíaca ni el riesgo combinado de muerte, ataque cardíaco no mortal o rehospitalización, y no dio lugar a ninguna mejoría con respecto al tratamiento estándar en las pruebas de función cardíaca. Estos resultados indican que el tratamiento con células puede ser beneficioso en los pacientes con cardiopatía isquémica crónica o insuficiencia cardíaca, o ambos.
Calidad de la evidencia
La calidad de las pruebas fue baja, ya que el número de estudios y participantes incluidos actualmente no es suficientemente alto para establecer conclusiones consistentes. Trece estudios recibieron financiamiento comercial, de los cuales cuatro fueron patrocinados completamente, y 12 estudios no informaron que los participantes estuvieran cegados al tratamiento que recibieron. Se requieren estudios de investigación adicionales que incluyan un gran número de participantes para confirmar los resultados.
Conclusiones de los autores
Summary of findings
| Bone marrow‐derived cell therapy for people with chronic ischaemic heart disease and congestive heart failure | ||||||
| Patient or population: people with chronic ischaemic heart disease and congestive heart failure Comparison: no cell therapy | ||||||
| Outcomes | Illustrative comparative risks* (95% CI) | Relative effect | No of Participants | Quality of the evidence | Comments | |
| Assumed risk | Corresponding risk | |||||
| No cell therapy | Bone marrow‐derived cell therapy | |||||
| Mortality (all cause) Long‐term follow‐up (≥ 12 months) | 102 per 1000 | 43 per 1000 | RR 0.42 | 491 | ⊕⊕⊝⊝ | The required information size of 1899 participants to detect a RRR of 35% has not been reached. |
| Periprocedural adverse events | See comment | See comment | Not estimable | 1695 (34 studies) | See comment | Adverse events occurring during the mapping or cell/placebo injection procedure included ventricular tachycardia (7), ventricular fibrillation (1), atrial fibrillation (1), transient complete heart block (1), transient pulmonary oedema (3), thrombus on mapping catheter tip (1), visual disturbances (2), myocardial perforation (2), limited retrograde catheter‐related dissection of the abdominal aorta (1). |
| Non‐fatal myocardial infarction Long‐term follow‐up (≥ 12 months) | 83 per 1000 | 31 per 1000 | RR 0.38 | 345 | ⊕⊕⊝⊝ | The required information size of 2383 participants to detect a RRR of 35% has not been reached. |
| Rehospitalisation due to heart failure Long‐term follow‐up (≥ 12 months) | 155 per 1000 | 98 per 1000 | RR 0.63 | 375 | ⊕⊕⊝⊝ | The required information size of 1193 participants to detect a RRR of 35% has not been reached. |
| Arrhythmias Long‐term follow‐up (≥ 12 months) | 333 per 1000 | 140 per 1000 | RR 0.42 | 82 | ⊕⊕⊝⊝ | The required information size of 461 participants to detect a RRR of 35% has not been reached. |
| Composite MACE Long‐term follow‐up (≥ 12 months) | 350 per 1000 | 224 per 1000 | RR 0.64 | 141 | ⊕⊕⊝⊝ | The required information size of 431 participants to detect a RRR of 35% has not been reached. |
| LVEF (%) measured by MRI Long‐term follow‐up (≥ 12 months) | ‐ | The mean LVEF (%) measured by MRI in the intervention groups was 1.6 lower (8.7 lower to 5.5 higher). | ‐ | 25 | ⊕⊕⊝⊝ | The required information size of 322 participants to detect a mean difference of 4% has not been reached. |
| *The risk in the intervention group (and its 95% confidence interval) is based on the assumed risk in the comparison group and the relative effect of the intervention (and its 95% CI). ¶Only studies with a low risk of selection bias are included. | ||||||
| GRADE Working Group grades of evidence | ||||||
| 1Six trials received full or partial commercial funding, which could have resulted in a biased assessment of the intervention effect and were therefore deemed to have a high risk of bias. One trial was not blinded (high risk of performance bias) and had a high risk of attrition bias. | ||||||
Antecedentes
Descripción de la afección
La cardiopatía isquémica (CI) es una carga sanitaria importante en todo el mundo (BHF 2014). La supervivencia después del infarto de miocardio (IM) ha aumentado en años recientes debido a técnicas de revascularización de última generación como la intervención coronaria percutánea (ICP) y el injerto de derivación de las arterias coronarias (IDAC) (Skinner 2011). Por otra parte, el número de personas con insuficiencia cardíaca congestiva (ICC) se ha tornado rápidamente en una epidemia (Ambrosy 2014; Lloyd‐Jones 2002). Por lo tanto, la prevención de la progresión de la CI y el desarrollo de ICC aún es un desafío.
En la CI, puede haber tejido cicatrizal no contráctil que ha reemplazado el miocardio dañado, lo que podría causar daño adicional. El corazón también puede evitar la muerte de más cardiomiocitos al reducir las exigencias de energía de la contracción, lo que da lugar a un miocardio que no se contrae o en hibernación. Esta respuesta fisiológica característica al estrés hipóxico crónico, que es identificable por las anomalías en la función contráctil, se puede revertir potencialmente por la revascularización del miocardio en hibernación para restaurar la función cardíaca (Taggart 2012). En algunos casos, la revascularización no es posible o puede no ser completa, y en los casos con miocardiopatía no isquémica la revascularización no es relevante y los síntomas de isquemia miocárdica crónica, a veces con angina de pecho resistente al tratamiento, aún están presentes (Taggart 2012).
Enfoques alternativos y complementarios en el tratamiento de la ICC están en desarrollo, en forma de tratamientos con células para la ICC. La justificación para desarrollar los tratamientos con células para la CI se basa en la noción de que el corazón tiene una capacidad limitada para repararse por sí mismo después de una lesión grave. Estudios preclínicos y clínicos han indicado que los tratamientos con células podrían revertir potencialmente la disfunción ventricular izquierda en la CI crónica y la ICC (Heldman 2014; Perin 2012a).
Descripción de la intervención
El procedimiento actualmente es el siguiente: la médula ósea se extrae del receptor o las células madre/progenitoras se movilizan a la circulación mediante un factor estimulante del crecimiento (conocido con mayor frecuencia como factor estimulante de colonias de granulocitos [G‐CSF, por sus siglas en inglés]) (Assmus 2006; Erbs 2005). En el primer procedimiento, las células por lo general se recolectan (a veces bajo anestesia general) del hueso pélvico, con el uso de agujas de succión grandes. Las células madre/progenitoras posteriormente se separan de otras células de la médula ósea en condiciones estériles (Assmus 2006). La obtención de las células de la médula ósea y los procedimientos de separación de las células pueden demorar varias horas. En el procedimiento de movilización con G‐CSF, las células progenitoras o las células mononucleares se recogen como una muestra de sangre y luego se separan de otras células sanguíneas en condiciones estériles (Erbs 2005). En ambos procedimientos, las células se infunden directamente en las arterias coronarias o en el corazón del receptor (Ang 2008; Hamshere 2015). El primer procedimiento administra las células a las arterias coronarias a través de un catéter balón especial durante la angioplastia (p.ej. intervención coronaria percutánea) mediante una técnica de interrupción del flujo (Ang 2008; Hamshere 2015). El segundo procedimiento administra las células en el músculo cardíaco durante un procedimiento similar a la angioplastia con el uso de mapeo electromecánico y una inyección intramiocárdica directa (p.ej. sistema NOGA) o durante la cirugía cardíaca (p.ej. injerto de derivación de las arterias coronarias) (Ang 2008; Hamshere 2015), aunque esta opción puede estar limitada por los costos elevados asociados con el procedimiento percutáneo del NOGA. El intervalo entre la obtención de las células y su reinfusión varía; algunas se administran frescas y a otras se les realiza alguna forma de cultivo y expansión ex vivo que podría tomar de dos a tres semanas (Assmus 2006; Bartunek 2012; Mathiasen 2015).
Generalmente un hematólogo realiza la obtención de las células. Un científico o técnico especializado realiza la separación de las células madre de las otras células de la médula ósea, y el cardiólogo o el cirujano cardíaco realizan la infusión o la inyección intramiocárdica de las células.
Los efectos adversos asociados con la administración de las células de la médula ósea sanguíneas como tratamiento para los pacientes con CI crónica o ICC son poco frecuentes y en general no son graves (Behfar 2014). En los ensayos en los que el G‐CSF se administra antes de la obtención de las células madre se pueden presentar complicaciones transitorias causadas por el tratamiento con G‐CSF. Sin embargo, no se han informado efectos adversos a largo plazo.
En la actualidad, este tratamiento sólo está disponible en establecimientos asociados con la investigación aunque es posible que, si se confirma la efectividad a largo plazo, este procedimiento podría estar disponible para algunos o todos los pacientes con cardiopatía crónica, debido a que la obtención de la médula ósea y la sangre periférica es un procedimiento estándar utilizado en el trasplante de médula ósea. Los costos pueden ser elevados, según los procedimientos utilizados, y actualmente se relacionan con los costos de la obtención de las células y su procesamiento (aproximadamente la décima parte del costo global del ensayo). La posibilidad de un ensayo controlado aleatorio multicéntrico grande (ECA) está limitada por los fondos y por los resultados contradictorios de los ECA anteriores.
De qué manera podría funcionar la intervención
Los ensayos clínicos en los que se les han administrado células derivadas de la médula ósea a pacientes con CI o ICC han obtenido resultados divergentes, por lo que el mecanismo de acción de dichos tratamientos aún no está claro. Por lo tanto, la selección del tipo de células óptimo y de la cohorte de pacientes óptimos para ser tratados es un reto. Aunque la incorporación en los vasos sanguíneos y la generación directa de cardiomiocitos se han propuesto como mecanismos de acción (Beltrami 2003; Carr 2008; Martin‐Rendon 2008a; Mathur 2004; Stuckey 2006; Yoon 2005), actualmente se acepta que un mecanismo paracrino puede ser la contribución principal para promover la reparación cardíaca y limitar la fibrosis en el miocardio dañado (Ibrahim 2016; Li 2012).
Por qué es importante realizar esta revisión
Los tratamientos con células tienen la posibilidad de convertirse en una forma de tratamiento nueva y apasionante para muchas enfermedades. La cardiopatía es uno de los contextos clínicos en los que es posible considerar esta nueva forma de tratamiento, aunque aún no se ha definido la función clínica exacta del tratamiento con células madre. El tratamiento con células para la cardiopatía isquémica es un tratamiento experimental que no tiene una amplia disponibilidad y no es parte de la práctica clínica estándar. Actualmente no hay guías clínicas para la administración de los tratamientos con células para la cardiopatía isquémica y la insuficiencia cardíaca. Las pruebas de ensayos y revisiones sistemáticas más antiguos han indicado que el tratamiento con células puede dar lugar a algunas mejorías en comparación con el tratamiento convencional cuando se mide a través de pruebas alternativas de la función cardíaca (Abdel‐Latif 2007; Assmus 2006; Chen 2006; Jeevanantham 2012). Revisiones sistemáticas y metanálisis más recientes han mostrado resultados contradictorios (Afzal 2015; Fisher 2015b). Una revisión Cochrane reciente concluyó que no hay pruebas suficientes de un efecto beneficioso del tratamiento con células en los pacientes con infarto agudo de miocardio; la mayoría de las pruebas provinieron de ensayos pequeños que no mostraron diferencias en resultados clínicamente relevantes (Fisher 2015a). Sin embargo, al parecer hay pruebas consistentes que indican que los tratamientos con células tuvieron un efecto beneficioso en los pacientes con insuficiencia cardíaca (Fisher 2016).
Una revisión Cochrane del tratamiento con células en pacientes con CI crónica e ICC incluyó 23 ECA y encontró algunas pruebas de que las células derivadas de la médula ósea mejoran la fracción de eyección del ventrículo izquierdo (FEVI), reducen el número de muertes y se asocian con mejores medidas de funcionamiento a largo plazo (Fisher 2014). Desde la publicación de la revisión original se han publicado varios ensayos nuevos clave (Heldman 2014_BMMNC; Heldman 2014_BM‐MSC; Jimenez‐Quevedo 2011; Mathiasen 2015; Nasseri 2012; Patel 2015; Patila 2014; Santoso 2014; Trifunovic 2015; Wang 2014; Wang 2015). Es importante actualizar la revisión con estos nuevos ensayos para reevaluar y mejorar la calidad de las pruebas disponibles.
Objetivos
La evaluación crítica de las pruebas clínicas sobre la seguridad y la eficacia de las células madre/progenitoras derivadas de la médula ósea adulta y autólogas como tratamiento para la CI crónica y la ICC.
Métodos
Criterios de inclusión de estudios para esta revisión
Tipos de estudios
Ensayos controlados con asignación aleatoria (ECA).
Tipos de participantes
Pacientes con diagnóstico clínico de CI o ICC, con la exclusión de los pacientes con infarto agudo de miocardio. Los estudios que evaluaron la enfermedad isquémica y no isquémica sólo se incluyeron si fue posible extraer por separado los datos de los participantes con enfermedad isquémica.
Tipos de intervenciones
Estudios que incluyeran la administración de células madre/progenitoras derivadas de la médula ósea adulta y autólogas de forma aislada o en combinación con otras intervenciones, como la cirugía cardíaca, como tratamiento para la CI o la ICC.
Los participantes del brazo de tratamiento comparador del ensayo recibieron ninguna intervención o placebo (p.ej. el medio en el que las células madre estaban suspendidas o plasma). Los ensayos en los que además se administraron cointervenciones (p.ej. IDAC, ICP, G‐CSF, tratamiento con onda de choque extracorpórea) fueron elegibles siempre que las cointervenciones fueran iguales en ambos brazos y se les administraran a una proporción equivalente de participantes.
En resumen:
-
cualquier célula madre/progenitora derivada de la médula ósea adulta humana y autóloga
-
cualquier dosis única
-
cualquier método de aislamiento de las células madre/progenitoras
-
cualquier vía de administración
-
cualquier cointervención
-
repetición de la intervención o múltiples dosis
Tipos de medida de resultado
Resultados primarios
-
Mortalidad
-
Eventos adversos relacionados con el procedimiento (definidos como los que ocurren en el momento de la aspiración de la médula ósea o de la administración del tratamiento con células [o placebo], o los eventos adversos documentados en el transcurso de los 30 días de tratamiento)
Resultados secundarios
-
Morbilidad: IM no mortal, rehospitalización por insuficiencia cardíaca (IC), arritmias, medida compuesta de eventos adversos clínicos graves (MACE, mortalidad, IM no mortal, o rehospitalización por IC)
-
Calidad de vida (CdV) relacionada con la salud
-
Estado funcional (p.ej. clasificación de la New York Heart Association [NYHA], clase de la Canadian Cardiovascular Society [CCS], capacidad de ejercicio)
-
Fracción de eyección del ventrículo izquierdo (FEVI).
Los resultados beneficiosos se dividieron en variables de evaluación alternativas o basadas en datos clínicos. En el estadio del protocolo de esta revisión, se había intentado considerar las variables de evaluación clínicas y alternativas a los 30 días, seis meses y 12 meses después del inicio; sin embargo, lo anterior no fue posible debido a la variación en los períodos de seguimiento informados en los estudios individuales. Por lo tanto, se estratificaron los datos de resultado en seguimiento a corto plazo (hasta 12 meses) y a largo plazo (12 meses o más). El alcance de esta versión de la revisión fue evaluar el efecto clínico beneficioso o perjudicial de los tratamientos con células en los pacientes con cardiopatía isquémica e insuficiencia cardíaca, por lo que la revisión se centró en los resultados clínicos. Sin embargo, el resultado alternativo FEVI es una medida alternativa estándar ampliamente informada de la función cardíaca y se ha mantenido como punto de referencia en otros ensayos y revisiones sistemáticas de la IC. Se excluyeron otros resultados alternativos diferentes de la FEVI informados en las versiones anteriores de esta revisión, a saber, injerto funcionante y supervivencia de las células infundidas, volumen sistólico final, volumen diastólico final, puntuación de movimiento de la pared e índice de volumen sistólico, según el Grupo Cochrane de Corazón (Cochrane Heart Group). Sin embargo, se consideró que los resultados alternativos relevantes como los volúmenes del ventrículo izquierdo pueden ser más significativos que la FEVI y como tal, estos resultados alternativos se considerarán en la próxima actualización de esta revisión.
Results
Description of studies
Results of the search
We identified a total of 20,646 references from the electronic database searches. De‐duplication and removal of all clearly irrelevant references by the Information Specialist (CD) excluded 14,955 references. Initial screening of the remaining 5691 citations against inclusion criteria excluded a further 5486 references. Of the remaining 205 citations, we subsequently excluded 70 references (describing 54 independent studies), as they did not fully meet the inclusion criteria (see Excluded studies). Five further references described four independent study protocols (see Ongoing studies). Ten studies (12 references) were published in abstract form only, and although they appeared to meet the inclusion criteria, they did not contain sufficient data for inclusion; we have identified these as Studies awaiting classification. The remaining 118 citations describe a total of 38 independent RCTs (see Included studies). A summary of study classification is displayed in a PRISMA flow diagram (Figure 1).

PRISMA flow diagram.
Searching of ongoing trial databases identified 1302 trial records. De‐duplication and removal of clearly irrelevant trials by the Information Specialist (CD) excluded 949 records. Of the remaining 353 records, 22 described included studies and 31 were ongoing trials that met the eligibility criteria and are shown in Ongoing studies.
Included studies
Thirty‐eight studies met the inclusion criteria for this review, including a total of 1907 randomised participants (1114 bone marrow‐derived stem/progenitor cells and 793 controls) who were assessed for the primary outcomes of the study. Sixteen independent trials are new to this review update (Bartunek 2012; Hamshere 2015_IC; Hamshere 2015_IM; Heldman 2014_BMMNC; Heldman 2014_BM‐MSC; Jimenez‐Quevedo 2011; Mathiasen 2015; Mozid 2014_IC; Mozid 2014_IM; Nasseri 2012; Patel 2015; Patila 2014; Santoso 2014; Trifunovic 2015; Wang 2014; Wang 2015), representing an approximately 70% increase in the number of included participants from the previous version of the review. One study included in the original review was excluded in this update, as the co‐intervention of G‐CSF administered to the cell therapy group was not given to the control group (Kang 2006). See Table 1 for a summary of study participants.
| Study ID | Country of study | Patient population | Mean (SD) age of participants (years) | % Male | No. randomised participants receiving intervention | No. randomised participants receiving comparator | Mean duration of follow‐up |
| UK | CIHD (> 1 chronic myocardial scar; elective CABG) | BMMNC‐IM: 64.7 (8.7) BMMNC‐IC: 62.1 (8.7) Controls: 61.3 (8.3) | BMMNC‐IM: 71.4% BMMNC‐IC: 90.5% Controls: 90.0% | 42 (21 IM, 21 IC) | 21 | 6 months | |
| Germany | CIHD (MI > 3 months; LV dysfunction) | BMMNC: 59 (12) CPC: 54 (12) Controls: 61 (9) | BMMNC: 89% CPC: 79% Controls: 100% | 52 (28 MNC, 24 CPC) | 23 | 3 months | |
| Germany | CIHD (MI > 3 months; LVEF < 50%; NYHA class II or greater) | BMMNC‐LDSW: 65 (12) BMMNC‐HDSW: 58 (11) Controls‐LDSW: 60 (10) Controls‐HDSW: 63 (10) | BMMNC‐LDSW: 77% BMMNC‐HDSW: 86% Controls‐LDSW: 80% Controls‐HDSW: 90% | 43 (22 LDSW, 21 HDSW) | 39 (20 LDSW, 19 HDSW) | 45.7 (17) months | |
| Belgium/ Serbia/ Switzerland | HF (LVEF 15% to 40%; ischaemic event > 2 months) | BM‐MSC: 55.3 (SE 10.4) Controls: 58.7 (SE 8.2) | BM‐MSC: 90.5% Controls: 86.7% | 32 | 15 | 24 months | |
| China | CIHD (isolated, chronic LAD; LVEF < 40%) | BM‐MSC: 59.3 (6.8) Controls: 57.8 (7.2) | BM‐MSC: 88% Controls: 92% | 24 | 24 | 12 months | |
| Germany | CIHD (chronic total occlusion; myocardial ischaemia) | CPC: 63 (7) Controls: 61 (9) | CPC: 71% Controls: 86% | 14 | 14 | 15 months | |
| UK | HF (NYHA class II‐IV; no revascularisation options) | BMMNC: n/r Controls: n/r | BMMNC: n/r Controls: n/r | 15 | 15 | 12 months | |
| UK | HF (NYHA class II‐IV; no revascularisation options) | BMMNC: n/r Controls: n/r | BMMNC: n/r Controls: n/r | 15 | 15 | 12 months | |
| USA | CIHD (chronic MI; LV dysfunction) | BMMNC: 61.1 (8.4) Controls: 61.3 (9.0) | BMMNC: 89.5% Controls: 100% | 22 | 10 | 12 months | |
| USA | CIHD (chronic MI; LV dysfunction) | BM‐MSC: 57.1 (10.6) Controls: 60.0 (12.0) | BM‐MSC: 94.7% Controls: 90.9% | 22 | 11 | 12 months | |
| Belgium | CIHD (transmural MI; LV dysfunction; elective CABG) | BMMNC: 63.2 (8.5) Controls: 66.8 (9.2) | BMMNC: 100% Controls: 70% | 11 | 12 | 4 months | |
| Germany | CIHD (MI > 3 months; LV regional wall motion abnormality) | CPC: 53.4 (12.3) Controls: 58.8 (7.3) | CPC: 82% Controls: 100% | 23 | 10 | 60 months | |
| China | HF (MI > 3 months; LVEF < 30%; elective CABG) | BMMNC: 56.6 (9.7) Controls: 58.3 (8.9) | BMMNC: 88% Controls: 96% | 31 | 29 | 12 months | |
| Spain | Refractory angina (CCS class II‐IV) | CD133+: median 70.0 Controls: median 58.2 | CD133+: 78.9% Controls: 100% | 19 | 9 | 6 months | |
| USA | Refractory angina (CCS class III‐IV) | CD34+/controls pooled: 62.4 (range 48 to 84) | CD34+/controls pooled: 80% | 18 (6 LD, 6 MD 6, HD) | 6 | 6 months | |
| USA | Refractory angina (CCS class III‐IV) | CD34+/LD: 61.3 (9.1) CD34+/HD: 59.8 (9.2) Controls: 61.8 (8.5) | CD34+/LD: 83.6% CD34+/HD: 87.5% Controls: 89.3% | 112 (56 LD, 56 HD) | 56 | 12 months | |
| Denmark | HF (NYHA class II‐III; LVEF < 45%; no revascularisation options) | BM‐MSC: 66.1 (7.7) Controls: 64.2 (10.6) | BM‐MSC: 90% Controls: 70% | 40 | 20 | 6 months | |
| UK | HF (NYHA class II‐IV; no revascularisation options) | BMMNC/controls pooled (16 participants): 70 (10) | BMMNC/controls pooled (16 participants): 94% | 14 | 2 | 6 months | |
| UK | HF (NYHA class II‐IV; no revascularisation options) | BMMNC/controls pooled (18 participants): 64 (9) | BMMNC/controls pooled (18 participants): 100% | 10 | 8 | 6 months | |
| Germany | HF (LVEF < 35%; elective CABG) | CD133+: 61.9 (7.3) Controls: 62.7 (10.6) | CD133+: 93% Controls: 97% | 30 | 30 | 6 months | |
| Argentina | HF (LVEF < 35%; NYHA class III‐IV; elective CABG) | CD34+: 64.8 (7.1) Controls: 63.6 (5.2) | CD34+: 80% Controls: 80% | 25 | 25 | 10 years | |
| USA/Germany/India | HF (LVEF < 40%; NYHA class III‐IV) | BMAC: 58.5 (12.7) Controls: 52.7 (8.5) | BMAC: 91.7% Controls: 100% | 24 | 6 | 12 months | |
| Finland | HF (LVEF 15% to 40%; NYHA class II‐IV; elective CABG) | BMMNC: median 65 (range 57 to 73) Controls: median 64 (range 58 to 70) | BMMNC: 94.7% Controls: 95.0% | 20 | 19 | 12 months | |
| USA | HF (angina/HF symptoms; chronic CAD; LVEF < 40%; no revascularisation options) | BMMNC: 56.3 (8.6) Controls: 60.5 (6.4) | BMMNC: 50% Controls: 80% | 20 | 10 | 6 months | |
| USA | HF (CCS class II‐IV or NYHA class II‐III, or both; LVEF < 45%; no revascularisation options) | BMMNC: 64.0 (10.9) Controls: 62.3 (8.3) | BMMNC: 86.9% Controls: 93.7% | 61 | 31 | 6 months | |
| USA | HF (CCS class II‐IV or NYHA class II‐III, or both; LVEF < 45%; no revascularisation options) | ALDH+: 58.2 (6.1) Controls: 57.8 (5.5) | ALDH+: 90% Controls: 80% | 10 | 10 | 6 months | |
| Russia | HF (LVEF < 35%; no revascularisation options) | BMMNC: 61 (9) Controls: 62 (5) | BMMNC: 87% Controls: 85% | 55 | 54 | 12 months | |
| Indonesia/China | HF (NYHA class III‐IV; LVEF < 40%; no revascularisation options) | BMMNC: 58 (5.9) Controls: 60 (5.6) | BMMNC: 95% Controls: 100% | 19 | 9 | 6 months | |
| Serbia | CIHD (MI < 30 days; LVEF < 40%; NYHA class III‐IV; elective CABG) | BMMNC: 53.8 (10.1) Controls: 60.0 (6.8) | BMMNC: 93.3% Controls: 93.3% | 15 | 15 | Median 5 years (IQR 2.5 to 7.5) | |
| China/Australia | Refractory angina (CCS class III‐IV) | BMMNC: 65.2 (8.3) Controls: 68.9 (6.3) | BMMNC: 79% Controls: 88% | 19 | 9 | 6 months | |
| Germany | CIHD (MI > 3 months; LV dysfunction) | BMMNC: 62 (10) Controls: 60 (9) | BMMNC: 52.6% Controls: 55.6% | 38 | 18 | 12 months | |
| The Netherlands | Refractory angina (CCS class II‐IV) | BMMNC: 64 (8) Controls: 62 (9) | BMMNC: 92% Controls: 80% | 25 | 25 | 6 months | |
| China | Refractory angina (MI > 1 month) | CD34+: 60.6 (n/r) Controls: 60.0 (n/r) | CD34+: 56.3% Controls: 63.3% | 16 | 16 | 6 months | |
| China | Refractory angina (CCS class III‐IV) | CD34+: range 42 to 80 Controls: range 43 to 80 | CD34+: 51.8% Controls: 50.0% | 56 | 56 | 6 months | |
| China | CIHD (LVEF < 35%) | CD133+: n/r Controls: n/r | CD133+: n/r Controls: n/r | 35 | 35 | 6 months | |
| China | CIHD (multivessel disease; MI > 4 weeks; elective CABG) | BMMNC: 61.4 (7.5) Controls: 62.9 (6.9) | BMMNC: 82% Controls: 78% | 45 | 45 | 6 months | |
| China | CIHD (MI > 6 months) | BMMNC: 54.8 (11.5) Controls: 56.3 (7.9) | BMMNC: 96% Controls: 96% | 24 | 23 | 6 months | |
| China | HF (LVEF < 40%; elective CABG) | BMMNC: 60.3 (10.4) Controls: 59.1 (15.7) | BMMNC: 83.3% Controls: 83.3% | 18 | 18 | 6 months |
ALDH: aldehyde dehydrogenase
BMAC: bone marrow aspirate concentrate
BMMNC: bone marrow mononuclear cells
BM‐MSC: bone marrow‐derived mesenchymal stem cells
CABG: coronary artery bypass grafting
CCS: Canadian Cardiovascular Society
CIHD: chronic ischaemic heart disease
CPC: circulating progenitor cells
EF: ejection fraction
HD: high dose
HDSW: high dose shockwave
HF: heart failure
IC: intracoronary
IM: intramyocardial
IQR: interquartile range
LAD: left ventricular assist device
LD: low dose
LDSW: low dose shockwave
LV: left ventricular
LVEF: left ventricular ejection fraction
MD: medium dose
MI: myocardial infarction
MNC: mononuclear cells
n/r: not reported
NYHA: New York Heart Association
SD: standard deviation
SE: standard error
SW: shockwave
The mean age of participants ranged from 55 to 70 years, and the proportion of men ranged from 50.9% to 100%. All trials were presented as full journal articles, with the exception of three trials that were published in the form of a conference abstract (Hamshere 2015_IC; Hamshere 2015_IM; Wang 2014), and two trials that reported additional long‐term follow‐up results in abstract form only (Assmus 2013; Patel 2005). Nine studies were multicentre trials (Bartunek 2012; Jimenez‐Quevedo 2011; Losordo 2007; Losordo 2011; Patel 2015; Perin 2011; Perin 2012a; Santoso 2014; Tse 2007). Studies were based worldwide, including China (Chen 2006; Hu 2011; Wang 2009; Wang 2010; Wang 2014; Wang 2015; Yao 2008; Zhao 2008), Germany (Assmus 2006; Assmus 2013; Erbs 2005; Honold 2012; Nasseri 2012; Turan 2011), the United States (Heldman 2014_BMMNC; Heldman 2014_BM‐MSC; Losordo 2007; Losordo 2011; Perin 2011; Perin 2012a; Perin 2012b), the United Kingdom (Ang 2008; Hamshere 2015_IC; Hamshere 2015_IM; Mozid 2014_IC; Mozid 2014_IM), Spain (Jimenez‐Quevedo 2011), Belgium (Hendrikx 2006), Denmark (Mathiasen 2015), the Netherlands (Van Ramshorst 2009), Finland (Patila 2014), Serbia (Trifunovic 2015), Russia (Pokushalov 2010), Argentina (Patel 2005), Hong Kong/Australia (Tse 2007), Indonesia/China (Santoso 2014), Belgium/Serbia/Switzerland (Bartunek 2012), and USA/Germany/India (Patel 2015). Two studies included publications in Chinese (Hu 2011; Wang 2009), which were translated into English for this review.
Fourteen studies included participants with chronic IHD (Ang 2008; Assmus 2006; Assmus 2013; Chen 2006; Erbs 2005; Heldman 2014_BMMNC; Heldman 2014_BM‐MSC; Hendrikx 2006; Honold 2012; Trifunovic 2015; Turan 2011; Wang 2014; Wang 2015; Yao 2008), normally defined as multivessel disease with persistent ischaemia and at least 30 days from the last MI. Seventeen studies included participants with CHF, defined as severe ischaemic HF and postinfarction HF (secondary to IHD) (Bartunek 2012; Hamshere 2015_IC; Hamshere 2015_IM; Hu 2011; Mathiasen 2015; Mozid 2014_IC; Mozid 2014_IM; Nasseri 2012; Patel 2005; Patel 2015; Patila 2014; Perin 2011; Perin 2012a; Perin 2012b; Pokushalov 2010; Santoso 2014; Zhao 2008), and seven studies were of people with intractable or refractory angina (Jimenez‐Quevedo 2011; Losordo 2007; Losordo 2011; Tse 2007; Van Ramshorst 2009; Wang 2009; Wang 2010). One trial also included people with non‐ischaemic heart disease (Patel 2015), but reported results separately so that only participants with ischaemic disease are included in this review. All trials maintained participants with a standard set of drugs including aspirin, clopidogrel, heparin, blockers, statins, angiotensin converting enzyme (ACE) inhibitors, nitrates, and/or diuretics.
Duration of follow‐up ranged from three months (Assmus 2006), four months (Hendrikx 2006), six months (Ang 2008; Jimenez‐Quevedo 2011; Losordo 2007; Mathiasen 2015; Mozid 2014_IC; Mozid 2014_IM; Nasseri 2012; Perin 2011; Perin 2012a; Perin 2012b; Santoso 2014; Tse 2007; Van Ramshorst 2009; Wang 2009; Wang 2010; Wang 2014; Wang 2015; Yao 2008; Zhao 2008), 12 months (Chen 2006; Hamshere 2015_IC; Hamshere 2015_IM; Heldman 2014_BMMNC; Heldman 2014_BM‐MSC; Hu 2011; Losordo 2011; Patel 2015; Patila 2014; Pokushalov 2010; Turan 2011), 15 months (Erbs 2005), 24 months (Bartunek 2012) up to a median 45 (17) months (Assmus 2013), 60 months (Honold 2012; Trifunovic 2015), and 10 years (Patel 2005).
See Table 2 for a summary of study interventions. Twenty‐seven trials isolated the stem cells by bone marrow aspiration and further separation of the mononuclear cells using density gradient centrifugation (Ang 2008; Assmus 2006; Assmus 2013; Bartunek 2012; Chen 2006; Heldman 2014_BMMNC; Heldman 2014_BM‐MSC; Hendrikx 2006; Hu 2011; Mathiasen 2015; Nasseri 2012; Patel 2005; Patila 2014; Perin 2011; Perin 2012a; Perin 2012b; Pokushalov 2010; Santoso 2014; Trifunovic 2015; Tse 2007; Turan 2011; Van Ramshorst 2009; Wang 2009; Wang 2010; Wang 2015; Yao 2008; Zhao 2008), and one trial isolated and concentrated the mononuclear cell fraction (Patel 2015). Three of these trials enriched the stem cell fraction in CD34‐positive haematopoietic progenitors by magnetic separation (Patel 2005; Wang 2009; Wang 2010), whilst one trial enriched the stem cell fraction in CD133‐positive cells (Nasseri 2012), and one trial in aldehyde dehydrogenase (ALDH)‐positive haematopoietic progenitors (Perin 2012b). Three trials cultured the mononuclear cell population from bone marrow ex vivo to enrich in mesenchymal progenitors (Chen 2006; Heldman 2014_BM‐MSC; Mathiasen 2015), whereas one trial cultured mononuclear cells and enriched them in cardiopoietic cells by exposure to cardiopoietic factors (Bartunek 2012). In one three‐arm trial (Assmus 2006), bone marrow mononuclear cells were compared with circulating progenitor cells (CPCs), and with mononuclear cells isolated from venous peripheral blood. In the CPC arm, cells were isolated from peripheral blood by leukapheresis.
| Study ID | Co‐intervention | Intervention given by: | Route of cell administration | Intervention cell type | How are cells obtained? | What were they resuspended in? | Dose administered? | Comparator arm (placebo or control) |
| CABG | Cardiothoracic surgeon | IC or IM | BMMNC | BM aspiration (**) | Autologous serum | IM: 84 (56) million cells IC: 115 (73) million cells | No additional therapy (control) | |
| Standard medical therapy | Cardiologist | IC | BMMNC or CPC | BM aspiration (**) for BMMNC. Vein puncture, mononuclear cell isolation by gradient centrifugation and culture for 3 days for CPC | n/r | BMMNC: 205 (110) million cells CPC: 22 (11) million cells | No additional therapy (control) | |
| Shockwave | Cardiologist | IC | BMMNC | BM aspiration (**) | X‐VIVO 10 medium and autologous serum | HDSW: 123 (69) million cells LDSW: 150 (77) million cells | Placebo (10 mL X‐VIVO 10 medium and autologous serum) | |
| Standard medical therapy | Cardiologist | IC | BM‐MSC (cardiopoietic cells) | BM aspiration (**), culture for 6 days and exposure to cardiopoietic factors | Preservation solution (no details) | 733 (range 605 to 1168) million cells | No additional therapy (control) | |
| Standard medical therapy | Cardiologist | IC | BM‐MSC | BM aspiration (**), culture for 7 days to select MSC | Heparinised saline | 5 million cells | No additional therapy (control) | |
| G‐CSF | Cardiologist | IC | CPC | G‐CSF infusion for 4 days prior to vein puncture, mononuclear cell isolation by gradient centrifugation and culture for 3 days for CPC | Saline and 10% autologous serum | 69 (14) million cells | Placebo (cell‐free serum solution) | |
| G‐CSF | Cardiologist | IC | BMMNC | G‐CSF infusion for 5 days and BM aspiration (**) | Autologous serum | n/r | Placebo (10 mL autologous serum) | |
| G‐CSF | Cardiologist | IM | BMMNC | G‐CSF infusion for 5 days and BM aspiration (**) | Autologous serum | n/r | Placebo (2 mL autologous serum) | |
| Standard medical therapy | Cardiologist | IM | BMMNC | BM aspiration (**) | n/r | n/r | Placebo (vehicle medium) | |
| Standard medical therapy | Cardiologist | IM | BM‐MSC | BM aspiration (**), culture to select MSC | n/r | n/r | Placebo (vehicle medium) | |
| CABG | Cardiothoracic surgeon | IM | BMMNC | BM aspiration (**) | Heparinised saline | 60 (31) million cells | Placebo (heparinised saline) | |
| G‐CSF | Cardiologist | IC | CPC | G‐CSF infusion for 5 days prior to vein puncture, mononuclear cell isolation by gradient centrifugation and culture for 4 days for CPC | n/r | 29 (12) million cells | No additional therapy (control) | |
| CABG | Cardiothoracic surgeon | IC | BMMNC | BM aspiration (**) | Saline solution and 20% autologous serum | 132 (107) million cells | Placebo (8 mL saline; 2 mL autologous serum) | |
| G‐CSF | Cardiologist | IM | CD133+ | G‐CSF infusion for 5 days prior to leukapheresis, mononuclear cell isolation by gradient centrifugation immunomagnetic selection to isolate CD133+ cells | Normal saline solution | 20 to 30 million cells | No additional therapy (control) | |
| G‐CSF | Cardiologist | IM | CD34+ | G‐CSF infusion for 5 days prior to leukapheresis, mononuclear cell isolation by gradient centrifugation immunomagnetic selection to isolate CD34+ cells | Saline solution and 5% autologous serum | LD: 0.05 million cells MD: 0.1 million cells HD: 0.5 million cells | Placebo (0.9% sodium chloride; 5% autologous plasma) | |
| G‐CSF | Cardiologist | IM | CD34+ | G‐CSF infusion for 5 days prior to leukapheresis, mononuclear cell isolation by gradient centrifugation immunomagnetic selection to isolate CD34+ cells | Saline solution and 5% autologous serum | LD: 0.1 million cells HD: 0.5 million cells | Placebo (0.9% sodium chloride; 5% autologous plasma) | |
| Standard medical therapy | Cardiologist | IM | BM‐MSC | BM aspiration (**), culture for 14 to 35 days to select MSC | Phosphate buffered saline with a drop of the participant’s blood | 77.5 (68) million cells | Placebo (phosphate buffered saline mixed with drop of participant’s blood) | |
| G‐CSF | Cardiologist | IC | BMMNC | G‐CSF infusion for 5 days and BM aspiration (**) | Autologous serum | 86 (110) million cells | Placebo (10 mL autologous serum) | |
| G‐CSF | Cardiologist | IM | BMMNC | G‐CSF infusion for 5 days and BM aspiration (**) | Autologous serum | 52 (53) million cells | Placebo (2 mL autologous serum) | |
| CABG | Cardiothoracic surgeon | IM | CD133+ | BM aspiration (**), immunomagnetic selection to isolate CD133+ cells | Sodium chloride and 10% autologous serum | Median 5.1 million cells | Placebo (isotonic saline solution; 10% autologous serum) | |
| CABG | Cardiothoracic surgeon | IM | CD34+ | BM aspiration (**), immunomagnetic selection to isolate CD34+ cells | Heparinised saline and autologous serum | Median 22 million cells | No additional therapy (control) | |
| Standard medical therapy | Cardiologist | IC | BMAC | BM aspiration (**) and concentration | Autologous serum | 3700 (900) million cells | No additional therapy (control) | |
| CABG | Cardiothoracic surgeon | IM | BMMNC | BM aspiration (**) | Medium 199 containing albumin, heparin | Median 840 (range 52 to 135) million cells | Placebo (vehicle medium) | |
| Standard medical therapy | Cardiologist | IM | BMMNC | BM aspiration (**) | Saline containing 5% human serum albumin | 2 million cells | No additional therapy (control) | |
| Standard medical therapy | Cardiologist | IM | BMMNC | BM aspiration (**) | Saline containing 5% human serum albumin | 100 million cells | Placebo (cell‐free suspension in same volume) | |
| Standard medical therapy | Cardiologist | IM | ALDH+ | BM aspiration (**) and cell sorting | Pharmaceutical grade human serum albumin | 2.4 (1.3) million cells | Placebo (5% pharmaceutical serum albumin) | |
| Standard medical therapy | Cardiologist | IM | BMMNC | BM aspiration (**) | Heparinised saline | 41 (16) million cells | No additional therapy (control) | |
| Standard medical therapy | Cardiologist | IM | BMMNC | BM aspiration (**) | Phosphate buffered saline with 10% autologous plasma | n/r | Placebo (phosphate buffered saline; 10% autologous plasma) | |
| CABG | Cardiothoracic surgeon | IM | BMMNC | BM aspiration (**) | n/r | 70.7 (32.4) million cells | No additional therapy (control) | |
| Standard medical therapy | Cardiologist | IM | BMMNC | BM aspiration (**) | Phosphate buffered saline with 10% autologous plasma | 15 million cells | Placebo (8 ‐ 12 x 0.1 mL phosphate buffered saline with 10% autologous serum) | |
| Standard medical therapy | Cardiologist | IC | BMMNC | BM aspiration (**) | n/r | 99 (25) million cells | No additional therapy (control) | |
| Standard medical therapy | Cardiologist | IM | BMMNC | BM aspiration (**) | Phosphate buffered saline with 0.5% human serum albumin | 98 (6) million cells | Placebo (0.9% sodium chloride; 0.5% human serum albumin) | |
| Standard medical therapy | Cardiologist | IC | CD34+ | BM aspiration (**), immunomagnetic selection to isolate CD34+ cells | Normal saline | Range 1.0 to 6.1 million cells | No additional therapy (control) | |
| Standard medical therapy | Cardiologist | IC | CD34+ | BM aspiration (**), immunomagnetic selection to isolate CD34+ cells | Saline and human serum albumin | 56 (23) million cells | Placebo (saline; human serum albumin) | |
| Standard medical therapy | Cardiologist | IM | CD133+ | n/r | n/r | n/r | Placebo (n/r) | |
| CABG | Cardiothoracic surgeon | IM | BMMNC | BM aspiration (**) | Heparinised saline | 521 (44) million cells | Placebo (saline solution) | |
| Standard medical therapy | Cardiologist | IC | BMMNC | BM aspiration (**) | Heparinised saline | 72 million cells | Placebo (0.9% sodium chloride containing heparin) | |
| CABG | Cardiothoracic surgeon | IM | BMMNC | BM aspiration (**) | Heparinised saline | 659 (512) million cells | Placebo (saline) |
**BM aspiration ‐ bone marrow aspiration and isolation of bone marrow mononuclear cells by gradient centrifugation.
ALDH: aldehyde dehydrogenase
BM: bone marrow
BMAC: bone marrow aspirate concentrate
BMMNC: bone marrow mononuclear cells
BM‐MSC: bone marrow‐derived mesenchymal stem cells
CABG: coronary artery bypass grafting
CPC: circulating progenitor cells
G‐CSF: granulocyte colony‐stimulating factor
HD: high dose
HDSW: high dose shockwave
IC: intracoronary
IM: intramyocardial
LD: low dose
LDSW: low dose shockwave
MD: medium dose
MSC: mesenchymal stem cells
n/r: not reported
SW: shockwave
In five trials, bone marrow stem cells were mobilised into circulation with granulocyte colony‐stimulating factor (G‐CSF) and subsequently isolated from blood via leukapheresis (Erbs 2005; Honold 2012; Jimenez‐Quevedo 2011; Losordo 2007; Losordo 2011). Whilst previous trials reported severe but transient complications associated with G‐CSF treatment (Kang 2006), a recent pilot study demonstrated that G‐CSF can be safely administered to people suffering from IHD as none of the participants in this trial experienced the type of adverse events previously associated with G‐CSF treatment (Honold 2012). Two of these trials further enriched the stem cell population in CD34‐positive progenitors by magnetic separation (Losordo 2007; Losordo 2011). Four trials mobilised bone marrow cells into circulation with G‐CSF and isolated bone marrow mononuclear cells by density gradient centrifugation (Hamshere 2015_IC; Hamshere 2015_IM; Mozid 2014_IC; Mozid 2014_IM). Finally, one study administered CD133‐postive cells, but reported no details of cell isolation (Wang 2014).
All but six trials reported the mean (or median) dose of cells administered (Hamshere 2015_IC; Hamshere 2015_IM; Heldman 2014_BMMNC; Heldman 2014_BM‐MSC; Santoso 2014; Wang 2014). The mean dose of bone marrow mononuclear cells administered varied between 2 x 10⁶ cells, in Perin 2011, and 8.4 x 10⁸ cells, in Patila 2014, whilst bone marrow aspirate concentrate was administered at a mean dose of 3.7 x 10⁹ cells (Patel 2015). Mesenchymal progenitor cells were administered at mean doses of between 5.0 x 10⁶ cells, in Chen 2006, and 7.8 x 10⁷ cells, in Mathiasen 2015, with one study administering 7.3 x 10⁸ cardiopoietic cells (Bartunek 2012). Five studies that adminstered CD34‐positive cells gave mean doses of between 5.0 x 10⁴ cells, in Losordo 2007, and 5.6 x 10⁷ cells, in Wang 2010, and included two dose escalation studies comparing 5.0 x 10⁴ cells, 1.0 x 10⁵ cells, and 5.0 x 10⁵ cells or 1.0 x 10⁵ cells and 5.0 x 10⁵ cells (Losordo 2007; Losordo 2011). CD133‐positive cells were administered at a median dose of 5.1 x 10⁶ cells, in Nasseri 2012, or at doses of between 2 and 3 x 10⁷ cells (Jimenez‐Quevedo 2011). The doses of ALDH‐positive cells averaged 2.96 x 10⁶ cells (Perin 2012b). In the trial where bone marrow mononuclear cells were compared to CPCs, the mean dose of CPCs administered was between 2.9 x 10⁶ cells, in Honold 2012, and 2.2 x 10⁷ cells (Assmus 2006).
Thirteen trials administered the treatment via a coronary artery (intracoronarily (IC)) (Assmus 2006; Assmus 2013; Chen 2006; Erbs 2005; Hamshere 2015_IC; Honold 2012; Hu 2011; Mozid 2014_IC; Patel 2015; Turan 2011; Wang 2009; Wang 2010; Yao 2008), whilst 24 trials delivered the treatment intramyocardially (IM) (Bartunek 2012; Hamshere 2015_IM; Heldman 2014_BMMNC; Heldman 2014_BM‐MSC; Hendrikx 2006; Jimenez‐Quevedo 2011; Losordo 2007; Losordo 2011; Mathiasen 2015; Mozid 2014_IM; Nasseri 2012; Patel 2005; Patila 2014; Perin 2011; Perin 2012a; Perin 2012b; Pokushalov 2010; Santoso 2014; Trifunovic 2015; Tse 2007; Van Ramshorst 2009; Wang 2014; Wang 2015; Zhao 2008). Of these 24 studies, 22 aided delivery of the treatment into the heart muscle using electromechanical mapping of the heart. The other two studies did not report whether the IM delivery of stem cells was aided in any other way (Hendrikx 2006; Zhao 2008). One trial included three treatment arms comparing IC and IM delivery of stem cells with control (Ang 2008).
Apart from G‐CSF, 17 studies administered co‐interventions. In nine studies, participants underwent coronary artery bypass graft (CABG) (Ang 2008; Hendrikx 2006; Hu 2011; Nasseri 2012; Patel 2005; Patila 2014; Trifunovic 2015; Wang 2015; Zhao 2008), and in seven studies, percutaneous coronary intervention (PCI) was administered to all participants (Chen 2006; Erbs 2005; Turan 2011; Wang 2009), or to a subset of participants (Assmus 2006; Honold 2012; Yao 2008). One study administered shockwave targeted to the left ventricular anterior wall at either high or low dose (Assmus 2013).
Twenty‐five studies compared cell therapy with administration of a placebo consisting of a cell‐free solution, either a heparin saline solution or a saline solution containing the participant's own serum (Assmus 2013; Erbs 2005; Hamshere 2015_IC; Hamshere 2015_IM; Heldman 2014_BMMNC; Heldman 2014_BM‐MSC; Hendrikx 2006; Hu 2011; Losordo 2007; Losordo 2011; Mathiasen 2015; Mozid 2014_IC; Mozid 2014_IM; Nasseri 2012; Patila 2014; Perin 2012a; Perin 2012b; Santoso 2014; Tse 2007; Van Ramshorst 2009; Wang 2010; Wang 2014; Wang 2015; Yao 2008; Zhao 2008); two further studies used a simulated mock injection procedure for participants in the control arm, but without administering a placebo solution (Jimenez‐Quevedo 2011; Perin 2011). The remaining 11 trials compared treatment to no treatment (Ang 2008; Assmus 2006; Bartunek 2012; Chen 2006; Honold 2012; Patel 2005; Patel 2015; Pokushalov 2010; Trifunovic 2015; Turan 2011; Wang 2009).
Three studies included multiple comparisons involving two or three intervention arms, including intracoronary versus intramyocardial cell administration (Ang 2008), mononuclear cells versus circulating progenitor cells (Assmus 2006), and high versus medium or low (Losordo 2007), or high versus low cell dose (Losordo 2011). We combined data for multiple intervention arms for the main analyses, although we used individual intervention trial arms for subgroup analyses where applicable. One three‐arm trial was also a cross‐over study (Assmus 2006); we have included only data up to the point of cross‐over (three months) in this review.
One study described aortic cross‐clamping during surgery with clamp times exceeding 25 to 30 minutes (Hendrikx 2006). Aortic cross‐clamping isolates the systemic circulation during surgery but causes ischaemia. Although increasing times of aortic cross‐clamping have been identified as a predictor of mortality, the effect of cross‐clamping in this study was not as strong as might be expected. This may be due to the fact that the cause of cardiac damage is multifactorial, including coronary lesions.
All but one study published only in abstract form reported the primary clinical outcome of mortality (Wang 2014). All but three studies reported periprocedural adverse events (or lack of) (Hamshere 2015_IC; Hamshere 2015_IM; Wang 2014), and a fourth study reported adverse events for shockwave treatment but not for cell therapy (Assmus 2013). See the Characteristics of included studies tables for details of the included studies; see Table 3 for a summary of the reporting of outcomes considered in this review.
| Study ID | Primary outcomes | Secondary outcomes | ||||||||||||||||||||
| All‐cause mortality | Non‐fatal MI | Hospital readmission for HF | Composite MACEa | Arrhythmias | NYHA class | CCS class | Angina frequency | Exercise tolerance | Quality of life | LVEFb | ||||||||||||
| ST | LT | ST | LT | ST | LT | ST | LT | ST | LT | ST | LT | ST | LT | ST | LT | ST | LT | ST | LT | ST | LT | |
| FR | NR | PR* | NR | NR | NR | NR | NR | PR* | NR | PR | NR | PR | NR | NR | NR | NR | NR | NR | NR | FR | NR | |
| FR | NR | FR | NR | FR | NR | FR | NR | FR | NR | FR | NR | NR | NR | NR | NR | NR | NR | NR | NR | FR | NR | |
| FR | FR | NR | FR | FR | FR | NR | FR | NR | FR | FR | NR | NR | NR | NR | NR | NR | NR | NR | NR | FR | NR | |
| PR* | FR | NR | NR | NR | FR | NR | NR | PR | PR | PR | NR | NR | NR | NR | NR | FR | NR | PR | NR | FR | NR | |
| NR | FR | NR | NR | NR | NR | NR | NR | PR* | NR | FR | FR | NR | NR | NR | NR | FR | FR | NR | NR | FR | FR | |
| PR* | FR | NR | NR | NR | NR | NR | NR | NR | NR | NR | NR | NR | NR | NR | NR | FR | FR | NR | NR | FR | FR | |
| PR* | PR* | PR* | FR | PR* | PR* | PR* | FR | FR | FR | FR | FR | FR | FR | NR | NR | NR | NR | NR | NR | PR | PR | |
| PR* | PR* | PR* | PR* | FR | FR | FR | FR | FR | FR | FR | FR | FR | FR | NR | NR | NR | NR | NR | NR | PR | PR | |
| PR* | PR* | NR | PR* | NR | FR | PR* | FR | NR | NR | NR | PR | NR | NR | NR | NR | FR | FR | FR | FR | NR | PR | |
| PR* | FR | NR | PR* | NR | PR* | PR* | FR | NR | NR | NR | PR | NR | NR | NR | NR | FR | FR | FR | FR | NR | PR | |
| FR | NR | NR | NR | NR | NR | NR | NR | NR | NR | NR | NR | NR | NR | NR | NR | NR | NR | NR | NR | FR | NR | |
| PR* | FR | FR | FR | PR* | FR | NR | NR | NR | NR | FR | FR | NR | NR | NR | NR | FR | FR | NR | NR | FR | FR | |
| FR | FR | PR* | NR | NR | NR | FR | NR | PR* | FR | NR | NR | NR | NR | NR | NR | FR | NR | NR | NR | FR | FR | |
| FR | NR | PR* | NR | NR | NR | PR | NR | FR | NR | NR | NR | PR | NR | PR | NR | PR | NR | PR | NR | PR | NR | |
| PR* | PR* | PR* | PR* | NR | NR | NR | NR | FR | FR | NR | NR | FR | NR | FR | NR | FR | NR | PR | NR | NR | NR | |
| FR | FR | NR | FR | NR | FR | NR | PR | NR | NR | NR | NR | PR | PR | FR | NR | FR | FR | FR | FR | NR | NR | |
| FR | NR | PR* | NR | FR | NR | NR | NR | FR | NR | PR | NR | PR | NR | PR | NR | PR | NR | PR | NR | FR | NR | |
| FR | NR | PR* | NR | FR | NR | FR | NR | PR* | NR | FR | NR | FR | NR | NR | NR | NR | NR | NR | NR | NR | NR | |
| FR | NR | PR* | NR | PR* | NR | FR | NR | FR | NR | FR | NR | FR | NR | NR | NR | NR | NR | NR | NR | NR | NR | |
| FR | FR | NR | NR | NR | NR | NR | NR | NR | NR | FR | NR | FR | NR | NR | NR | PR | NR | PR | NR | FR | NR | |
| PR* | FR | NR | NR | NR | NR | NR | NR | PR* | NR | FR | NR | NR | NR | NR | NR | NR | NR | NR | NR | PR | PR | |
| NR | FR | NR | NR | NR | FR | NR | NR | NR | PR* | NR | FR | NR | PR | NR | NR | NR | NR | NR | PR | PR | PR | |
| NR | PR* | NR | PR* | NR | FR | NR | NR | NR | NR | NR | FR | NR | NR | NR | NR | NR | NR | NR | PR | NR | FR | |
| PR* | NR | PR* | NR | NR | NR | NR | NR | PR* | NR | FR | NR | FR | NR | NR | NR | NR | NR | FR | NR | FR | NR | |
| FR | NR | FR | NR | FR | NR | NR | NR | NR | NR | FR | NR | FR | NR | NR | NR | FR | NR | NR | NR | FR | NR | |
| PR* | NR | FR | NR | NR | NR | NR | NR | FR | NR | FR | NR | FR | NR | NR | NR | NR | NR | NR | NR | FR | NR | |
| FR | FR | NR | NR | NR | NR | NR | NR | PR* | PR* | FR | FR | FR | FR | FR | FR | FR | FR | FR | FR | FR | FR | |
| PR* | FR | NR | NR | NR | NR | NR | NR | FR | NR | PR | NR | NR | NR | NR | NR | PR | NR | NR | NR | FR | NR | |
| NR | FR | NR | NR | NR | NR | NR | NR | NR | NR | FR | FR | NR | NR | NR | NR | FR | FR | NR | NR | FR | FR | |
| PR* | FR | FR | NR | NR | NR | NR | NR | PR* | NR | FR | NR | FR | NR | NR | NR | FR | NR | NR | NR | FR | NR | |
| PR* | PR* | NR | NR | NR | NR | NR | NR | NR | NR | FR | FR | NR | NR | NR | NR | NR | NR | NR | NR | FR | FR | |
| FR | NR | PR* | NR | NR | NR | NR | NR | PR* | NR | NR | NR | FR | NR | NR | NR | FR | NR | FR | NR | FR | FR | |
| PR* | NR | PR* | NR | NR | NR | NR | NR | PR* | NR | NR | NR | FR | NR | FR | NR | FR | NR | NR | NR | NR | NR | |
| PR* | NR | PR* | NR | NR | NR | NR | NR | FR | NR | NR | NR | FR | NR | FR | NR | FR | NR | NR | NR | NR | NR | |
| NR | NR | NR | NR | NR | NR | NR | NR | NR | NR | PR | NR | NR | NR | NR | NR | PR | NR | NR | NR | FR | NR | |
| PR* | NR | NR | NR | NR | NR | NR | NR | PR | NR | NR | NR | NR | NR | NR | NR | NR | NR | NR | NR | FR | NR | |
| PR* | NR | FR | NR | FR | NR | NR | NR | PR* | NR | NR | NR | NR | NR | NR | NR | NR | NR | NR | NR | PR | NR | |
| FR | NR | PR* | NR | NR | NR | NR | NR | FR | NR | FR | NR | FR | NR | NR | NR | NR | NR | NR | NR | FR | NR | |
| Total (%) analysedc | 1637 (85.8) | 1010 (53.0) | 881 (46.2) | 461 (24.2) | 482 (25.3) | 495 (26.0) | 288 (15.1) | 201 (10.5) | 959 (50.3) | 363 (19.0) | 741 (38.9) | 346 (18.1) | 608 (31.9) | 142 (7.4) | 428 (22.4) | 82 (4.3)d | 535 (28.1) | 227 (11.9) | 197 (10.3)e | 151 (7.9)e | 439 (23.0)f | 110 (5.8)f |
CCS: Canadian Cardiovascular Society; FR: full reporting, outcome included in analysis; HF: heart failure; LT: long‐term follow‐up (≥ 12 months); LVEF: left ventricular ejection fraction; MACE: major adverse clinical events; MI: myocardial infarction; NR: outcome not reported; NYHA: New York Heart Association; PR: partial reporting with insufficient information on outcome reported for inclusion in analysis; PR*: no incidence of outcome observed; ST: short‐term follow‐up (< 12 months)
aComposite measure of mortality, reinfarction, or rehospitalisation for heart failure.
bLVEF measured by any method.
cTotal number of participants included in meta‐analysis of outcome (% of total number of participants from all included studies).
dNo meta‐analysis was performed, as only one study reported values suitable for inclusion.
eMinnesota Living with Heart Failure Questionnaire.
fTotal number analysed given for LVEF measured by magnetic resonance imaging.
Studies awaiting classification
Ten independent studies (12 references) met the eligibility criteria for this review but reported insufficient data for inclusion; these studies are awaiting classification (see Characteristics of studies awaiting classification).
Ongoing studies
We identified 28 ongoing trials described in five references and 31 ongoing trial records; see Characteristics of ongoing studies for details.
Excluded studies
We excluded 54 studies (described by 70 references and 15 ongoing trial records) from the review following full‐text assessment against the eligibility criteria (see Characteristics of excluded studies tables). In summary, we excluded studies for the following sequential reasons: 10 studies were of people with acute myocardial infarction (AMI); 16 studies were single‐arm trials; seven studies compared multiple interventions but with no control or placebo arm; eight studies did not randomise participants to treatment arm; two studies administered G‐CSF to the intervention arm but not the comparator group; one study measured outcomes not relevant to this review; six studies were terminated or withdrawn; one study included non‐bone marrow‐derived cells; one study compared allogeneic cells with a control group; one study was a literature review; and one study was performed in animals.
Risk of bias in included studies
A summary of the risk of bias in individual studies is given below and in Figure 2. Further details of our assessment of risk of bias can been found in the Characteristics of included studies tables. We considered only five trials to have a low risk of bias across all domains (Jimenez‐Quevedo 2011; Mathiasen 2015; Perin 2011; Perin 2012a; Van Ramshorst 2009).

Risk of bias summary: review authors' judgements about each risk of bias item for each included study.
Allocation
Twenty‐seven studies provided details of randomisation methods with a low risk of bias from random sequence generation. These methods included sequentially numbered, sealed envelopes (Hendrikx 2006; Patila 2014; Van Ramshorst 2009), simple randomisation table (Santoso 2014; Tse 2007), or randomisation codes generated electronically (Assmus 2006; Assmus 2013; Hamshere 2015_IC; Hamshere 2015_IM; Heldman 2014_BMMNC; Heldman 2014_BM‐MSC; Hu 2011; Mathiasen 2015; Mozid 2014_IC; Mozid 2014_IM; Patel 2015; Perin 2012a; Perin 2012b; Pokushalov 2010; Zhao 2008), by a study statistician (Losordo 2007; Perin 2011), by picking a coloured ball (Patel 2005), or via a centralised site‐independent process (Bartunek 2012; Jimenez‐Quevedo 2011; Losordo 2011; Nasseri 2012). Of these, 15 studies described appropriate methods of allocation concealment with a low risk of bias (Assmus 2013; Bartunek 2012; Heldman 2014_BMMNC; Heldman 2014_BM‐MSC; Hendrikx 2006; Jimenez‐Quevedo 2011; Losordo 2011; Mathiasen 2015; Nasseri 2012; Patila 2014; Perin 2011; Perin 2012a; Santoso 2014; Tse 2007; Van Ramshorst 2009), whilst in 12 studies allocation concealment was unclear (Assmus 2006; Hamshere 2015_IC; Hamshere 2015_IM; Hu 2011; Losordo 2007; Mozid 2014_IC; Mozid 2014_IM; Patel 2005; Patel 2015; Perin 2012b; Pokushalov 2010; Zhao 2008).
We found five trials in which no description was given as to what methods were used to generate the random sequence to be at unclear risk of selection bias (Ang 2008; Erbs 2005; Honold 2012; Trifunovic 2015; Turan 2011). The method of generation of randomisation sequence was also not reported in six Chinese trials, which we deemed to have a high risk of bias (Chen 2006; Wang 2009; Wang 2010; Wang 2014; Wang 2015; Yao 2008).
Blinding
In 24 studies, participants randomised to the control group received a placebo injection (Assmus 2013; Erbs 2005; Hamshere 2015_IC; Hamshere 2015_IM; Heldman 2014_BMMNC; Heldman 2014_BM‐MSC; Hendrikx 2006; Hu 2011; Losordo 2007; Losordo 2011; Mathiasen 2015; Mozid 2014_IC; Mozid 2014_IM; Nasseri 2012; Patila 2014; Perin 2012a; Perin 2012b; Santoso 2014; Tse 2007; Van Ramshorst 2009; Wang 2010; Wang 2015; Yao 2008; Zhao 2008), with all but one study reporting that the control group underwent bone marrow aspiration (Mathiasen 2015); we judged these trials to be at a low risk of performance bias. We deemed two additional trials to have a low risk of performance bias, as although no placebo was administered, participants in the control group underwent a sham procedure (Jimenez‐Quevedo 2011; Perin 2011).
We considered nine trials in which no placebo was administered to have a high risk of performance bias (Ang 2008; Assmus 2006; Bartunek 2012; Chen 2006; Honold 2012; Patel 2015; Pokushalov 2010; Trifunovic 2015; Turan 2011). Two trials were reported as "double‐blind" (Wang 2014), or as having blinded participants (Patel 2005), but no details of a placebo were given; a third trial reported no details of blinding (Wang 2009). We judged the risk of performance bias in these trials to be unclear.
We assessed two trials as having a high risk of detection bias: one was reported as an "open‐label" trial with no details of blinding given (Trifunovic 2015), and one trial reported that outcome assessors were not blinded (Wang 2009). We judged two trials in which which blinding of outcome assessors was not reported as at unclear risk of detection bias (Chen 2006; Wang 2014). All other trials reported the blinding of outcome assessors.
Incomplete outcome data
One trial had a high risk of attrition bias (Bartunek 2012): 11 participants randomised to the cell therapy group were excluded from the analyses as they did not receive the study intervention. In the study report, these participants were analysed as part of the control group (although in this review they have been excluded). The risk of attrition bias was unclear in four studies in which some participants were excluded from the analyses without sufficient explanation (Ang 2008; Heldman 2014_BMMNC; Heldman 2014_BM‐MSC; Honold 2012). We also attributed an unclear risk of attrition bias to one study reported in abstract form only (Wang 2014). In all other trials, any withdrawals or losses to follow‐up were similar in both treatment arms with reasons for withdrawals fully documented.
Selective reporting
We attributed a high risk of reporting bias to one study in which results have only been published as a conference abstract (Wang 2014). Twenty‐two trials were prospectively registered on a clinical trial database. Of these, 13 studies reported all outcomes described in the the trial protocol, with a low risk of reporting bias (Ang 2008; Assmus 2006; Assmus 2013; Hu 2011; Jimenez‐Quevedo 2011; Losordo 2011; Mathiasen 2015; Nasseri 2012; Patel 2015; Perin 2011; Perin 2012a; Perin 2012b; Van Ramshorst 2009), whilst in seven studies, we observed some differences between outcomes described in the study protocol and those reported. Specifically, three studies reported results for additional outcomes (Heldman 2014_BMMNC; Heldman 2014_BM‐MSC; Santoso 2014); two studies were a pilot study report of secondary outcomes only (Mozid 2014_IC; Mozid 2014_IM); one study failed to report six‐month results as described in the protocol (Patila 2014); and in one study, different definitions of primary and secondary outcomes were reported in the study protocol and the publication of results (Bartunek 2012). We deemed the risk of reporting bias in these seven studies to be unclear. For two trials reported in abstract form only (Hamshere 2015_IC; Hamshere 2015_IM), we requested and obtained data for all outcomes presented in the trial protocol from the authors, therefore we judged these trials to be at low risk of reporting bias.
We identified no prospectively registered trial protocol for the remaining 15 trials, and although the results of all outcomes described in the methods were reported, we judged the risk of reporting bias to be unclear.
We identified no obvious asymmetry from a funnel plot for mortality (Figure 3). In a regression test for asymmetry (Egger's test), the model intercept was ‐0.02 (P = 0.90) at short‐term follow‐up and ‐0.004 (P = 0.98) at long‐term follow‐up, with no evidence of publication bias. However, of 28 identified ongoing trials, 11 trials (787 participants) were recorded as having been completed or were due to have been completed in advance of our search date, but we identified no publications for them and no study results were posted on the trial database. We therefore cannot rule out the possibility of publication bias.

Funnel plot of comparison: 1 Stem cells versus no stem cells, outcome: 1.1 Mortality.
Other potential sources of bias
Twenty‐eight studies reported details of study funding or sponsorship (Ang 2008; Assmus 2006; Assmus 2013; Bartunek 2012; Erbs 2005; Hamshere 2015_IC; Hamshere 2015_IM; Heldman 2014_BMMNC; Heldman 2014_BM‐MSC; Hu 2011; Jimenez‐Quevedo 2011; Losordo 2007; Losordo 2011; Mathiasen 2015; Mozid 2014_IC; Mozid 2014_IM; Nasseri 2012; Patel 2015; Patila 2014; Perin 2011; Perin 2012a; Perin 2012b; Santoso 2014; Tse 2007; Van Ramshorst 2009; Wang 2015; Yao 2008; Zhao 2008. The majority of these studies were funded entirely by academic or healthcare research grants, or both and received no commercial sponsorship. Four studies acknowledged provision of equipment (Heldman 2014_BMMNC; Heldman 2014_BM‐MSC; Losordo 2007; Perin 2012a), and two studies acknowledged receipt of consultant fees, from Biosense Webster, in Tse 2007, and Cook Medical (Patel 2015). Four studies declared full commercial sponsorship: from Aldagen (Perin 2012b), Baxter Healthcare (Losordo 2011), Cardio3 BioSciences (Bartunek 2012), and Harvest Technologies (Patel 2015), and nine studies declared partial commercial funding: from Baxter Healthcare (Losordo 2007), Chugai Pharma UK and the Cordis Corporation (Hamshere 2015_IC; Hamshere 2015_IM; Mozid 2014_IC; Mozid 2014_IM), Miltenyi Biotec (Nasseri 2012), and BioCardia (Heldman 2014_BMMNC; Heldman 2014_BM‐MSC), and an unrestricted grant from t2cure GmbH (Assmus 2013). We judged all 13 studies that received some degree of commercial funding to be at high risk of bias. The primary investigator in four included trials is also an author of this review (Hamshere 2015_IC; Hamshere 2015_IM; Mozid 2014_IC; Mozid 2014_IM).
Effects of interventions
An overview of results for the primary outcomes of mortality and periprocedural adverse events, and for morbidity outcomes (non‐fatal MI, rehospitalisation for HF, arrhythmias, composite major adverse clinical events) and LVEF measured by MRI is given in summary of findings Table for the main comparison. We excluded quality of life and performance status outcomes since different measures are likely to be used for different participant diagnoses, and therefore fewer trials are likely to have reported each of these outcomes.
In one study (Yao 2008), continuous measures were reported as mean +/‐ standard deviation. However, visual inspection of the data revealed that the standard deviations were considerably lower than might be expected for all continuous outcomes. This study also reported P values for statistical comparisons between the baseline and follow‐up data using paired t‐tests. However, we could not identify the reported significance values, either using the standard deviations provided, or based on an assumption that the values were in fact standard errors. We therefore could not verify or include continuous data from this study.
Primary outcomes
Mortality
All but one study included mortality as an outcome (Wang 2014), which was published in abstract form only (see Table 3; Table 4).
| Study ID | Number of analysed participants | All‐cause mortality events | Non‐fatal MI events | Hospital readmission for HF | Composite MACEa | Arrhythmia events | |||||||||||
| Cells | No cells | Cells | No cells | Length of follow‐up | Cells | No cells | Length of follow‐up | Cells | No cells | Length of follow‐up | Cells | No cells | Length of follow‐up | Cells | No cells | Length of follow‐up | |
| 42 | 19 | 1 | 1 | 6 mthsa | 0 | 0 | 6 mths | n/r | n/r | n/r | n/r | n/r | n/r | 0 | 0 | 6 mths | |
| 52 | 23 | 0 | 1 | 3 mths | 1 | 0 | 3 mths | 1 | 1 | 3 mths | 1 | 1 | 3 mths | 0 | 1 | 3 mths | |
| 43 | 39 | 6 | 8 | 45.7 (17) mths | 1 | 4 | 45.7 (17) mths | 8 | 13 | 45.7 (17) mths | 14 | 19 | 45.7 (17) mths | 6 | 13 | 45.7 (17) mths | |
| 21 | 15 | 1 | 2 | 24 mths | n/r | n/r | n/r | 6 | 4 | 24 mths | n/r | n/r | n/r | n/r | n/r | n/r | |
| 22 | 23 | 2 | 4 | 12 mths | n/r | n/r | n/r | n/r | n/r | n/r | n/r | n/r | n/r | 0 | 0 | 6 mths | |
| 13 | 12 | 0 | 1 | 15 mths | n/r | n/r | n/r | n/r | n/r | n/r | n/r | n/r | n/r | n/r | n/r | n/r | |
| 15 | 15 | 0 | 0 | 12 mths | 1 | 0 | 12 mths | 0 | 0 | 12 mths | 1 | 0 | 12 mths | 1 | 1 | 12 mths | |
| 15 | 15 | 0 | 0 | 12 mths | 0 | 0 | 12 mths | 1 | 1 | 12 mths | 1 | 1 | 12 mths | 0 | 1 | 12 mths | |
| 19 | 10 | 0 | 0 | 12 mths | 0 | 0 | 12 mths | 0 | 1 | 12 mths | 0 | 1 | 12 mths | n/r | n/r | n/r | |
| 19 | 11 | 1 | 1 | 12 mths | 0 | 0 | 12 mths | 0 | 0 | 12 mths | 1 | 1 | 12 mths | n/r | n/r | n/r | |
| 11 | 12 | 1 | 1 | 4 mths | n/r | n/r | n/r | n/r | n/r | n/r | n/r | n/r | n/r | n/r | n/r | n/r | |
| 23 | 9 | 0 | 1 | 60 mths | 1 | 2 | 60 mths | 0 | 2 | 60 mths | n/r | n/r | n/r | n/r | n/r | n/r | |
| 31 | 29 | 1 | 2 | 12 mths | 0 | 0 | 6 mths | n/r | n/r | n/r | 3 | 4 | 6 mths | 1 | 0 | 12 mths | |
| 19 | 9 | 1 | 1 | 6 mths | 0 | 0 | 6 mths | n/r | n/r | n/r | n/r | n/r | n/r | 1 | 1 | 6 mths | |
| 18 | 6 | 0 | 0 | 12 mths | 0 | 0 | 12 mths | n/r | n/r | n/r | n/r | n/r | n/r | 0 | 1 | 12 mths | |
| 112 | 56 | 0 | 3 | 12 mths | 6 | 7 | 12 mths | 3 | 4 | 12 mths | n/r | n/r | n/r | n/r | n/r | n/r | |
| 40 | 20 | 1 | 1 | 6 mths | 0 | 0 | 6 mths | 6 | 2 | 6 mths | n/r | n/r | n/r | 3 | 1 | 6 mths | |
| 14 | 2 | 0 | 1 | 6 mths | 0 | 0 | 6 mths | 1 | 0 | 6 mths | 1 | 1 | 6 mths | 0 | 0 | 6 mths | |
| 10 | 8 | 0 | 3 | 6 mths | 0 | 0 | 6 mths | 0 | 0 | 6 mths | 0 | 3 | 6 mths | 2 | 2 | 6 mths | |
| 30 | 30 | 1 | 3 | 34 mthsb | n/r | n/r | n/r | n/r | n/r | n/r | n/r | n/r | n/r | n/r | n/r | n/r | |
| 25 | 25 | 3 | 10 | 10 yrs | n/r | n/r | n/r | n/r | n/r | n/r | n/r | n/r | n/r | 0 | 0 | 6 mths | |
| 22 | 6 | 5 | 2 | 12 mths | n/r | n/r | n/r | 2 | 0 | 12 mths | n/r | n/r | n/r | 0 | 0 | 12 mths | |
| 13c | 17c | 0 | 0 | Median 60 mths | 0 | 0 | Median 60 mths | 1 | 1 | Median 60 mths | n/r | n/r | n/r | n/r | n/r | n/r | |
| 20 | 10 | 0 | 0 | 6 mths | 0 | 0 | 6 mths | n/r | n/r | n/r | n/r | n/r | n/r | 0 | 0 | 6 mths | |
| 61 | 31 | 1 | 0 | 6 mths | 1 | 0 | 6 mths | 3 | 5 | 6 mths | n/r | n/r | n/r | n/r | n/r | n/r | |
| 10 | 10 | 0 | 0 | 6 mths | 1 | 0 | 6 mths | n/r | n/r | n/r | n/r | n/r | n/r | 3 | 2 | 6 mths | |
| 55 | 54 | 6 | 21 | 12 mths | n/r | n/r | n/r | n/r | n/r | n/r | n/r | n/r | n/r | 0 | 0 | 12 mths | |
| 19 | 9 | 0 | 2 | 23 (8) mths | n/r | n/r | n/r | n/r | n/r | n/r | n/r | n/r | n/r | 1 | 1 | 6 mths | |
| 15 | 15 | 2 | 4 | Median 5 yrs | n/r | n/r | n/r | n/r | n/r | n/r | n/r | n/r | n/r | n/r | n/r | n/r | |
| 19 | 9 | 0 | 1 | 19 (9) mths | 0 | 1 | 3 mths | n/r | n/r | n/r | n/r | n/r | n/r | 0 | 0 | 6 mths | |
| 38 | 18 | 0 | 0 | 12 mths | n/r | n/r | n/r | n/r | n/r | n/r | n/r | n/r | n/r | n/r | n/r | n/r | |
| 25 | 25 | 1 | 0 | 6 mths | 0 | 0 | 6 mths | n/r | n/r | n/r | n/r | n/r | n/r | 0 | 0 | 6 mths | |
| 16 | 16 | 0 | 0 | 6 mths | 0 | 0 | 6 mths | n/r | n/r | n/r | n/r | n/r | n/r | 0 | 0 | 6 mths | |
| 56 | 56 | 0 | 0 | 6 mths | 0 | 0 | 6 mths | n/r | n/r | n/r | n/r | n/r | n/r | 0 | 1 | 6 mthsd | |
| n/r | n/r | n/r | n/r | n/r | n/r | n/r | n/r | n/r | n/r | n/r | n/r | n/r | n/r | n/r | n/r | n/r | |
| 45 | 45 | 0 | 0 | 6 mths | n/r | n/r | n/r | n/r | n/r | n/r | n/r | n/r | n/r | n/r | n/r | n/r | |
| 24 | 23 | 0 | 0 | 6 mths | 0 | 1 | 6 mths | 1 | 2 | 6 mths | n/r | n/r | n/r | 0 | 0 | 6 mths | |
| 18 | 18 | 2 | 0 | 6 mths | 0 | 0 | 6 mths | n/r | n/r | n/r | n/r | n/r | n/r | 1 | 0 | 6 mths | |
HF: heart failure; MACE: major adverse clinical events; MI: myocardial infarction; n/r: not reported
aAng 2008: participants followed up for six months; mortality reported as “death within 30 days of treatment”.
bNasseri 2012: deaths reported “beyond follow‐up period” occurred at 31 and 34 months.
cPatila 2014: mortality rates reported in 20/19 participants at 12 months and 13/17 participants at 60 months.
dWang 2010: values are for ventricular arrhythmia (atrial arrhythmia also reported but unclear whether any participant overlap).
Of 33 studies that reported mortality rates during short‐term follow‐up (< 12 months), 15 trials reported deaths (Ang 2008; Assmus 2006; Assmus 2013; Hendrikx 2006; Hu 2011; Jimenez‐Quevedo 2011; Losordo 2011; Mathiasen 2015; Mozid 2014_IC; Mozid 2014_IM; Nasseri 2012; Perin 2012a; Pokushalov 2010; Van Ramshorst 2009; Zhao 2008), whilst the remaining 18 trials reported no deaths. In all trials, over short‐term follow‐up, the mortality rate of 1.6% (15/963) in participants who received cell therapy was lower than that observed in participants who received no cells (4.0%, 27/674) (risk ratio (RR) 0.48, 95% confidence interval (CI) 0.26 to 0.87; participants = 1637; studies = 33; I2 = 0%) (Analysis 1.1). However, in the subset of trials with a low risk of selection bias, the effect of cell therapy on short‐term mortality was no longer seen (RR 0.69, 95% CI 0.32 to 1.50; participants = 744; studies = 14; I2 = 0%) (Analysis 8.1). Similarly, no effect of cell therapy on short‐term mortality was shown when studies with a high or unclear risk of performance bias were excluded (RR 0.58, 95% CI 0.29 to 1.16; participants = 1216; studies = 25; I2 = 0%) (Analysis 9.1). However, results appeared to be robust to attrition bias (RR 0.48, 95% CI 0.26 to 0.89; participants = 1449; studies = 28; I2 = 0%) (Analysis 10.1).
Seven studies reported reasons for short‐term mortality in participants who had received cell therapy, which included perforated oesophageal ulcer complicated by mediastinitis seven days postoperatively (Hendrikx 2006), cardiogenic shock (Jimenez‐Quevedo 2011), death on day 158 shortly after surgery for intestinal ischaemia (Mathiasen 2015), pump failure leading to death on day 29 after therapy (Perin 2012a), myocardial ischaemia leading to acute HF at 2.5 months (Van Ramshorst 2009), ventricular fibrillation five hours postoperatively leading to death on day three (Zhao 2008), and cerebral vessel accident during six‐month follow‐up (Zhao 2008). Cause of death in one study was not specified in detail but reported as "cardiac" in four participants and "non‐cardiac" in one participant (Assmus 2013). In participants who did not receive cell therapy, reasons for short‐term mortality included multiple organ failure secondary to low cardiac output syndrome (Hendrikx 2006), fatal MI at 3.5 months (Jimenez‐Quevedo 2011), death during injection (Losordo 2007), terminal HF at day 182 (Mathiasen 2015), pneumonia, mediastinitis and sepsis with death on day 22 (Nasseri 2012), candida sepsis on day 8 after left ventricular failure (Nasseri 2012), and death reported as "cardiac" (five participants) or "non‐cardiac" (one participant) (Assmus 2013).
Of the 21 studies reporting mortality over long‐term follow‐up (≥ 12 months), 15 studies reported deaths (Assmus 2013; Bartunek 2012; Chen 2006; Erbs 2005; Heldman 2014_BM‐MSC; Honold 2012; Hu 2011; Losordo 2011; Nasseri 2012; Patel 2005; Patel 2015; Pokushalov 2010; Santoso 2014; Trifunovic 2015; Tse 2007), with a mortality rate of 4.8% (28/587) in participants who received cell therapy compared with 15.4% (65/423) in those who received no cells. Meta‐analysis of all available trials showed that cell therapy reduced the risk of long‐term mortality (RR 0.38, 95% CI 0.25 to 0.58; participants = 1010; studies = 21; I2 = 0%) (Analysis 1.1). Sensitivity analyses restricted to those trials with a low risk of bias from randomisation sequence generation and allocation concealment showed that the reduced risk of mortality at long‐term follow‐up in participants who received cell therapy was robust to selection bias (RR 0.42, 95% CI 0.21 to 0.87; participants = 491; studies = 9; I2 = 0%; low‐quality evidence) (Analysis 8.1). Similarly, analysis of the subset of trials that blinded participants and clinicians showed that the effect of cell therapy on long‐term mortality was robust to performance bias (RR 0.43, 95% CI 0.21 to 0.86; participants = 624; studies = 13; I2 = 0%) (Analysis 9.1). The effect of cell therapy also remained when trials with a high or unclear risk of attrition bias were excluded (RR 0.39, 95% CI 0.25 to 0.60; participants = 883; studies = 17; I2 = 0%) (Analysis 10.1).
Eleven studies reported reasons for mortality at long‐term follow‐up. In participants who received cell therapy, reported causes of death were sepsis after elective cardiac transplant at 21 months (Bartunek 2012), lung cancer at seven months (Hu 2011), cerebrovascular haemorrhage at six years (Trifunovic 2015), pulmonary malignancy at six years (Trifunovic 2015), HF or sudden cardiac death, or both at 31 months (Nasseri 2012), cardiac death on day 239 (Heldman 2014_BM‐MSC), "sudden death" (Chen 2006), and death due to cardiac (three participants) or non‐cardiac causes (two participants) (Patel 2015). Reported deaths in participants who did not receive cell therapy were due to ventricular fibrillation, sudden death, and HF (two participants) (Chen 2006), angina followed by sudden death secondary to AMI (Erbs 2005), progressive HF (Honold 2012), AMI (Tse 2007), HF deterioration (Bartunek 2012), sudden cardiac death (Bartunek 2012; Santoso 2014), systemic infection (Hu 2011), gastrointestinal bleeding (Hu 2011), cardiac death on day 115 (Heldman 2014_BM‐MSC), HF and/or sudden cardiac death at 34 months (Nasseri 2012), "cardiac" death (Patel 2015), gastrointestinal bleeding from carcinoma of the colon (Santoso 2014), and cardiac events in four participants (Trifunovic 2015).
Subgroup analyses
Although primary analyses of mortality showed no evidence for heterogeneity, values of I2 are known to be underestimated, especially when there are few events or a limited number of studies included in a meta‐analysis (Huedo‐Medina 2006; Ioannidis 2007). We therefore performed prespecified subgroup analyses on the primary outcome of mortality as described in the Methods section. Tests for differences between subgroups revealed no differences in mortality between treatment groups, either at short‐term or long‐term follow‐up when participants were grouped according to cell dose (test for subgroup differences, short term: P = 0.23 (Analysis 2.1); long term: P = 0.29 (Analysis 2.2)), baseline cardiac function (short term: P = 0.13 (Analysis 3.1); long term: P = 0.35 (Analysis 3.2)), route of cell administration (short term: P = 0.90 (Analysis 4.1); long term: P = 0.12 (Analysis 4.2)), cell type (short term: P = 0.89 (Analysis 5.1); long term: P = 0.65 (Analysis 5.2)), participant diagnosis (short term: P = 0.57 (Analysis 6.1); long term: P = 0.29 (Analysis 6.2)), or use of co‐interventions (short term: P = 0.15 (Analysis 7.1); long term: P = 0.37 (Analysis 7.2)). Notably, subgroup analysis by participant diagnosis revealed a lower risk of long‐term mortality associated with cell therapy in participants irrespective of diagnosis: chronic ischaemic heart disease (CIHD) (RR 0.52, 95% CI 0.27 to 0.99; participants = 389; studies = 9; I2 = 0%), HF secondary to IHD (RR 0.33, 95% CI 0.19 to 0.58; participants = 401; studies = 9; I2 = 0%), and refractory angina (RR 0.11, 95% CI 0.01 to 0.91; participants = 220; studies = 3; I2 = 0%) (Analysis 6.2), and irrespective of whether co‐interventions were used (co‐interventions: RR 0.47, 95% CI 0.26 to 0.88; participants = 312; studies = 6; I2 = 0%; no co‐interventions: RR 0.32, 95% CI 0.19 to 0.56; participants = 698; studies = 15; I2 = 0%) (Analysis 7.2).
Trial sequential analyses
In trial sequential analysis of long‐term mortality, the cumulative Z‐curve crossed both the conventional threshold but not the adjusted trial sequential monitoring boundary, which may be indicative of an inflated type I error rate (see Figure 4). Furthermore, the existing evidence, based on a total of 432 participants, falls considerably short of the required information size of 1899, suggesting that the apparent beneficial effect of cell therapy on long‐term mortality based on the existing evidence lacks robustness.

Trial sequential analysis: Mortality at long‐term follow‐up (≥ 12 months). TSMB = trial sequential monitoring boundary; horizontal red lines indicate conventional significance threshold.
Periprocedural adverse events
A summary of periprocedural adverse events in each study is included in Table 5. All but three studies reported periprocedural adverse events (or lack of) (Hamshere 2015_IC; Hamshere 2015_IM; Wang 2014), and a fourth study reported adverse events for shockwave treatment but not cell therapy (Assmus 2013).
| Study ID | Periprocedural adverse events |
| 2 deaths (1 control, 1 intracoronary cell therapy) occurred within 30 days of treatment. Reasons were not given, but neither was considered to be related to cell therapy. | |
| In‐hospital events: MI occurred in 1 CPC participant and ventricular arrhythmia detected during monitoring in 1 control participant. | |
| n/r (only safety of shockwave procedure reported) | |
| In the cell therapy group, 1 participant had ventricular tachycardia during procedure which was resolved by cardioversion, and 1 participant had blurred vision after intervention (participant had pre‐existing ophthalmic migraines). Other reported adverse events (gastrointestinal, hepatobiliary, respiratory, thoracic, mediastinal, and peripheral vascular disorders) were not considered to be related to cell therapy. | |
| 3 participants in cell therapy group experienced a transient episode of pulmonary oedema during the injection of stem cells. No sustained arrhythmias were monitored during the procedure. | |
| 1 cell therapy and 1 control participant reported headache, and 1 control participant developed fever during G‐CSF stimulation. G‐CSF resulted in comparable increases in serum C‐reactive protein levels and blood leukocyte count in both CPC and control groups (returned to baseline values within 4 days after G‐CSF). Neither G‐CSF injection nor intracoronary transplantation of CPC caused any elevation in troponin T levels. | |
| n/r | |
| n/r | |
| No participant had significant postprocedural pericardial effusion. Small transient increases in CK‐MB and serum troponin I were observed. There were no treatment emergent serious adverse events among any of participants who received cell therapy. | |
| No participant had significant postprocedural pericardial effusion. Small transient increases in CK‐MB and serum troponin I were observed. There were no treatment emergent serious adverse events among any of participants who received cell therapy. | |
| 1 cell therapy participant died on postoperative day 7 from a perforated oesophageal ulcer complicated by mediastinitis. 1 control participant died on the 5th postoperative day from multiorgan failure secondary to low cardiac output syndrome. | |
| Mild cephalgies and episodes of mild to moderate bone and muscular pain were reported during 5‐day course of G‐CSF. No participant developed chest pain episodes or clinical signs of decompensated HF. No novel ischaemia‐related ECG changes were observed during G‐CSF treatment and after intracoronary CPC infusion. Troponin T levels remained unchanged. Moreover, no specific G‐CSF‐mediated severe complications occurred. Intracoronary infusions were successfully performed without any procedural complications. | |
| 2 participants (unclear which treatment arm) had neurological complications but recovered and were discharged. No participants had arrhythmia. | |
| G‐CSF treatment was well tolerated, all participants presented bone pain as the only symptom. After cell injection, none of the participants had a significant rise in creatine phosphokinase, symptoms, ECG changes, or echocardiographic abnormalities. | |
| 13 participants reported transient increase in angina frequency after administration of G‐CSF. There were no cardiac enzyme elevations, MIs, acute coronary syndromes, or deaths. 1 participant in the placebo group developed ventricular tachycardia during the mapping procedure. No arrhythmias were detected by implantable cardioverter defibrillator, LifeVest, or Holter monitoring in any participant during or after the injection procedure. | |
| Administration of G‐CSF was associated with bone pain (20.1%), angina (17.4%), CHF (2 participants), and 8 participants had troponin elevations consistent with non‐STEMI. In 1 participant a thrombus was observed on the mapping catheter tip as it was removed. 2 participants experienced an apparent myocardial perforation during the injection procedure (1 resulted in haemothorax, which was successfully treated; 1 resulted in cardiac tamponade; this participant died after unsuccessful pericardiocentesis procedure). Elevated troponin levels were observed in 28% of participants at some point during the mobilisation and injection period, all of which were minor and subclinical except for those mentioned above. | |
| 1 participant with a history of episodic ventricular tachycardia developed ventricular tachycardia during the NOGA mapping procedure. Another participant experienced double vision and dizziness during the injection procedure; cerebral‐CT afterwards was normal, but the incident was diagnosed as a minor stroke by the neurologist. 1 participant from the treatment group suffered a stroke 12 days after treatment. | |
| The most common side effects from G‑CSF were bone pain (22%) and low grade pyrexia (65%) (reported in all G‐CSF groups combined). Bleeding from the arterial access site did not differ significantly between the 2 intervention arms. All episodes were minor and resolved with conservative treatment within 24 h of the procedure. As expected, there were increases in troponin and creatine kinase levels postprocedure in both arms. | |
| The most common side effects from G‑CSF were bone pain (22%) and low grade pyrexia (65%) (reported in all G‐CSF groups combined). There were 3 cases of arrhythmia during the intramyocardial procedure that required treatment. Of these, 1 participant developed atrial fibrillation, which reverted to sinus rhythm within 24 h of the procedure. Another participant developed transient complete heart block periprocedure requiring temporary pacing only. The final participant suffered an episode of pulseless ventricular tachycardia following intramyocardial injection, which was successfully cardioverted with a single 200 J external defibrillation and remained haemodynamically stable afterwards. 1 participant died from suspected acute LV failure 6 days after discharge. Bleeding from the arterial access site did not differ significantly between the two intervention arms. All episodes were minor and resolved with conservative treatment within 24 h of the procedure. As expected, there were increases in troponin and creatine kinase levels postprocedure in both arms. | |
| 2 participants in the placebo group died early postoperatively: 1 died on day 8 after developing Candida sepsis following LV failure despite intra‐aortic balloon pump and catecholamine treatment and mechanical assist device implantation, and 1 died on day 22 (reason not given). | |
| 1 participant in the OPCAB plus stem cell therapy group had a haematoma at the bone marrow harvest site. There were no other adverse events in either group (i.e. neurologic, haematologic, vascular, death, or infection events). No participants had any postoperative arrhythmias. | |
| 5 participants who received BMAC experienced “non‐serious adverse events possibly related to the procedure”. Procedure‐related complications included haematomas at the catheterisation site and elevated serum creatinine levels. | |
| There were no differences between treatment groups in participants’ haemodynamics, arterial blood gases, systemic vein oxygen level, blood glucose, acid–base balance, lactate, haemoglobin, body temperature, and diuresis, as well as medications needed. Perioperative measures are reported in detail in Lehtinen 2014. | |
| No perforations or arrhythmias were associated with cell injection procedures. Postprocedural transient left bundle‐branch block (resolved in 24 h) was seen in 1 treated and 1 control participant. 1 treated participant had non‐significant pericardial effusion. No sustained ventricular arrhythmias were observed by Holter monitoring in any participant. Transient fever but no sepsis occurred in 1 control participant. | |
| 1 participant experienced a limited retrograde catheter‐related dissection of the abdominal aorta (withdrawn from study). 1 participant experienced recurrent ventricular tachycardia with hypotension (and received only a small volume of cell product). | |
| No major adverse clinical cardiac events were associated with the cell injection procedures, including no perforations. Electromechanical mapping–related ventricular tachycardia occurred in 2 control participants, and ventricular fibrillation occurred in 1 control participant. No deaths occurred, and HF was not exacerbated in any participant. Holter monitoring showed no sustained ventricular arrhythmia in any participant. | |
| No periprocedural complications occurred in participants who received cell therapy. 2‐dimensional echocardiography did not reveal postprocedural pericardial effusion. Creatine kinase activity and peak troponin T level remained unaltered. No new periprocedural arrhythmias were recorded during 24 h of consecutive electrocardiographic monitoring. An implantable cardioverter defibrillator was implanted to 2 participants with ventricular tachycardia prior to cell injections. | |
| There were no acute procedural‐related complications, including stroke, transient ischaemic attack, ECG changes, sustained ventricular or atrial arrhythmias, and elevation of CPK‐MB. There was also no echocardiographic evidence of pericardial effusion in any participant within the first 24 h of the procedure. | |
| The early postoperative course was uneventful in both groups with no significant differences between them with regard to adverse side effects during hospital stay. There were no significant differences in cardiac‐specific enzymes activities after the operation or the number of atrial fibrillation episodes or appearance of pericardial effusion between the groups. | |
| There were no acute procedure‐related complications, including stroke, transient ischaemic attack, ECG changes, sustained ventricular or atrial arrhythmias, elevation of CPK‐MB, or echocardiographic evidence of pericardial effusion within the first 24 h after the procedure. | |
| There was no inflammatory response or myocardial reaction (white blood cell count, C‐reactive protein, CK, troponin) after cell therapy. There were no immediate pre‐ or postprocedure adverse complications, new electrocardiographic changes, or significant elevations in CK or troponin, and no inflammatory response was observed in participants with bone marrow cell transplant. | |
| In the placebo group, a greater than 0.5‐centimetre pericardial effusion was detected on 2‐dimensional echocardiography in an asymptomatic participant 2 days after the injection procedure, and pericardiocentesis was subsequently performed. | |
| No periprocedural adverse events; cardiac proteins in normal range. | |
| No increase in angina frequency or usage of sublingual NTG was observed in participants of either group. There were no cardiac enzyme elevations, MIs, acute coronary syndromes, or deaths. No participants from either group developed ventricular tachycardia during the cell or saline infusion procedure. No arrhythmias were detected by Holter monitoring in any participant during or after the infusion process. | |
| n/r | |
| Predischarge arrhythmias were reported (as number of events) in both cell therapy and control participants. | |
| Intracoronary application of BMC was performed without any acute or long‐term side effects. There was no inflammatory response or myocardial reaction (i.e. white blood cell count, C‐reactive protein, and creatinine phosphokinase) after cell therapy. | |
| In the perioperative period, sporadic ventricular premature beats and self terminating bouts of rapid atrial fibrillation were observed in both groups. However, 2 participants developed VF, and 1 died in the BMMNC group: 1 participant developed VF on the 5th day postoperatively but was successfully resuscitated and VF well‐controlled, and the other developed refractory VF 5 hours' postoperatively with death on postoperative day 3. There were no ventricular arrhythmias in the control group. |
AMI: acute myocardial infarction
BM: bone marrow
BMAC: bone marrow aspirate concentrate
BMC: bone marrow cells
BMMNC: bone marrow mononuclear cells
CHF: congestive heart failure
CK‐MB: creatine kinase‐MB
CPC: circulating progenitor cells
CPK‐MB: creatine phosphokinase‐MB
CT: computed tomography
ECG: electrocardiogram
G‐CSF: granulocyte colony‐stimulating factor
HF: heart failure
LV: left ventricular
MI: myocardial infarction
MSC: mesenchymal stem cells
non‐STEMI: non‐ST elevation myocardial infarction
n/r: not reported
NTG: nitroglycerine
OPCAB: off‐pump coronary artery bypass
PCI: percutaneous coronary intervention
ULN: upper limit of normal
VF: ventricular fibrillation
Seven studies reported adverse events associated with the administration of G‐CSF. The most common reactions were bone or muscular pain (Honold 2012; Jimenez‐Quevedo 2011; Losordo 2011; Mozid 2014_IC; Mozid 2014_IM), headache (Erbs 2005; Honold 2012), and pyrexia (Erbs 2005; Mozid 2014_IC; Mozid 2014_IM). Two studies reported increased frequency or severity of angina, or both associated with G‐CSF administration (Losordo 2007; Losordo 2011), and one study reported that two participants developed CHF (Losordo 2011).
Reactions associated with bone marrow aspiration were rare: only two studies reported participants with haematomas at the bone marrow harvest site (Patel 2005; Patel 2015). Adverse events during the mapping or injection procedure included ventricular tachycardia in seven participants (three cell therapy (Bartunek 2012; Mathiasen 2015; Perin 2012a), three placebo (Losordo 2007; Perin 2012b), one unknown (Mozid 2014_IM)); ventricular fibrillation in one control participant (Perin 2012b); atrial fibrillation in one participant (Mozid 2014_IM); and the development of transient complete heart block periprocedure requiring temporary pacing only in one participant (Mozid 2014_IM).
Three cell therapy participants experienced transient pulmonary oedema during injection of cells (Chen 2006); a thrombus was observed in one participant on mapping catheter tip as removed (Losordo 2011); and two participants experienced visual disturbances: one reported double vision and dizziness during the injection procedure (Mathiasen 2015), and one participant with pre‐existing ophthalmic migraines experienced blurred vision after the intervention (Bartunek 2012). Two participants experienced a myocardial perforation: one with haemothorax (successfully treated) (Losordo 2011), and one resulting in cardiac tamponade followed by death (Losordo 2011). One participant experienced a limited retrograde catheter‐related dissection of the abdominal aorta (Perin 2012a).
Serious early postoperative adverse events were rare. In the cell therapy group, one participant died on postoperative day 7 from a perforated oesophageal ulcer complicated my mediastinitis (Hendrikx 2006); one participant developed refractory ventricular fibrillation five hours postoperatively and died on day 3 (Zhao 2008); and one death was reported within 30 days of treatment (cause of death not reported but not considered to be related to cell therapy) (Ang 2008). Postprocedural transient left bundle branch block (resolved in 24 hours) was seen in one participant (Perin 2011); in‐hospital MI occurred in one participant (Assmus 2006); one participant suffered a stroke on postoperative day 12 (Mathiasen 2015); and one participant developed ventricular fibrillation on day 5 but was successfully resuscitated (Zhao 2008). In the control group, one participant died on day 5 from multiorgan failure secondary to low cardiac output syndrome (Hendrikx 2006); one participant died on day 8 after developing Candida sepsis following left ventricular failure (Nasseri 2012); one participant died on day 22, no reason given (Nasseri 2012); one participant died from suspected acute left ventricular failure six days after discharge (Mozid 2014_IM); and one participant died within 30 days of treatment with no reason given (Ang 2008). Postprocedural transient left bundle branch block (resolved in 24 hours) was seen in one participant (Perin 2011); one participant developed a pericardial effusion two days after the procedure, and pericardiocentesis was performed (Van Ramshorst 2009); and ventricular arrhythmia was detected during monitoring in one participant (Assmus 2006). Transient fever but no sepsis occurred in one control participant (Perin 2011). One study reported that two participants (unclear which treatment arm) experienced neurological complications but recovered (Hu 2011).
We made no formal comparisons of periprocedural adverse events due to differences in the definition and reporting of adverse events between studies. We acknowledge that there may be a risk of reporting bias for this outcome, as few studies clearly defined periprocedural events.
Secondary outcomes
Morbidity
(a) Non‐fatal myocardial infarction
Twenty studies reported infarction as an outcome at short‐term follow‐up (see Table 3; Table 4) (Ang 2008; Assmus 2006; Hamshere 2015_IC; Hamshere 2015_IM; Honold 2012; Hu 2011; Jimenez‐Quevedo 2011; Losordo 2007; Mathiasen 2015; Mozid 2014_IC; Mozid 2014_IM; Perin 2011; Perin 2012a; Perin 2012b; Tse 2007; Van Ramshorst 2009; Wang 2009; Wang 2010; Yao 2008; Zhao 2008). There was no evidence of a difference in the risk of non‐fatal MI between participants who received cell therapy and those who did not (RR 0.60, 95% CI 0.17 to 2.15; participants = 881; studies = 20; I2 = 0%) (Analysis 1.2), consistent with findings when studies were restricted to those with a low risk of selection bias (RR 0.50, 95% CI 0.05 to 4.58; participants = 288; studies = 6; I2 = 0%) (Analysis 8.2).
Of the nine studies reporting infarction as an outcome at long‐term follow‐up (Assmus 2013; Hamshere 2015_IC; Hamshere 2015_IM; Heldman 2014_BMMNC; Heldman 2014_BM‐MSC; Honold 2012; Losordo 2007; Losordo 2011; Patila 2014), meta‐analysis showed that cell therapy was associated with a lower risk of non‐fatal MI at long‐term follow‐up (RR 0.40, 95% CI 0.17 to 0.93; participants = 461; studies = 9; I2 = 0%) (Analysis 1.2). Sensitivity analysis showed that the effect of cell therapy was robust to risk of selection bias (RR 0.38, 95% CI 0.15 to 0.97; participants = 345; studies = 5; I2 = 0%) (Analysis 8.2).
Trial sequential analysis
Trial sequential analysis applied to non‐fatal MI at long‐term follow‐up (Figure 5) showed that the cumulative Z‐curve crossed conventional significance thresholds but not the adjusted trial sequential monitoring boundaries, which may be indicative of an inflated type I error rate. Furthermore, the existing evidence falls considerably short of the required information size of 2383, suggesting that the apparent beneficial effect of cell therapy on non‐fatal MI at long‐term follow‐up based on existing evidence lacks robustness.
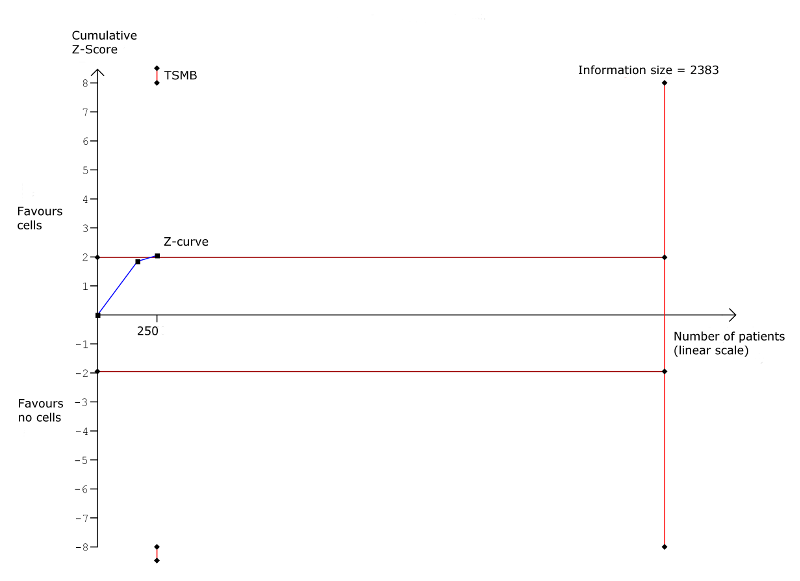
Trial sequential analysis: Non‐fatal myocardial infarction at long‐term follow‐up (≥ 12 months). TSMB = trial sequential monitoring boundary; horizontal red lines indicate conventional significance threshold.
(b) Rehospitalisation due to heart failure
Ten studies reported hospital readmission for HF at short‐term follow‐up (see Table 3; Table 4) (Assmus 2006; Assmus 2013; Hamshere 2015_IC; Hamshere 2015_IM; Honold 2012; Mathiasen 2015; Mozid 2014_IC; Mozid 2014_IM; Perin 2012a; Yao 2008). In participants who received cell therapy, 21/297 (7.0%) were rehospitalised for HF compared with 22/185 (11.9%) who did not, with no evidence of a difference between groups (RR 0.63, 95% CI 0.36 to 1.12; participants = 482; studies = 10; I2 = 0%) (Analysis 1.3).
Of the 10 studies reporting this outcome at long‐term follow‐up (Assmus 2013; Bartunek 2012; Hamshere 2015_IC; Hamshere 2015_IM; Heldman 2014_BMMNC; Heldman 2014_BM‐MSC; Honold 2012; Losordo 2011; Patel 2015; Patila 2014), incidences of rehospitalisation occurred in 21/302 participants (7.0%) who received cell therapy compared with 26/193 (13.5%) who did not (RR 0.62, 95% CI 0.36 to 1.04; participants = 495; studies = 10; I2 = 0%) (Analysis 1.3).
In trials with a low risk of selection bias, sensitivity analysis showed no effect of cell therapy on rehospitalisation due to heart failure at either short‐term (RR 0.65, 95% CI 0.32 to 1.32; participants = 234; studies = 3; I2 = 15%) or long‐term follow‐up (RR 0.63, 95% CI 0.36 to 1.09; participants = 375; studies = 6; I2 = 0%) (Analysis 8.3).
Trial sequential analysis
Trial sequential analysis applied to rehospitalisation due to HF at long‐term follow‐up (Figure 6) showed that the cumulative Z‐curve crossed neither the conventional significance thresholds nor the adjusted trial sequential monitoring boundaries. The existing evidence from 345 participants falls considerably short of the required information size of 1193 to draw reliable conclusions about the effect of cell therapy on rehospitalisation for HF.

Trial sequential analysis: Rehospitalisation due to heart failure at long‐term follow‐up (≥ 12 months). TSMB = trial sequential monitoring boundary; horizontal red lines indicate conventional significance threshold.
(c) Incidence of arrhythmias
Twenty‐four studies reported arrhythmias as an outcome at short‐term follow‐up (see Table 3; Table 4), although one study reported arrhythmias as the number of cumulative events rather than incidence (Wang 2015), and another included nine participants in the control group who were randomised to the treatment arm (Bartunek 2012), and was therefore excluded from the analysis. In trials that defined arrhythmia, the majority reported ventricular arrhythmia (ventricular tachycardia or ventricular fibrillation); two trials reported incidences of atrial fibrillation (Hu 2011; Mathiasen 2015). In the remaining 22 studies, 11 reported incidences of arrhythmias (Assmus 2006; Hamshere 2015_IC; Hamshere 2015_IM; Jimenez‐Quevedo 2011; Losordo 2007; Mathiasen 2015; Mozid 2014_IM; Perin 2012b; Santoso 2014; Wang 2010; Zhao 2008). Arrhythmias occurred in 11/550 participants (2.0%) who received cell therapy compared with 12/409 (2.9%) who did not (RR 0.70, 95% CI 0.33 to 1.45; participants = 959; studies = 22; I2 = 0%) (Analysis 1.4). In trials with a low risk of selection bias, sensitivity analysis showed no effect of cell therapy on incidence of arrhythmias at short‐term follow‐up (RR 0.77, 95% CI 0.18 to 3.21; participants = 224; studies = 6; I2 = 0%) (Analysis 8.4).
Of five studies reporting incidences of arrhythmia at long‐term follow‐up (Assmus 2013; Hamshere 2015_IC; Hamshere 2015_IM; Hu 2011; Losordo 2007), 8/199 participants (4.0%) in the cell therapy group experienced arrhythmias compared with 16/164 (9.8%) in the control group (RR 0.46, 95% CI 0.22 to 0.97; participants = 363; studies = 7; I2 = 0%) (Analysis 1.4); this finding occurred in one study with a low risk of selection bias (RR 0.42, 95% CI 0.18 to 0.99; participants = 82; studies = 1; I2 = 0%) (Analysis 8.3).
Trial sequential analysis
Trial sequential analysis applied to incidence of arrhythmias at long‐term follow‐up (Figure 7) showed that the cumulative Z‐curve from a single trial with a low risk of selection bias crossed the conventional significance thresholds but not the adjusted trial sequential monitoring boundaries. The evidence from this single trial of 82 participants falls considerably short of the required information size of 461 to draw reliable conclusions about the effect of cell therapy on incidence of arrhythmias.
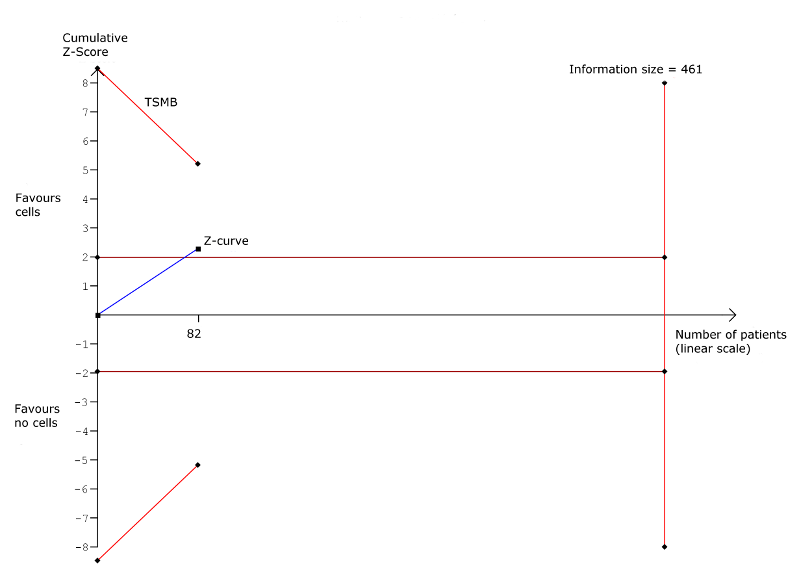
Trial sequential analysis: Arrhythmias at long‐term follow‐up (≥ 12 months). TSMB = trial sequential monitoring boundary; horizontal red lines indicate conventional significance threshold.
(d) Composite measure of mortality, non‐fatal MI, and rehospitalisation for HF
Nine studies reported composite measures of major adverse clinical events, defined here as mortality, non‐fatal MI, and rehospitalisation for HF (see Table 3; Table 4), of which seven reported the composite of mortality, non‐fatal MI, and rehospitalisation for HF (Assmus 2006; Assmus 2013; Hamshere 2015_IC; Hamshere 2015_IM; Heldman 2014_BMMNC; Heldman 2014_BM‐MSC; Hu 2011; Mozid 2014_IC; Mozid 2014_IM). One study defined composite major adverse clinical events (MACE) as cardiovascular death, non‐fatal MI, ischaemic stroke, need for revascularisation, and procedure‐related complications (Jimenez‐Quevedo 2011), and another reported the composite of death, MI, urgent revascularisation, worsening HF, and acute coronary syndrome (Losordo 2011); we excluded these studies from analyses. There was no evidence of a difference between treatment arms at either short‐term (RR 0.51, 95% CI 0.18 to 1.42; participants = 288; studies = 8; I2 = 0%) or long‐term follow‐up (RR 0.68, 95% CI 0.41 to 1.12; participants = 201; studies = 5; I2 = 0%) (Analysis 1.5). These findings were consistent with those from sensitivity analyses of studies with a low risk of selection bias at long‐term follow‐up (RR 0.64, 95% CI 0.38 to 1.08; participants = 141; studies = 3; I2 = 0%) (Analysis 8.5). No studies at low risk of selection bias reported this outcome.
Trial sequential analysis
Trial sequential analysis applied to the composite measure of MACE at long‐term follow‐up (Figure 8) showed that the cumulative Z‐curve crossed neither the conventional significance thresholds nor the adjusted trial sequential monitoring boundaries. The existing evidence from 141 participants falls considerably short of the required information size of 431 to draw reliable conclusions about the effect of cell therapy on rehospitalisation for HF.

Trial sequential analysis: Composite MACE at long‐term follow‐up (≥ 12 months). TSMB = trial sequential monitoring boundary; horizontal red lines indicate conventional significance threshold.
Quality of life
(a) Minnesota Living with Heart Failure Questionnaire (MLHFQ)
Seven studies reported MLHFQ scores as a measure of quality of life (Bartunek 2012; Heldman 2014_BMMNC; Heldman 2014_BM‐MSC; Nasseri 2012; Patel 2015; Perin 2011; Pokushalov 2010), although one study reported results graphically as the percentage of participants showing improvement or deterioration (Bartunek 2012), another reported summary results only (Patel 2015), and in a third study, it was unclear whether mean or median values were reported (Nasseri 2012) (see Table 3; Table 6).
| Study ID | No. analysed participants | Performance assessment | Mean follow‐up | No. analysed participants | Quality of life assessment | Mean follow‐up | ||||
| Cells | No cells | ST | LT | Cells | No cells | ST | LT | |||
| 21 | 21 | NYHA class (SR)a | 6 mths | n/r | ‐ | ‐ | ‐ | ‐ | ‐ | |
| 21 | 21 | CCS class (SR)b | 6 mths | n/r | ‐ | ‐ | ‐ | ‐ | ‐ | |
| 43 | 18 | NYHA class (EP) | 3 mths | n/r | ‐ | ‐ | ‐ | ‐ | ‐ | |
| 43 | 39 | NYHA class (EP/MC) | 4 mths | n/r | ‐ | ‐ | ‐ | ‐ | ‐ | |
| 21 | 15 | NYHA class (SR)c | 6 mths | n/r | 21 | 15 | MLHFQ (SR)c | 6 mths | n/r | |
| 21 | 15 | 6MWT (distance) (EP) | 6 mths | n/r | ‐ | ‐ | ‐ | ‐ | ‐ | |
| 22d | 23d | NYHA class (EP) | 6 mths | 12 mths | ‐ | ‐ | ‐ | ‐ | ‐ | |
| 22d | 23d | ETT (METs) (EP) | 6 mths | 12 mths | ‐ | ‐ | ‐ | ‐ | ‐ | |
| 12 | 10 | Bike test (max O2 update) (EP) | 3 mths | 15 mths | ‐ | ‐ | ‐ | ‐ | ‐ | |
| 15 | 15 | NYHA class (EP) | 6 mths | 12 mths | ‐ | ‐ | ‐ | ‐ | ‐ | |
| 15 | 15 | CCS class (EP) | 6 mths | 12 mths | ‐ | ‐ | ‐ | ‐ | ‐ | |
| 15 | 15 | NYHA class (EP) | 6 mths | 12 mths | ‐ | ‐ | ‐ | ‐ | ‐ | |
| 15 | 15 | CCS class (EP) | 6 mths | 12 mths | ‐ | ‐ | ‐ | ‐ | ‐ | |
| 17 | 16 | NYHA class (SR)e | n/r | 12 mths | 15 | 19 | MLHFQ (MC) | 6 mths | 12 mths | |
| 15f | 19f | 6MWT (distance) (MC) | 6 mths | 12 mths | ‐ | ‐ | ‐ | ‐ | ‐ | |
| 17 | 16 | NYHA class (SR)e | n/r | 12 mths | 19g | 19g | MLHFQ (MC) | 6 mths | 12 mths | |
| 18h | 19h | 6MWT (distance) (MC) | 6 mths | 12 mths | ‐ | ‐ | ‐ | ‐ | ‐ | |
| 21j | 10j | NYHA class (EP) | 3 mths | 60 mths | ‐ | ‐ | ‐ | ‐ | ‐ | |
| 12k | 5k | Bike test (sec) (EP) | 3 mths | 12 mths | ‐ | ‐ | ‐ | ‐ | ‐ | |
| 30 | 27 | 6MWT (distance) (EP/MC) | 6 mths | n/r | ‐ | ‐ | ‐ | ‐ | ‐ | |
| 19 | 9 | CCS class (median)m | 6 mths | n/r | n/r | n/r | SAQ (median)m | 6 mths | n/r | |
| 15 | 7 | ETT (time; METs) (median)m | 6 mths | n/r | 19 | 9 | Angina frequency (median)n | 6 mths | n/r | |
| 18 | 6 | CCS class (MC) | 6 mths | n/r | 18 | 6 | SAQ (SR)p | 6 mths | n/r | |
| 18 | 6 | ETT (time) (MC) | 6 mths | n/r | 17 | 6 | Angina frequency (EP/MC) | 6 mths | n/r | |
| 109q | 53q | CCS class (SR)r | 6 mths | 12 mths | 109q | 53q | SAQ (MC) | 6 mths | 12 mths | |
| 109q | 53q | ETT (time) (MC) | 6 mths | 12 mths | 109 | 53 | Angina frequency (EP) | 6 mths | n/r | |
| 40 | 40 | NYHA class (SR)s | 6 mths | n/r | 40 | 40 | KCCQ‐QOL (SR)s | 6 mths | n/r | |
| 40 | 40 | CCS class (SR)s | 6 mths | n/r | 40 | 40 | SAQ (SR)s | 6 mths | n/r | |
| 40 | 40 | 6MWT (SR)s | 6 mths | n/r | 40 | 40 | Angina frequency (SR)s | 6 mths | n/r | |
| 14 | 2 | NYHA class (EP) | 6 mths | n/r | ‐ | ‐ | ‐ | ‐ | ‐ | |
| 14 | 2 | CCS class (SR) | 6 mths | n/r | ‐ | ‐ | ‐ | ‐ | ‐ | |
| 10 | 8 | NYHA class (EP) | 6 mths | n/r | ‐ | ‐ | ‐ | ‐ | ‐ | |
| 10 | 8 | CCS class (SR) | 6 mths | n/r | ‐ | ‐ | ‐ | ‐ | ‐ | |
| 28 | 26 | NYHA class (EP/MC)t | 6 mths | n/r | 28 | 26 | MLHFQu | 6 mths | n/r | |
| 28 | 26 | 6MWTu | 6 mths | n/r | ‐ | ‐ | ‐ | ‐ | ‐ | |
| 28 | 26 | CCS class (EP/MC)t | 6 mths | n/r | ‐ | ‐ | ‐ | ‐ | ‐ | |
| 10 | 10 | NYHA class (EP/MC)t | 6 mths | n/r | ‐ | ‐ | ‐ | ‐ | ‐ | |
| 17 | 4 | NYHA class (EP)t | n/r | 12 mths | 17 | 4 | MLHFQ (SR) | n/r | 12 mths | |
| 17 | 4 | CCS class (SR) | n/r | 12 mths | ‐ | ‐ | ‐ | ‐ | ‐ | |
| 20 | 19 | NYHA class (EP/MC) | n/r | 12 mthsv | 20 | 19 | SF‐36w | n/r | 60 mths | |
| 20 | 10 | NYHA class (EP) | 6 mths | n/r | 17 | 9 | MLHFQ (EP) | 6 mths | n/r | |
| 20 | 10 | CCS class (EP/MC) | 6 mths | n/r | 13 | 10 | SF‐36 (physical/mental) (EP) | 6 mths | n/r | |
| 55 | 30 | NYHA class (MC) | 6 mths | n/r | ‐ | ‐ | ‐ | ‐ | ‐ | |
| 44 | 22 | CCS class (MC) | 6 mths | n/r | ‐ | ‐ | ‐ | ‐ | ‐ | |
| 51 | 29 | 6MWT (distance) (EP) | 6 mths | n/r | ‐ | ‐ | ‐ | ‐ | ‐ | |
| 10 | 10 | NYHA class (EP) | 6 mths | n/r | ‐ | ‐ | ‐ | ‐ | ‐ | |
| 10 | 10 | CCS class (EP) | 6 mths | n/r | ‐ | ‐ | ‐ | ‐ | ‐ | |
| 53x | 46x | NYHA class (EP) | 6 mths | 12 mths | 53x | 46x | MLHFQ (EP) | 6 mths | 12 mths | |
| 53x | 46x | CCS class (EP) | 6 mths | 12 mths | 53x | 46x | Angina frequency (EP) | 6 mths | 12 mths | |
| 53x | 46x | 6MWT (distance) (EP) | 6 mths | 12 mths | ‐ | ‐ | ‐ | ‐ | ‐ | |
| 19 | 9 | NYHA class (EP)y | 6 mths | n/r | ‐ | ‐ | ‐ | ‐ | ‐ | |
| 19 | 9 | 6MWT (distance) (EP)y | 6 mths | n/r | ‐ | ‐ | ‐ | ‐ | ‐ | |
| 15 | 15 | NYHA class (EP) | 6 mths | 12 mths | ‐ | ‐ | ‐ | ‐ | ‐ | |
| 15 | 15 | 6MWT (distance) (EP) | 6 mths | 12 mths | ‐ | ‐ | ‐ | ‐ | ‐ | |
| 19 | 9 | NYHA class (EP)t | 6 mths | n/r | ‐ | ‐ | ‐ | ‐ | ‐ | |
| 19 | 9 | CCS class (EP)t | 6 mths | n/r | ‐ | ‐ | ‐ | ‐ | ‐ | |
| 19 | 9 | Treadmill test (time; METs) (EP/MC) | 6 mths | n/r | ‐ | ‐ | ‐ | ‐ | ‐ | |
| 33 | 16 | NYHA class (EP) | 6 mths | 12 mths | ‐ | ‐ | ‐ | ‐ | ‐ | |
| 24 | 25 | CCS class (EP) | 6 mths | n/r | 24 | 25 | SAQ (EP/MC) | 6 mths | n/r | |
| 24 | 25 | Bike test (workload) (EP/MC) | 6 mths | n/r | ‐ | ‐ | ‐ | ‐ | ‐ | |
| 16 | 16 | CCS class (MC) | 6 mths | n/r | 16 | 16 | Angina frequency (MC) | 6 mths | n/r | |
| 16 | 16 | ETT (min) (MC) | 6 mths | n/r | ‐ | ‐ | ‐ | ‐ | ‐ | |
| 56 | 56 | CCS class (EP/MC) | 6 mths | n/r | 56 | 56 | Angina frequency (EP/MC) | 6 mths | n/r | |
| 56 | 56 | ETT (min) (EP/MC) | 6 mths | n/r | ‐ | ‐ | ‐ | ‐ | ‐ | |
| n/r | n/r | NYHA class (SR) | 6 mths | n/r | ‐ | ‐ | ‐ | ‐ | ‐ | |
| n/r | n/r | 5MWT (distance) (SR) | 6 mths | n/r | ‐ | ‐ | ‐ | ‐ | ‐ | |
| 16 | 18 | NYHA class (EP) | 6 mths | n/r | ‐ | ‐ | ‐ | ‐ | ‐ | |
| 16 | 18 | CCS class (EP) | 6 mths | n/r | ‐ | ‐ | ‐ | ‐ | ‐ | |
CCS: Canadian Cardiovascular Society; EP: endpoint; ETT: exercise tolerance test; KCCQ‐QOL: Kansas City Cardiomyopathy Questionnaire – Quality of Life; LT: long term; MC: mean change from baseline; MET: metabolic equivalent test (mL/kg/min); MLHFQ: Minnesota Living with Heart Failure Questionnaire; n/r: not reported; NYHA: New York Heart Association; SAQ: Seattle Angina Questionnaire; SF‐36: 36‐Item Short Form Health Survey; SR: summary results; ST: short term; 5MWT: 5‐minute walk test; 6MWT: 6‐minute walk test
aReported as number of participants in NYHA class III/IV.
bReported as number of participants in CCS class II or greater.
cReported graphically as percentage of participants showing improvement or deterioration.
d20/19 at 12 months.
eReported as number who improved/did not change/deteriorated.
f17/19 at 12 months.
g16/19 at 12 months.
h16/19 at 12 months.
j20/6 at 5 years.
k10/5 at 12 months.
mReported as median absolute difference with 95% confidence interval.
nMedian time to onset of angina also reported.
pResults presented graphically.
q106/50 at 12 months.
rReported as percentage of participants changed.
sResults presented graphically with P values for differences between groups.
tCalculated from frequency data.
uUnclear whether mean or median values are reported.
vAlso reported: median values at 60 months.
wReported graphically for each of eight components of SF‐36 at 60 months.
x49/33 at 12 months.
yReported as difference between groups at endpoint.
At short‐term follow‐up, two studies reported MLHFQ values at endpoint (Perin 2011; Pokushalov 2010), and two reported mean change from baseline values (Heldman 2014_BMMNC; Heldman 2014_BM‐MSC). Combined analysis showed that quality of life measured by the MLHFQ was higher in participants who had received cell therapy than in those who had not (mean difference (MD) ‐18.96, 95% CI ‐31.97 to ‐5.94; participants = 197; studies = 4; I2 = 68%) (Analysis 1.6). All but one of these studies also reported MLHFQ at long‐term follow‐up (Perin 2011), but there was insufficient evidence to show that the difference observed at short‐term follow‐up was maintained over long‐term follow‐up (MD ‐17.80, 95% CI ‐39.87 to 4.26; participants = 151; studies = 3; I2 = 93%) (Analysis 1.7).
The number of studies reporting this outcome precluded further investigation of the substantial observed heterogeneity at both short‐term and long‐term follow‐up through subgroup analyses.
(b) Seattle Angina Questionnaire (SAQ)
Five studies reported quality of life measured by the SAQ (Jimenez‐Quevedo 2011; Losordo 2007; Losordo 2011; Mathiasen 2015; Van Ramshorst 2009), although two studies presented results graphically (Losordo 2007; Mathiasen 2015), and one reported median values (Jimenez‐Quevedo 2011) (see Table 3; Table 6). Evidence from two studies that reported mean change from baseline values found a higher quality of life associated with cell therapy (MD 9.34, 95% CI 2.62 to 16.07; participants = 211; studies = 2; I2 = 16%) (Analysis 1.8) (Losordo 2011; Van Ramshorst 2009). A single study reporting mean change in SAQ values from baseline at long‐term follow‐up found no difference between treatment arms (Losordo 2011).
Other reported measures of quality of life included the 36‐Item Short Form Health Survey (SF‐36) physical and mental scores (Perin 2011), SF‐36 (eight dimensions) (Patila 2014), and the Kansas City Cardiomyopathy Questionnaire (Mathiasen 2015).
(c) Angina frequency
Seven studies measured angina frequency, which has been shown to be strongly associated with health‐related quality of life outcomes in people with chronic heart disease (Arnold 2014), and can therefore be considered a surrogate measure of quality of life. Angina frequency was reported as the number of episodes per day (Pokushalov 2010), per week (Losordo 2007; Losordo 2011; Mathiasen 2015; Wang 2009; Wang 2010), or per month (Jimenez‐Quevedo 2011) (see Table 3; Table 6). One study reported median values at endpoint (Jimenez‐Quevedo 2011), and another reported results graphically (Mathiasen 2015). Meta‐analysis of four studies reporting angina frequency at follow‐up showed that participants who received cell therapy experienced fewer episodes of angina per week than the control group (MD ‐6.96, 95% CI ‐11.99 to ‐1.93; participants = 396; studies = 4; I2 = 44%), although we observed no difference in three studies reporting mean change from baseline values (MD ‐1.77, 95% CI ‐14.61 to 11.08; participants = 167; studies = 3; I2 = 76%) (Analysis 1.9). There were insufficient studies to explore potential reasons for the substantial observed heterogeneity through subgroup analyses.
Only one study reported angina frequency at long‐term follow‐up; this study reported fewer angina episodes associated with cell therapy (Pokushalov 2010).
Performance status
(a) New York Heart Association (NYHA) classification
Twenty‐three studies reported NYHA classification at short‐term follow‐up (see Table 3; Table 6). Two studies reported results graphically (Bartunek 2012; Mathiasen 2015); one study reported the number of participants in NYHA class III or IV (Ang 2008); two studies only reported summary results (Santoso 2014; Wang 2014); and in one study there was only one participant in the control group (Mozid 2014_IC); we have therefore excluded these studies from meta‐analysis. In 17 studies reporting mean NYHA class at short‐term follow‐up (Assmus 2006; Assmus 2013; Chen 2006; Hamshere 2015_IC; Hamshere 2015_IM; Honold 2012; Mozid 2014_IM; Nasseri 2012; Patel 2005; Perin 2011; Perin 2012a; Perin 2012b; Pokushalov 2010; Trifunovic 2015; Tse 2007; Turan 2011; Zhao 2008), combined meta‐analysis of mean change from baseline and endpoint values showed cell therapy to be associated with a lower NYHA classification (MD ‐0.44, 95% CI ‐0.84 to ‐0.05; participants = 741; studies = 17; I2 = 97%). This was also demonstrated in the analysis of endpoint values only (MD ‐0.42, 95% CI ‐0.84 to ‐0.00; participants = 658; studies = 16; I2 = 97%), but not in four studies that reported mean change from baseline values (MD ‐0.56, 95% CI ‐1.49 to 0.36; participants = 239; studies = 4; I2 = 95%) (Analysis 1.10). Sensitivity analysis omitting those studies with a high or unclear risk of selection bias indicated that the difference in NYHA class between treatment groups in favour of cell therapy may be subject to selection bias (MD ‐0.26, 95% CI ‐0.59 to 0.07; participants = 277; studies = 5; I2 = 79%) (Analysis 8.6).
Eleven studies reported NYHA class at long‐term follow‐up, although two studies only reported the number of participants who improved or worsened (Heldman 2014_BMMNC; Heldman 2014_BM‐MSC). Meta‐analysis of nine studies showed that a lower NYHA class was associated with cell therapy (MD ‐0.81, 95% CI ‐1.23 to ‐0.39; participants = 346; studies = 9; I2 = 93%) (Analysis 1.11) (Chen 2006; Hamshere 2015_IC; Hamshere 2015_IM; Honold 2012; Patel 2015; Patila 2014; Pokushalov 2010; Trifunovic 2015; Turan 2011). This improvement in NYHA class associated with cell therapy was demonstrated in one study with a low risk of selection bias (MD ‐2.20, 95% CI ‐2.70 to ‐1.70; participants = 39; studies = 1; I2 = 0%) (Analysis 8.7).
Subgroup analyses
In view of the high level of heterogeneity across studies measuring NYHA class at both short‐ and long‐term follow‐up, we conducted exploratory subgroup analyses. At short‐term follow‐up, tests for subgroup differences showed no difference in the effect of cell therapy on NYHA class between studies grouped according to cell dose (P = 0.69) (Analysis 2.3), baseline cardiac function (P = 0.86) (Analysis 3.3), route of cell administration (P = 0.75) (Analysis 4.3), cell type (P = 0.95) (Analysis 5.3), participant diagnosis (P = 0.91) (Analysis 6.3), or use of co‐interventions (P = 0.62) (Analysis 7.3). Visual inspection of forest plots revealed two study outliers at short‐term follow‐up (Patel 2005; Pokushalov 2010); however, substantial heterogeneity (I2 = 80%) remained when these two studies were omitted from the analysis.
At long‐term follow‐up, the number of studies reporting NYHA classification precluded subgroup analysis by cell dose or cell type. We observed no differences from tests of subgroup differences when participants were grouped according to baseline cardiac function (P = 0.51) (Analysis 3.4), route of cell administration (P = 0.21) (Analysis 4.4), or participant diagnosis (P = 0.41) (Analysis 6.4). Of note, the mean NYHA class was significantly lower both in participants with CIHD (MD ‐0.66, 95% CI ‐0.91 to ‐0.42; participants = 105; studies = 3; I2 = 0%) and participants with HF secondary to IHD (MD ‐0.92, 95% CI ‐1.47 to ‐0.37; participants = 241; studies = 6; I2 = 93%) when compared to the respective control groups (Analysis 6.4).
Trial sequential analysis
Trial sequential analysis of NYHA class at short‐term follow‐up showed that the cumulative Z‐curve did not cross the threshold for significance despite exceeding the information size of 522 participants required to detect a mean difference in NYHA class of 1. However, the required information size to detect a small difference would be substantially higher (e.g. 2025 participants would be required to detect a mean difference in NYHA class between groups of 0.5). Over long‐term follow‐up, the cumulative Z‐curve crossed the adjusted trials sequential monitoring boundaries, although the required information size of 380 to detect a difference between groups of 1 was not reached. Further evidence is required before this result can been considered robust.
(b) Canadian Cardiovascular Society (CCS) angina classification
Twenty studies reported CCS angina classification (see Table 3; Table 6). However, mean values at follow‐up or as change from baseline values were not available in seven studies: one reported median values (Jimenez‐Quevedo 2011); one reported results graphically (Mathiasen 2015); one reported the number of participants with CCS class greater than 2 (Ang 2008); one reported the percentage of participants who changed CCS class (Losordo 2011); two reported results pooled across multiple trial arms (Mozid 2014_IC; Mozid 2014_IM); and one reported summary results only (Patel 2015).
At short‐term follow‐up, combined meta‐analysis of 13 studies found no difference in mean CCS class at follow‐up between participants who had received cell therapy and those who had not (MD ‐0.43, 95% CI ‐0.92 to 0.06; participants = 608; studies = 13; I2 = 94%) (Analysis 1.12). Similarly, there was no difference between treatment arms at long‐term follow‐up in three studies (all of which reported mean CCS class at endpoint) (MD ‐0.58, 95% CI ‐2.04 to 0.88; participants = 142; studies = 3; I2 = 99%) (Analysis 1.13).
Subgroup analyses
We observed substantial heterogeneity at short‐ and long‐term follow‐up. Exploratory subgroup analyses of CCS class at short‐term follow‐up revealed no differences between studies grouped according to cell dose (P = 0.64) (Analysis 2.4), baseline cardiac function (P = 0.82) (Analysis 3.5), route of cell administration (P = 0.50) (Analysis 4.5), cell type (P = 0.79) (Analysis 5.4), or participant diagnosis (P = 0.27) (Analysis 6.5). Although we observed no difference in CCS class between treatment groups at short‐term follow‐up overall, subgroup analysis showed that in five studies of refractory angina (Losordo 2007; Tse 2007; Van Ramshorst 2009; Wang 2009; Wang 2010), a higher CCS class was observed in participants who had received cell therapy compared with those who had not (MD ‐0.78, 95% CI ‐1.44 to ‐0.11; participants = 245; studies = 5; I2 = 74%) (Analysis 6.5).
(c) Exercise capacity
Twenty‐one studies reported exercise capacity (see Table 3; Table 6). Measures of exercise capacity included an exercise tolerance test measured as metabolic equivalents, in Chen 2006 and Jimenez‐Quevedo 2011, or as time in minutes (Losordo 2007; Wang 2009; Wang 2010), seconds (Losordo 2011), log seconds (Tse 2007), or unspecified (Jimenez‐Quevedo 2011); a bicycle test measured as maximum O2 update, in Erbs 2005 and Honold 2012, or by workload (Van Ramshorst 2009); and by a five‐minute, in Wang 2014, or six‐minute walk test measured as distance (Bartunek 2012; Heldman 2014_BMMNC; Heldman 2014_BM‐MSC; Hu 2011; Mathiasen 2015; Nasseri 2012; Perin 2012a; Pokushalov 2010; Santoso 2014; Trifunovic 2015). All but five trials reported either mean values at follow‐up or mean change from baseline values. One study reported data as median values (Jimenez‐Quevedo 2011); one reported results graphically (Mathiasen 2015); two reported summary descriptive results only (Santoso 2014; Wang 2014); and in one study it was unclear whether mean or median values were reported (Nasseri 2012).
We have described results for exercise capacity using the standardised mean difference, allowing outcomes of different measurement scales to be combined in a meta‐analysis. This method of analysis does not allow mean change from baseline and endpoint data to be combined, and we therefore have presented separate analyses of mean change from baseline and endpoint data.
In 11 studies that reported exercise capacity as mean values at follow‐up (Bartunek 2012; Chen 2006; Erbs 2005; Honold 2012; Hu 2011; Perin 2012a; Pokushalov 2010; Trifunovic 2015; Tse 2007; Van Ramshorst 2009; Wang 2010), participants who received cell therapy showed a greater exercise capacity than those who did not (standardised mean difference (SMD) 0.56, 95% CI 0.19 to 0.93; participants = 563; studies = 11; I2 = 75%). Similarly, meta‐analysis of nine studies with mean change from baseline values showed greater performance levels associated with cell therapy (SMD 0.33, 95% CI 0.05 to 0.61; participants = 535; studies = 9; I2 = 52%) (Analysis 1.14) (Heldman 2014_BMMNC; Heldman 2014_BM‐MSC; Hu 2011; Losordo 2007; Losordo 2011; Tse 2007; Van Ramshorst 2009; Wang 2009; Wang 2010).
We also saw the difference in performance levels between participants who had received cell therapy and the control group at long‐term follow‐up, in five studies that reported mean values at endpoint (SMD 1.14, 95% CI 0.04 to 2.25; participants = 178; studies = 5; I2 = 89%) (Chen 2006; Erbs 2005; Honold 2012; Pokushalov 2010; Trifunovic 2015), and in three studies with mean change from baseline values (SMD 0.34, 95% CI 0.07 to 0.62; participants = 227; studies = 3; I2 = 0%) (Analysis 1.15) (Heldman 2014_BMMNC; Heldman 2014_BM‐MSC; Losordo 2011).
Subgroup analyses
We investigated the substantial observed heterogeneity at short‐term follow‐up through exploratory subgroup analysis. Tests for subgroup differences found no differences in measures of exercise performance at follow‐up between studies grouped according to cell dose (P = 0.72) (Analysis 2.5), baseline cardiac function (P = 0.31) (Analysis 3.6), route of cell administration (P = 0.21) (Analysis 4.6), or participant diagnosis (P = 0.40) (Analysis 6.6). The number of studies reporting exercise capacity was insufficient to perform subgroup analysis according to the type of cells infused.
Left ventricular ejection fraction (LVEF)
In order to limit possible heterogeneity, we have subgrouped trials reporting LVEF by the method of measurement. Results are shown in forest plots for the combined analyses of mean change from baseline and endpoint values as well as separately, as described in the Methods section. Baseline LVEF values for each trial are given in Table 7 for each method of measurement reported. One study measured LVEF by either single‐photon emission computed tomography (SPECT) or echocardiography and was therefore excluded from the analyses (Patel 2005).
| Study ID | No. randomised participants | No. analysed participants | Baseline LVEF: Mean (SD) | Mean follow‐up of LVEF | ||||
| Cells | No cells | Cells | No cells | Cells | No cells | ST | LT | |
| Measured by MRI | ||||||||
| 42 | 21 | 18 | 7 | IM: 25.4 (8.1) IC: 28.5 (6.5) | 20.9 (8.9) | 6 mths | ‐ | |
| 43 | 39 | 15 | 12 | n/r | n/r | 4 mths | ‐ | |
| 14 | 14 | 12a | 11a | 51.0 (12.1) | 55.8 (12.4) | 3 mths | 15 mths | |
| 11 | 12 | 10 | 10 | 42.9 (10.3) | 39.5 (5.5) | 4 mths | ‐ | |
| 23 | 10 | 9 | 4 | 33.4 (SEM 12.7) | 23.3 (SEM 7.2) | 3 mths | 12 mths | |
| 31 | 29 | 31b | 28b | 23.5 (6.7) | 24.8 (5.2) | 6 mths | 12 mths | |
| 40 | 20 | 40 | 20 | 28.2 (9.3) | 25.1 (8.5) | 6 mths | ‐ | |
| 30 | 30 | 26 | 22 | 27 (6) | 26 (6) | 6 mths | ‐ | |
| 20 | 19 | 18 | 7 | 37.1 (9.5) | 38.5 (13.5) | ‐ | 60 mths | |
| 19 | 9 | 19 | 9 | 23.6 (8.4) | 26.8 (8.8) | 6 mths | ‐ | |
| 19 | 9 | 18 | 8 | 51.9 (8.5) | 45.7 (8.3) | 6 mths | ‐ | |
| 25 | 25 | 22 | 18 | 56 (12) | 54 (10) | 6 mths | ‐ | |
| 35 | 35 | 35 | 35 | 29 (7) | 28 (6) | 6 mths | ‐ | |
| Measured by echocardiography | ||||||||
| 32 | 15 | 21 | 15 | 27.5 (95% CI 25.5, 29.5) | 27.8 (95% CI 25.9, 29.8) | 6 mths | ‐ | |
| 31 | 29 | 24 | 18 | 36.0 (1.2) | 34.7 (1.4) | ‐ | 12 mths | |
| 20 | 10 | 20 | 10 | 37.0 (10.6) | 39.0 (9.1) | 6 mths | ‐ | |
| 61 | 31 | 54 | 28 | 34.7 (8.8) | 32.3 (8.6) | 6 mths | ‐ | |
| 10 | 10 | 10 | 10 | 36.1 (10.9) | 32.1 (10.6) | 6 mths | ‐ | |
| 55 | 54 | 53c | 46c | 27.8 (3.4) | 26.8 (3.8) | 6 mths | 12 mths | |
| 15 | 15 | 15 | 15 | 35.3 (3.9) | 36.5 (5.3) | 6 mths | 12 mths | |
| 25 | 25 | 24 | 25 | 50 (5) | 52 (5) | 6 mths | ‐ | |
| 45 | 45 | 45 | 45 | 39.3 (6.2) | 38.2 (8.0) | 6 mths | ‐ | |
| 18 | 18 | 16 | 18 | 35.8 (7.3) | 36.7 (9.2) | 6 mths | ‐ | |
| Measured by SPECT | ||||||||
| 24 | 24 | 22d | 23d | 26 (6) | 23 (8) | 6 mths | 12 mths | |
| 20 | 10 | 20 | 10 | 41.5 (11.2) | 43.0 (10.4) | 6 mths | ‐ | |
| 25 | 25 | 24 | 25 | 53 (12) | 54 (12) | 6 mths | 12 mths | |
| Measured by LV angiography | ||||||||
| 52 | 23 | 43 | 18 | BMMNC: 41 (11) CPC: 39 (10) | 43 (13) | 3 mths | ‐ | |
| 43 | 39 | 41 | 38 | LDSW: 37.2 (95% CI 31.7, 42.7) HDSW: 32.4 (95% CI 26.9, 37.9) | LDSW: 29.9 (95% CI 24.0, 35.7) HDSW: 32.3 (95% CI 26.5, 38.1) | 4 mths | ‐ | |
| 23 | 10 | 21 | 5 | 37.5 (SEM 12.9) | 37.6 (SEM 7.5) | 3 mths | ‐ | |
| 20 | 10 | 20 | 10 | 37.5 (8.2) | 40.0 (3.2) | 6 mths | ‐ | |
| 10 | 10 | 10 | 10 | 38.0 (17.5) | 41.9 (11.8) | 6 mths | ‐ | |
| 38 | 18 | 33 | 16 | 46 (10) | 46 (10) | 3 mths | 12 mths | |
95% CI: 95% confidence interval; BMMNC: bone marrow mononuclear cells; CPC: circulating progenitor cells; HDSW: high‐dose shockwave; IC: intracoronary; IM: intramyocardial; LDSW: low‐dose shockwave; LT: long term; LV: left ventricular; LVEF: left ventricular ejection fraction; SD: standard deviation; SEM: standard error of the mean; SPECT: single‐photon emission computed tomography; ST: short term
a12/10 at 15 months.
b25/25 at 12 months.
c20/19 at 12 months.
d49/33 at 12 months.
(a) Magnetic resonance imaging (MRI)
Fifteen studies reported LVEF measured by MRI at short‐term follow‐up, although two studies reported summary results only (Hamshere 2015_IC; Hamshere 2015_IM), and we excluded one study, Yao 2008, from analysis due to data inconsistencies as described above (Ang 2008; Assmus 2013; Erbs 2005; Hendrikx 2006; Honold 2012; Hu 2011; Mathiasen 2015; Nasseri 2012; Santoso 2014; Tse 2007; Van Ramshorst 2009; Wang 2014). Meta‐analysis showed that cell therapy was associated with improved LVEF at short‐term follow‐up (MD 2.92, 95% CI 1.03 to 4.82; participants = 439; studies = 12; I2 = 64%). This was also demonstrated in separate analyses of nine studies with mean change from baseline data (MD 4.05, 95% CI 2.55 to 5.55; participants = 308; studies = 9; I2 = 33%), but not in 10 studies that reported mean LVEF values at follow‐up (MD 3.01, 95% CI ‐0.05 to 6.07; participants = 352; studies = 10; I2 = 59%) (Analysis 1.16).
Sensitivity analysis excluding studies with a high or unclear risk of selection bias confirmed the improved LVEF observed in participants who had received cell therapy compared with those who had not (MD 2.92, 95% CI 0.67 to 5.17; participants = 249; studies = 7; I2 = 63%) (Analysis 8.8).
Six studies reported LVEF measured by MRI at long‐term follow‐up, although two reported results graphically (Heldman 2014_BMMNC; Heldman 2014_BM‐MSC). Meta‐analysis of the remaining four studies showed cell therapy to be associated with higher LVEF values (combined analysis: MD 4.38, 95% CI 0.82 to 7.93; participants = 110; studies = 4; I2 = 17%) (Erbs 2005; Honold 2012; Hu 2011; Patila 2014), although this was not demonstrated in separate analyses of mean LVEF at endpoint and mean change from baseline values (Analysis 1.17), and was not found in one study with a low risk of selection bias (MD ‐1.60, 95% CI ‐8.70 to 5.50; participants = 25; studies = 1; I2 = 0%) (Analysis 8.9).
Subgroup analyses
In view of the substantial heterogeneity observed at short‐term follow‐up, we performed exploratory subgroup analyses. Tests for subgroup differences revealed no differences between subgroups defined by cell dose (P = 0.08) (Analysis 2.6), baseline cardiac function (P = 0.38) (Analysis 3.7), route of cell administration (P = 0.46) (Analysis 4.7), cell type (P = 0.95) (Analysis 6.7), or use of co‐interventions (P = 0.42) (Analysis 7.4).
Trial sequential analysis
Trial sequential analysis of LVEF at long‐term follow‐up based on evidence from a single trial with low risk of selection bias showed that the cumulative Z‐curve crossed neither the conventional threshold nor the adjusted trials sequential monitoring boundaries (Figure 9). The available evidence from 25 participants falls considerably short of the required information size of 322 participants.

Trial sequential analysis: Left ventricular ejection fraction measured by MRI at long‐term follow‐up (≥ 12 months). TSMB = trial sequential monitoring boundary; horizontal red lines indicate conventional significance threshold.
(b) Echocardiography
Twelve studies reported LVEF measured by echocardiography at short‐term follow‐up, although one reported median values (Jimenez‐Quevedo 2011), and two studies, Nasseri 2012 and Patel 2015, reported results graphically (Bartunek 2012; Jimenez‐Quevedo 2011; Nasseri 2012; Patel 2015; Perin 2011; Perin 2012a; Perin 2012b; Pokushalov 2010; Trifunovic 2015; Van Ramshorst 2009; Wang 2015; Zhao 2008). Meta‐analysis of nine studies showed cell therapy to be associated with LVEF (combined analysis: MD 5.71, 95% CI 4.29 to 7.13; participants = 470; studies = 9; I2 = 28%) (Analysis 1.18). This was also observed in separate analyses of mean LVEF values at follow‐up (MD 5.16, 95% CI 2.87 to 7.44; participants = 388; studies = 8; I2 = 64%) and mean change from baseline values (MD 3.47, 95% CI 1.59 to 5.34; participants = 161; studies = 3; I2 = 0%) (Analysis 1.18).
At long‐term follow‐up, five studies reported LVEF measured by echocardiography, although one reported results graphically (Patel 2015), and one did not report any measures of variation (Patel 2005). Meta‐analysis of three studies showed that the improvement in LVEF associated with cell therapy extended to long‐term follow‐up (MD 7.96, 95% CI 6.39 to 9.54; participants = 154; studies = 3; I2 = 6%) (Analysis 1.19).
(c) Single‐photon emission computed tomography (SPECT)
Five studies reported LVEF measured by SPECT at short‐term follow‐up (Chen 2006; Jimenez‐Quevedo 2011; Patel 2015; Perin 2011; Van Ramshorst 2009), although one study reported median values (Jimenez‐Quevedo 2011). Meta‐analysis of the remaining four studies showed cell therapy to be associated with improved LVEF when measured by SPECT (MD 5.22, 95% CI 2.60 to 7.85; participants = 145; studies = 4; I2 = 0%) (Analysis 1.20). Only two studies reported LVEF measured by SPECT at long‐term follow‐up (Chen 2006; Van Ramshorst 2009): we observed no difference in LVEF between participants who had received cell therapy and controls (MD 0.28, 95% CI ‐2.48 to 3.03; participants = 88; studies = 2; I2 = 0%) (Analysis 1.21).
(d) Left ventricular (LV) angiography
Seven studies reported LVEF measured by LV angiography (Assmus 2006; Assmus 2013; Honold 2012; Jimenez‐Quevedo 2011; Perin 2011; Perin 2012b; Turan 2011), although one study reported median values (Jimenez‐Quevedo 2011). Meta‐analysis showed that cell therapy improved LVEF at short‐term follow‐up (MD 2.00, 95% CI 0.53 to 3.46; participants = 250; studies = 6; I2 = 33%). We observed this result in separate analysis of both mean LVEF at follow‐up (MD 3.18, 95% CI 0.39 to 5.97; participants = 265; studies = 6; I2 = 7%) and mean change in LVEF from baseline (MD 1.72, 95% CI 0.50 to 2.95; participants = 181; studies = 4; I2 = 18%) (Analysis 1.22). Only one study reported LVEF measured by LV angiography at long‐term follow‐up (Turan 2011): this study found higher LVEF values at long‐term follow‐up in participants who had received cell therapy compared with those who had not (MD 6.00, 95% CI 0.81 to 11.19; participants = 49; studies = 1; I2 = 0%) (Analysis 1.23).
Discusión
Las tasas de mortalidad después del IM han disminuido en años recientes debido a procedimientos de revascularización de última generación y a la atención médica óptima (Hartwell 2005). Por lo tanto, ha aumentado la incidencia de IC secundaria a CI. Durante los últimos 15 años se han realizado ECA que incluyen la administración de tratamientos con células como tratamientos coadyuvantes a la revascularización en los pacientes con CI crónica e IC (para una revisión ver Afzal 2015; Fisher 2014; Jeevanantham 2012). Se ha actualizado la versión original de esta revisión (Fisher 2014),incorporando datos de 15 nuevos ensayos para aumentar la calidad de las pruebas disponibles y extraer conclusiones más sólidas.
Los ensayos compararon el tratamiento con células con ninguna célula (control o placebo) y administraron intervenciones primarias estándar que consistieron en tratamiento médico solo o tratamiento médico y revascularización (ICP o IDAC) u onda de choque. Los pacientes incluidos presentaban un diagnóstico de CI crónica, y en general con síntomas crónicos de isquemia prolongada durante al menos 30 días desde el último IM, IC secundaria a la CI o angina resistente al tratamiento. El tipo de células, la dosis administrada y la vía de administración se detallan en la Tabla 2. Todos los ensayos informaron un seguimiento a corto plazo de entre tres y seis meses, y 17 ensayos informaron un seguimiento de 12 meses y más. La mortalidad y los eventos adversos se definieron como resultados primarios, y la morbilidad, la medida compuesta de mortalidad, el IM no mortal y la rehospitalización por IC; el estado funcional; medidas de calidad de vida relacionada con la salud; y la FEVI como resultados secundarios.
Resumen de los resultados principales
Esta actualización incluye 38 ECA con 1907 participantes (1114 recibieron tratamiento con células, 793 no recibieron tratamiento con células). Las conclusiones principales de esta versión de la revisión se establecieron a partir de estudios con riesgo de selección bajo, como sigue.
-
Se encontraron pruebas de baja calidad de que el tratamiento con células reduce el riesgo de mortalidad por todas las causas al seguimiento a largo plazo en los pacientes con ICC, IC secundaria a la CI y angina resistente al tratamiento. Sin embargo, el análisis secuencial de ensayos mostró que este resultado puede estar sujeto a una tasa de error tipo I exagerada. Las pruebas disponibles no han cumplido con el número general de participantes requerido para establecer conclusiones consistentes (el tamaño de información); se requiere un ensayo grande adicional con alrededor de 1899 participantes antes de poder considerar este resultado consistente y concluyente.
-
Los eventos adversos relacionados con el procedimiento fueron poco frecuentes, así como los eventos adversos graves.
-
El análisis de la morbilidad produjo pruebas de baja calidad de que el tratamiento con células puede reducir el riesgo de IM no mortal y de arritmias al seguimiento a largo plazo. Sin embargo, en cuanto a la mortalidad, estos resultados pueden estar sujetos a una tasa de error tipo I exagerada. El análisis secuencial de ensayos mostró que las pruebas disponibles no han cumplido con el número de participantes (2383 para el IM no mortal y 461 para las arritmias) requerido para establecer conclusiones consistentes. Las pruebas actuales no apoyan un efecto beneficioso del tratamiento con células sobre la rehospitalización por IC o la morbilidad definida como una medida compuesta de mortalidad, IM no mortal y rehospitalización por IC.
-
En los estudios con bajo riesgo de sesgo de selección no se encontraron efectos del tratamiento con células para la mortalidad ni los resultados de morbilidad al seguimiento a corto plazo.
-
El tratamiento con células se asocia con una mejoría en la FEVI medida con IRM al seguimiento a corto plazo, pero no al seguimiento a largo plazo. El análisis secuencial de ensayos de la FEVI al seguimiento a largo plazo mostró que las pruebas no son consistentes, ya que el metanálisis no alcanzó el tamaño necesario de información de 322 participantes.
-
Los resultados de la calidad de vida y el estado funcional se informaron con poca frecuencia, a menudo se utilizaron diferentes medidas para diferentes diagnósticos de los participantes y hubo limitaciones en la información (p.ej. se informaron diferentes estadísticas resumen, los resultados se informaron en forma de gráficos), lo que redujo los datos disponibles para el metanálisis formal, por lo que los resultados se deben interpretar con cuidado.
-
Los análisis de subgrupos no encontraron pruebas de diferencias en el efecto del tratamiento con células entre los subgrupos cuando los estudios se agruparon según la dosis de células, la vía de administración de las células, el tipo de células, el diagnóstico de los participantes o el uso de cointervenciones. En particular, el tratamiento con células fue efectivo para la mortalidad a largo plazo, independientemente del diagnóstico de los participantes (ICC, IC secundaria a CI, angina resistente al tratamiento) y de si se utilizaron cointervenciones.
Compleción y aplicabilidad general de las pruebas
Se encontraron pruebas de baja calidad de que el tratamiento con células se asocia con una reducción en el riesgo de mortalidad al seguimiento a largo plazo, aunque se requieren más pruebas antes de que este hallazgo se pueda considerar consistente. El número de estudios que informó resultados de morbilidad fue generalmente bajo. Hubo pruebas de que el tratamiento con células reduce el riesgo de IM no mortal y arritmias durante el seguimiento a largo plazo, pero los metanálisis tuvieron poco poder estadístico debido al número de estudios (y participantes) incluidos, así como al escaso número de eventos observados. Las medidas compuestas de mortalidad y morbilidad se informan con poca frecuencia a pesar del mayor poder estadístico que se obtiene a partir de dichas medidas.
No se detectaron diferencias entre los distintos tipos de células, dosis ni vías de administración. Lo anterior contrasta con una revisión sistemática reciente que encontró pruebas de una mayor eficacia asociada con más de 50 000 000 de células en un análisis combinado de ensayos de IMA y de CI (Afzal 2015), aunque se debe señalar que los análisis de subgrupos realizados tuvieron un poder estadístico considerablemente escaso para detectar efectos de subgrupos, con pocos estudios en cada grupo. En particular, el análisis de subgrupos relacionado con el diagnóstico de los participantes mostró que el tratamiento con células parece reducir el riesgo de mortalidad a largo plazo en los pacientes con los siguientes diagnósticos: CI crónica, IC secundaria a CI y angina resistente al tratamiento, y que también es efectivo en los pacientes que reciben cointervenciones (ICP, IDAC, u onda d choque) y en los que no reciben dichas cointervenciones.
En la presente actualización de esta revisión sistemática se incluyó el análisis secuencial de ensayos. Se reconoce que la suposición de una reducción del riesgo relativo de mortalidad del 35% es arbitraria y sólo se compara con el tamaño del efecto asociado con la revascularización mediante la ICP. Lo anterior puede parecer de hecho optimista, si se considera la expectativa de que los tratamientos con células pueden tener un efecto más moderado. Sin embargo, si se considera una reducción del riesgo relativo de mortalidad del 25% como un efecto clínicamente relevante aceptable (Yusuf 2002), es claro que el tamaño necesario de información del metanálisis aumentará.
Esta revisión sistemática y metanálisis tuvieron como objetivo evaluar el efecto clínico de los tratamientos con células en la CI y la IC porque es más probable que estos resultados estén libres de riesgo de sesgo de realización. Sin embargo, esta revisión también informa los cambios en la FEVI como una alternativa para la función cardíaca. Aunque la gran mayoría de los ensayos incluidos informan la FEVI como una medida de resultado, su uso como medida alternativa para la función cardíaca es dudoso en el contexto de la insuficiencia cardíaca. Los cambios en los volúmenes del ventrículo izquierdo (VSEVI y VDEVI) pueden ser las medidas más significativas para evaluar el efecto de estos tratamientos sobre la función cardíaca. Los ensayos y actualizaciones futuros de esta revisión sistemática deben informar los cambios en el volumen del ventrículo izquierdo, de preferencia a la FEVI.
Calidad de la evidencia
Aunque el resumen de los resultados es alentador, la calidad de las pruebas disponibles se considera baja para todos los resultados. Los estudios incluidos eran pequeños: sólo tres estudios incluyeron más de 100 participantes y en su mayoría fueron considerablemente más pequeños, lo que dio lugar a riesgo de sesgo de estudio pequeño y a tamaños del efecto espuriamente exagerados. Además, cuando fue posible el agrupamiento de los resultados de los ensayos, los resultados metanalíticos se basaron en números pequeños de eventos (p.ej. 93 muertes en 1010 participantes, 22 IM no mortales en 461 participantes, 47 rehospitalizaciones por IC en 495 participantes en el seguimiento a largo plazo); la medida compuesta de mortalidad, IM no mortal y rehospitalización por IC se informó en sólo cinco estudios.
Se realizaron análisis de subgrupos como se definió en el protocolo de la revisión. Sin embargo, los resultados de los análisis de subgrupos se deben considerar con cuidado, ya que el número de estudios en cada subgrupo y el número de casos se redujeron aún más.
El enfoque GRADE intenta evaluar la calidad de las pruebas para cada resultado principal. También considera los resultados de los análisis secuenciales de ensayos (ver Resumen de los hallazgos para la comparación principal). Para los resultados mortalidad, morbilidad y FEVI, en general la calidad de las pruebas se consideró baja debido a la imprecisión, ya que no se había alcanzado el tamaño necesario de información. La calidad se disminuyó de manera adicional debido al riesgo de sesgo por la falta de cegamiento, la tasa de desgaste alta y el patrocinio por la industria de algunos estudios.
En general, los resultados de esta revisión sistemática se deben interpretar con cuidado pues al parecer en la mayoría de los resultados los metanálisis tuvieron poco poder estadístico para detectar el efecto esperado del tratamiento. Se necesitan estudios más grandes y con poder estadístico suficiente para confirmar estos resultados. Como indican los análisis secuenciales de ensayos, se necesitaría un ensayo adicional de aproximadamente 700 participantes con datos de mortalidad a largo plazo para alcanzar el tamaño necesario de información de 1899 participantes, basado en una reducción del riesgo relativo del 35%. De manera similar, el número de participantes con seguimiento a largo plazo para la FEVI medida con IRM (actualmente sólo 25 participantes en un estudio con bajo riesgo de sesgo de selección) es mucho menor que el tamaño de información requerido para detectar una mejoría del 4% en la FEVI (322 participantes).
Sesgos potenciales en el proceso de revisión
Esta revisión sistemática se basó en una estrategia de búsqueda exhaustiva. Se realizaron pruebas formales del sesgo de publicación para el resultado primario mortalidad y no se encontraron pruebas de asimetría, pero se acepta que no es posible descartar completamente la posibilidad de sesgo de publicación e informe. Hubo riesgo de sesgo de estudio pequeño, ya que todos los estudios incluidos fueron pequeños (como se señaló anteriormente), lo que podría dar lugar a resultados espurios exagerados.
El riesgo de sesgo estuvo presente en los ensayos incluidos, como se resume en la Figura 2. La solidez de los resultados para las variables principales que mostraron pruebas de un efecto beneficioso del tratamiento con células se evaluó mediante análisis de sensibilidad, y el análisis se limitó a los estudios con bajo riesgo de sesgo de selección, realización y desgaste. El resumen de los hallazgos y las conclusiones se basan solamente en estudios con bajo riesgo de sesgo de selección.
El informe y el análisis de los múltiples resultados considerados en esta revisión podrían aumentar la probabilidad de observar errores aleatorios tipo I (falsos positivos) o tipo II (falsos negativos) debido a las pruebas múltiples. Para disminuir las probabilidades de observar errores aleatorios, se ha aplicado el análisis secuencial de ensayos a las principales medidas de resultado y se ha proporcionado el tamaño de información necesario para proporcionar resultados consistentes y concluyentes.
Finalmente, aunque los autores de la revisión han limitado la selección de los estudios a los que administraron células derivadas de la médula ósea, existe variación en el tipo de células utilizadas en los diversos ensayos clínicos (p.ej. células mononucleares de médula ósea, células estromales mesenquimatosas de la médula ósea), lo que puede ser una posible fuente de sesgo.
Acuerdos y desacuerdos con otros estudios o revisiones
Esta actualización de la revisión Cochrane se centró en los resultados mortalidad y eventos adversos relacionados con el procedimiento. Los resultados indican que el tratamiento con células puede reducir el riesgo de mortalidad a largo plazo en los pacientes con CI e IC congestiva y que no hay eventos adversos graves asociados con el tratamiento. Lo anterior coincide con la versión original de la revisión, Fisher 2014, y otras revisiones sistemáticas anteriores (Fisher 2015b; Wen 2011; Xu 2014). Sin embargo, estos datos no coinciden con los resultados obtenidos en revisiones sistemáticas y metanálisis en los que se les han administrado tratamientos con células a pacientes con IMA (de Jong 2014; Delewi 2014; Fisher 2015a; Gyöngyösi 2015). Lo anterior indica que los pacientes con CI crónica o IC, o ambos, se pueden beneficiar más de dichos tratamientos que los pacientes con IMA.
La eficacia del tratamiento con células para reducir la FEVI es consistente con los resultados de una revisión reciente de 11 revisiones sistemáticas del tratamiento con células, que informó que la diferencia de medias en el cambio de la FEVI inicial entre el grupo de tratamiento (efectos aleatorios) varió del 2,6% al 5,6% en las revisiones sistemáticas incluidas y que los resultados metanalíticos fueron muy similares, independientemente de cómo se definió el seguimiento y de qué población de pacientes se estudió (Harvey 2015). Sin embargo, en un análisis secuencial de ensayos reciente de los ensayos de IC (Fisher 2016) no se observaron diferencias en la FEVI entre los brazos de tratamiento, y las pruebas disponibles hicieron que se rechazara la hipótesis de una diferencia de medias en el cambio de la FEVI inicial del 4% entre los brazos de tratamiento en esta cohorte de pacientes.
Estos resultados aparentemente contradictorios son sin duda enigmáticos. ¿El efecto del tratamiento con células se podría reducir en presencia de cointervenciones? De los ocho ensayos incluidos en el análisis secuencial de ensayos de FEVI (Fisher 2016), todos excepto dos (que representan más del 70% de los participantes analizados) administraron cointervenciones (IDAC: cuatro ensayos, ICP: un ensayo, onda de choque: un ensayo), mientras que en la revisión actual, estas cointervenciones sólo se administraron en 11 de 39 estudios (28,5% de los participantes). El metanálisis de los pacientes con IC sin opciones para la revascularización y con angina resistente al tratamiento informaron significativamente una mejor FEVI asociada con el tratamiento con células (Fisher 2013; Khan 2016). En la presente revisión no se encontraron pruebas de diferencias de subgrupos en el efecto del tratamiento con células sobre los resultados entre los estudios que administraron cointervenciones y los que no lo hicieron, aunque los análisis de subgrupos tuvieron una considerable falta de poder estadístico, y vale la pena señalar que el tamaño del efecto calculado para la mortalidad y para la FEVI fue más pequeño en los participantes que habían recibido cointervenciones. Esta posible explicación se considera generadora de hipótesis y las posibles diferencias en la eficacia del tratamiento con células entre los estudios que administran cointervenciones y los que no lo hacen no se debe considerar en el diseño de los ensayos y las revisiones sistemáticas futuros.
Limitaciones de la revisión
Las presentes conclusiones se basan en pruebas de baja calidad debido a la falta de precisión en la mayoría de los resultados informados y el posible sesgo de estudio pequeño, así como al riesgo de sesgo debido a la falta de cegamiento, los niveles altos de desgaste y los ensayos financiados por la industria. El tamaño de información obtenido de los análisis secuenciales de ensayos para los resultados clave indicó que en la actualidad los metanálisis tienen un poder estadístico considerablemente bajo, y que se necesitan ensayos aleatorios grandes adicionales antes de que los resultados se puedan considerar consistentes y concluyentes.
El objetivo de esta revisión fue evaluar el efecto de los tratamientos con células sobre los resultados clínicos principales, ya que tienen menos probabilidades de ser afectados por el riesgo de sesgo de realización (cegamiento). Se evaluó la mortalidad por todas las causas. Los resultados predefinidos no incluyeron la mortalidad relacionada con enfermedad cardíaca; se considerará como un resultado en las actualizaciones futuras de la revisión.
Se resumió de manera descriptiva cualquier evento adverso relacionado con el procedimiento informado en los estudios individuales y se concluyó que dichos eventos graves son poco frecuentes. Una evaluación formal de los eventos adversos acumulativos relacionados con el tratamiento con células, relacionados con el procedimiento y al seguimiento a largo plazo, está más allá del alcance de esta revisión.
En resumen, los resultados de esta revisión pueden ser clínicamente relevantes, aunque las pruebas sobre la reducción en el número de muertes con el tratamiento con células en relación con los controles se deben confirmar en ensayos clínicos de mayor tamaño. Con este fin se realizan los primeros ensayos clínicos de fase II/III y de fase III sobre la CI grave (NCT00362388; NCT00747708; NCT01727063), la IC (NCT01768702) y la angina resistente al tratamiento (NCT01508910). Los estudios de investigación también se deben centrar en una mejor comprensión de los mejores tipos de células y en por qué algunos pacientes responden al tratamiento mientras que otros no.
Risk of bias summary: review authors' judgements about each risk of bias item for each included study.
Funnel plot of comparison: 1 Stem cells versus no stem cells, outcome: 1.1 Mortality.
Trial sequential analysis: Mortality at long‐term follow‐up (≥ 12 months). TSMB = trial sequential monitoring boundary; horizontal red lines indicate conventional significance threshold.
Trial sequential analysis: Non‐fatal myocardial infarction at long‐term follow‐up (≥ 12 months). TSMB = trial sequential monitoring boundary; horizontal red lines indicate conventional significance threshold.
Trial sequential analysis: Rehospitalisation due to heart failure at long‐term follow‐up (≥ 12 months). TSMB = trial sequential monitoring boundary; horizontal red lines indicate conventional significance threshold.
Trial sequential analysis: Arrhythmias at long‐term follow‐up (≥ 12 months). TSMB = trial sequential monitoring boundary; horizontal red lines indicate conventional significance threshold.
Trial sequential analysis: Composite MACE at long‐term follow‐up (≥ 12 months). TSMB = trial sequential monitoring boundary; horizontal red lines indicate conventional significance threshold.
Trial sequential analysis: Left ventricular ejection fraction measured by MRI at long‐term follow‐up (≥ 12 months). TSMB = trial sequential monitoring boundary; horizontal red lines indicate conventional significance threshold.
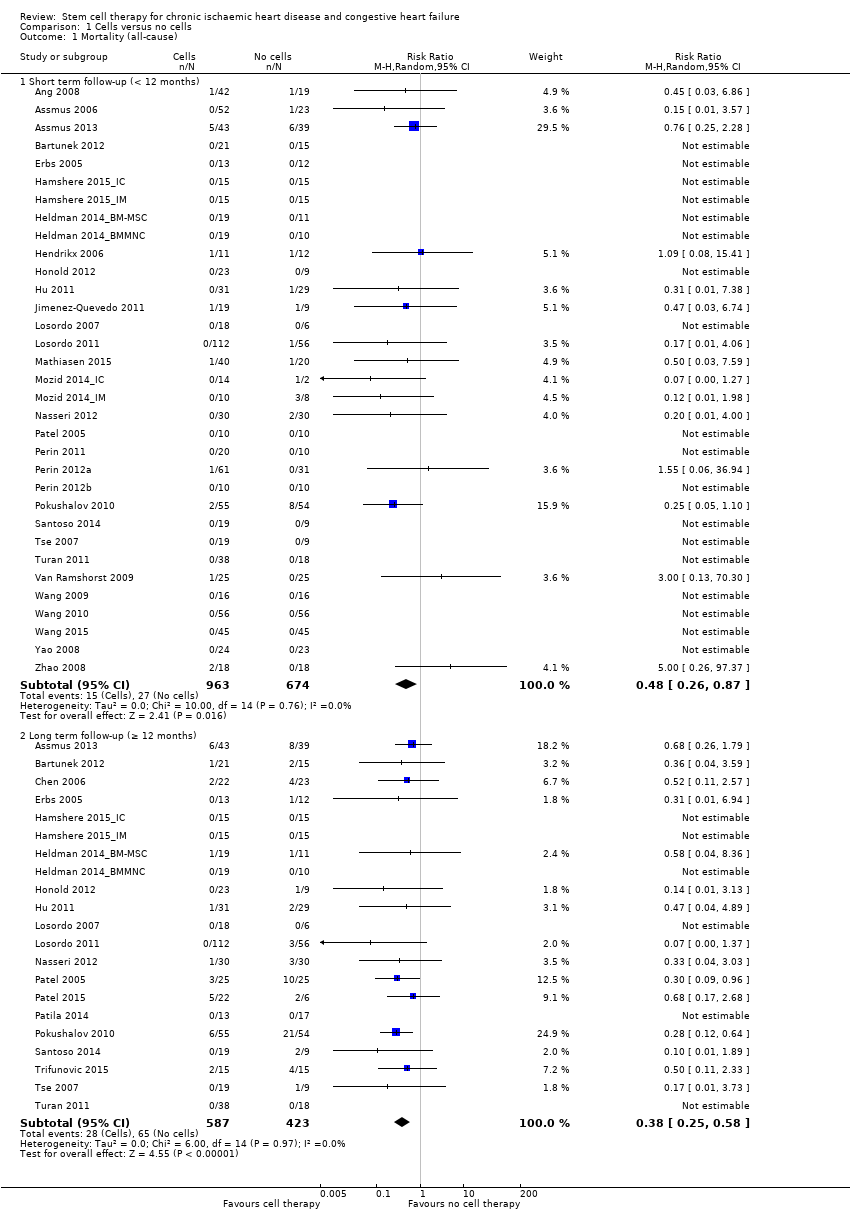
Comparison 1 Cells versus no cells, Outcome 1 Mortality (all‐cause).

Comparison 1 Cells versus no cells, Outcome 2 Non‐fatal myocardial infarction.

Comparison 1 Cells versus no cells, Outcome 3 Rehospitalisation due to heart failure.

Comparison 1 Cells versus no cells, Outcome 4 Arrhythmias.

Comparison 1 Cells versus no cells, Outcome 5 Composite MACE.

Comparison 1 Cells versus no cells, Outcome 6 MLHFQ: short term follow‐up (< 12 months).
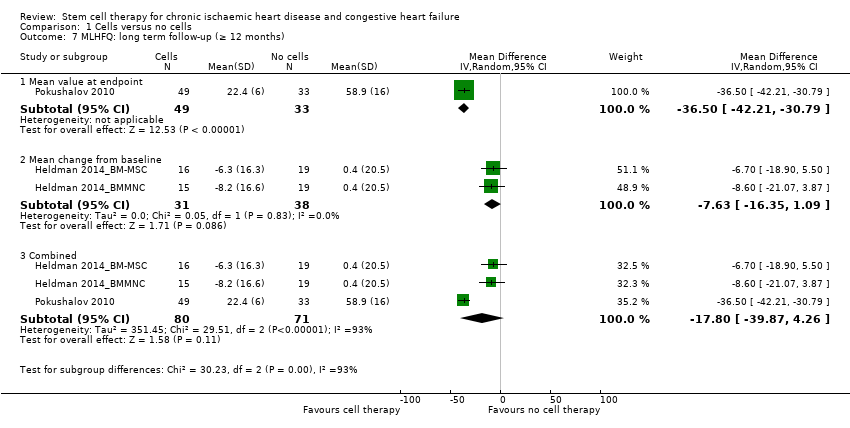
Comparison 1 Cells versus no cells, Outcome 7 MLHFQ: long term follow‐up (≥ 12 months).

Comparison 1 Cells versus no cells, Outcome 8 Seattle Angina Questionnaire: short term follow‐up (< 12 months).
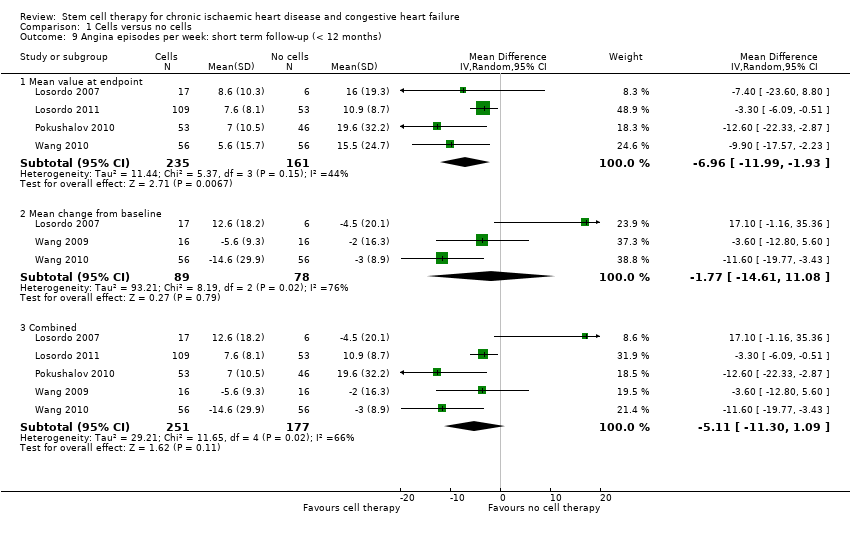
Comparison 1 Cells versus no cells, Outcome 9 Angina episodes per week: short term follow‐up (< 12 months).
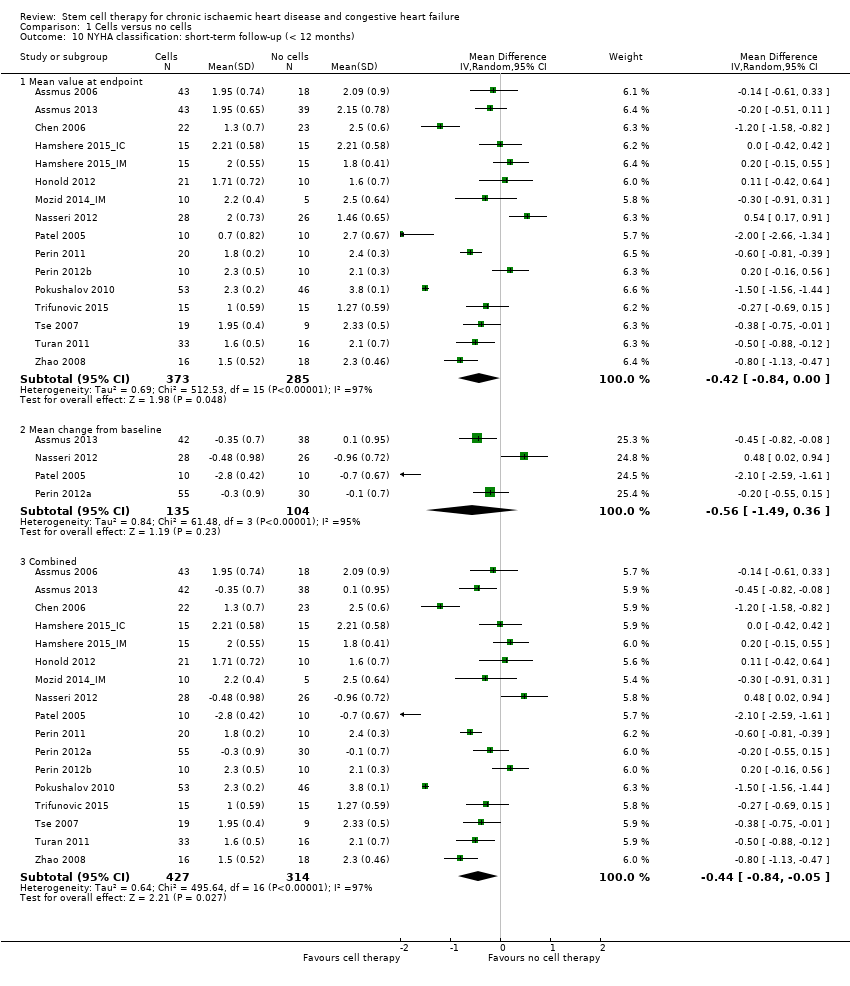
Comparison 1 Cells versus no cells, Outcome 10 NYHA classification: short‐term follow‐up (< 12 months).

Comparison 1 Cells versus no cells, Outcome 11 NYHA classification: long term follow‐up (≥ 12 months).

Comparison 1 Cells versus no cells, Outcome 12 CCS class: short term follow‐up (< 12 months).
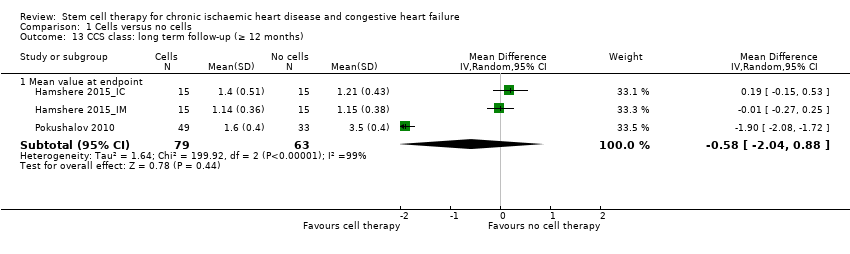
Comparison 1 Cells versus no cells, Outcome 13 CCS class: long term follow‐up (≥ 12 months).
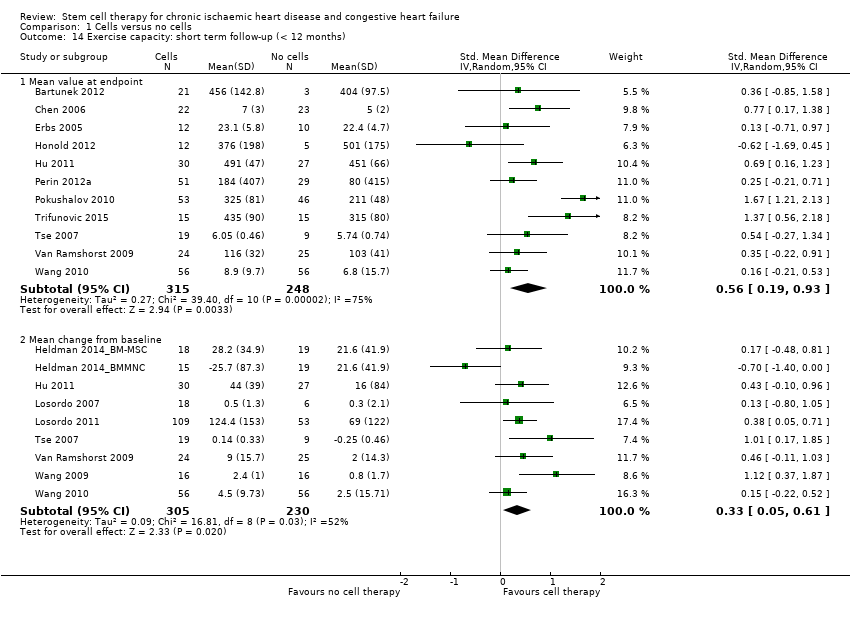
Comparison 1 Cells versus no cells, Outcome 14 Exercise capacity: short term follow‐up (< 12 months).

Comparison 1 Cells versus no cells, Outcome 15 Exercise capacity: long term follow‐up (≥ 12 months).
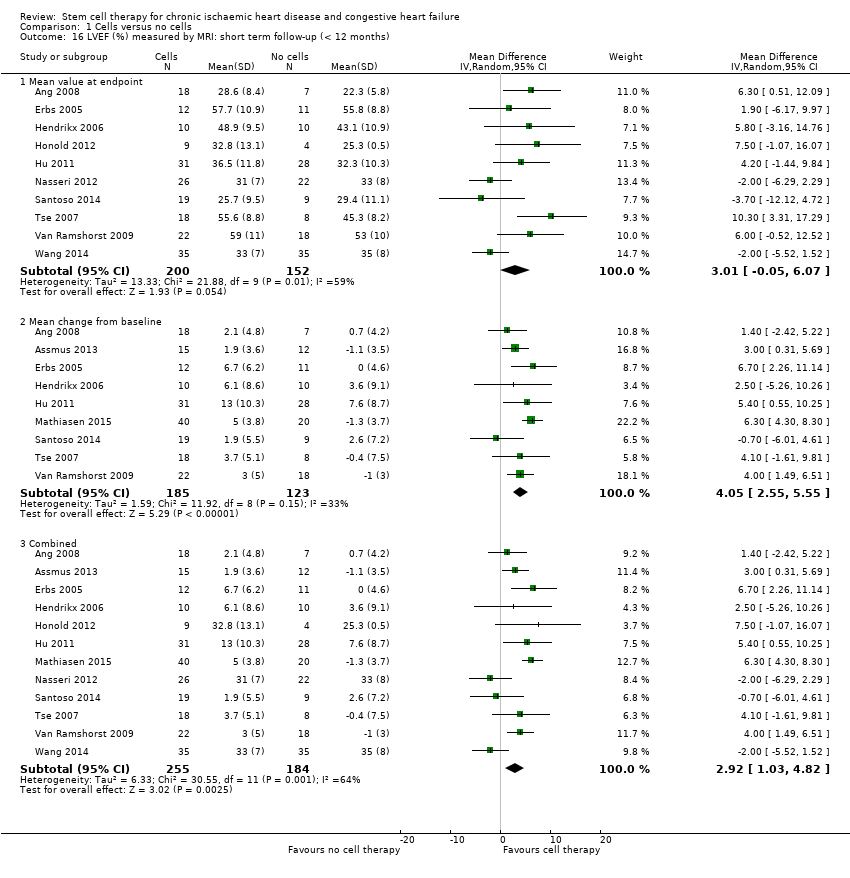
Comparison 1 Cells versus no cells, Outcome 16 LVEF (%) measured by MRI: short term follow‐up (< 12 months).

Comparison 1 Cells versus no cells, Outcome 17 LVEF (%) measured by MRI: long term follow‐up (≥ 12 months).
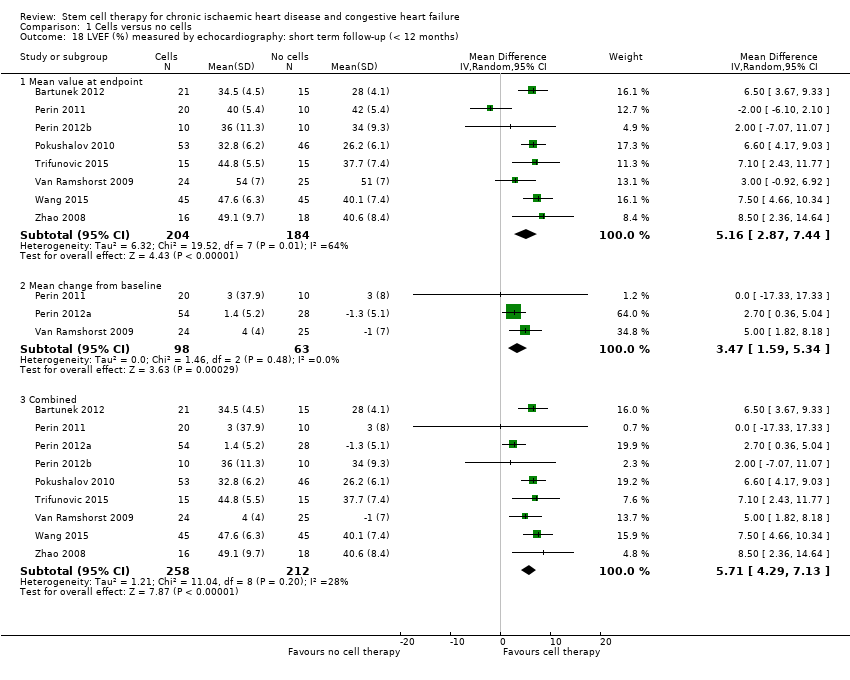
Comparison 1 Cells versus no cells, Outcome 18 LVEF (%) measured by echocardiography: short term follow‐up (< 12 months).
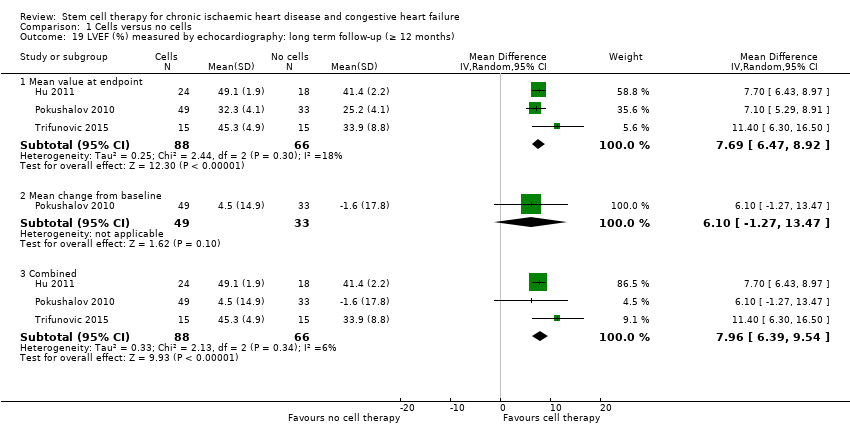
Comparison 1 Cells versus no cells, Outcome 19 LVEF (%) measured by echocardiography: long term follow‐up (≥ 12 months).

Comparison 1 Cells versus no cells, Outcome 20 LVEF (%) measured by SPECT: short term follow‐up (< 12 months).
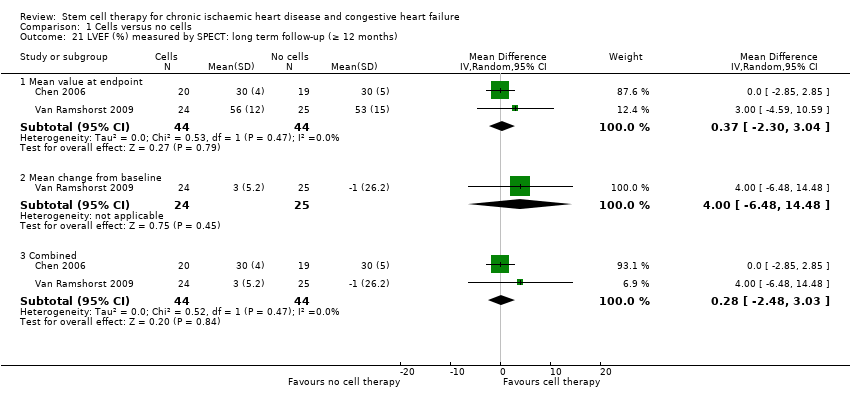
Comparison 1 Cells versus no cells, Outcome 21 LVEF (%) measured by SPECT: long term follow‐up (≥ 12 months).
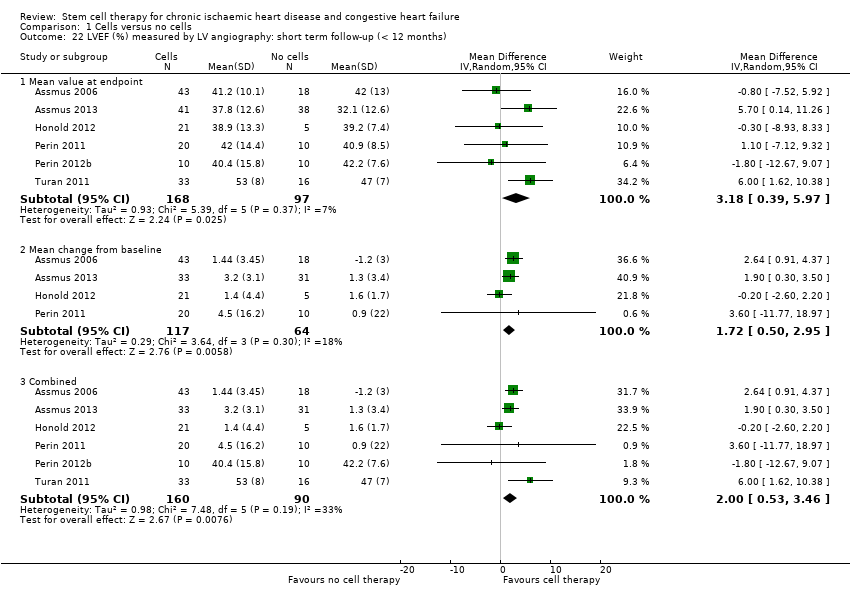
Comparison 1 Cells versus no cells, Outcome 22 LVEF (%) measured by LV angiography: short term follow‐up (< 12 months).

Comparison 1 Cells versus no cells, Outcome 23 LVEF (%) measured by LV angiography: long term follow‐up (≥ 12 months).

Comparison 2 Cell dose: subgroup analysis, Outcome 1 Mortality (all‐cause): short term follow‐up (< 12 months).
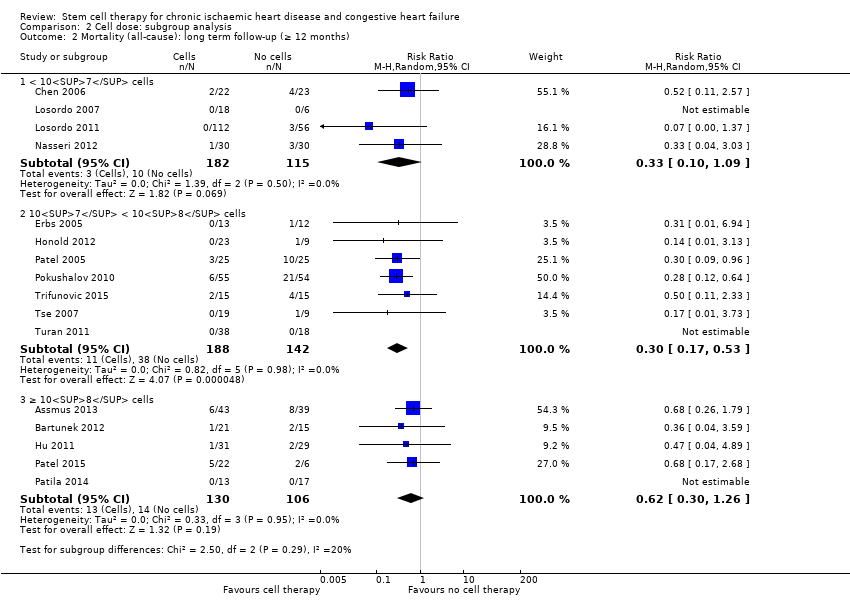
Comparison 2 Cell dose: subgroup analysis, Outcome 2 Mortality (all‐cause): long term follow‐up (≥ 12 months).

Comparison 2 Cell dose: subgroup analysis, Outcome 3 NYHA classification: short term follow‐up (< 12 months).
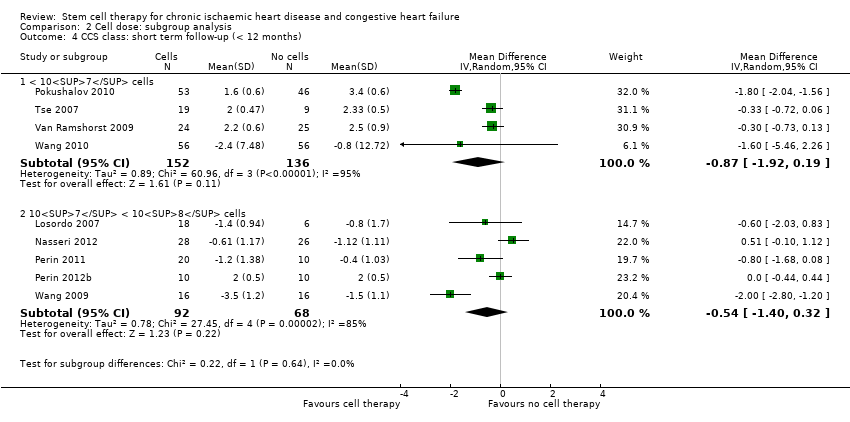
Comparison 2 Cell dose: subgroup analysis, Outcome 4 CCS class: short term follow‐up (< 12 months).
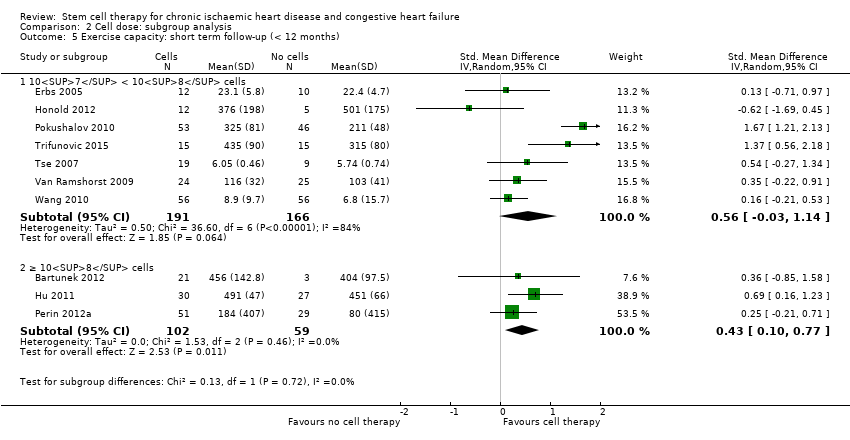
Comparison 2 Cell dose: subgroup analysis, Outcome 5 Exercise capacity: short term follow‐up (< 12 months).

Comparison 2 Cell dose: subgroup analysis, Outcome 6 LVEF (%) measured by MRI: short term follow‐up (< 12 months).

Comparison 3 Baseline cardiac function: subgroup analysis, Outcome 1 Mortality (all‐cause): short term follow‐up (< 12 months).
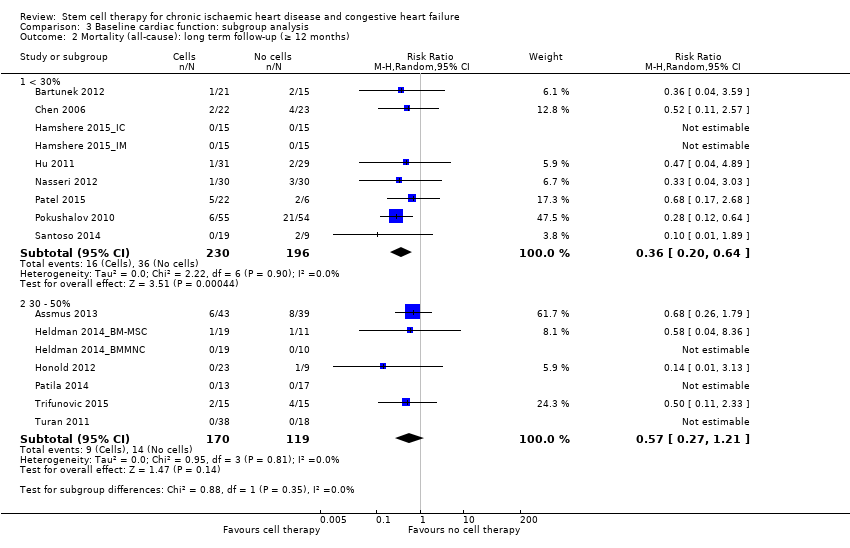
Comparison 3 Baseline cardiac function: subgroup analysis, Outcome 2 Mortality (all‐cause): long term follow‐up (≥ 12 months).

Comparison 3 Baseline cardiac function: subgroup analysis, Outcome 3 NYHA classification: short term follow‐up (< 12 months).

Comparison 3 Baseline cardiac function: subgroup analysis, Outcome 4 NYHA classification: long term follow‐up (≥ 12 months).

Comparison 3 Baseline cardiac function: subgroup analysis, Outcome 5 CCS class: short term follow‐up (< 12 months).

Comparison 3 Baseline cardiac function: subgroup analysis, Outcome 6 Exercise capacity: short term follow‐up (< 12 months).
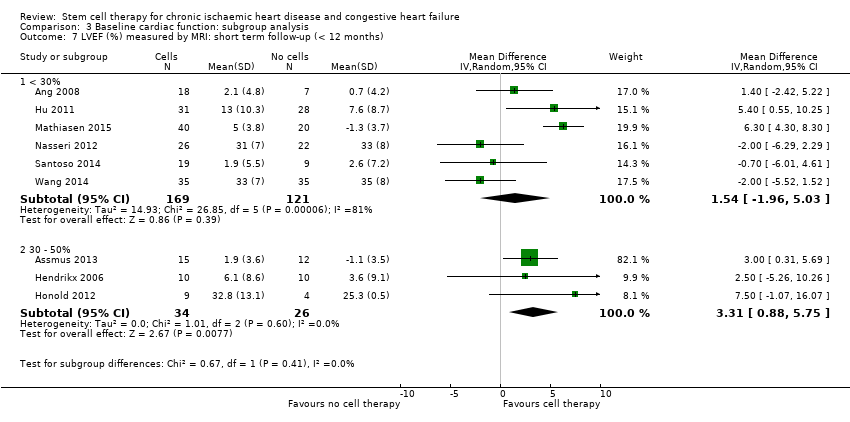
Comparison 3 Baseline cardiac function: subgroup analysis, Outcome 7 LVEF (%) measured by MRI: short term follow‐up (< 12 months).

Comparison 4 Route of cell administration: subgroup analysis, Outcome 1 Mortality (all‐cause): short term follow‐up (< 12 months).

Comparison 4 Route of cell administration: subgroup analysis, Outcome 2 Mortality (all‐cause): long term follow‐up (≥ 12 months).
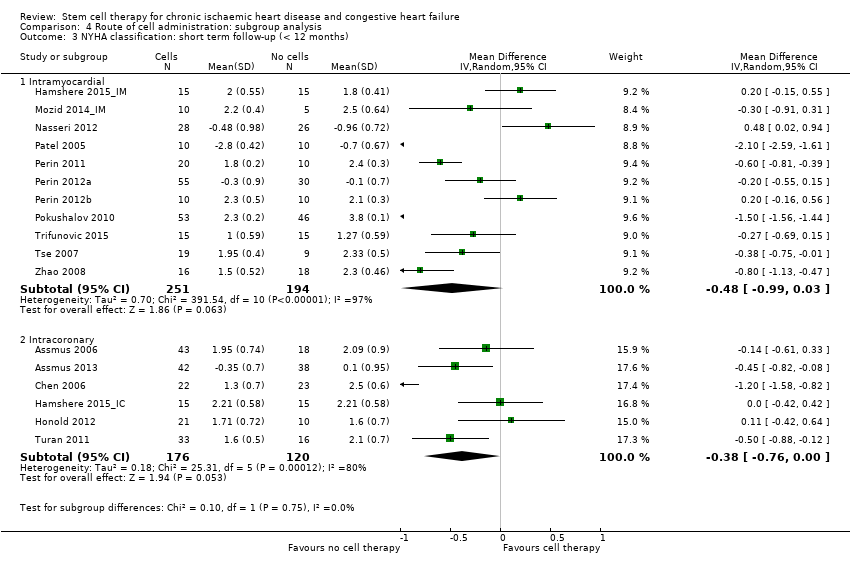
Comparison 4 Route of cell administration: subgroup analysis, Outcome 3 NYHA classification: short term follow‐up (< 12 months).

Comparison 4 Route of cell administration: subgroup analysis, Outcome 4 NYHA classification: long term follow‐up (≥ 12 months).

Comparison 4 Route of cell administration: subgroup analysis, Outcome 5 CCS class: short term follow‐up (< 12 months).

Comparison 4 Route of cell administration: subgroup analysis, Outcome 6 Exercise capacity: short term follow‐up (< 12 months).

Comparison 4 Route of cell administration: subgroup analysis, Outcome 7 LVEF (%) measured by MRI: short term follow‐up (< 12 months).

Comparison 5 Cell type: subgroup analysis, Outcome 1 Mortality (all‐cause): short term follow‐up (< 12 months).
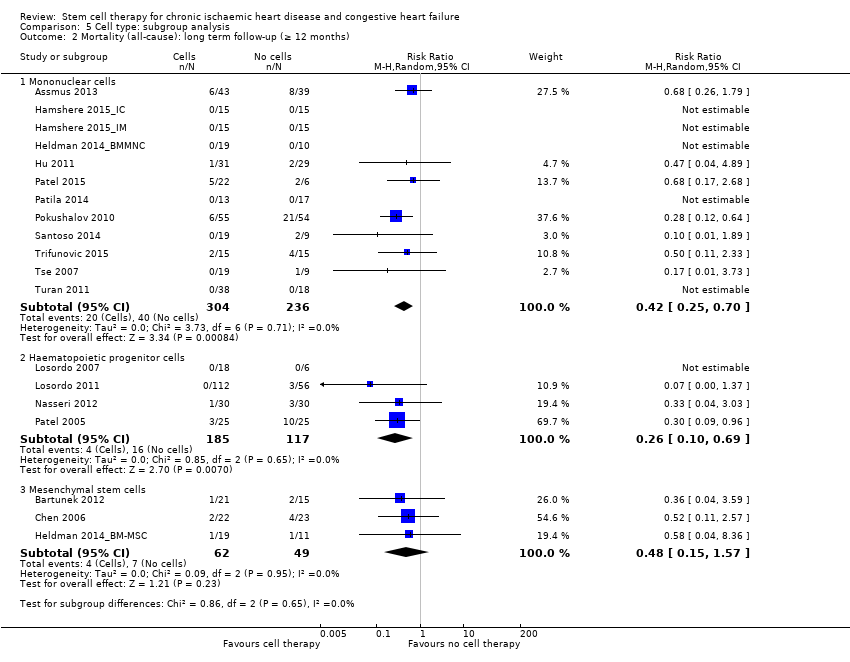
Comparison 5 Cell type: subgroup analysis, Outcome 2 Mortality (all‐cause): long term follow‐up (≥ 12 months).
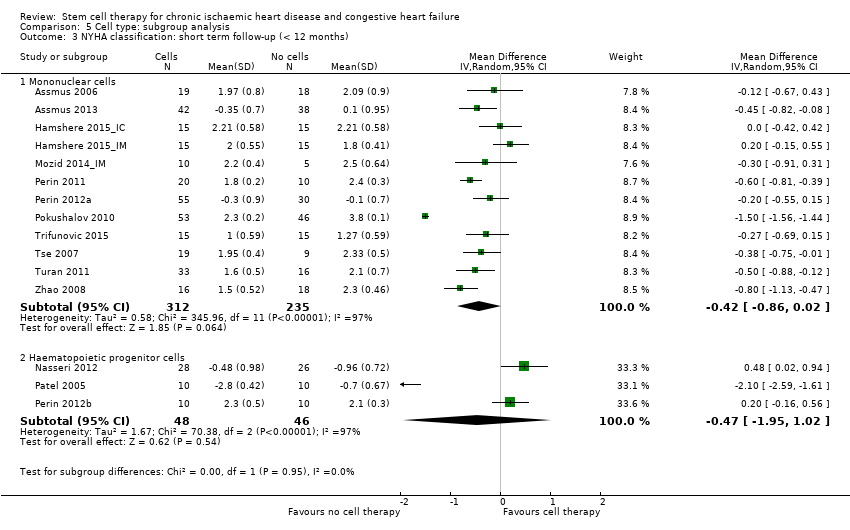
Comparison 5 Cell type: subgroup analysis, Outcome 3 NYHA classification: short term follow‐up (< 12 months).
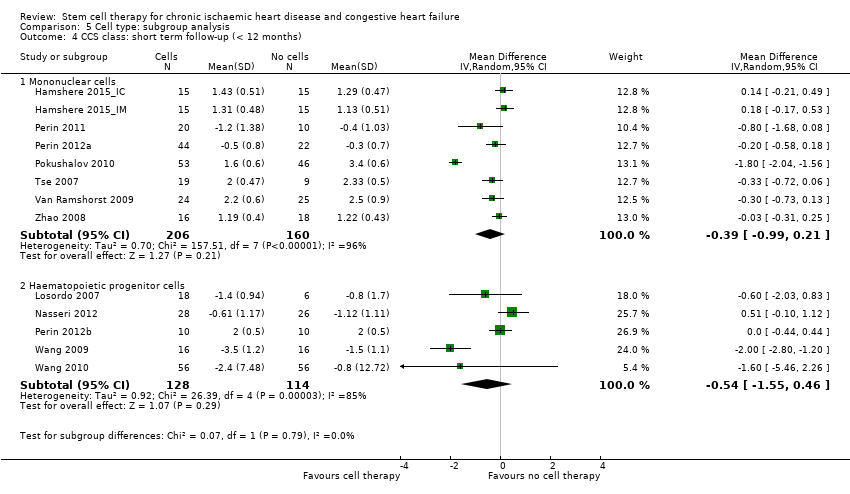
Comparison 5 Cell type: subgroup analysis, Outcome 4 CCS class: short term follow‐up (< 12 months).

Comparison 6 Participant diagnosis: subgroup analysis, Outcome 1 Mortality (all‐cause): short term follow‐up (< 12 months).
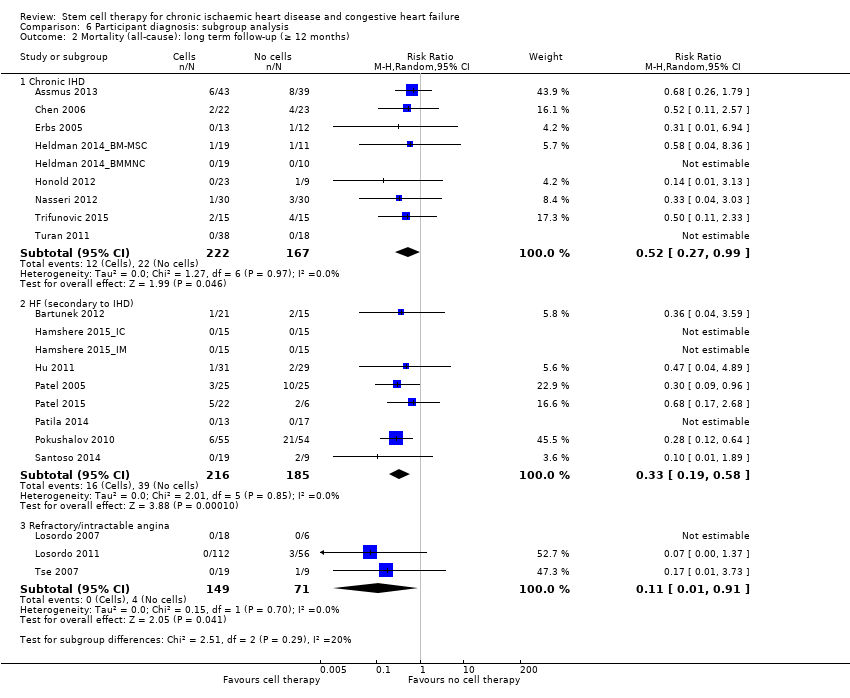
Comparison 6 Participant diagnosis: subgroup analysis, Outcome 2 Mortality (all‐cause): long term follow‐up (≥ 12 months).

Comparison 6 Participant diagnosis: subgroup analysis, Outcome 3 NYHA classification: short term follow‐up (< 12 months).
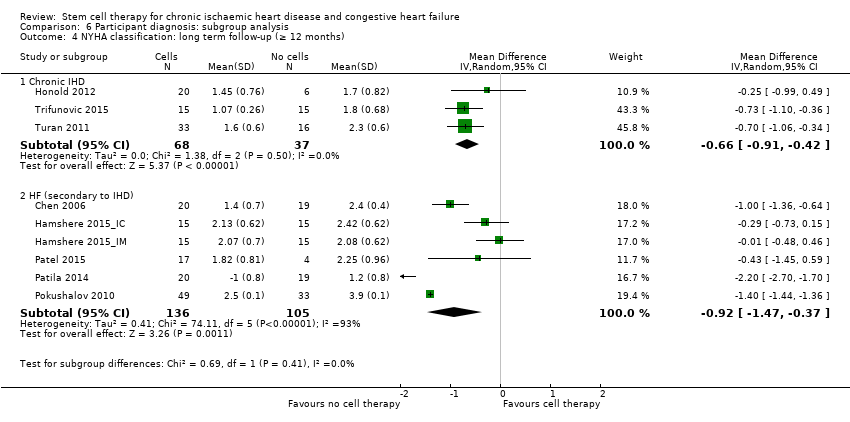
Comparison 6 Participant diagnosis: subgroup analysis, Outcome 4 NYHA classification: long term follow‐up (≥ 12 months).

Comparison 6 Participant diagnosis: subgroup analysis, Outcome 5 CCS class: short term follow‐up (< 12 months).

Comparison 6 Participant diagnosis: subgroup analysis, Outcome 6 Exercise capacity: short term follow‐up (< 12 months).
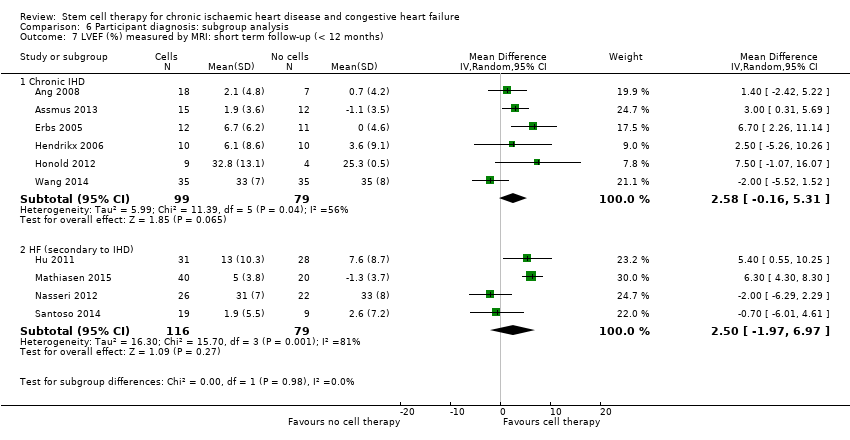
Comparison 6 Participant diagnosis: subgroup analysis, Outcome 7 LVEF (%) measured by MRI: short term follow‐up (< 12 months).

Comparison 7 Co‐interventions: subgroup analysis, Outcome 1 Mortality (all‐cause): short term follow‐up (< 12 months).
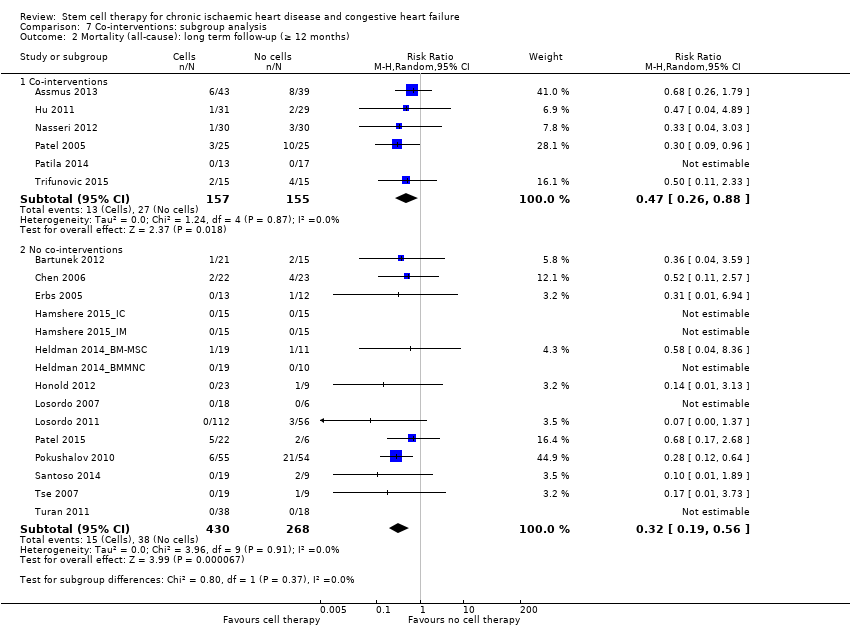
Comparison 7 Co‐interventions: subgroup analysis, Outcome 2 Mortality (all‐cause): long term follow‐up (≥ 12 months).

Comparison 7 Co‐interventions: subgroup analysis, Outcome 3 NYHA classification: short term follow‐up (< 12 months).

Comparison 7 Co‐interventions: subgroup analysis, Outcome 4 LVEF (%) measured by MRI: short term follow‐up (< 12 months).
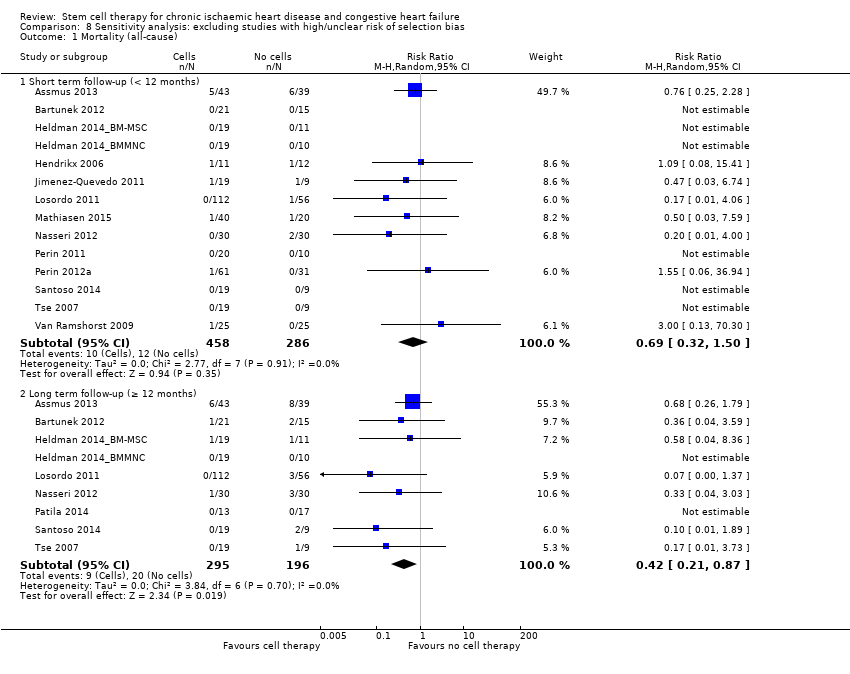
Comparison 8 Sensitivity analysis: excluding studies with high/unclear risk of selection bias, Outcome 1 Mortality (all‐cause).
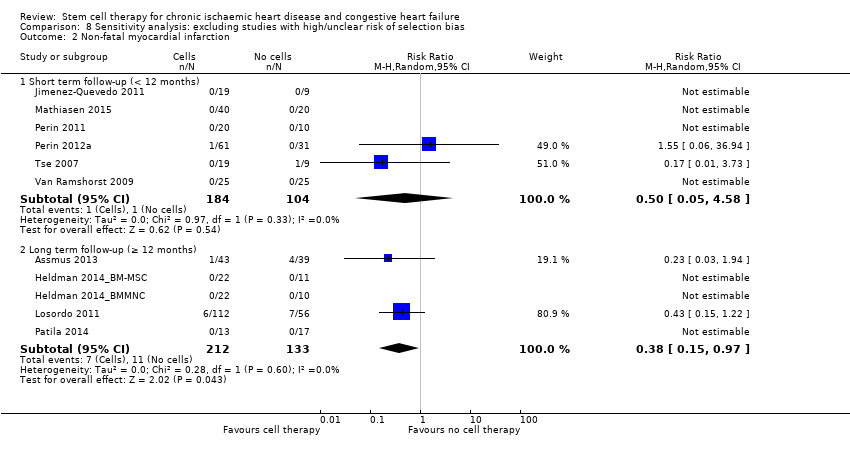
Comparison 8 Sensitivity analysis: excluding studies with high/unclear risk of selection bias, Outcome 2 Non‐fatal myocardial infarction.

Comparison 8 Sensitivity analysis: excluding studies with high/unclear risk of selection bias, Outcome 3 Rehospitalisation due to heart failure.

Comparison 8 Sensitivity analysis: excluding studies with high/unclear risk of selection bias, Outcome 4 Arrhythmias.

Comparison 8 Sensitivity analysis: excluding studies with high/unclear risk of selection bias, Outcome 5 Composite MACE.
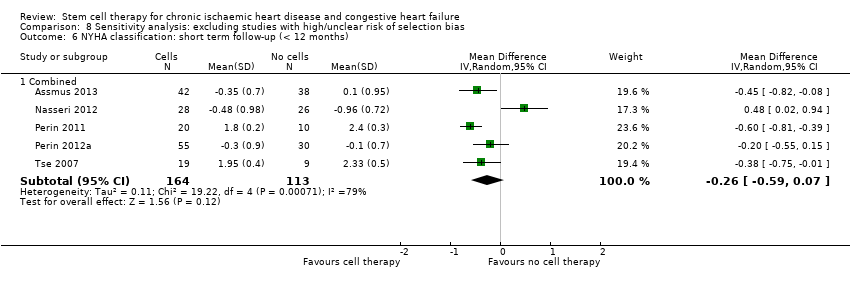
Comparison 8 Sensitivity analysis: excluding studies with high/unclear risk of selection bias, Outcome 6 NYHA classification: short term follow‐up (< 12 months).

Comparison 8 Sensitivity analysis: excluding studies with high/unclear risk of selection bias, Outcome 7 NYHA classification: long term follow‐up (≥ 12 months).

Comparison 8 Sensitivity analysis: excluding studies with high/unclear risk of selection bias, Outcome 8 LVEF (%) measured by MRI: short term follow‐up (< 12 months).

Comparison 8 Sensitivity analysis: excluding studies with high/unclear risk of selection bias, Outcome 9 LVEF (%) measured by MRI: long term follow‐up (≥ 12 months).

Comparison 9 Sensitivity analysis: excluding studies with high/unclear risk of performance bias, Outcome 1 Mortality (all‐cause).

Comparison 10 Sensitivity analysis: excluding studies with high/unclear risk of attrition bias, Outcome 1 Mortality (all‐cause).
| Bone marrow‐derived cell therapy for people with chronic ischaemic heart disease and congestive heart failure | ||||||
| Patient or population: people with chronic ischaemic heart disease and congestive heart failure Comparison: no cell therapy | ||||||
| Outcomes | Illustrative comparative risks* (95% CI) | Relative effect | No of Participants | Quality of the evidence | Comments | |
| Assumed risk | Corresponding risk | |||||
| No cell therapy | Bone marrow‐derived cell therapy | |||||
| Mortality (all cause) Long‐term follow‐up (≥ 12 months) | 102 per 1000 | 43 per 1000 | RR 0.42 | 491 | ⊕⊕⊝⊝ | The required information size of 1899 participants to detect a RRR of 35% has not been reached. |
| Periprocedural adverse events | See comment | See comment | Not estimable | 1695 (34 studies) | See comment | Adverse events occurring during the mapping or cell/placebo injection procedure included ventricular tachycardia (7), ventricular fibrillation (1), atrial fibrillation (1), transient complete heart block (1), transient pulmonary oedema (3), thrombus on mapping catheter tip (1), visual disturbances (2), myocardial perforation (2), limited retrograde catheter‐related dissection of the abdominal aorta (1). |
| Non‐fatal myocardial infarction Long‐term follow‐up (≥ 12 months) | 83 per 1000 | 31 per 1000 | RR 0.38 | 345 | ⊕⊕⊝⊝ | The required information size of 2383 participants to detect a RRR of 35% has not been reached. |
| Rehospitalisation due to heart failure Long‐term follow‐up (≥ 12 months) | 155 per 1000 | 98 per 1000 | RR 0.63 | 375 | ⊕⊕⊝⊝ | The required information size of 1193 participants to detect a RRR of 35% has not been reached. |
| Arrhythmias Long‐term follow‐up (≥ 12 months) | 333 per 1000 | 140 per 1000 | RR 0.42 | 82 | ⊕⊕⊝⊝ | The required information size of 461 participants to detect a RRR of 35% has not been reached. |
| Composite MACE Long‐term follow‐up (≥ 12 months) | 350 per 1000 | 224 per 1000 | RR 0.64 | 141 | ⊕⊕⊝⊝ | The required information size of 431 participants to detect a RRR of 35% has not been reached. |
| LVEF (%) measured by MRI Long‐term follow‐up (≥ 12 months) | ‐ | The mean LVEF (%) measured by MRI in the intervention groups was 1.6 lower (8.7 lower to 5.5 higher). | ‐ | 25 | ⊕⊕⊝⊝ | The required information size of 322 participants to detect a mean difference of 4% has not been reached. |
| *The risk in the intervention group (and its 95% confidence interval) is based on the assumed risk in the comparison group and the relative effect of the intervention (and its 95% CI). ¶Only studies with a low risk of selection bias are included. | ||||||
| GRADE Working Group grades of evidence | ||||||
| 1Six trials received full or partial commercial funding, which could have resulted in a biased assessment of the intervention effect and were therefore deemed to have a high risk of bias. One trial was not blinded (high risk of performance bias) and had a high risk of attrition bias. | ||||||
| Study ID | Country of study | Patient population | Mean (SD) age of participants (years) | % Male | No. randomised participants receiving intervention | No. randomised participants receiving comparator | Mean duration of follow‐up |
| UK | CIHD (> 1 chronic myocardial scar; elective CABG) | BMMNC‐IM: 64.7 (8.7) BMMNC‐IC: 62.1 (8.7) Controls: 61.3 (8.3) | BMMNC‐IM: 71.4% BMMNC‐IC: 90.5% Controls: 90.0% | 42 (21 IM, 21 IC) | 21 | 6 months | |
| Germany | CIHD (MI > 3 months; LV dysfunction) | BMMNC: 59 (12) CPC: 54 (12) Controls: 61 (9) | BMMNC: 89% CPC: 79% Controls: 100% | 52 (28 MNC, 24 CPC) | 23 | 3 months | |
| Germany | CIHD (MI > 3 months; LVEF < 50%; NYHA class II or greater) | BMMNC‐LDSW: 65 (12) BMMNC‐HDSW: 58 (11) Controls‐LDSW: 60 (10) Controls‐HDSW: 63 (10) | BMMNC‐LDSW: 77% BMMNC‐HDSW: 86% Controls‐LDSW: 80% Controls‐HDSW: 90% | 43 (22 LDSW, 21 HDSW) | 39 (20 LDSW, 19 HDSW) | 45.7 (17) months | |
| Belgium/ Serbia/ Switzerland | HF (LVEF 15% to 40%; ischaemic event > 2 months) | BM‐MSC: 55.3 (SE 10.4) Controls: 58.7 (SE 8.2) | BM‐MSC: 90.5% Controls: 86.7% | 32 | 15 | 24 months | |
| China | CIHD (isolated, chronic LAD; LVEF < 40%) | BM‐MSC: 59.3 (6.8) Controls: 57.8 (7.2) | BM‐MSC: 88% Controls: 92% | 24 | 24 | 12 months | |
| Germany | CIHD (chronic total occlusion; myocardial ischaemia) | CPC: 63 (7) Controls: 61 (9) | CPC: 71% Controls: 86% | 14 | 14 | 15 months | |
| UK | HF (NYHA class II‐IV; no revascularisation options) | BMMNC: n/r Controls: n/r | BMMNC: n/r Controls: n/r | 15 | 15 | 12 months | |
| UK | HF (NYHA class II‐IV; no revascularisation options) | BMMNC: n/r Controls: n/r | BMMNC: n/r Controls: n/r | 15 | 15 | 12 months | |
| USA | CIHD (chronic MI; LV dysfunction) | BMMNC: 61.1 (8.4) Controls: 61.3 (9.0) | BMMNC: 89.5% Controls: 100% | 22 | 10 | 12 months | |
| USA | CIHD (chronic MI; LV dysfunction) | BM‐MSC: 57.1 (10.6) Controls: 60.0 (12.0) | BM‐MSC: 94.7% Controls: 90.9% | 22 | 11 | 12 months | |
| Belgium | CIHD (transmural MI; LV dysfunction; elective CABG) | BMMNC: 63.2 (8.5) Controls: 66.8 (9.2) | BMMNC: 100% Controls: 70% | 11 | 12 | 4 months | |
| Germany | CIHD (MI > 3 months; LV regional wall motion abnormality) | CPC: 53.4 (12.3) Controls: 58.8 (7.3) | CPC: 82% Controls: 100% | 23 | 10 | 60 months | |
| China | HF (MI > 3 months; LVEF < 30%; elective CABG) | BMMNC: 56.6 (9.7) Controls: 58.3 (8.9) | BMMNC: 88% Controls: 96% | 31 | 29 | 12 months | |
| Spain | Refractory angina (CCS class II‐IV) | CD133+: median 70.0 Controls: median 58.2 | CD133+: 78.9% Controls: 100% | 19 | 9 | 6 months | |
| USA | Refractory angina (CCS class III‐IV) | CD34+/controls pooled: 62.4 (range 48 to 84) | CD34+/controls pooled: 80% | 18 (6 LD, 6 MD 6, HD) | 6 | 6 months | |
| USA | Refractory angina (CCS class III‐IV) | CD34+/LD: 61.3 (9.1) CD34+/HD: 59.8 (9.2) Controls: 61.8 (8.5) | CD34+/LD: 83.6% CD34+/HD: 87.5% Controls: 89.3% | 112 (56 LD, 56 HD) | 56 | 12 months | |
| Denmark | HF (NYHA class II‐III; LVEF < 45%; no revascularisation options) | BM‐MSC: 66.1 (7.7) Controls: 64.2 (10.6) | BM‐MSC: 90% Controls: 70% | 40 | 20 | 6 months | |
| UK | HF (NYHA class II‐IV; no revascularisation options) | BMMNC/controls pooled (16 participants): 70 (10) | BMMNC/controls pooled (16 participants): 94% | 14 | 2 | 6 months | |
| UK | HF (NYHA class II‐IV; no revascularisation options) | BMMNC/controls pooled (18 participants): 64 (9) | BMMNC/controls pooled (18 participants): 100% | 10 | 8 | 6 months | |
| Germany | HF (LVEF < 35%; elective CABG) | CD133+: 61.9 (7.3) Controls: 62.7 (10.6) | CD133+: 93% Controls: 97% | 30 | 30 | 6 months | |
| Argentina | HF (LVEF < 35%; NYHA class III‐IV; elective CABG) | CD34+: 64.8 (7.1) Controls: 63.6 (5.2) | CD34+: 80% Controls: 80% | 25 | 25 | 10 years | |
| USA/Germany/India | HF (LVEF < 40%; NYHA class III‐IV) | BMAC: 58.5 (12.7) Controls: 52.7 (8.5) | BMAC: 91.7% Controls: 100% | 24 | 6 | 12 months | |
| Finland | HF (LVEF 15% to 40%; NYHA class II‐IV; elective CABG) | BMMNC: median 65 (range 57 to 73) Controls: median 64 (range 58 to 70) | BMMNC: 94.7% Controls: 95.0% | 20 | 19 | 12 months | |
| USA | HF (angina/HF symptoms; chronic CAD; LVEF < 40%; no revascularisation options) | BMMNC: 56.3 (8.6) Controls: 60.5 (6.4) | BMMNC: 50% Controls: 80% | 20 | 10 | 6 months | |
| USA | HF (CCS class II‐IV or NYHA class II‐III, or both; LVEF < 45%; no revascularisation options) | BMMNC: 64.0 (10.9) Controls: 62.3 (8.3) | BMMNC: 86.9% Controls: 93.7% | 61 | 31 | 6 months | |
| USA | HF (CCS class II‐IV or NYHA class II‐III, or both; LVEF < 45%; no revascularisation options) | ALDH+: 58.2 (6.1) Controls: 57.8 (5.5) | ALDH+: 90% Controls: 80% | 10 | 10 | 6 months | |
| Russia | HF (LVEF < 35%; no revascularisation options) | BMMNC: 61 (9) Controls: 62 (5) | BMMNC: 87% Controls: 85% | 55 | 54 | 12 months | |
| Indonesia/China | HF (NYHA class III‐IV; LVEF < 40%; no revascularisation options) | BMMNC: 58 (5.9) Controls: 60 (5.6) | BMMNC: 95% Controls: 100% | 19 | 9 | 6 months | |
| Serbia | CIHD (MI < 30 days; LVEF < 40%; NYHA class III‐IV; elective CABG) | BMMNC: 53.8 (10.1) Controls: 60.0 (6.8) | BMMNC: 93.3% Controls: 93.3% | 15 | 15 | Median 5 years (IQR 2.5 to 7.5) | |
| China/Australia | Refractory angina (CCS class III‐IV) | BMMNC: 65.2 (8.3) Controls: 68.9 (6.3) | BMMNC: 79% Controls: 88% | 19 | 9 | 6 months | |
| Germany | CIHD (MI > 3 months; LV dysfunction) | BMMNC: 62 (10) Controls: 60 (9) | BMMNC: 52.6% Controls: 55.6% | 38 | 18 | 12 months | |
| The Netherlands | Refractory angina (CCS class II‐IV) | BMMNC: 64 (8) Controls: 62 (9) | BMMNC: 92% Controls: 80% | 25 | 25 | 6 months | |
| China | Refractory angina (MI > 1 month) | CD34+: 60.6 (n/r) Controls: 60.0 (n/r) | CD34+: 56.3% Controls: 63.3% | 16 | 16 | 6 months | |
| China | Refractory angina (CCS class III‐IV) | CD34+: range 42 to 80 Controls: range 43 to 80 | CD34+: 51.8% Controls: 50.0% | 56 | 56 | 6 months | |
| China | CIHD (LVEF < 35%) | CD133+: n/r Controls: n/r | CD133+: n/r Controls: n/r | 35 | 35 | 6 months | |
| China | CIHD (multivessel disease; MI > 4 weeks; elective CABG) | BMMNC: 61.4 (7.5) Controls: 62.9 (6.9) | BMMNC: 82% Controls: 78% | 45 | 45 | 6 months | |
| China | CIHD (MI > 6 months) | BMMNC: 54.8 (11.5) Controls: 56.3 (7.9) | BMMNC: 96% Controls: 96% | 24 | 23 | 6 months | |
| China | HF (LVEF < 40%; elective CABG) | BMMNC: 60.3 (10.4) Controls: 59.1 (15.7) | BMMNC: 83.3% Controls: 83.3% | 18 | 18 | 6 months | |
| ALDH: aldehyde dehydrogenase | |||||||
| Study ID | Co‐intervention | Intervention given by: | Route of cell administration | Intervention cell type | How are cells obtained? | What were they resuspended in? | Dose administered? | Comparator arm (placebo or control) |
| CABG | Cardiothoracic surgeon | IC or IM | BMMNC | BM aspiration (**) | Autologous serum | IM: 84 (56) million cells IC: 115 (73) million cells | No additional therapy (control) | |
| Standard medical therapy | Cardiologist | IC | BMMNC or CPC | BM aspiration (**) for BMMNC. Vein puncture, mononuclear cell isolation by gradient centrifugation and culture for 3 days for CPC | n/r | BMMNC: 205 (110) million cells CPC: 22 (11) million cells | No additional therapy (control) | |
| Shockwave | Cardiologist | IC | BMMNC | BM aspiration (**) | X‐VIVO 10 medium and autologous serum | HDSW: 123 (69) million cells LDSW: 150 (77) million cells | Placebo (10 mL X‐VIVO 10 medium and autologous serum) | |
| Standard medical therapy | Cardiologist | IC | BM‐MSC (cardiopoietic cells) | BM aspiration (**), culture for 6 days and exposure to cardiopoietic factors | Preservation solution (no details) | 733 (range 605 to 1168) million cells | No additional therapy (control) | |
| Standard medical therapy | Cardiologist | IC | BM‐MSC | BM aspiration (**), culture for 7 days to select MSC | Heparinised saline | 5 million cells | No additional therapy (control) | |
| G‐CSF | Cardiologist | IC | CPC | G‐CSF infusion for 4 days prior to vein puncture, mononuclear cell isolation by gradient centrifugation and culture for 3 days for CPC | Saline and 10% autologous serum | 69 (14) million cells | Placebo (cell‐free serum solution) | |
| G‐CSF | Cardiologist | IC | BMMNC | G‐CSF infusion for 5 days and BM aspiration (**) | Autologous serum | n/r | Placebo (10 mL autologous serum) | |
| G‐CSF | Cardiologist | IM | BMMNC | G‐CSF infusion for 5 days and BM aspiration (**) | Autologous serum | n/r | Placebo (2 mL autologous serum) | |
| Standard medical therapy | Cardiologist | IM | BMMNC | BM aspiration (**) | n/r | n/r | Placebo (vehicle medium) | |
| Standard medical therapy | Cardiologist | IM | BM‐MSC | BM aspiration (**), culture to select MSC | n/r | n/r | Placebo (vehicle medium) | |
| CABG | Cardiothoracic surgeon | IM | BMMNC | BM aspiration (**) | Heparinised saline | 60 (31) million cells | Placebo (heparinised saline) | |
| G‐CSF | Cardiologist | IC | CPC | G‐CSF infusion for 5 days prior to vein puncture, mononuclear cell isolation by gradient centrifugation and culture for 4 days for CPC | n/r | 29 (12) million cells | No additional therapy (control) | |
| CABG | Cardiothoracic surgeon | IC | BMMNC | BM aspiration (**) | Saline solution and 20% autologous serum | 132 (107) million cells | Placebo (8 mL saline; 2 mL autologous serum) | |
| G‐CSF | Cardiologist | IM | CD133+ | G‐CSF infusion for 5 days prior to leukapheresis, mononuclear cell isolation by gradient centrifugation immunomagnetic selection to isolate CD133+ cells | Normal saline solution | 20 to 30 million cells | No additional therapy (control) | |
| G‐CSF | Cardiologist | IM | CD34+ | G‐CSF infusion for 5 days prior to leukapheresis, mononuclear cell isolation by gradient centrifugation immunomagnetic selection to isolate CD34+ cells | Saline solution and 5% autologous serum | LD: 0.05 million cells MD: 0.1 million cells HD: 0.5 million cells | Placebo (0.9% sodium chloride; 5% autologous plasma) | |
| G‐CSF | Cardiologist | IM | CD34+ | G‐CSF infusion for 5 days prior to leukapheresis, mononuclear cell isolation by gradient centrifugation immunomagnetic selection to isolate CD34+ cells | Saline solution and 5% autologous serum | LD: 0.1 million cells HD: 0.5 million cells | Placebo (0.9% sodium chloride; 5% autologous plasma) | |
| Standard medical therapy | Cardiologist | IM | BM‐MSC | BM aspiration (**), culture for 14 to 35 days to select MSC | Phosphate buffered saline with a drop of the participant’s blood | 77.5 (68) million cells | Placebo (phosphate buffered saline mixed with drop of participant’s blood) | |
| G‐CSF | Cardiologist | IC | BMMNC | G‐CSF infusion for 5 days and BM aspiration (**) | Autologous serum | 86 (110) million cells | Placebo (10 mL autologous serum) | |
| G‐CSF | Cardiologist | IM | BMMNC | G‐CSF infusion for 5 days and BM aspiration (**) | Autologous serum | 52 (53) million cells | Placebo (2 mL autologous serum) | |
| CABG | Cardiothoracic surgeon | IM | CD133+ | BM aspiration (**), immunomagnetic selection to isolate CD133+ cells | Sodium chloride and 10% autologous serum | Median 5.1 million cells | Placebo (isotonic saline solution; 10% autologous serum) | |
| CABG | Cardiothoracic surgeon | IM | CD34+ | BM aspiration (**), immunomagnetic selection to isolate CD34+ cells | Heparinised saline and autologous serum | Median 22 million cells | No additional therapy (control) | |
| Standard medical therapy | Cardiologist | IC | BMAC | BM aspiration (**) and concentration | Autologous serum | 3700 (900) million cells | No additional therapy (control) | |
| CABG | Cardiothoracic surgeon | IM | BMMNC | BM aspiration (**) | Medium 199 containing albumin, heparin | Median 840 (range 52 to 135) million cells | Placebo (vehicle medium) | |
| Standard medical therapy | Cardiologist | IM | BMMNC | BM aspiration (**) | Saline containing 5% human serum albumin | 2 million cells | No additional therapy (control) | |
| Standard medical therapy | Cardiologist | IM | BMMNC | BM aspiration (**) | Saline containing 5% human serum albumin | 100 million cells | Placebo (cell‐free suspension in same volume) | |
| Standard medical therapy | Cardiologist | IM | ALDH+ | BM aspiration (**) and cell sorting | Pharmaceutical grade human serum albumin | 2.4 (1.3) million cells | Placebo (5% pharmaceutical serum albumin) | |
| Standard medical therapy | Cardiologist | IM | BMMNC | BM aspiration (**) | Heparinised saline | 41 (16) million cells | No additional therapy (control) | |
| Standard medical therapy | Cardiologist | IM | BMMNC | BM aspiration (**) | Phosphate buffered saline with 10% autologous plasma | n/r | Placebo (phosphate buffered saline; 10% autologous plasma) | |
| CABG | Cardiothoracic surgeon | IM | BMMNC | BM aspiration (**) | n/r | 70.7 (32.4) million cells | No additional therapy (control) | |
| Standard medical therapy | Cardiologist | IM | BMMNC | BM aspiration (**) | Phosphate buffered saline with 10% autologous plasma | 15 million cells | Placebo (8 ‐ 12 x 0.1 mL phosphate buffered saline with 10% autologous serum) | |
| Standard medical therapy | Cardiologist | IC | BMMNC | BM aspiration (**) | n/r | 99 (25) million cells | No additional therapy (control) | |
| Standard medical therapy | Cardiologist | IM | BMMNC | BM aspiration (**) | Phosphate buffered saline with 0.5% human serum albumin | 98 (6) million cells | Placebo (0.9% sodium chloride; 0.5% human serum albumin) | |
| Standard medical therapy | Cardiologist | IC | CD34+ | BM aspiration (**), immunomagnetic selection to isolate CD34+ cells | Normal saline | Range 1.0 to 6.1 million cells | No additional therapy (control) | |
| Standard medical therapy | Cardiologist | IC | CD34+ | BM aspiration (**), immunomagnetic selection to isolate CD34+ cells | Saline and human serum albumin | 56 (23) million cells | Placebo (saline; human serum albumin) | |
| Standard medical therapy | Cardiologist | IM | CD133+ | n/r | n/r | n/r | Placebo (n/r) | |
| CABG | Cardiothoracic surgeon | IM | BMMNC | BM aspiration (**) | Heparinised saline | 521 (44) million cells | Placebo (saline solution) | |
| Standard medical therapy | Cardiologist | IC | BMMNC | BM aspiration (**) | Heparinised saline | 72 million cells | Placebo (0.9% sodium chloride containing heparin) | |
| CABG | Cardiothoracic surgeon | IM | BMMNC | BM aspiration (**) | Heparinised saline | 659 (512) million cells | Placebo (saline) | |
| **BM aspiration ‐ bone marrow aspiration and isolation of bone marrow mononuclear cells by gradient centrifugation. ALDH: aldehyde dehydrogenase | ||||||||
| Study ID | Primary outcomes | Secondary outcomes | ||||||||||||||||||||
| All‐cause mortality | Non‐fatal MI | Hospital readmission for HF | Composite MACEa | Arrhythmias | NYHA class | CCS class | Angina frequency | Exercise tolerance | Quality of life | LVEFb | ||||||||||||
| ST | LT | ST | LT | ST | LT | ST | LT | ST | LT | ST | LT | ST | LT | ST | LT | ST | LT | ST | LT | ST | LT | |
| FR | NR | PR* | NR | NR | NR | NR | NR | PR* | NR | PR | NR | PR | NR | NR | NR | NR | NR | NR | NR | FR | NR | |
| FR | NR | FR | NR | FR | NR | FR | NR | FR | NR | FR | NR | NR | NR | NR | NR | NR | NR | NR | NR | FR | NR | |
| FR | FR | NR | FR | FR | FR | NR | FR | NR | FR | FR | NR | NR | NR | NR | NR | NR | NR | NR | NR | FR | NR | |
| PR* | FR | NR | NR | NR | FR | NR | NR | PR | PR | PR | NR | NR | NR | NR | NR | FR | NR | PR | NR | FR | NR | |
| NR | FR | NR | NR | NR | NR | NR | NR | PR* | NR | FR | FR | NR | NR | NR | NR | FR | FR | NR | NR | FR | FR | |
| PR* | FR | NR | NR | NR | NR | NR | NR | NR | NR | NR | NR | NR | NR | NR | NR | FR | FR | NR | NR | FR | FR | |
| PR* | PR* | PR* | FR | PR* | PR* | PR* | FR | FR | FR | FR | FR | FR | FR | NR | NR | NR | NR | NR | NR | PR | PR | |
| PR* | PR* | PR* | PR* | FR | FR | FR | FR | FR | FR | FR | FR | FR | FR | NR | NR | NR | NR | NR | NR | PR | PR | |
| PR* | PR* | NR | PR* | NR | FR | PR* | FR | NR | NR | NR | PR | NR | NR | NR | NR | FR | FR | FR | FR | NR | PR | |
| PR* | FR | NR | PR* | NR | PR* | PR* | FR | NR | NR | NR | PR | NR | NR | NR | NR | FR | FR | FR | FR | NR | PR | |
| FR | NR | NR | NR | NR | NR | NR | NR | NR | NR | NR | NR | NR | NR | NR | NR | NR | NR | NR | NR | FR | NR | |
| PR* | FR | FR | FR | PR* | FR | NR | NR | NR | NR | FR | FR | NR | NR | NR | NR | FR | FR | NR | NR | FR | FR | |
| FR | FR | PR* | NR | NR | NR | FR | NR | PR* | FR | NR | NR | NR | NR | NR | NR | FR | NR | NR | NR | FR | FR | |
| FR | NR | PR* | NR | NR | NR | PR | NR | FR | NR | NR | NR | PR | NR | PR | NR | PR | NR | PR | NR | PR | NR | |
| PR* | PR* | PR* | PR* | NR | NR | NR | NR | FR | FR | NR | NR | FR | NR | FR | NR | FR | NR | PR | NR | NR | NR | |
| FR | FR | NR | FR | NR | FR | NR | PR | NR | NR | NR | NR | PR | PR | FR | NR | FR | FR | FR | FR | NR | NR | |
| FR | NR | PR* | NR | FR | NR | NR | NR | FR | NR | PR | NR | PR | NR | PR | NR | PR | NR | PR | NR | FR | NR | |
| FR | NR | PR* | NR | FR | NR | FR | NR | PR* | NR | FR | NR | FR | NR | NR | NR | NR | NR | NR | NR | NR | NR | |
| FR | NR | PR* | NR | PR* | NR | FR | NR | FR | NR | FR | NR | FR | NR | NR | NR | NR | NR | NR | NR | NR | NR | |
| FR | FR | NR | NR | NR | NR | NR | NR | NR | NR | FR | NR | FR | NR | NR | NR | PR | NR | PR | NR | FR | NR | |
| PR* | FR | NR | NR | NR | NR | NR | NR | PR* | NR | FR | NR | NR | NR | NR | NR | NR | NR | NR | NR | PR | PR | |
| NR | FR | NR | NR | NR | FR | NR | NR | NR | PR* | NR | FR | NR | PR | NR | NR | NR | NR | NR | PR | PR | PR | |
| NR | PR* | NR | PR* | NR | FR | NR | NR | NR | NR | NR | FR | NR | NR | NR | NR | NR | NR | NR | PR | NR | FR | |
| PR* | NR | PR* | NR | NR | NR | NR | NR | PR* | NR | FR | NR | FR | NR | NR | NR | NR | NR | FR | NR | FR | NR | |
| FR | NR | FR | NR | FR | NR | NR | NR | NR | NR | FR | NR | FR | NR | NR | NR | FR | NR | NR | NR | FR | NR | |
| PR* | NR | FR | NR | NR | NR | NR | NR | FR | NR | FR | NR | FR | NR | NR | NR | NR | NR | NR | NR | FR | NR | |
| FR | FR | NR | NR | NR | NR | NR | NR | PR* | PR* | FR | FR | FR | FR | FR | FR | FR | FR | FR | FR | FR | FR | |
| PR* | FR | NR | NR | NR | NR | NR | NR | FR | NR | PR | NR | NR | NR | NR | NR | PR | NR | NR | NR | FR | NR | |
| NR | FR | NR | NR | NR | NR | NR | NR | NR | NR | FR | FR | NR | NR | NR | NR | FR | FR | NR | NR | FR | FR | |
| PR* | FR | FR | NR | NR | NR | NR | NR | PR* | NR | FR | NR | FR | NR | NR | NR | FR | NR | NR | NR | FR | NR | |
| PR* | PR* | NR | NR | NR | NR | NR | NR | NR | NR | FR | FR | NR | NR | NR | NR | NR | NR | NR | NR | FR | FR | |
| FR | NR | PR* | NR | NR | NR | NR | NR | PR* | NR | NR | NR | FR | NR | NR | NR | FR | NR | FR | NR | FR | FR | |
| PR* | NR | PR* | NR | NR | NR | NR | NR | PR* | NR | NR | NR | FR | NR | FR | NR | FR | NR | NR | NR | NR | NR | |
| PR* | NR | PR* | NR | NR | NR | NR | NR | FR | NR | NR | NR | FR | NR | FR | NR | FR | NR | NR | NR | NR | NR | |
| NR | NR | NR | NR | NR | NR | NR | NR | NR | NR | PR | NR | NR | NR | NR | NR | PR | NR | NR | NR | FR | NR | |
| PR* | NR | NR | NR | NR | NR | NR | NR | PR | NR | NR | NR | NR | NR | NR | NR | NR | NR | NR | NR | FR | NR | |
| PR* | NR | FR | NR | FR | NR | NR | NR | PR* | NR | NR | NR | NR | NR | NR | NR | NR | NR | NR | NR | PR | NR | |
| FR | NR | PR* | NR | NR | NR | NR | NR | FR | NR | FR | NR | FR | NR | NR | NR | NR | NR | NR | NR | FR | NR | |
| Total (%) analysedc | 1637 (85.8) | 1010 (53.0) | 881 (46.2) | 461 (24.2) | 482 (25.3) | 495 (26.0) | 288 (15.1) | 201 (10.5) | 959 (50.3) | 363 (19.0) | 741 (38.9) | 346 (18.1) | 608 (31.9) | 142 (7.4) | 428 (22.4) | 82 (4.3)d | 535 (28.1) | 227 (11.9) | 197 (10.3)e | 151 (7.9)e | 439 (23.0)f | 110 (5.8)f |
| CCS: Canadian Cardiovascular Society; FR: full reporting, outcome included in analysis; HF: heart failure; LT: long‐term follow‐up (≥ 12 months); LVEF: left ventricular ejection fraction; MACE: major adverse clinical events; MI: myocardial infarction; NR: outcome not reported; NYHA: New York Heart Association; PR: partial reporting with insufficient information on outcome reported for inclusion in analysis; PR*: no incidence of outcome observed; ST: short‐term follow‐up (< 12 months) aComposite measure of mortality, reinfarction, or rehospitalisation for heart failure. | ||||||||||||||||||||||
| Study ID | Number of analysed participants | All‐cause mortality events | Non‐fatal MI events | Hospital readmission for HF | Composite MACEa | Arrhythmia events | |||||||||||
| Cells | No cells | Cells | No cells | Length of follow‐up | Cells | No cells | Length of follow‐up | Cells | No cells | Length of follow‐up | Cells | No cells | Length of follow‐up | Cells | No cells | Length of follow‐up | |
| 42 | 19 | 1 | 1 | 6 mthsa | 0 | 0 | 6 mths | n/r | n/r | n/r | n/r | n/r | n/r | 0 | 0 | 6 mths | |
| 52 | 23 | 0 | 1 | 3 mths | 1 | 0 | 3 mths | 1 | 1 | 3 mths | 1 | 1 | 3 mths | 0 | 1 | 3 mths | |
| 43 | 39 | 6 | 8 | 45.7 (17) mths | 1 | 4 | 45.7 (17) mths | 8 | 13 | 45.7 (17) mths | 14 | 19 | 45.7 (17) mths | 6 | 13 | 45.7 (17) mths | |
| 21 | 15 | 1 | 2 | 24 mths | n/r | n/r | n/r | 6 | 4 | 24 mths | n/r | n/r | n/r | n/r | n/r | n/r | |
| 22 | 23 | 2 | 4 | 12 mths | n/r | n/r | n/r | n/r | n/r | n/r | n/r | n/r | n/r | 0 | 0 | 6 mths | |
| 13 | 12 | 0 | 1 | 15 mths | n/r | n/r | n/r | n/r | n/r | n/r | n/r | n/r | n/r | n/r | n/r | n/r | |
| 15 | 15 | 0 | 0 | 12 mths | 1 | 0 | 12 mths | 0 | 0 | 12 mths | 1 | 0 | 12 mths | 1 | 1 | 12 mths | |
| 15 | 15 | 0 | 0 | 12 mths | 0 | 0 | 12 mths | 1 | 1 | 12 mths | 1 | 1 | 12 mths | 0 | 1 | 12 mths | |
| 19 | 10 | 0 | 0 | 12 mths | 0 | 0 | 12 mths | 0 | 1 | 12 mths | 0 | 1 | 12 mths | n/r | n/r | n/r | |
| 19 | 11 | 1 | 1 | 12 mths | 0 | 0 | 12 mths | 0 | 0 | 12 mths | 1 | 1 | 12 mths | n/r | n/r | n/r | |
| 11 | 12 | 1 | 1 | 4 mths | n/r | n/r | n/r | n/r | n/r | n/r | n/r | n/r | n/r | n/r | n/r | n/r | |
| 23 | 9 | 0 | 1 | 60 mths | 1 | 2 | 60 mths | 0 | 2 | 60 mths | n/r | n/r | n/r | n/r | n/r | n/r | |
| 31 | 29 | 1 | 2 | 12 mths | 0 | 0 | 6 mths | n/r | n/r | n/r | 3 | 4 | 6 mths | 1 | 0 | 12 mths | |
| 19 | 9 | 1 | 1 | 6 mths | 0 | 0 | 6 mths | n/r | n/r | n/r | n/r | n/r | n/r | 1 | 1 | 6 mths | |
| 18 | 6 | 0 | 0 | 12 mths | 0 | 0 | 12 mths | n/r | n/r | n/r | n/r | n/r | n/r | 0 | 1 | 12 mths | |
| 112 | 56 | 0 | 3 | 12 mths | 6 | 7 | 12 mths | 3 | 4 | 12 mths | n/r | n/r | n/r | n/r | n/r | n/r | |
| 40 | 20 | 1 | 1 | 6 mths | 0 | 0 | 6 mths | 6 | 2 | 6 mths | n/r | n/r | n/r | 3 | 1 | 6 mths | |
| 14 | 2 | 0 | 1 | 6 mths | 0 | 0 | 6 mths | 1 | 0 | 6 mths | 1 | 1 | 6 mths | 0 | 0 | 6 mths | |
| 10 | 8 | 0 | 3 | 6 mths | 0 | 0 | 6 mths | 0 | 0 | 6 mths | 0 | 3 | 6 mths | 2 | 2 | 6 mths | |
| 30 | 30 | 1 | 3 | 34 mthsb | n/r | n/r | n/r | n/r | n/r | n/r | n/r | n/r | n/r | n/r | n/r | n/r | |
| 25 | 25 | 3 | 10 | 10 yrs | n/r | n/r | n/r | n/r | n/r | n/r | n/r | n/r | n/r | 0 | 0 | 6 mths | |
| 22 | 6 | 5 | 2 | 12 mths | n/r | n/r | n/r | 2 | 0 | 12 mths | n/r | n/r | n/r | 0 | 0 | 12 mths | |
| 13c | 17c | 0 | 0 | Median 60 mths | 0 | 0 | Median 60 mths | 1 | 1 | Median 60 mths | n/r | n/r | n/r | n/r | n/r | n/r | |
| 20 | 10 | 0 | 0 | 6 mths | 0 | 0 | 6 mths | n/r | n/r | n/r | n/r | n/r | n/r | 0 | 0 | 6 mths | |
| 61 | 31 | 1 | 0 | 6 mths | 1 | 0 | 6 mths | 3 | 5 | 6 mths | n/r | n/r | n/r | n/r | n/r | n/r | |
| 10 | 10 | 0 | 0 | 6 mths | 1 | 0 | 6 mths | n/r | n/r | n/r | n/r | n/r | n/r | 3 | 2 | 6 mths | |
| 55 | 54 | 6 | 21 | 12 mths | n/r | n/r | n/r | n/r | n/r | n/r | n/r | n/r | n/r | 0 | 0 | 12 mths | |
| 19 | 9 | 0 | 2 | 23 (8) mths | n/r | n/r | n/r | n/r | n/r | n/r | n/r | n/r | n/r | 1 | 1 | 6 mths | |
| 15 | 15 | 2 | 4 | Median 5 yrs | n/r | n/r | n/r | n/r | n/r | n/r | n/r | n/r | n/r | n/r | n/r | n/r | |
| 19 | 9 | 0 | 1 | 19 (9) mths | 0 | 1 | 3 mths | n/r | n/r | n/r | n/r | n/r | n/r | 0 | 0 | 6 mths | |
| 38 | 18 | 0 | 0 | 12 mths | n/r | n/r | n/r | n/r | n/r | n/r | n/r | n/r | n/r | n/r | n/r | n/r | |
| 25 | 25 | 1 | 0 | 6 mths | 0 | 0 | 6 mths | n/r | n/r | n/r | n/r | n/r | n/r | 0 | 0 | 6 mths | |
| 16 | 16 | 0 | 0 | 6 mths | 0 | 0 | 6 mths | n/r | n/r | n/r | n/r | n/r | n/r | 0 | 0 | 6 mths | |
| 56 | 56 | 0 | 0 | 6 mths | 0 | 0 | 6 mths | n/r | n/r | n/r | n/r | n/r | n/r | 0 | 1 | 6 mthsd | |
| n/r | n/r | n/r | n/r | n/r | n/r | n/r | n/r | n/r | n/r | n/r | n/r | n/r | n/r | n/r | n/r | n/r | |
| 45 | 45 | 0 | 0 | 6 mths | n/r | n/r | n/r | n/r | n/r | n/r | n/r | n/r | n/r | n/r | n/r | n/r | |
| 24 | 23 | 0 | 0 | 6 mths | 0 | 1 | 6 mths | 1 | 2 | 6 mths | n/r | n/r | n/r | 0 | 0 | 6 mths | |
| 18 | 18 | 2 | 0 | 6 mths | 0 | 0 | 6 mths | n/r | n/r | n/r | n/r | n/r | n/r | 1 | 0 | 6 mths | |
| HF: heart failure; MACE: major adverse clinical events; MI: myocardial infarction; n/r: not reported aAng 2008: participants followed up for six months; mortality reported as “death within 30 days of treatment”. | |||||||||||||||||
| Study ID | Periprocedural adverse events |
| 2 deaths (1 control, 1 intracoronary cell therapy) occurred within 30 days of treatment. Reasons were not given, but neither was considered to be related to cell therapy. | |
| In‐hospital events: MI occurred in 1 CPC participant and ventricular arrhythmia detected during monitoring in 1 control participant. | |
| n/r (only safety of shockwave procedure reported) | |
| In the cell therapy group, 1 participant had ventricular tachycardia during procedure which was resolved by cardioversion, and 1 participant had blurred vision after intervention (participant had pre‐existing ophthalmic migraines). Other reported adverse events (gastrointestinal, hepatobiliary, respiratory, thoracic, mediastinal, and peripheral vascular disorders) were not considered to be related to cell therapy. | |
| 3 participants in cell therapy group experienced a transient episode of pulmonary oedema during the injection of stem cells. No sustained arrhythmias were monitored during the procedure. | |
| 1 cell therapy and 1 control participant reported headache, and 1 control participant developed fever during G‐CSF stimulation. G‐CSF resulted in comparable increases in serum C‐reactive protein levels and blood leukocyte count in both CPC and control groups (returned to baseline values within 4 days after G‐CSF). Neither G‐CSF injection nor intracoronary transplantation of CPC caused any elevation in troponin T levels. | |
| n/r | |
| n/r | |
| No participant had significant postprocedural pericardial effusion. Small transient increases in CK‐MB and serum troponin I were observed. There were no treatment emergent serious adverse events among any of participants who received cell therapy. | |
| No participant had significant postprocedural pericardial effusion. Small transient increases in CK‐MB and serum troponin I were observed. There were no treatment emergent serious adverse events among any of participants who received cell therapy. | |
| 1 cell therapy participant died on postoperative day 7 from a perforated oesophageal ulcer complicated by mediastinitis. 1 control participant died on the 5th postoperative day from multiorgan failure secondary to low cardiac output syndrome. | |
| Mild cephalgies and episodes of mild to moderate bone and muscular pain were reported during 5‐day course of G‐CSF. No participant developed chest pain episodes or clinical signs of decompensated HF. No novel ischaemia‐related ECG changes were observed during G‐CSF treatment and after intracoronary CPC infusion. Troponin T levels remained unchanged. Moreover, no specific G‐CSF‐mediated severe complications occurred. Intracoronary infusions were successfully performed without any procedural complications. | |
| 2 participants (unclear which treatment arm) had neurological complications but recovered and were discharged. No participants had arrhythmia. | |
| G‐CSF treatment was well tolerated, all participants presented bone pain as the only symptom. After cell injection, none of the participants had a significant rise in creatine phosphokinase, symptoms, ECG changes, or echocardiographic abnormalities. | |
| 13 participants reported transient increase in angina frequency after administration of G‐CSF. There were no cardiac enzyme elevations, MIs, acute coronary syndromes, or deaths. 1 participant in the placebo group developed ventricular tachycardia during the mapping procedure. No arrhythmias were detected by implantable cardioverter defibrillator, LifeVest, or Holter monitoring in any participant during or after the injection procedure. | |
| Administration of G‐CSF was associated with bone pain (20.1%), angina (17.4%), CHF (2 participants), and 8 participants had troponin elevations consistent with non‐STEMI. In 1 participant a thrombus was observed on the mapping catheter tip as it was removed. 2 participants experienced an apparent myocardial perforation during the injection procedure (1 resulted in haemothorax, which was successfully treated; 1 resulted in cardiac tamponade; this participant died after unsuccessful pericardiocentesis procedure). Elevated troponin levels were observed in 28% of participants at some point during the mobilisation and injection period, all of which were minor and subclinical except for those mentioned above. | |
| 1 participant with a history of episodic ventricular tachycardia developed ventricular tachycardia during the NOGA mapping procedure. Another participant experienced double vision and dizziness during the injection procedure; cerebral‐CT afterwards was normal, but the incident was diagnosed as a minor stroke by the neurologist. 1 participant from the treatment group suffered a stroke 12 days after treatment. | |
| The most common side effects from G‑CSF were bone pain (22%) and low grade pyrexia (65%) (reported in all G‐CSF groups combined). Bleeding from the arterial access site did not differ significantly between the 2 intervention arms. All episodes were minor and resolved with conservative treatment within 24 h of the procedure. As expected, there were increases in troponin and creatine kinase levels postprocedure in both arms. | |
| The most common side effects from G‑CSF were bone pain (22%) and low grade pyrexia (65%) (reported in all G‐CSF groups combined). There were 3 cases of arrhythmia during the intramyocardial procedure that required treatment. Of these, 1 participant developed atrial fibrillation, which reverted to sinus rhythm within 24 h of the procedure. Another participant developed transient complete heart block periprocedure requiring temporary pacing only. The final participant suffered an episode of pulseless ventricular tachycardia following intramyocardial injection, which was successfully cardioverted with a single 200 J external defibrillation and remained haemodynamically stable afterwards. 1 participant died from suspected acute LV failure 6 days after discharge. Bleeding from the arterial access site did not differ significantly between the two intervention arms. All episodes were minor and resolved with conservative treatment within 24 h of the procedure. As expected, there were increases in troponin and creatine kinase levels postprocedure in both arms. | |
| 2 participants in the placebo group died early postoperatively: 1 died on day 8 after developing Candida sepsis following LV failure despite intra‐aortic balloon pump and catecholamine treatment and mechanical assist device implantation, and 1 died on day 22 (reason not given). | |
| 1 participant in the OPCAB plus stem cell therapy group had a haematoma at the bone marrow harvest site. There were no other adverse events in either group (i.e. neurologic, haematologic, vascular, death, or infection events). No participants had any postoperative arrhythmias. | |
| 5 participants who received BMAC experienced “non‐serious adverse events possibly related to the procedure”. Procedure‐related complications included haematomas at the catheterisation site and elevated serum creatinine levels. | |
| There were no differences between treatment groups in participants’ haemodynamics, arterial blood gases, systemic vein oxygen level, blood glucose, acid–base balance, lactate, haemoglobin, body temperature, and diuresis, as well as medications needed. Perioperative measures are reported in detail in Lehtinen 2014. | |
| No perforations or arrhythmias were associated with cell injection procedures. Postprocedural transient left bundle‐branch block (resolved in 24 h) was seen in 1 treated and 1 control participant. 1 treated participant had non‐significant pericardial effusion. No sustained ventricular arrhythmias were observed by Holter monitoring in any participant. Transient fever but no sepsis occurred in 1 control participant. | |
| 1 participant experienced a limited retrograde catheter‐related dissection of the abdominal aorta (withdrawn from study). 1 participant experienced recurrent ventricular tachycardia with hypotension (and received only a small volume of cell product). | |
| No major adverse clinical cardiac events were associated with the cell injection procedures, including no perforations. Electromechanical mapping–related ventricular tachycardia occurred in 2 control participants, and ventricular fibrillation occurred in 1 control participant. No deaths occurred, and HF was not exacerbated in any participant. Holter monitoring showed no sustained ventricular arrhythmia in any participant. | |
| No periprocedural complications occurred in participants who received cell therapy. 2‐dimensional echocardiography did not reveal postprocedural pericardial effusion. Creatine kinase activity and peak troponin T level remained unaltered. No new periprocedural arrhythmias were recorded during 24 h of consecutive electrocardiographic monitoring. An implantable cardioverter defibrillator was implanted to 2 participants with ventricular tachycardia prior to cell injections. | |
| There were no acute procedural‐related complications, including stroke, transient ischaemic attack, ECG changes, sustained ventricular or atrial arrhythmias, and elevation of CPK‐MB. There was also no echocardiographic evidence of pericardial effusion in any participant within the first 24 h of the procedure. | |
| The early postoperative course was uneventful in both groups with no significant differences between them with regard to adverse side effects during hospital stay. There were no significant differences in cardiac‐specific enzymes activities after the operation or the number of atrial fibrillation episodes or appearance of pericardial effusion between the groups. | |
| There were no acute procedure‐related complications, including stroke, transient ischaemic attack, ECG changes, sustained ventricular or atrial arrhythmias, elevation of CPK‐MB, or echocardiographic evidence of pericardial effusion within the first 24 h after the procedure. | |
| There was no inflammatory response or myocardial reaction (white blood cell count, C‐reactive protein, CK, troponin) after cell therapy. There were no immediate pre‐ or postprocedure adverse complications, new electrocardiographic changes, or significant elevations in CK or troponin, and no inflammatory response was observed in participants with bone marrow cell transplant. | |
| In the placebo group, a greater than 0.5‐centimetre pericardial effusion was detected on 2‐dimensional echocardiography in an asymptomatic participant 2 days after the injection procedure, and pericardiocentesis was subsequently performed. | |
| No periprocedural adverse events; cardiac proteins in normal range. | |
| No increase in angina frequency or usage of sublingual NTG was observed in participants of either group. There were no cardiac enzyme elevations, MIs, acute coronary syndromes, or deaths. No participants from either group developed ventricular tachycardia during the cell or saline infusion procedure. No arrhythmias were detected by Holter monitoring in any participant during or after the infusion process. | |
| n/r | |
| Predischarge arrhythmias were reported (as number of events) in both cell therapy and control participants. | |
| Intracoronary application of BMC was performed without any acute or long‐term side effects. There was no inflammatory response or myocardial reaction (i.e. white blood cell count, C‐reactive protein, and creatinine phosphokinase) after cell therapy. | |
| In the perioperative period, sporadic ventricular premature beats and self terminating bouts of rapid atrial fibrillation were observed in both groups. However, 2 participants developed VF, and 1 died in the BMMNC group: 1 participant developed VF on the 5th day postoperatively but was successfully resuscitated and VF well‐controlled, and the other developed refractory VF 5 hours' postoperatively with death on postoperative day 3. There were no ventricular arrhythmias in the control group. | |
| AMI: acute myocardial infarction | |
| Study ID | No. analysed participants | Performance assessment | Mean follow‐up | No. analysed participants | Quality of life assessment | Mean follow‐up | ||||
| Cells | No cells | ST | LT | Cells | No cells | ST | LT | |||
| 21 | 21 | NYHA class (SR)a | 6 mths | n/r | ‐ | ‐ | ‐ | ‐ | ‐ | |
| 21 | 21 | CCS class (SR)b | 6 mths | n/r | ‐ | ‐ | ‐ | ‐ | ‐ | |
| 43 | 18 | NYHA class (EP) | 3 mths | n/r | ‐ | ‐ | ‐ | ‐ | ‐ | |
| 43 | 39 | NYHA class (EP/MC) | 4 mths | n/r | ‐ | ‐ | ‐ | ‐ | ‐ | |
| 21 | 15 | NYHA class (SR)c | 6 mths | n/r | 21 | 15 | MLHFQ (SR)c | 6 mths | n/r | |
| 21 | 15 | 6MWT (distance) (EP) | 6 mths | n/r | ‐ | ‐ | ‐ | ‐ | ‐ | |
| 22d | 23d | NYHA class (EP) | 6 mths | 12 mths | ‐ | ‐ | ‐ | ‐ | ‐ | |
| 22d | 23d | ETT (METs) (EP) | 6 mths | 12 mths | ‐ | ‐ | ‐ | ‐ | ‐ | |
| 12 | 10 | Bike test (max O2 update) (EP) | 3 mths | 15 mths | ‐ | ‐ | ‐ | ‐ | ‐ | |
| 15 | 15 | NYHA class (EP) | 6 mths | 12 mths | ‐ | ‐ | ‐ | ‐ | ‐ | |
| 15 | 15 | CCS class (EP) | 6 mths | 12 mths | ‐ | ‐ | ‐ | ‐ | ‐ | |
| 15 | 15 | NYHA class (EP) | 6 mths | 12 mths | ‐ | ‐ | ‐ | ‐ | ‐ | |
| 15 | 15 | CCS class (EP) | 6 mths | 12 mths | ‐ | ‐ | ‐ | ‐ | ‐ | |
| 17 | 16 | NYHA class (SR)e | n/r | 12 mths | 15 | 19 | MLHFQ (MC) | 6 mths | 12 mths | |
| 15f | 19f | 6MWT (distance) (MC) | 6 mths | 12 mths | ‐ | ‐ | ‐ | ‐ | ‐ | |
| 17 | 16 | NYHA class (SR)e | n/r | 12 mths | 19g | 19g | MLHFQ (MC) | 6 mths | 12 mths | |
| 18h | 19h | 6MWT (distance) (MC) | 6 mths | 12 mths | ‐ | ‐ | ‐ | ‐ | ‐ | |
| 21j | 10j | NYHA class (EP) | 3 mths | 60 mths | ‐ | ‐ | ‐ | ‐ | ‐ | |
| 12k | 5k | Bike test (sec) (EP) | 3 mths | 12 mths | ‐ | ‐ | ‐ | ‐ | ‐ | |
| 30 | 27 | 6MWT (distance) (EP/MC) | 6 mths | n/r | ‐ | ‐ | ‐ | ‐ | ‐ | |
| 19 | 9 | CCS class (median)m | 6 mths | n/r | n/r | n/r | SAQ (median)m | 6 mths | n/r | |
| 15 | 7 | ETT (time; METs) (median)m | 6 mths | n/r | 19 | 9 | Angina frequency (median)n | 6 mths | n/r | |
| 18 | 6 | CCS class (MC) | 6 mths | n/r | 18 | 6 | SAQ (SR)p | 6 mths | n/r | |
| 18 | 6 | ETT (time) (MC) | 6 mths | n/r | 17 | 6 | Angina frequency (EP/MC) | 6 mths | n/r | |
| 109q | 53q | CCS class (SR)r | 6 mths | 12 mths | 109q | 53q | SAQ (MC) | 6 mths | 12 mths | |
| 109q | 53q | ETT (time) (MC) | 6 mths | 12 mths | 109 | 53 | Angina frequency (EP) | 6 mths | n/r | |
| 40 | 40 | NYHA class (SR)s | 6 mths | n/r | 40 | 40 | KCCQ‐QOL (SR)s | 6 mths | n/r | |
| 40 | 40 | CCS class (SR)s | 6 mths | n/r | 40 | 40 | SAQ (SR)s | 6 mths | n/r | |
| 40 | 40 | 6MWT (SR)s | 6 mths | n/r | 40 | 40 | Angina frequency (SR)s | 6 mths | n/r | |
| 14 | 2 | NYHA class (EP) | 6 mths | n/r | ‐ | ‐ | ‐ | ‐ | ‐ | |
| 14 | 2 | CCS class (SR) | 6 mths | n/r | ‐ | ‐ | ‐ | ‐ | ‐ | |
| 10 | 8 | NYHA class (EP) | 6 mths | n/r | ‐ | ‐ | ‐ | ‐ | ‐ | |
| 10 | 8 | CCS class (SR) | 6 mths | n/r | ‐ | ‐ | ‐ | ‐ | ‐ | |
| 28 | 26 | NYHA class (EP/MC)t | 6 mths | n/r | 28 | 26 | MLHFQu | 6 mths | n/r | |
| 28 | 26 | 6MWTu | 6 mths | n/r | ‐ | ‐ | ‐ | ‐ | ‐ | |
| 28 | 26 | CCS class (EP/MC)t | 6 mths | n/r | ‐ | ‐ | ‐ | ‐ | ‐ | |
| 10 | 10 | NYHA class (EP/MC)t | 6 mths | n/r | ‐ | ‐ | ‐ | ‐ | ‐ | |
| 17 | 4 | NYHA class (EP)t | n/r | 12 mths | 17 | 4 | MLHFQ (SR) | n/r | 12 mths | |
| 17 | 4 | CCS class (SR) | n/r | 12 mths | ‐ | ‐ | ‐ | ‐ | ‐ | |
| 20 | 19 | NYHA class (EP/MC) | n/r | 12 mthsv | 20 | 19 | SF‐36w | n/r | 60 mths | |
| 20 | 10 | NYHA class (EP) | 6 mths | n/r | 17 | 9 | MLHFQ (EP) | 6 mths | n/r | |
| 20 | 10 | CCS class (EP/MC) | 6 mths | n/r | 13 | 10 | SF‐36 (physical/mental) (EP) | 6 mths | n/r | |
| 55 | 30 | NYHA class (MC) | 6 mths | n/r | ‐ | ‐ | ‐ | ‐ | ‐ | |
| 44 | 22 | CCS class (MC) | 6 mths | n/r | ‐ | ‐ | ‐ | ‐ | ‐ | |
| 51 | 29 | 6MWT (distance) (EP) | 6 mths | n/r | ‐ | ‐ | ‐ | ‐ | ‐ | |
| 10 | 10 | NYHA class (EP) | 6 mths | n/r | ‐ | ‐ | ‐ | ‐ | ‐ | |
| 10 | 10 | CCS class (EP) | 6 mths | n/r | ‐ | ‐ | ‐ | ‐ | ‐ | |
| 53x | 46x | NYHA class (EP) | 6 mths | 12 mths | 53x | 46x | MLHFQ (EP) | 6 mths | 12 mths | |
| 53x | 46x | CCS class (EP) | 6 mths | 12 mths | 53x | 46x | Angina frequency (EP) | 6 mths | 12 mths | |
| 53x | 46x | 6MWT (distance) (EP) | 6 mths | 12 mths | ‐ | ‐ | ‐ | ‐ | ‐ | |
| 19 | 9 | NYHA class (EP)y | 6 mths | n/r | ‐ | ‐ | ‐ | ‐ | ‐ | |
| 19 | 9 | 6MWT (distance) (EP)y | 6 mths | n/r | ‐ | ‐ | ‐ | ‐ | ‐ | |
| 15 | 15 | NYHA class (EP) | 6 mths | 12 mths | ‐ | ‐ | ‐ | ‐ | ‐ | |
| 15 | 15 | 6MWT (distance) (EP) | 6 mths | 12 mths | ‐ | ‐ | ‐ | ‐ | ‐ | |
| 19 | 9 | NYHA class (EP)t | 6 mths | n/r | ‐ | ‐ | ‐ | ‐ | ‐ | |
| 19 | 9 | CCS class (EP)t | 6 mths | n/r | ‐ | ‐ | ‐ | ‐ | ‐ | |
| 19 | 9 | Treadmill test (time; METs) (EP/MC) | 6 mths | n/r | ‐ | ‐ | ‐ | ‐ | ‐ | |
| 33 | 16 | NYHA class (EP) | 6 mths | 12 mths | ‐ | ‐ | ‐ | ‐ | ‐ | |
| 24 | 25 | CCS class (EP) | 6 mths | n/r | 24 | 25 | SAQ (EP/MC) | 6 mths | n/r | |
| 24 | 25 | Bike test (workload) (EP/MC) | 6 mths | n/r | ‐ | ‐ | ‐ | ‐ | ‐ | |
| 16 | 16 | CCS class (MC) | 6 mths | n/r | 16 | 16 | Angina frequency (MC) | 6 mths | n/r | |
| 16 | 16 | ETT (min) (MC) | 6 mths | n/r | ‐ | ‐ | ‐ | ‐ | ‐ | |
| 56 | 56 | CCS class (EP/MC) | 6 mths | n/r | 56 | 56 | Angina frequency (EP/MC) | 6 mths | n/r | |
| 56 | 56 | ETT (min) (EP/MC) | 6 mths | n/r | ‐ | ‐ | ‐ | ‐ | ‐ | |
| n/r | n/r | NYHA class (SR) | 6 mths | n/r | ‐ | ‐ | ‐ | ‐ | ‐ | |
| n/r | n/r | 5MWT (distance) (SR) | 6 mths | n/r | ‐ | ‐ | ‐ | ‐ | ‐ | |
| 16 | 18 | NYHA class (EP) | 6 mths | n/r | ‐ | ‐ | ‐ | ‐ | ‐ | |
| 16 | 18 | CCS class (EP) | 6 mths | n/r | ‐ | ‐ | ‐ | ‐ | ‐ | |
| CCS: Canadian Cardiovascular Society; EP: endpoint; ETT: exercise tolerance test; KCCQ‐QOL: Kansas City Cardiomyopathy Questionnaire – Quality of Life; LT: long term; MC: mean change from baseline; MET: metabolic equivalent test (mL/kg/min); MLHFQ: Minnesota Living with Heart Failure Questionnaire; n/r: not reported; NYHA: New York Heart Association; SAQ: Seattle Angina Questionnaire; SF‐36: 36‐Item Short Form Health Survey; SR: summary results; ST: short term; 5MWT: 5‐minute walk test; 6MWT: 6‐minute walk test aReported as number of participants in NYHA class III/IV. | ||||||||||
| Study ID | No. randomised participants | No. analysed participants | Baseline LVEF: Mean (SD) | Mean follow‐up of LVEF | ||||
| Cells | No cells | Cells | No cells | Cells | No cells | ST | LT | |
| Measured by MRI | ||||||||
| 42 | 21 | 18 | 7 | IM: 25.4 (8.1) IC: 28.5 (6.5) | 20.9 (8.9) | 6 mths | ‐ | |
| 43 | 39 | 15 | 12 | n/r | n/r | 4 mths | ‐ | |
| 14 | 14 | 12a | 11a | 51.0 (12.1) | 55.8 (12.4) | 3 mths | 15 mths | |
| 11 | 12 | 10 | 10 | 42.9 (10.3) | 39.5 (5.5) | 4 mths | ‐ | |
| 23 | 10 | 9 | 4 | 33.4 (SEM 12.7) | 23.3 (SEM 7.2) | 3 mths | 12 mths | |
| 31 | 29 | 31b | 28b | 23.5 (6.7) | 24.8 (5.2) | 6 mths | 12 mths | |
| 40 | 20 | 40 | 20 | 28.2 (9.3) | 25.1 (8.5) | 6 mths | ‐ | |
| 30 | 30 | 26 | 22 | 27 (6) | 26 (6) | 6 mths | ‐ | |
| 20 | 19 | 18 | 7 | 37.1 (9.5) | 38.5 (13.5) | ‐ | 60 mths | |
| 19 | 9 | 19 | 9 | 23.6 (8.4) | 26.8 (8.8) | 6 mths | ‐ | |
| 19 | 9 | 18 | 8 | 51.9 (8.5) | 45.7 (8.3) | 6 mths | ‐ | |
| 25 | 25 | 22 | 18 | 56 (12) | 54 (10) | 6 mths | ‐ | |
| 35 | 35 | 35 | 35 | 29 (7) | 28 (6) | 6 mths | ‐ | |
| Measured by echocardiography | ||||||||
| 32 | 15 | 21 | 15 | 27.5 (95% CI 25.5, 29.5) | 27.8 (95% CI 25.9, 29.8) | 6 mths | ‐ | |
| 31 | 29 | 24 | 18 | 36.0 (1.2) | 34.7 (1.4) | ‐ | 12 mths | |
| 20 | 10 | 20 | 10 | 37.0 (10.6) | 39.0 (9.1) | 6 mths | ‐ | |
| 61 | 31 | 54 | 28 | 34.7 (8.8) | 32.3 (8.6) | 6 mths | ‐ | |
| 10 | 10 | 10 | 10 | 36.1 (10.9) | 32.1 (10.6) | 6 mths | ‐ | |
| 55 | 54 | 53c | 46c | 27.8 (3.4) | 26.8 (3.8) | 6 mths | 12 mths | |
| 15 | 15 | 15 | 15 | 35.3 (3.9) | 36.5 (5.3) | 6 mths | 12 mths | |
| 25 | 25 | 24 | 25 | 50 (5) | 52 (5) | 6 mths | ‐ | |
| 45 | 45 | 45 | 45 | 39.3 (6.2) | 38.2 (8.0) | 6 mths | ‐ | |
| 18 | 18 | 16 | 18 | 35.8 (7.3) | 36.7 (9.2) | 6 mths | ‐ | |
| Measured by SPECT | ||||||||
| 24 | 24 | 22d | 23d | 26 (6) | 23 (8) | 6 mths | 12 mths | |
| 20 | 10 | 20 | 10 | 41.5 (11.2) | 43.0 (10.4) | 6 mths | ‐ | |
| 25 | 25 | 24 | 25 | 53 (12) | 54 (12) | 6 mths | 12 mths | |
| Measured by LV angiography | ||||||||
| 52 | 23 | 43 | 18 | BMMNC: 41 (11) CPC: 39 (10) | 43 (13) | 3 mths | ‐ | |
| 43 | 39 | 41 | 38 | LDSW: 37.2 (95% CI 31.7, 42.7) HDSW: 32.4 (95% CI 26.9, 37.9) | LDSW: 29.9 (95% CI 24.0, 35.7) HDSW: 32.3 (95% CI 26.5, 38.1) | 4 mths | ‐ | |
| 23 | 10 | 21 | 5 | 37.5 (SEM 12.9) | 37.6 (SEM 7.5) | 3 mths | ‐ | |
| 20 | 10 | 20 | 10 | 37.5 (8.2) | 40.0 (3.2) | 6 mths | ‐ | |
| 10 | 10 | 10 | 10 | 38.0 (17.5) | 41.9 (11.8) | 6 mths | ‐ | |
| 38 | 18 | 33 | 16 | 46 (10) | 46 (10) | 3 mths | 12 mths | |
| 95% CI: 95% confidence interval; BMMNC: bone marrow mononuclear cells; CPC: circulating progenitor cells; HDSW: high‐dose shockwave; IC: intracoronary; IM: intramyocardial; LDSW: low‐dose shockwave; LT: long term; LV: left ventricular; LVEF: left ventricular ejection fraction; SD: standard deviation; SEM: standard error of the mean; SPECT: single‐photon emission computed tomography; ST: short term a12/10 at 15 months. | ||||||||
| Outcome or subgroup title | No. of studies | No. of participants | Statistical method | Effect size |
| 1 Mortality (all‐cause) Show forest plot | 37 | Risk Ratio (M‐H, Random, 95% CI) | Subtotals only | |
| 1.1 Short term follow‐up (< 12 months) | 33 | 1637 | Risk Ratio (M‐H, Random, 95% CI) | 0.48 [0.26, 0.87] |
| 1.2 Long term follow‐up (≥ 12 months) | 21 | 1010 | Risk Ratio (M‐H, Random, 95% CI) | 0.38 [0.25, 0.58] |
| 2 Non‐fatal myocardial infarction Show forest plot | 25 | Risk Ratio (M‐H, Random, 95% CI) | Subtotals only | |
| 2.1 Short term follow‐up (< 12 months) | 20 | 881 | Risk Ratio (M‐H, Random, 95% CI) | 0.60 [0.17, 2.15] |
| 2.2 Long term follow‐up (≥ 12 months) | 9 | 461 | Risk Ratio (M‐H, Random, 95% CI) | 0.40 [0.17, 0.93] |
| 3 Rehospitalisation due to heart failure Show forest plot | 16 | Risk Ratio (M‐H, Random, 95% CI) | Subtotals only | |
| 3.1 Short term follow‐up (< 12 months) | 10 | 482 | Risk Ratio (M‐H, Random, 95% CI) | 0.63 [0.36, 1.12] |
| 3.2 Long term follow‐up (≥ 12 months) | 10 | 495 | Risk Ratio (M‐H, Random, 95% CI) | 0.62 [0.36, 1.04] |
| 4 Arrhythmias Show forest plot | 24 | Risk Ratio (M‐H, Random, 95% CI) | Subtotals only | |
| 4.1 Short term follow‐up (< 12 months) | 22 | 959 | Risk Ratio (M‐H, Random, 95% CI) | 0.70 [0.33, 1.45] |
| 4.2 Long term follow‐up (≥ 12 months) | 7 | 363 | Risk Ratio (M‐H, Random, 95% CI) | 0.46 [0.22, 0.97] |
| 5 Composite MACE Show forest plot | 9 | Risk Ratio (M‐H, Random, 95% CI) | Subtotals only | |
| 5.1 Short term follow‐up (< 12 months) | 8 | 288 | Risk Ratio (M‐H, Random, 95% CI) | 0.51 [0.18, 1.42] |
| 5.2 Long term follow‐up (≥ 12 months) | 5 | 201 | Risk Ratio (M‐H, Random, 95% CI) | 0.68 [0.41, 1.12] |
| 6 MLHFQ: short term follow‐up (< 12 months) Show forest plot | 4 | Mean Difference (IV, Random, 95% CI) | Subtotals only | |
| 6.1 Mean value at endpoint | 2 | 125 | Mean Difference (IV, Random, 95% CI) | ‐29.52 [‐33.76, ‐25.27] |
| 6.2 Mean change from baseline | 2 | 72 | Mean Difference (IV, Random, 95% CI) | ‐9.07 [‐22.09, 3.95] |
| 6.3 Combined | 4 | 197 | Mean Difference (IV, Random, 95% CI) | ‐18.96 [‐31.97, ‐5.94] |
| 7 MLHFQ: long term follow‐up (≥ 12 months) Show forest plot | 3 | Mean Difference (IV, Random, 95% CI) | Subtotals only | |
| 7.1 Mean value at endpoint | 1 | 82 | Mean Difference (IV, Random, 95% CI) | ‐36.5 [‐42.21, ‐30.79] |
| 7.2 Mean change from baseline | 2 | 69 | Mean Difference (IV, Random, 95% CI) | ‐7.63 [‐16.35, 1.09] |
| 7.3 Combined | 3 | 151 | Mean Difference (IV, Random, 95% CI) | ‐17.80 [‐39.87, 4.26] |
| 8 Seattle Angina Questionnaire: short term follow‐up (< 12 months) Show forest plot | 2 | Mean Difference (IV, Random, 95% CI) | Subtotals only | |
| 8.1 Mean value at endpoint | 1 | 49 | Mean Difference (IV, Random, 95% CI) | 5.0 [‐3.21, 13.21] |
| 8.2 Mean change from baseline | 2 | 211 | Mean Difference (IV, Random, 95% CI) | 9.34 [2.62, 16.07] |
| 8.3 Combined | 2 | 211 | Mean Difference (IV, Random, 95% CI) | 9.34 [2.62, 16.07] |
| 9 Angina episodes per week: short term follow‐up (< 12 months) Show forest plot | 5 | Mean Difference (IV, Random, 95% CI) | Subtotals only | |
| 9.1 Mean value at endpoint | 4 | 396 | Mean Difference (IV, Random, 95% CI) | ‐6.96 [‐11.99, ‐1.93] |
| 9.2 Mean change from baseline | 3 | 167 | Mean Difference (IV, Random, 95% CI) | ‐1.77 [‐14.61, 11.08] |
| 9.3 Combined | 5 | 428 | Mean Difference (IV, Random, 95% CI) | ‐5.11 [‐11.30, 1.09] |
| 10 NYHA classification: short‐term follow‐up (< 12 months) Show forest plot | 17 | Mean Difference (IV, Random, 95% CI) | Subtotals only | |
| 10.1 Mean value at endpoint | 16 | 658 | Mean Difference (IV, Random, 95% CI) | ‐0.42 [‐0.84, ‐0.00] |
| 10.2 Mean change from baseline | 4 | 239 | Mean Difference (IV, Random, 95% CI) | ‐0.56 [‐1.49, 0.36] |
| 10.3 Combined | 17 | 741 | Mean Difference (IV, Random, 95% CI) | ‐0.44 [‐0.84, ‐0.05] |
| 11 NYHA classification: long term follow‐up (≥ 12 months) Show forest plot | 9 | Mean Difference (IV, Random, 95% CI) | Subtotals only | |
| 11.1 Mean value at endpoint | 9 | 346 | Mean Difference (IV, Random, 95% CI) | ‐0.57 [‐1.03, ‐0.10] |
| 11.2 Mean change from baseline | 1 | 39 | Mean Difference (IV, Random, 95% CI) | ‐2.2 [‐2.70, ‐1.70] |
| 11.3 Combined | 9 | 346 | Mean Difference (IV, Random, 95% CI) | ‐0.81 [‐1.23, ‐0.39] |
| 12 CCS class: short term follow‐up (< 12 months) Show forest plot | 13 | Mean Difference (IV, Random, 95% CI) | Subtotals only | |
| 12.1 Mean value at endpoint | 10 | 486 | Mean Difference (IV, Random, 95% CI) | ‐0.32 [‐0.82, 0.18] |
| 12.2 Mean change from baseline | 6 | 318 | Mean Difference (IV, Random, 95% CI) | ‐0.62 [‐1.40, 0.17] |
| 12.3 Combined | 13 | 608 | Mean Difference (IV, Random, 95% CI) | ‐0.43 [‐0.92, 0.06] |
| 13 CCS class: long term follow‐up (≥ 12 months) Show forest plot | 3 | Mean Difference (IV, Random, 95% CI) | Subtotals only | |
| 13.1 Mean value at endpoint | 3 | 142 | Mean Difference (IV, Random, 95% CI) | ‐0.58 [‐2.04, 0.88] |
| 14 Exercise capacity: short term follow‐up (< 12 months) Show forest plot | 16 | Std. Mean Difference (IV, Random, 95% CI) | Subtotals only | |
| 14.1 Mean value at endpoint | 11 | 563 | Std. Mean Difference (IV, Random, 95% CI) | 0.56 [0.19, 0.93] |
| 14.2 Mean change from baseline | 9 | 535 | Std. Mean Difference (IV, Random, 95% CI) | 0.33 [0.05, 0.61] |
| 15 Exercise capacity: long term follow‐up (≥ 12 months) Show forest plot | 8 | Std. Mean Difference (IV, Random, 95% CI) | Subtotals only | |
| 15.1 Mean value at endpoint | 5 | 178 | Std. Mean Difference (IV, Random, 95% CI) | 1.14 [0.04, 2.25] |
| 15.2 Mean change from baseline | 3 | 227 | Std. Mean Difference (IV, Random, 95% CI) | 0.34 [0.07, 0.62] |
| 16 LVEF (%) measured by MRI: short term follow‐up (< 12 months) Show forest plot | 12 | Mean Difference (IV, Random, 95% CI) | Subtotals only | |
| 16.1 Mean value at endpoint | 10 | 352 | Mean Difference (IV, Random, 95% CI) | 3.01 [‐0.05, 6.07] |
| 16.2 Mean change from baseline | 9 | 308 | Mean Difference (IV, Random, 95% CI) | 4.05 [2.55, 5.55] |
| 16.3 Combined | 12 | 439 | Mean Difference (IV, Random, 95% CI) | 2.92 [1.03, 4.82] |
| 17 LVEF (%) measured by MRI: long term follow‐up (≥ 12 months) Show forest plot | 4 | Mean Difference (IV, Random, 95% CI) | Subtotals only | |
| 17.1 Mean value at endpoint | 4 | 110 | Mean Difference (IV, Random, 95% CI) | 2.37 [‐1.54, 6.29] |
| 17.2 Mean change from baseline | 3 | 97 | Mean Difference (IV, Random, 95% CI) | 3.83 [‐0.42, 8.08] |
| 17.3 Combined | 4 | 110 | Mean Difference (IV, Random, 95% CI) | 4.38 [0.82, 7.93] |
| 18 LVEF (%) measured by echocardiography: short term follow‐up (< 12 months) Show forest plot | 9 | Mean Difference (IV, Random, 95% CI) | Subtotals only | |
| 18.1 Mean value at endpoint | 8 | 388 | Mean Difference (IV, Random, 95% CI) | 5.16 [2.87, 7.44] |
| 18.2 Mean change from baseline | 3 | 161 | Mean Difference (IV, Random, 95% CI) | 3.47 [1.59, 5.34] |
| 18.3 Combined | 9 | 470 | Mean Difference (IV, Random, 95% CI) | 5.71 [4.29, 7.13] |
| 19 LVEF (%) measured by echocardiography: long term follow‐up (≥ 12 months) Show forest plot | 3 | Mean Difference (IV, Random, 95% CI) | Subtotals only | |
| 19.1 Mean value at endpoint | 3 | 154 | Mean Difference (IV, Random, 95% CI) | 7.69 [6.47, 8.92] |
| 19.2 Mean change from baseline | 1 | 82 | Mean Difference (IV, Random, 95% CI) | 6.1 [‐1.27, 13.47] |
| 19.3 Combined | 3 | 154 | Mean Difference (IV, Random, 95% CI) | 7.96 [6.39, 9.54] |
| 20 LVEF (%) measured by SPECT: short term follow‐up (< 12 months) Show forest plot | 4 | Mean Difference (IV, Random, 95% CI) | Subtotals only | |
| 20.1 Mean value at endpoint | 4 | 145 | Mean Difference (IV, Random, 95% CI) | 2.41 [‐2.65, 7.46] |
| 20.2 Mean change from baseline | 1 | 30 | Mean Difference (IV, Random, 95% CI) | ‐2.3 [‐17.33, 12.73] |
| 20.3 Combined | 4 | 145 | Mean Difference (IV, Random, 95% CI) | 5.22 [2.60, 7.85] |
| 21 LVEF (%) measured by SPECT: long term follow‐up (≥ 12 months) Show forest plot | 2 | Mean Difference (IV, Random, 95% CI) | Subtotals only | |
| 21.1 Mean value at endpoint | 2 | 88 | Mean Difference (IV, Random, 95% CI) | 0.37 [‐2.30, 3.04] |
| 21.2 Mean change from baseline | 1 | 49 | Mean Difference (IV, Random, 95% CI) | 4.0 [‐6.48, 14.48] |
| 21.3 Combined | 2 | 88 | Mean Difference (IV, Random, 95% CI) | 0.28 [‐2.48, 3.03] |
| 22 LVEF (%) measured by LV angiography: short term follow‐up (< 12 months) Show forest plot | 6 | Mean Difference (IV, Random, 95% CI) | Subtotals only | |
| 22.1 Mean value at endpoint | 6 | 265 | Mean Difference (IV, Random, 95% CI) | 3.18 [0.39, 5.97] |
| 22.2 Mean change from baseline | 4 | 181 | Mean Difference (IV, Random, 95% CI) | 1.72 [0.50, 2.95] |
| 22.3 Combined | 6 | 250 | Mean Difference (IV, Random, 95% CI) | 2.00 [0.53, 3.46] |
| 23 LVEF (%) measured by LV angiography: long term follow‐up (≥ 12 months) Show forest plot | 1 | Mean Difference (IV, Random, 95% CI) | Subtotals only | |
| 23.1 Mean value at endpoint | 1 | 49 | Mean Difference (IV, Random, 95% CI) | 6.0 [0.81, 11.19] |
| Outcome or subgroup title | No. of studies | No. of participants | Statistical method | Effect size |
| 1 Mortality (all‐cause): short term follow‐up (< 12 months) Show forest plot | 30 | Risk Ratio (M‐H, Random, 95% CI) | Subtotals only | |
| 1.1 < 107 cells | 6 | 334 | Risk Ratio (M‐H, Random, 95% CI) | 0.18 [0.02, 1.63] |
| 1.2 107 < 108 cells | 18 | 771 | Risk Ratio (M‐H, Random, 95% CI) | 0.34 [0.15, 0.79] |
| 1.3 ≥ 108 cells | 8 | 487 | Risk Ratio (M‐H, Random, 95% CI) | 0.83 [0.35, 1.94] |
| 2 Mortality (all‐cause): long term follow‐up (≥ 12 months) Show forest plot | 16 | Risk Ratio (M‐H, Random, 95% CI) | Subtotals only | |
| 2.1 < 107 cells | 4 | 297 | Risk Ratio (M‐H, Random, 95% CI) | 0.33 [0.10, 1.09] |
| 2.2 107 < 108 cells | 7 | 330 | Risk Ratio (M‐H, Random, 95% CI) | 0.30 [0.17, 0.53] |
| 2.3 ≥ 108 cells | 5 | 236 | Risk Ratio (M‐H, Random, 95% CI) | 0.62 [0.30, 1.26] |
| 3 NYHA classification: short term follow‐up (< 12 months) Show forest plot | 15 | Mean Difference (IV, Random, 95% CI) | Subtotals only | |
| 3.1 < 107 cells | 4 | 149 | Mean Difference (IV, Random, 95% CI) | ‐0.29 [‐0.94, 0.36] |
| 3.2 107 < 108 cells | 8 | 309 | Mean Difference (IV, Random, 95% CI) | ‐0.65 [‐1.22, ‐0.08] |
| 3.3 ≥ 108 cells | 4 | 241 | Mean Difference (IV, Random, 95% CI) | ‐0.41 [‐0.72, ‐0.11] |
| 4 CCS class: short term follow‐up (< 12 months) Show forest plot | 9 | Mean Difference (IV, Random, 95% CI) | Subtotals only | |
| 4.1 < 107 cells | 4 | 288 | Mean Difference (IV, Random, 95% CI) | ‐0.87 [‐1.92, 0.19] |
| 4.2 107 < 108 cells | 5 | 160 | Mean Difference (IV, Random, 95% CI) | ‐0.54 [‐1.40, 0.32] |
| 5 Exercise capacity: short term follow‐up (< 12 months) Show forest plot | 10 | Std. Mean Difference (IV, Random, 95% CI) | Subtotals only | |
| 5.1 107 < 108 cells | 7 | 357 | Std. Mean Difference (IV, Random, 95% CI) | 0.56 [‐0.03, 1.14] |
| 5.2 ≥ 108 cells | 3 | 161 | Std. Mean Difference (IV, Random, 95% CI) | 0.43 [0.10, 0.77] |
| 6 LVEF (%) measured by MRI: short term follow‐up (< 12 months) Show forest plot | 9 | Mean Difference (IV, Random, 95% CI) | Subtotals only | |
| 6.1 107 < 108 cells | 7 | 199 | Mean Difference (IV, Random, 95% CI) | 5.23 [3.91, 6.54] |
| 6.2 ≥ 108 cells | 3 | 101 | Mean Difference (IV, Random, 95% CI) | 2.37 [‐0.92, 5.66] |
| Outcome or subgroup title | No. of studies | No. of participants | Statistical method | Effect size |
| 1 Mortality (all‐cause): short term follow‐up (< 12 months) Show forest plot | 28 | Risk Ratio (M‐H, Random, 95% CI) | Subtotals only | |
| 1.1 < 30% | 11 | 508 | Risk Ratio (M‐H, Random, 95% CI) | 0.23 [0.09, 0.59] |
| 1.2 30 ‐ 50% | 13 | 642 | Risk Ratio (M‐H, Random, 95% CI) | 0.87 [0.36, 2.11] |
| 1.3 > 50% | 4 | 271 | Risk Ratio (M‐H, Random, 95% CI) | 0.61 [0.11, 3.35] |
| 2 Mortality (all‐cause): long term follow‐up (≥ 12 months) Show forest plot | 16 | Risk Ratio (M‐H, Random, 95% CI) | Subtotals only | |
| 2.1 < 30% | 9 | 426 | Risk Ratio (M‐H, Random, 95% CI) | 0.36 [0.20, 0.64] |
| 2.2 30 ‐ 50% | 7 | 289 | Risk Ratio (M‐H, Random, 95% CI) | 0.57 [0.27, 1.21] |
| 3 NYHA classification: short term follow‐up (< 12 months) Show forest plot | 15 | Mean Difference (IV, Random, 95% CI) | Subtotals only | |
| 3.1 < 30% | 6 | 273 | Mean Difference (IV, Random, 95% CI) | ‐0.40 [‐1.22, 0.43] |
| 3.2 30 ‐ 50% | 9 | 420 | Mean Difference (IV, Random, 95% CI) | ‐0.32 [‐0.54, ‐0.10] |
| 4 NYHA classification: long term follow‐up (≥ 12 months) Show forest plot | 9 | Mean Difference (IV, Random, 95% CI) | Subtotals only | |
| 4.1 < 30% | 5 | 202 | Mean Difference (IV, Random, 95% CI) | ‐0.66 [‐1.28, ‐0.04] |
| 4.2 30 ‐ 50% | 4 | 144 | Mean Difference (IV, Random, 95% CI) | ‐0.98 [‐1.72, ‐0.25] |
| 5 CCS class: short term follow‐up (< 12 months) Show forest plot | 8 | Mean Difference (IV, Random, 95% CI) | Subtotals only | |
| 5.1 < 30% | 4 | 213 | Mean Difference (IV, Random, 95% CI) | ‐0.25 [‐1.47, 0.97] |
| 5.2 30 ‐ 50% | 4 | 150 | Mean Difference (IV, Random, 95% CI) | ‐0.11 [‐0.31, 0.09] |
| 6 Exercise capacity: short term follow‐up (< 12 months) Show forest plot | 7 | Std. Mean Difference (IV, Random, 95% CI) | Subtotals only | |
| 6.1 < 30% | 4 | 225 | Std. Mean Difference (IV, Random, 95% CI) | 0.96 [0.37, 1.56] |
| 6.2 30 ‐ 50% | 3 | 127 | Std. Mean Difference (IV, Random, 95% CI) | 0.38 [‐0.57, 1.33] |
| 7 LVEF (%) measured by MRI: short term follow‐up (< 12 months) Show forest plot | 9 | Mean Difference (IV, Random, 95% CI) | Subtotals only | |
| 7.1 < 30% | 6 | 290 | Mean Difference (IV, Random, 95% CI) | 1.54 [‐1.96, 5.03] |
| 7.2 30 ‐ 50% | 3 | 60 | Mean Difference (IV, Random, 95% CI) | 3.31 [0.88, 5.75] |
| Outcome or subgroup title | No. of studies | No. of participants | Statistical method | Effect size |
| 1 Mortality (all‐cause): short term follow‐up (< 12 months) Show forest plot | 33 | Risk Ratio (M‐H, Random, 95% CI) | Subtotals only | |
| 1.1 Intramyocardial | 22 | 1049 | Risk Ratio (M‐H, Random, 95% CI) | 0.47 [0.21, 1.03] |
| 1.2 Intracoronary | 12 | 607 | Risk Ratio (M‐H, Random, 95% CI) | 0.51 [0.21, 1.23] |
| 2 Mortality (all‐cause): long term follow‐up (≥ 12 months) Show forest plot | 21 | Risk Ratio (M‐H, Random, 95% CI) | Subtotals only | |
| 2.1 Intramyocardial | 13 | 652 | Risk Ratio (M‐H, Random, 95% CI) | 0.29 [0.17, 0.50] |
| 2.2 Intracoronary | 8 | 358 | Risk Ratio (M‐H, Random, 95% CI) | 0.57 [0.30, 1.09] |
| 3 NYHA classification: short term follow‐up (< 12 months) Show forest plot | 17 | Mean Difference (IV, Random, 95% CI) | Subtotals only | |
| 3.1 Intramyocardial | 11 | 445 | Mean Difference (IV, Random, 95% CI) | ‐0.48 [‐0.99, 0.03] |
| 3.2 Intracoronary | 6 | 296 | Mean Difference (IV, Random, 95% CI) | ‐0.38 [‐0.76, 0.00] |
| 4 NYHA classification: long term follow‐up (≥ 12 months) Show forest plot | 9 | Mean Difference (IV, Random, 95% CI) | Subtotals only | |
| 4.1 Intramyocardial | 4 | 181 | Mean Difference (IV, Random, 95% CI) | ‐1.09 [‐1.76, ‐0.41] |
| 4.2 Intracoronary | 5 | 165 | Mean Difference (IV, Random, 95% CI) | ‐0.61 [‐0.92, ‐0.30] |
| 5 CCS class: short term follow‐up (< 12 months) Show forest plot | 13 | Mean Difference (IV, Random, 95% CI) | Subtotals only | |
| 5.1 Intramyocardial | 10 | 434 | Mean Difference (IV, Random, 95% CI) | ‐0.33 [‐0.87, 0.22] |
| 5.2 Intracoronary | 3 | 174 | Mean Difference (IV, Random, 95% CI) | ‐1.00 [‐2.87, 0.86] |
| 6 Exercise capacity: short term follow‐up (< 12 months) Show forest plot | 11 | Std. Mean Difference (IV, Random, 95% CI) | Subtotals only | |
| 6.1 Intramyocardial | 6 | 310 | Std. Mean Difference (IV, Random, 95% CI) | 0.78 [0.19, 1.36] |
| 6.2 Intracoronary | 5 | 253 | Std. Mean Difference (IV, Random, 95% CI) | 0.33 [‐0.06, 0.72] |
| 7 LVEF (%) measured by MRI: short term follow‐up (< 12 months) Show forest plot | 12 | Mean Difference (IV, Random, 95% CI) | Subtotals only | |
| 7.1 Intramyocardial | 8 | 309 | Mean Difference (IV, Random, 95% CI) | 2.18 [‐0.41, 4.77] |
| 7.2 Intracoronary | 5 | 137 | Mean Difference (IV, Random, 95% CI) | 3.72 [0.86, 6.57] |
| Outcome or subgroup title | No. of studies | No. of participants | Statistical method | Effect size |
| 1 Mortality (all‐cause): short term follow‐up (< 12 months) Show forest plot | 33 | Risk Ratio (M‐H, Random, 95% CI) | Subtotals only | |
| 1.1 Mononuclear cells | 20 | 966 | Risk Ratio (M‐H, Random, 95% CI) | 0.54 [0.28, 1.04] |
| 1.2 Circulating progenitor cells | 3 | 104 | Risk Ratio (M‐H, Random, 95% CI) | 0.32 [0.01, 7.48] |
| 1.3 Haematopoietic progenitor cells | 8 | 464 | Risk Ratio (M‐H, Random, 95% CI) | 0.27 [0.05, 1.46] |
| 1.4 Mesenchymal stem cells | 3 | 126 | Risk Ratio (M‐H, Random, 95% CI) | 0.5 [0.03, 7.59] |
| 2 Mortality (all‐cause): long term follow‐up (≥ 12 months) Show forest plot | 19 | Risk Ratio (M‐H, Random, 95% CI) | Subtotals only | |
| 2.1 Mononuclear cells | 12 | 540 | Risk Ratio (M‐H, Random, 95% CI) | 0.42 [0.25, 0.70] |
| 2.2 Haematopoietic progenitor cells | 4 | 302 | Risk Ratio (M‐H, Random, 95% CI) | 0.26 [0.10, 0.69] |
| 2.3 Mesenchymal stem cells | 3 | 111 | Risk Ratio (M‐H, Random, 95% CI) | 0.48 [0.15, 1.57] |
| 3 NYHA classification: short term follow‐up (< 12 months) Show forest plot | 15 | Mean Difference (IV, Random, 95% CI) | Subtotals only | |
| 3.1 Mononuclear cells | 12 | 547 | Mean Difference (IV, Random, 95% CI) | ‐0.42 [‐0.86, 0.02] |
| 3.2 Haematopoietic progenitor cells | 3 | 94 | Mean Difference (IV, Random, 95% CI) | ‐0.47 [‐1.95, 1.02] |
| 4 CCS class: short term follow‐up (< 12 months) Show forest plot | 13 | Mean Difference (IV, Random, 95% CI) | Subtotals only | |
| 4.1 Mononuclear cells | 8 | 366 | Mean Difference (IV, Random, 95% CI) | ‐0.39 [‐0.99, 0.21] |
| 4.2 Haematopoietic progenitor cells | 5 | 242 | Mean Difference (IV, Random, 95% CI) | ‐0.54 [‐1.55, 0.46] |
| Outcome or subgroup title | No. of studies | No. of participants | Statistical method | Effect size |
| 1 Mortality (all‐cause): short term follow‐up (< 12 months) Show forest plot | 33 | Risk Ratio (M‐H, Random, 95% CI) | Subtotals only | |
| 1.1 Chronic IHD | 11 | 550 | Risk Ratio (M‐H, Random, 95% CI) | 0.65 [0.26, 1.62] |
| 1.2 HF (secondary to IHD) | 15 | 645 | Risk Ratio (M‐H, Random, 95% CI) | 0.33 [0.14, 0.82] |
| 1.3 Refractory/intractable angina | 7 | 442 | Risk Ratio (M‐H, Random, 95% CI) | 0.61 [0.11, 3.35] |
| 2 Mortality (all‐cause): long term follow‐up (≥ 12 months) Show forest plot | 21 | Risk Ratio (M‐H, Random, 95% CI) | Subtotals only | |
| 2.1 Chronic IHD | 9 | 389 | Risk Ratio (M‐H, Random, 95% CI) | 0.52 [0.27, 0.99] |
| 2.2 HF (secondary to IHD) | 9 | 401 | Risk Ratio (M‐H, Random, 95% CI) | 0.33 [0.19, 0.58] |
| 2.3 Refractory/intractable angina | 3 | 220 | Risk Ratio (M‐H, Random, 95% CI) | 0.11 [0.01, 0.91] |
| 3 NYHA classification: short term follow‐up (< 12 months) Show forest plot | 16 | Mean Difference (IV, Random, 95% CI) | Subtotals only | |
| 3.1 Chronic IHD | 6 | 296 | Mean Difference (IV, Random, 95% CI) | ‐0.43 [‐0.78, ‐0.07] |
| 3.2 HF (secondary to IHD) | 10 | 417 | Mean Difference (IV, Random, 95% CI) | ‐0.47 [‐1.02, 0.09] |
| 4 NYHA classification: long term follow‐up (≥ 12 months) Show forest plot | 9 | Mean Difference (IV, Random, 95% CI) | Subtotals only | |
| 4.1 Chronic IHD | 3 | 105 | Mean Difference (IV, Random, 95% CI) | ‐0.66 [‐0.91, ‐0.42] |
| 4.2 HF (secondary to IHD) | 6 | 241 | Mean Difference (IV, Random, 95% CI) | ‐0.92 [‐1.47, ‐0.37] |
| 5 CCS class: short term follow‐up (< 12 months) Show forest plot | 13 | Mean Difference (IV, Random, 95% CI) | Subtotals only | |
| 5.1 HF (secondary to IHD) | 8 | 363 | Mean Difference (IV, Random, 95% CI) | ‐0.25 [‐0.90, 0.40] |
| 5.2 Refractory/intractable angina | 5 | 245 | Mean Difference (IV, Random, 95% CI) | ‐0.78 [‐1.44, ‐0.11] |
| 6 Exercise capacity: short term follow‐up (< 12 months) Show forest plot | 11 | Std. Mean Difference (IV, Random, 95% CI) | Subtotals only | |
| 6.1 Chronic IHD | 4 | 114 | Std. Mean Difference (IV, Random, 95% CI) | 0.48 [‐0.26, 1.22] |
| 6.2 HF (secondary to IHD) | 4 | 260 | Std. Mean Difference (IV, Random, 95% CI) | 0.79 [0.04, 1.53] |
| 6.3 Refractory/intractable angina | 3 | 189 | Std. Mean Difference (IV, Random, 95% CI) | 0.26 [‐0.03, 0.55] |
| 7 LVEF (%) measured by MRI: short term follow‐up (< 12 months) Show forest plot | 10 | Mean Difference (IV, Random, 95% CI) | Subtotals only | |
| 7.1 Chronic IHD | 6 | 178 | Mean Difference (IV, Random, 95% CI) | 2.58 [‐0.16, 5.31] |
| 7.2 HF (secondary to IHD) | 4 | 195 | Mean Difference (IV, Random, 95% CI) | 2.50 [‐1.97, 6.97] |
| Outcome or subgroup title | No. of studies | No. of participants | Statistical method | Effect size |
| 1 Mortality (all‐cause): short term follow‐up (< 12 months) Show forest plot | 33 | Risk Ratio (M‐H, Random, 95% CI) | Subtotals only | |
| 1.1 Co‐interventions | 8 | 432 | Risk Ratio (M‐H, Random, 95% CI) | 0.74 [0.32, 1.70] |
| 1.2 No co‐interventions | 25 | 1205 | Risk Ratio (M‐H, Random, 95% CI) | 0.31 [0.13, 0.72] |
| 2 Mortality (all‐cause): long term follow‐up (≥ 12 months) Show forest plot | 21 | Risk Ratio (M‐H, Random, 95% CI) | Subtotals only | |
| 2.1 Co‐interventions | 6 | 312 | Risk Ratio (M‐H, Random, 95% CI) | 0.47 [0.26, 0.88] |
| 2.2 No co‐interventions | 15 | 698 | Risk Ratio (M‐H, Random, 95% CI) | 0.32 [0.19, 0.56] |
| 3 NYHA classification: short term follow‐up (< 12 months) Show forest plot | 17 | Mean Difference (IV, Random, 95% CI) | Subtotals only | |
| 3.1 Co‐interventions | 6 | 233 | Mean Difference (IV, Random, 95% CI) | ‐0.57 [‐1.20, 0.05] |
| 3.2 No co‐interventions | 11 | 508 | Mean Difference (IV, Random, 95% CI) | ‐0.37 [‐0.87, 0.13] |
| 4 LVEF (%) measured by MRI: short term follow‐up (< 12 months) Show forest plot | 12 | Mean Difference (IV, Random, 95% CI) | Subtotals only | |
| 4.1 Co‐interventions | 5 | 179 | Mean Difference (IV, Random, 95% CI) | 2.01 [‐0.26, 4.29] |
| 4.2 No co‐interventions | 7 | 260 | Mean Difference (IV, Random, 95% CI) | 3.55 [0.82, 6.27] |
| Outcome or subgroup title | No. of studies | No. of participants | Statistical method | Effect size |
| 1 Mortality (all‐cause) Show forest plot | 15 | Risk Ratio (M‐H, Random, 95% CI) | Subtotals only | |
| 1.1 Short term follow‐up (< 12 months) | 14 | 744 | Risk Ratio (M‐H, Random, 95% CI) | 0.69 [0.32, 1.50] |
| 1.2 Long term follow‐up (≥ 12 months) | 9 | 491 | Risk Ratio (M‐H, Random, 95% CI) | 0.42 [0.21, 0.87] |
| 2 Non‐fatal myocardial infarction Show forest plot | 11 | Risk Ratio (M‐H, Random, 95% CI) | Subtotals only | |
| 2.1 Short term follow‐up (< 12 months) | 6 | 288 | Risk Ratio (M‐H, Random, 95% CI) | 0.50 [0.05, 4.58] |
| 2.2 Long term follow‐up (≥ 12 months) | 5 | 345 | Risk Ratio (M‐H, Random, 95% CI) | 0.38 [0.15, 0.97] |
| 3 Rehospitalisation due to heart failure Show forest plot | 8 | Risk Ratio (M‐H, Random, 95% CI) | Subtotals only | |
| 3.1 Short term follow‐up (< 12 months) | 3 | 234 | Risk Ratio (M‐H, Random, 95% CI) | 0.65 [0.32, 1.32] |
| 3.2 Long term follow‐up (≥ 12 months) | 6 | 375 | Risk Ratio (M‐H, Random, 95% CI) | 0.63 [0.36, 1.09] |
| 4 Arrhythmias Show forest plot | 7 | Risk Ratio (M‐H, Random, 95% CI) | Subtotals only | |
| 4.1 Short term follow‐up (< 12 months) | 6 | 224 | Risk Ratio (M‐H, Random, 95% CI) | 0.77 [0.18, 3.21] |
| 4.2 Long term follow‐up (≥ 12 months) | 1 | 82 | Risk Ratio (M‐H, Random, 95% CI) | 0.42 [0.18, 0.99] |
| 5 Composite MACE Show forest plot | 3 | Risk Ratio (M‐H, Random, 95% CI) | Subtotals only | |
| 5.1 Short term follow‐up (< 12 months) | 2 | 59 | Risk Ratio (M‐H, Random, 95% CI) | 0.0 [0.0, 0.0] |
| 5.2 Long term follow‐up (≥ 12 months) | 3 | 141 | Risk Ratio (M‐H, Random, 95% CI) | 0.64 [0.38, 1.08] |
| 6 NYHA classification: short term follow‐up (< 12 months) Show forest plot | 5 | Mean Difference (IV, Random, 95% CI) | Subtotals only | |
| 6.1 Combined | 5 | 277 | Mean Difference (IV, Random, 95% CI) | ‐0.26 [‐0.59, 0.07] |
| 7 NYHA classification: long term follow‐up (≥ 12 months) Show forest plot | 1 | Mean Difference (IV, Random, 95% CI) | Subtotals only | |
| 7.1 Combined | 1 | 39 | Mean Difference (IV, Random, 95% CI) | ‐2.2 [‐2.70, ‐1.70] |
| 8 LVEF (%) measured by MRI: short term follow‐up (< 12 months) Show forest plot | 7 | Mean Difference (IV, Random, 95% CI) | Subtotals only | |
| 8.1 Combined | 7 | 249 | Mean Difference (IV, Random, 95% CI) | 2.92 [0.67, 5.17] |
| 9 LVEF (%) measured by MRI: long term follow‐up (≥ 12 months) Show forest plot | 1 | Mean Difference (IV, Random, 95% CI) | Subtotals only | |
| 9.1 Combined | 1 | 25 | Mean Difference (IV, Random, 95% CI) | ‐1.60 [‐8.70, 5.50] |
| Outcome or subgroup title | No. of studies | No. of participants | Statistical method | Effect size |
| 1 Mortality (all‐cause) Show forest plot | 26 | Risk Ratio (M‐H, Random, 95% CI) | Subtotals only | |
| 1.1 Short term follow‐up (< 12 months) | 25 | 1216 | Risk Ratio (M‐H, Random, 95% CI) | 0.58 [0.29, 1.16] |
| 1.2 Long term follow‐up (≥ 12 months) | 13 | 624 | Risk Ratio (M‐H, Random, 95% CI) | 0.43 [0.21, 0.86] |
| Outcome or subgroup title | No. of studies | No. of participants | Statistical method | Effect size |
| 1 Mortality (all‐cause) Show forest plot | 32 | Risk Ratio (M‐H, Random, 95% CI) | Subtotals only | |
| 1.1 Short term follow‐up (< 12 months) | 28 | 1449 | Risk Ratio (M‐H, Random, 95% CI) | 0.48 [0.26, 0.89] |
| 1.2 Long term follow‐up (≥ 12 months) | 17 | 883 | Risk Ratio (M‐H, Random, 95% CI) | 0.39 [0.25, 0.60] |