Tratamiento con células madre para la cardiopatía isquémica crónica y la insuficiencia cardíaca congestiva
Appendices
Appendix 1. Search strategies (March 2013)
THE COCHRANE LIBRARY
#1 STEM CELL TRANSPLANTATION explode all trees (MeSH)
#2 HEMATOPOIETIC STEM CELL MOBILIZATION single term (MeSH)
#3 STEM CELLS explode all trees (MeSH)
#4 CELL TRANSPLANTATION single term (MeSH)
#5 haematopoietic or hematopoietic or haematopoetic or hematopoetic or hemopoietic or haemopoietic or marrow NEAR cell* or stem cell* or progenitor cell* or precursor cell* or cell* therapy
#6 ((myoblast* or cell*) NEAR (transplant* or graft* or implant*))
#7 #1 or #2 or #3 or #4 or #5 or #6
#8 MYOCARDIAL ISCHEMIA explode all trees (MeSH)
#9 HEART FAILURE explode all trees (MeSH)
#10 HEART DISEASES single term (MeSH)
#11 (myocardial or myocardium or subendocardial or transmural or cardiac or cardial or coronary or heart) NEAR (infarct* or postinfarct* or hypoxi* or anoxi* or failure* or decompensation or insufficien*)
#12 heart disease* or coronary disease* or IHD or CIHD
#13 chronic myocardial dysfunction or angina or stenocardia
#14 (ischemi* or ischaemi*) NEAR (myocardium or myocardial or heart or coronary or cardiac or cardial or subendocardial or cardiomyopath*)
#15 (artery occlusion* or artery disease* or arterioscleros* or atheroscleros*) NEAR coronary
#16 (heart or cardiac or cardial or myocardium or myocardial) NEAR (repair* or reparation or improve* or regenerat*)
#17 #8 or #9 or #10 or #11 or #12 or #13 or #14 or #15 or #16
#18 #7 AND #17
#19 (cellular NEXT cardiomyoplast*) or (cardiomyocyte* NEAR transplant*) or (intramyocardial* NEAR (transplant* or stem or bone marrow)) or (transendocardial* NEAR stem NEXT cell*) or (intracoronary NEAR progenitor NEXT cell*) or (transcoronary NEAR transplant*)
#20 #18 or #19
MEDLINE (Ovid)
1. CELL TRANSPLANTATION/
2. exp STEM CELL TRANSPLANTATION/
3. BONE MARROW TRANSPLANTATION//
4. exp STEM CELLS/
5. (haematopoietic or hematopoietic or haematopoetic or hematopoetic or hemopoietic or haemopoietic or (marrow adj2 cell*) or stem cell* or progenitor cell* or precursor cell* or cell* therapy or bone marrow).ti,ab.
6. ((mesenchymal or stromal) AND marrow).ti,ab.
7. (cell*) adj3 (transplant* or graft* or implant*)).ti,ab
8. cell transplantation.jn. or cell stem cell.jn. or stem cell reviews.jn. or bone marrow transplantation.jn.
9. or/1‐8
10. exp MYOCARDIAL ISCHEMIA/
11. exp HEART FAILURE/
12. HEART DISEASES/
13. ((myocardial or myocardium or subendocardial or transmural or cardiac or cardial or coronary or heart) adj2 (infarct* or postinfarct* or hypoxi* or anoxi* or failure* or decompensation or insufficien*)).ti,ab.
14. (heart disease* or coronary disease* or IHD or CIHD).ti,ab.
15. (myocardial dysfunction or angina or stenocardia).ti,ab.
16. ((ischemi* or ischaemi*) adj2 (myocardium or myocardial or heart or coronary or cardiac or cardial or subendocardial or cardiomyopath*)).ti,ab.
17. ((end stage or endstage) adj cardiomyopath*).ti,ab.
18. ((artery occlusion* or artery disease* or arterioscleros* or atheroscleros*) adj2 coronary).ti,ab.
19. ((heart or cardiac or cardial or myocardium or myocardial) adj3 (repair* or reparation or improve* or regenerat*)).ti,ab.
20. or/10‐19
21. 9 and 20
22. ((cellular adj cardiomyoplast*) or (cardiomyocyte* adj5 transplant*) or (intramyocardial* adj6 (transplant* or stem or bone marrow)) or (transendocardial* adj5 stem adj cell*) or (intracoronary adj5 progenitor adj cell*) or (transcoronary adj3 transplant*)).mp.
23. 21 or 22
EMBASE (Ovid)
1. exp CELL THERAPY/
2. exp STEM CELL/
3. BONE MARROW CELL/
4. ((mesenchymal or stromal) AND marrow).ti,ab.
5. (haematopoietic or hematopoietic or haematopoetic or hematopoetic or hemopoietic or haemopoietic or marrow adj2 cell* or stem cell* or progenitor cell* or precursor cell* or cell* therapy or bone marrow).ti,ab.
6. (cell* adj3 (transplant* or graft* or implant*)).ti,ab.
7. cell transplantation.jn. or cell stem cell.jn. or stem cell reviews.jn.
8. or/1‐7
9. exp ISCHEMIC HEART DISEASE/
10. exp HEART FAILURE/
11. exp MYOCARDIAL DISEASE/
12. ((myocardial or myocardium or subendocardial or transmural or cardiac or cardial or coronary or heart) adj2 (infarct* or postinfarct* or hypoxi* or anoxi* or failure* or decompensation or insufficien*).ti,ab.
13. (heart disease* or coronary disease* or IHD or CIHD).ti,ab.
14. (chronic myocardial dysfunction or angina or stenocardia).ti,ab.
15. ((ischemi* or ischaemi*) adj2 (myocardium or myocardial or heart or coronary or cardiac or cardial or subendocardial or cardiomyopath*)).ti,ab.
16. ((artery occlusion* or artery disease* or arterioscleros* or atheroscleros*) adj2 coronary).ti,ab.
17. ((end stage or endstage) adj cardiomyopath*).ti,ab.
18. ((heart or cardiac or cardial or myocardium or myocardial) adj3 (repair* or reparation or improve* or regenerat*)).ti,ab.
19. or/9‐18
20. 8 AND 19
21. ((cellular adj cardiomyoplast*) or (cardiomyocyte* adj5 transplant*) or (intramyocardial adj6 (transplant* or stem or bone marrow)) or (transendocardial adj5 stem adj cell*) or (intracoronary adj5 progenitor adj cell*) or (transcoronary adj3 transplant*)).mp.
22. 20 or 21
CINAHL (EBSCOhost)
S1 (MH "Cell Transplantation+")
S2 (MH "Stem Cells+")
S3 TI ( (haematopoietic OR hematopoietic OR haematopoetic OR hematopoetic OR hemopoietic OR haemopoietic OR (marrow N2 cell*) OR "stem cell*" OR "progenitor cell*" OR "precursor cell*" OR "cell* therapy" OR "bone marrow") ) OR AB ( (haematopoietic OR hematopoietic OR haematopoetic OR hematopoetic OR hemopoietic OR haemopoietic OR (marrow N2 cell*) OR "stem cell*" OR "progenitor cell*" OR "precursor cell*" OR "cell* therapy" OR "bone marrow") )
S4 TX ((mesenchymal or stromal) AND marrow)
S5 TI ( ((cell* N3 transplant*) OR (cell* N3 graft*) OR (cell* N3 implant*)) ) OR AB ( ((cell* N3 transplant*) OR (cell* N3 graft*) OR (cell* N3 implant*)) )
S6 S1 OR S2 OR S3 OR S4 OR S5
S7 (MH "Heart Diseases") OR (MH "Heart Failure+") OR (MH "Heart Valve Diseases+") OR (MH "Myocardial Diseases+") OR (MH "Myocardial Ischemia+")
S8 TI ( (myocardial or myocardium or subendocardial or transmural or cardiac or cardial or coronary or heart) N6 (infarct* or postinfarct* or hypoxi* or anoxi* or failure* or decompensation or insufficien*) ) OR AB ( (myocardial or myocardium or subendocardial or transmural or cardiac or cardial or coronary or heart) N6 (infarct* or postinfarct* or hypoxi* or anoxi* or failure* or decompensation or insufficien*) )
S9 TI ( ("heart disease*" or "coronary disease*" or IHD or CIHD) ) AND AB ( ("heart disease*" or "coronary disease*" or IHD or CIHD) )
S10 TI ( ("chronic myocardial dysfunction" OR angina OR stenocardia) ) OR AB ( ("chronic myocardial dysfunction" OR angina OR stenocardia) )
S11 TI ( ((ischemi* or ischaemi*) N5 (myocardium or myocardial or heart or coronary or cardiac or cardial or subendocardial or cardiomyopath*)) ) OR AB ( ((ischemi* or ischaemi*) N5 (myocardium or myocardial or heart or coronary or cardiac or cardial or subendocardial or cardiomyopath*)) )
S12 TI ( ((chronic or artery occlusion* or artery disease* or arterioscleros* or atheroscleros*) AND coronary) ) OR AB ( ((chronic or artery occlusion* or artery disease* or arterioscleros* or atheroscleros*) AND coronary) )
S13 TI ( ((heart or cardiac or cardial or myocardium or myocardial) AND (repair* or reparation or improve* or regenerat*)) ) OR AB ( ((heart or cardiac or cardial or myocardium or myocardial) AND (repair* or reparation or improve* or regenerat*)) )
S14 S7 OR S8 OR S9 OR S10 OR S11 OR S12 OR S13
S15 S6 AND S14
S16 TX (transplant* N5 (cardiomyocyte* or transcoronary)) or (cellular N2 cardiomyoplast*) or (intramyocardial* N6 (transplant* or stem or marrow)) or (transendocardial* N5 stem cell*) or (intracoronary N5 progenitor cell*)
S17 S15 OR S16
TRANSFUSION EVIDENCE LIBRARY (www.transfusionevidencelibrary.com)
("marrow cell*" OR "stem cell*" OR "progenitor cell*" OR "precursor cell*") AND (infarct* OR coronar* OR myocard* OR heart OR cardiac* OR cardiomyo* OR intramyocardial* OR ischemi* OR ischaemi* OR angina)
PubMed (epublications only)
(stem[TI] OR marrow[TI] OR progenitor[TI] OR precursor[TI] OR cell[TI] OR cells[TI]) AND (infarct*[TI] OR coronar*[TI] OR heart*[TI] OR myocard*[TI] OR cardial[TI] OR cardiac[TI] OR transmural*[TI] OR ischemia[TI] OR ischemic[TI] OR subendocardial[TI] OR cardiomyopath*[TI] OR angina[TI]) AND (random* OR blind* OR control group* OR controlled OR placebo OR trial) AND (publisher[sb] NOT pubstatusnihms)
LILACS
("marrow cell$" OR "stem cell$" OR "progenitor cell$" OR "precursor cell$") AND (infarct$ OR coronar$ OR myocard$ OR heart OR cardiac$ OR cardiomyo$ OR intramyocardial$ OR ischemi$ OR ischaemi$ OR angina) AND (random$ OR blind$ OR control$ OR placebo$ OR trial)
KoreaMed & PakMediNet
(stem or marrow or progenitor or precursor or cell or cells) AND random*
IndMed
((marrow OR stem OR progenitor OR precursor) AND (infarct$ OR coronar$ OR myocard$ OR heart OR cardiac$ OR cardiomyo$ OR intramyocardial$ OR ischemi$ OR ischaemi$) AND (random$ OR blind$ OR control$ OR placebo$ OR trial))
ISRCTN Register (Current Controlled Trials)
("stem cells" or "stem cell" or marrow or "progenitor cells" or "precursor cells") and (infarction or infarct or coronary or myocardial or heart or myocardium or cardial or transmural or ischemia or ischemic or subendocardial or cardiomyopathy OR angina)
ClinicalTrials.gov
Study Type: Intervention Studies
Conditions: heart failure
Search Terms: marrow OR stem OR progenitor OR precursor OR myoblast OR myocell OR mesenchymal OR stromal
WHO ICTRP
Title: marrow OR stem OR progenitor OR precursor OR myoblast OR myocell OR mesenchymal OR stromal
Condition: heart OR cardiac OR myocardial
Recruitment Status: ALL
Appendix 2. Search strategies (June 2014; March/December 2015)
CENTRAL, the Cochrane Library
#1 MeSH descriptor: [Stem Cell Transplantation] explode all trees
#2 MeSH descriptor: [Bone Marrow Cells] explode all trees
#3 MeSH descriptor: [Stem Cells] explode all trees
#4 MeSH descriptor: [Cell Transplantation] this term only
#5 MeSH descriptor: [Bone Marrow Transplantation] this term only
#6 MeSH descriptor: [Stromal Cells] explode all trees
#7 ((stem or haematopoietic or hematopoietic or haematopoetic or hematopoetic or hemopoietic or haemopoietic or progenitor or precursor or bone marrow or mononuclear or "adipose tissue" or mesenchymal or stromal or autologous or allogeneic or allogenic or ALDH* or C‐KIT*) next/2 cell*)
#8 "cell transplantation":so or "stem cell":so or "bone marrow transplantation":so
#9 (autologous next/3 transplant*) or "cell* therap*"
#10 ((cell* or myoblast*) near/3 (autologous or transplant* or autotransplant* or allotransplant* or graft* or implant*))
#11 #1 or #2 or #3 or #4 or #5 or #6 or #7 or #8 or #9 or #10
#12 MeSH descriptor: [Heart Diseases] explode all trees
#13 ((ischemi* or ischaemi* or nonischemi* or nonischaemi*) near/2 (myocardium or myocardial or cardiomyopath* or heart or coronary or cardiac or cardial or subendocardial))
#14 ((myocardial or myocardium or subendocardial or transmural or cardiac or cardial or coronary or heart) near/2 (failure* or decompensation or insufficien*))
#15 (IHD or CIHD or DCM or IDCM)
#16 ((myocardial near/3 dysfunction*) or stenocardia or angina*)
#17 ((end stage or endstage or dilated or idiopathic or congestive) near/2 cardiomyopath*)
#18 (arter* occlusion* or arter* disease* or arterioscleros* or atheroscleros*) near/2 coronary
#19 ((heart or cardiac or cardial or myocardium or myocardial) near/3 (repair* or reparation or improv* or regenerat*))
#20 (heart disease* or coronary disease* or cardiovascular disease*)
#21 ((end stage or endstage or dilated or idiopathic or congestive) near/2 cardiomyopath*)
#22 ((myocardial or myocardium or subendocardial or transmural or cardiac or cardial or coronary or heart or acute) near/3 (infarct* or postinfarct* or hypoxi* or anoxi*))
#23 heart attack* or coronary attack* or acute coronary syndrome* or AMI
#24 #12 or #13 or #14 or #15 or #16 or #17 or #18 or #19 or #20 or #21 or #22 or #23
#25 #11 and #24
#26 cellular cardiomyoplast* or ((cardiomyocyte* or cardiac cell*) near/6 transplant*) or ((intramyocardial* or intracoronary or transendocardial* or transcoronary) near/6 (transplant* or stem or bone marrow or marrow cell* or BMC* or stromal or mesenchymal or progenitor cell* or precursor cell*))
#27 #25 or #26 [Publication Year from 2014 to 2015]
MEDLINE (OvidSP)
1. exp STEM CELL TRANSPLANTATION/
2. BONE MARROW TRANSPLANTATION/
3. CELL TRANSPLANTATION/
4. exp STEM CELLS/
5. BONE MARROW CELLS/
6. exp STROMAL CELLS/
7. ((stem or haematopoietic or hematopoietic or haematopoetic or hematopoetic or hemopoietic or haemopoietic or progenitor or precursor or bone marrow or mononuclear or adipose tissue or mesenchymal or stromal or autologous or allogeneic or allogenic or ALDH* or C‐KIT*) adj2 cell*).ti,ab.
8. (cell transplantation or stem cell* or bone marrow transplantation).jn.
9. ((autologous adj3 transplant*) or cell* therap*).tw.
10. ((cell* or myoblast*) adj3 (autologous or transplant* or autotransplant* or allotransplant* or graft* or implant*)).ti,ab.
11. or/1‐10
12. exp HEART DISEASES/
13. ((ischemi* or ischaemi* or nonischemi* or nonischaemi*) adj2 (myocardium or myocardial or cardiomyopath* or heart or coronary or cardiac or cardial or subendocardial)).ti,ab.
14. ((myocardial or myocardium or subendocardial or transmural or cardiac or cardial or coronary or heart) adj2 (failure* or decompensation or insufficien*)).ti,ab.
15. (IHD or CIHD or DCM or IDCM).ti,ab.
16. ((myocardial adj3 dysfunction*) or stenocardia or angina*).ti,ab.
17. ((arter* occlusion* or arter* disease* or arterioscleros* or atheroscleros*) adj2 coronary).ti,ab.
18. (heart disease* or coronary disease* or cardiovascular disease*).ti,ab.
19. ((end stage or endstage or dilated or idiopathic or congestive) adj2 cardiomyopath*).ti,ab.
20. ((heart or cardiac or cardial or myocardium or myocardial) adj3 (repair* or reparation or improv* or regenerat*)).ti,ab.
21. ((myocardial or myocardium or subendocardial or transmural or cardiac or cardial or coronary or heart or acute) adj3 (infarct* or postinfarct* or hypoxi* or anoxi*)).ti,ab.
22. (heart attack* or coronary attack* or acute coronary syndrome* or AMI).ti,ab.
23. or/12‐22
24. 11 and 23
25. (cellular cardiomyoplast* or ((cardiomyocyte* or cardiac cell*) adj6 transplant*) or ((intramyocardial* or intracoronary or transendocardial* or transcoronary) adj6 (transplant* or stem or bone marrow or marrow cell* or BMC* or stromal or mesenchymal or progenitor cell* or precursor cell*))).mp.
26. 24 or 25
Embase (OvidSP)
1. exp STEM CELL TRANSPLANTATION/
2. exp BONE MARROW TRANSPLANTATION/
3. exp STEM CELL/
4. BONE MARROW CELL/
5. exp STROMA CELLS/
6. ((stem or haematopoietic or hematopoietic or haematopoetic or hematopoetic or hemopoietic or haemopoietic or progenitor or precursor or bone marrow or mononuclear or adipose tissue or mesenchymal or stromal or autologous or allogeneic or allogenic or ALDH* or C‐KIT*) adj2 cell*).ti,ab.
7. (cell transplantation or stem cell* or bone marrow transplantation).jn.
8. ((autologous adj3 transplant*) or cell* therap*).tw.
9. ((cell* or myoblast*) adj3 (autologous or transplant* or autotransplant* or allotransplant* or graft* or implant*)).ti,ab.
10. or/1‐9
11. exp ISCHEMIC HEART DISEASE/
12. exp HEART FAILURE/
13. exp MYOCARDIAL DISEASE/
14. ((ischemi* or ischaemi* or nonischemi* or nonischaemi*) adj2 (myocardium or myocardial or cardiomyopath* or heart or coronary or cardiac or cardial or subendocardial)).ti,ab.
15. ((myocardial or myocardium or subendocardial or transmural or cardiac or cardial or coronary or heart) adj2 (failure* or decompensation or insufficien*)).ti,ab.
16. (IHD or CIHD or DCM or IDCM).ti,ab.
17. ((myocardial adj3 dysfunction*) or stenocardia or angina*).ti,ab.
18. ((arter* occlusion* or arter* disease* or arterioscleros* or atheroscleros*) adj2 coronary).ti,ab.
19. (heart disease* or coronary disease* or cardiovascular disease*).ti,ab.
20. ((end stage or endstage or dilated or idiopathic or congestive) adj2 cardiomyopath*).ti,ab.
21. ((heart or cardiac or cardial or myocardium or myocardial) adj3 (repair* or reparation or improv* or regenerat*)).ti,ab.
22. ((myocardial or myocardium or subendocardial or transmural or cardiac or cardial or coronary or heart or acute) adj3 (infarct* or postinfarct* or hypoxi* or anoxi*)).ti,ab.
23. (heart attack* or coronary attack* or acute coronary syndrome* or AMI).ti,ab.
24. 11 or 12 or 13 or 14 or 15 or 16 or 17 or 18 or 19 or 20 or 21 or 22 or 23
25. 10 and 24
26. (cellular cardiomyoplast* or ((cardiomyocyte* or cardiac cell*) adj6 transplant*) or ((intramyocardial* or intracoronary or transendocardial* or transcoronary) adj6 (transplant* or stem or bone marrow or marrow cell* or BMC* or stromal or mesenchymal or progenitor cell* or precursor cell*))).mp.
27. 25 or 26
PubMed (epublications)
#1 (stem[TI] OR haematopoietic[TI] OR hematopoietic[TI] OR haematopoetic[TI] OR hematopoetic[TI] OR hemopoietic[TI] OR haemopoietic[TI] OR progenitor[TI] OR precursor[TI] OR bone marrow[TI] OR mononuclear[TI] OR "adipose tissue"[TI] OR mesenchymal[TI] OR stromal[TI] OR autologous[TI] OR allogeneic[TI] OR allogenic[TI] OR ALDH*[TI] OR C‐KIT*[TI]) AND cell*[TI]
#2 cell transplantation[TA] OR stem cell*[TA] OR bone marrow transplant*[TA]
#3 "autologous transplant*"[TI] OR "cell therapy"[TI] OR "cell therapies"[TI] OR "cellular therapy"[TI]
#4 (cell[TI] OR cells[TI] OR cellular[TI] OR myoblast*[TI]) AND (transplant[TI] OR transplantation[TI] OR transplants[TI] OR transplanting[TI] OR transplanted[TI] OR autotransplant*[TI] or allotransplant*[TI] or graft*[TI] or implant[TI] OR implants[TI] OR implantation[TI] OR implanted[TI])
#5 #1 OR #2 OR #3 OR #4
#6 (ischemi*[TI] OR ischaemi*[TI] OR nonischemi*[TI] OR nonischaemi*) AND (myocardium[TI] OR myocardial[TI] OR cardiomyopath*[TI] OR heart[TI] OR coronary[TI] OR cardiac[TI] OR cardial[TI] OR subendocardial[TI])
#7 (myocardial[TI] OR myocardium[TI] OR subendocardial[TI] OR transmural[TI] OR cardiac[TI] OR cardial[TI] OR coronary[TI] OR heart) AND (failure*[TI] OR decompensation[TI] OR insufficien*[TI])
#8 "myocardial dysfunction*"[TI] OR stenocardia[TI] OR angina*[TI] OR IHD[TI] OR CIHD[TI] OR DCM[TI] OR IDCM[TI] OR "heart disease"[TI] OR "coronary disease"[TI] OR "coronary artery disease"[TI] OR "cardiovascular disease"[TI]
#9 ("arterial occlusion*"[TI] OR "arterial disease*"[TI] OR arterioscleros*[TI] OR atheroscleros*[TI]) AND coronary[TI]
#10 ("end stage"[TI] OR endstage[TI] OR dilated[TI] OR idiopathic[TI] OR congestive[TI]) AND cardiomyopath*[TI]
#11 (heart[TI] OR cardiac[TI] OR cardial[TI] OR myocardium[TI] OR myocardial[TI]) AND (repair*[TI] OR reparation[TI] OR improv*[TI] OR regenerat*[TI])
#12 (myocardial[TI] OR myocardium [TI] OR subendocardial [TI] OR transmural [TI] OR cardiac [TI] OR cardial [TI] OR coronary [TI] OR heart [TI] OR acute[TI]) AND (infarct* [TI] OR postinfarct* [TI] OR hypoxi* [TI] OR anoxi*)
#13 heart attack* [TI] OR coronary attack* [TI] OR acute coronary syndrome* [TI] OR AMI[TI]
#14 #6 OR #7 OR #8 OR #9 OR #10 OR #11 OR #12 OR #13
#15 #5 AND #14
#16 (cellular cardiomyoplast* OR ((cardiomyocyte* OR cardiac cell*) AND transplant*) OR ((intramyocardial* OR intracoronary OR transendocardial* OR transcoronary) AND (transplant* OR stem OR bone marrow OR marrow cell* OR BMC* OR stromal OR mesenchymal OR progenitor cell* OR precursor cell*)))
#17 #15 OR #16
#18 (random* OR blind* OR control group* OR placebo OR controlled trial OR controlled study OR trials OR systematic review OR meta‐analysis OR metaanalysis OR literature search OR medline OR cochrane OR embase) AND ((publisher[sb] OR inprocess[sb]) NOT pubstatusnihms)
#19 #17 AND #18
CINAHL (EBSCOhost)
S1 (MH "Cell Transplantation+")
S2 (MH "Stem Cells+")
S3 TI ( (stem or haematopoietic or hematopoietic or haematopoetic or hematopoetic or hemopoietic or haemopoietic or progenitor or precursor or bone marrow or mononuclear or adipose tissue or mesenchymal or stromal or autologous or allogeneic or allogenic or ALDH* or C‐KIT*) N2 cell* ) OR AB ( (stem or haematopoietic or hematopoietic or haematopoetic or hematopoetic or hemopoietic or haemopoietic or progenitor or precursor or bone marrow or mononuclear or adipose tissue or mesenchymal or stromal or autologous or allogeneic or allogenic or ALDH* or C‐KIT*) N2 cell)
S4 TX ( (autologous N3 transplant*) or cell* therap* )
S5 TI ( (cell* or myoblast*) N3 (autologous or transplant* or autotransplant* or allotransplant* or graft* or implant*) ) OR AB ( (cell* or myoblast*) N3 (autologous or transplant* or autotransplant* or allotransplant* or graft* or implant*) )
S6 S1 OR S2 OR S3 OR S4 OR S5
S7 (MH "Heart Diseases+")
S8 TI ( (myocardial or myocardium or subendocardial or transmural or cardiac or cardial or coronary or heart or acute) N3 (infarct* or postinfarct* or hypoxi* or anoxi*) ) OR AB ( (myocardial or myocardium or subendocardial or transmural or cardiac or cardial or coronary or heart or acute) N3 (infarct* or postinfarct* or hypoxi* or anoxi*) )
S9 TI ( ("heart disease*" or "coronary disease*" or IHD or CIHD or DCM or IDCM) ) AND AB ( ("heart disease*" or "coronary disease*" or IHD or CIHD or DCM or IDCM) )
S10 TI ( ((myocardial N3 dysfunction) OR angina OR stenocardia) ) OR AB ( ((myocardial N3 dysfunction) OR angina OR stenocardia) )
S11 TI ( ((ischemi* or ischaemi* or nonischemi* or nonischaemi*) N5 (myocardium or myocardial or heart or coronary or cardiac or cardial or subendocardial or cardiomyopath*)) ) OR AB ( ((ischemi* or ischaemi* or nonischemi* or nonischaemi*) N5 (myocardium or myocardial or heart or coronary or cardiac or cardial or subendocardial or cardiomyopath*)) )
S12 TI ( ((arter* occlusion* or arter* disease* or arterioscleros* or atheroscleros*) N2 coronary) ) OR AB ( ((arter* occlusion* or arter* disease* or arterioscleros* or atheroscleros*) N2 coronary) )
S13 TI ( ((myocardial or myocardium or subendocardial or transmural or cardiac or cardial or coronary or heart) N2 (failure* or decompensation or insufficien*)) ) OR AB ( ((myocardial or myocardium or subendocardial or transmural or cardiac or cardial or coronary or heart) N2 (failure* or decompensation or insufficien*)) )
S14 TI ( (end stage or endstage or dilated or idiopathic or congestive) N2 cardiomyopath* ) OR AB ( (end stage or endstage or dilated or idiopathic or congestive) N2 cardiomyopath* )
S15 TI ( (heart or cardiac or cardial or myocardium or myocardial) N3 (repair* or reparation or improv* or regenerat*) ) OR AB ( (heart or cardiac or cardial or myocardium or myocardial) N3 (repair* or reparation or improv* or regenerat*) )
S16 TI (heart attack* or coronary attack* or acute coronary syndrome* or AMI) OR AB (heart attack* or coronary attack* or acute coronary syndrome* or AMI)
S17 S7 OR S8 OR S9 OR S10 OR S11 OR S12 OR S13 OR S14 OR S15 OR S16
S18 S6 AND S17
S19 TI ( cellular cardiomyoplast* or ((cardiomyocyte* or cardiac cell*) N6 transplant*) or ((intramyocardial* or intracoronary or transendocardial* or transcoronary) N6 (transplant* or stem or bone marrow or marrow cell* or BMC* or stromal or mesenchymal or progenitor cell* or precursor cell*)) ) OR AB ( cellular cardiomyoplast* or ((cardiomyocyte* or cardiac cell*) N6 transplant*) or ((intramyocardial* or intracoronary or transendocardial* or transcoronary) N6 (transplant* or stem or bone marrow or marrow cell* or BMC* or stromal or mesenchymal or progenitor cell* or precursor cell*))
S20 S18 OR S19 {Limiters ‐ Published Date: 20140101‐20151214}
LILACS
(tw:((infarct OR infarction OR coronary OR myocardial OR heart OR cardiac OR cardiomyopathy OR myocardial OR subendocardial OR intramyocardial OR intracoronary OR ischemia OR ischemic OR nonischemic))) AND (tw:((bone marrow OR marrow cell OR marrow cells OR stem cell OR stem cells OR progenitor cells OR precursor cells OR cell therapy OR cellular therapy OR cell‐based therapy OR mononuclear cells OR mesenchymal cells OR stromal cells))) AND (instance:"regional") AND ( db:("LILACS") AND type_of_study:("clinical_trials"))
IndMED
(bone marrow OR marrow cell OR marrow cells OR stem cell OR stem cells OR progenitor cell OR precursor cell OR cell therapy OR cellular therapy OR mesenchymal cells OR stromal cells) AND (infarct OR infarction OR coronary OR intracoronary OR myocardial OR heart OR cardiac OR congestive OR cardiomyopathy OR intramyocardial OR intracoronary OR ischemia OR ischemic OR ischaemia OR ischaemic OR nonischemic OR nonischaemic) AND (randomised OR randomly OR randomized OR blind OR blinded OR trial OR study OR control group)
KoreaMed [N.B. Search lines run separately: presented this way for brevity]
(stem [ALL] OR marrow [ALL] OR mesenchymal[ALL] OR stromal[ALL]) AND (myocardial [ALL] OR heart[ALL] OR cardiac[ALL] OR coronary[ALL] OR cardiomyopathy[ALL]) AND "Randomized Controlled Trial" [PT]
PakMediNet
Combinations of the following free text terms were used:
stem cell, stem cells, bone marrow, marrow cells, progenitor cells, precursor cells, mesenchymal cells, stromal cells
AND
myocardial infarction, heart attack, cardiac ischemia, coronary ischemia, myocardial ischemia, cardiomyopathy, heart failure, cardiac failure, angina, coronary artery disease
Web of Science CPCI‐S
TI=("cardiac failure" OR "heart attack" OR "heart failure" OR "coronary disease" OR "cardiovascular disease" OR "coronary artery" OR "coronary arterial" OR "myocardial infarction" OR cardiomyopathy OR "heart disease" OR "heart diseases" OR "cardiac insufficiency" OR AMI OR IHD OR CIHD OR DCM OR IDCM OR "myocardial dysfunction" OR stenocardia OR angina) AND TI=("stem cell" OR "stem cells" OR "bone marrow" OR "marrow cells" OR "cellular therapy" OR "mesenchymal cells" OR "stromal cells" OR "cell transplant" OR "precursor cells" OR "progenitor cells" OR (c‐kit* NEAR/5 cells) OR HSCT OR SCT OR MSC OR MSCs OR BMT OR BMC OR BMAC OR BMCs OR HST OR HSTs) AND TS=(randomised OR randomly OR randomized OR blind OR blinded OR trial OR study OR "control group" OR groups)
ClinicalTrials.gov
Search Terms: randomized OR randomised OR random OR randomly
Study Type: Intervention Studies
Condition: cardiac OR heart attack OR heart failure OR coronary OR myocardial OR cardiomyopathy OR heart disease OR angina
Intervention: stem cells OR bone marrow cells OR cellular therapy OR mesenchymal cells OR stromal cells OR cell transplant OR marrow transplant OR precursor cells OR progenitor cells OR HSCT OR SCT OR MSC OR MSCs OR BMT OR BMC OR BMAC OR BMCs OR HST OR HSTs
ISRCTN Register
(("marrow cell" OR "marrow cells" OR "stem cell" OR "stem cells" OR "progenitor cells" OR "precursor cells" OR "mesenchymal cells" OR "stromal cells") AND ("myocardial infarction" OR "heart attack" OR cardiomyopathy OR intramyocardial OR intracoronary))
OR
(("marrow cell" OR "marrow cells" OR "stem cell" OR "stem cells" OR "progenitor cells" OR "precursor cells" OR "mesenchymal cells" OR "stromal cells") AND ("cardiac ischemia" OR "coronary ischemia" OR "myocardial ischemia" OR "heart failure" OR "cardiac failure" OR congestive OR "coronary artery disease"))
OR
(("cell therapy" OR "cellular therapy" OR "cell transplant" OR "marrow transplant") AND ("myocardial infarction" OR "heart attack" OR cardiomyopathy OR intramyocardial OR intracoronary OR "cardiac ischemia" OR "coronary ischemia" OR "myocardial ischemia" OR "heart failure" OR "cardiac failure" OR congestive OR "coronary artery disease" OR angina))
WHO ICTRP Search Portal
Intervention OR Title: stem cells OR bone marrow cells OR cellular therapy OR mesenchymal cells OR stromal cells OR cell transplant OR marrow transplant OR precursor cells OR progenitor cells OR HSCT OR SCT OR MSC OR MSCs OR BMT OR BMC OR BMAC OR BMCs OR HST OR HSTs
Condition OR Title: cardiac OR heart OR coronary OR myocardial OR angina OR cardiomyopathy
Recruitment Status: ALL
Hong Kong Clinical Trials Registry
Combinations of the following free text terms were used:
stem cell, stem cells, bone marrow, marrow cells, progenitor cells, precursor cells, mesenchymal cells, stromal cells
AND
myocardial infarction, heart attack, cardiac ischemia, coronary ischemia, myocardial ischemia, cardiomyopathy, heart failure, cardiac failure, angina, coronary artery disease


Risk of bias summary: review authors' judgements about each risk of bias item for each included study.

Funnel plot of comparison: 1 Stem cells versus no stem cells, outcome: 1.1 Mortality.

Trial sequential analysis: Mortality at long‐term follow‐up (≥ 12 months). TSMB = trial sequential monitoring boundary; horizontal red lines indicate conventional significance threshold.
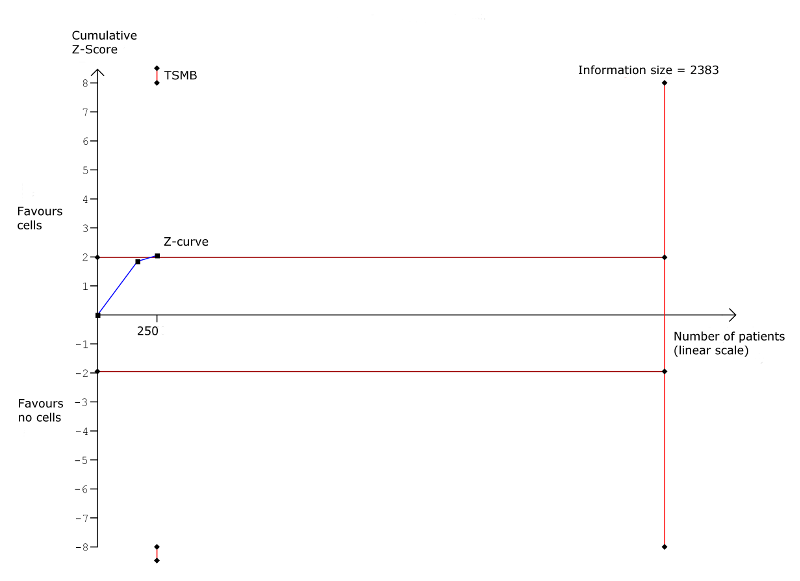
Trial sequential analysis: Non‐fatal myocardial infarction at long‐term follow‐up (≥ 12 months). TSMB = trial sequential monitoring boundary; horizontal red lines indicate conventional significance threshold.

Trial sequential analysis: Rehospitalisation due to heart failure at long‐term follow‐up (≥ 12 months). TSMB = trial sequential monitoring boundary; horizontal red lines indicate conventional significance threshold.
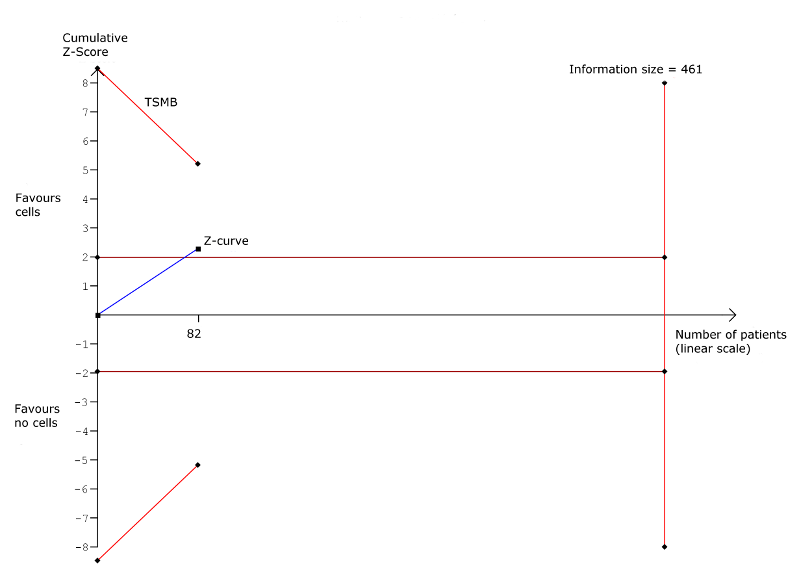
Trial sequential analysis: Arrhythmias at long‐term follow‐up (≥ 12 months). TSMB = trial sequential monitoring boundary; horizontal red lines indicate conventional significance threshold.

Trial sequential analysis: Composite MACE at long‐term follow‐up (≥ 12 months). TSMB = trial sequential monitoring boundary; horizontal red lines indicate conventional significance threshold.

Trial sequential analysis: Left ventricular ejection fraction measured by MRI at long‐term follow‐up (≥ 12 months). TSMB = trial sequential monitoring boundary; horizontal red lines indicate conventional significance threshold.
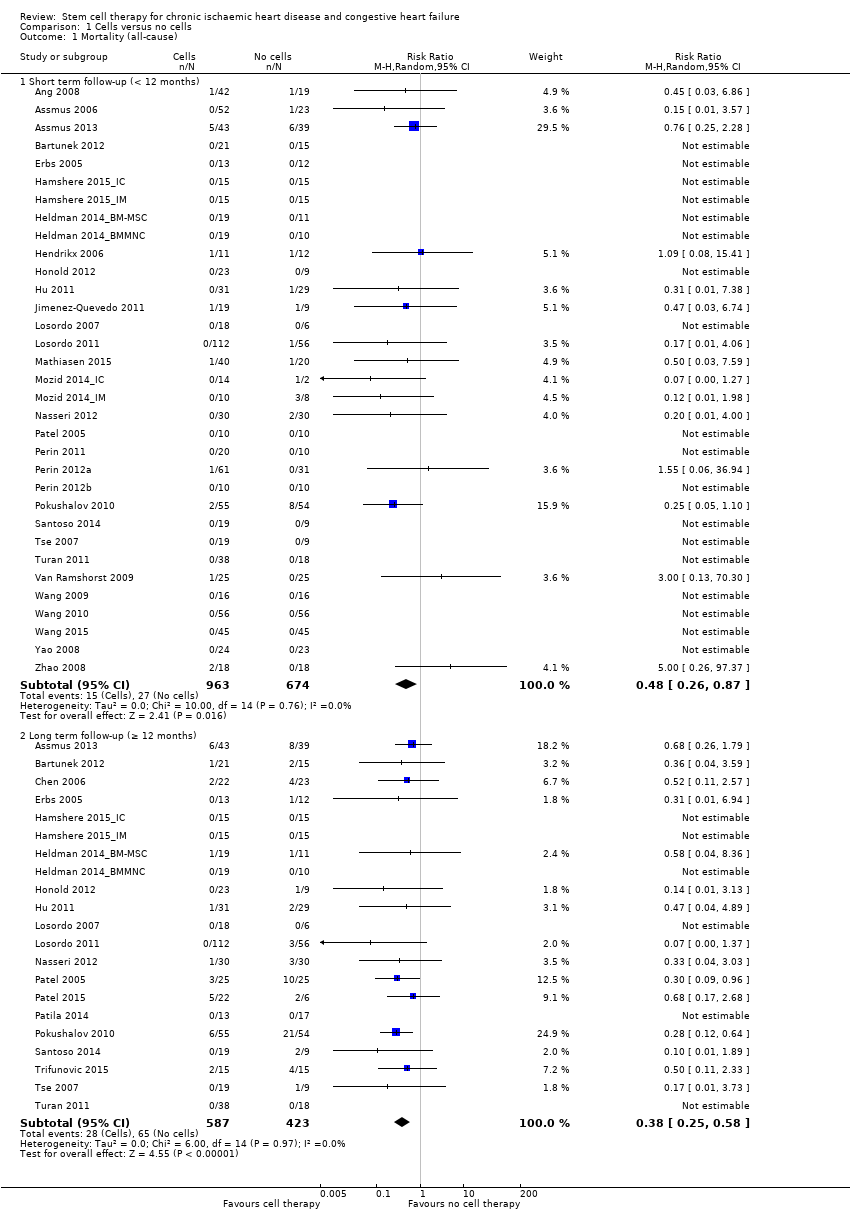
Comparison 1 Cells versus no cells, Outcome 1 Mortality (all‐cause).

Comparison 1 Cells versus no cells, Outcome 2 Non‐fatal myocardial infarction.

Comparison 1 Cells versus no cells, Outcome 3 Rehospitalisation due to heart failure.

Comparison 1 Cells versus no cells, Outcome 4 Arrhythmias.

Comparison 1 Cells versus no cells, Outcome 5 Composite MACE.

Comparison 1 Cells versus no cells, Outcome 6 MLHFQ: short term follow‐up (< 12 months).
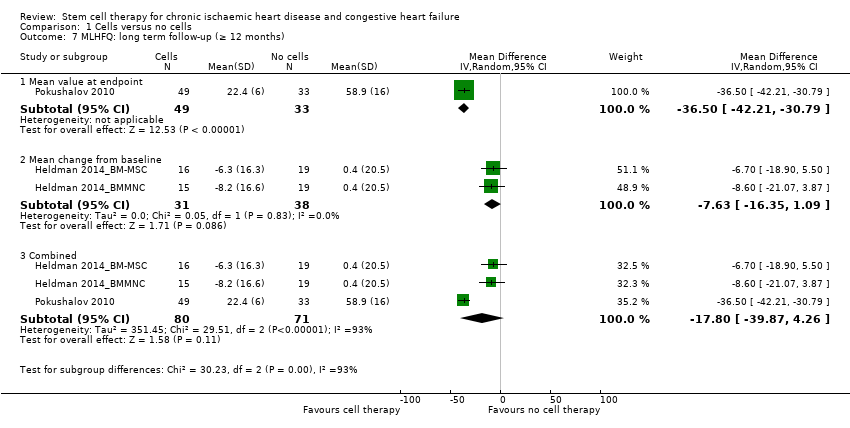
Comparison 1 Cells versus no cells, Outcome 7 MLHFQ: long term follow‐up (≥ 12 months).

Comparison 1 Cells versus no cells, Outcome 8 Seattle Angina Questionnaire: short term follow‐up (< 12 months).
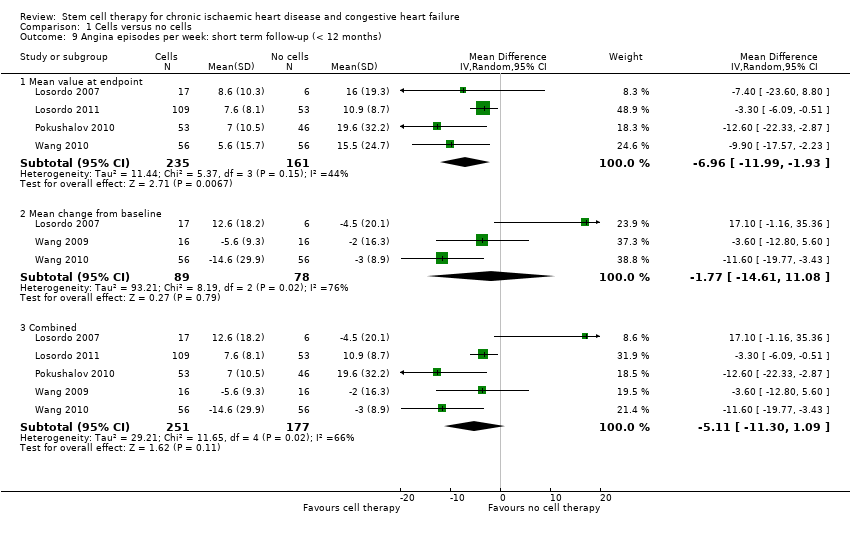
Comparison 1 Cells versus no cells, Outcome 9 Angina episodes per week: short term follow‐up (< 12 months).
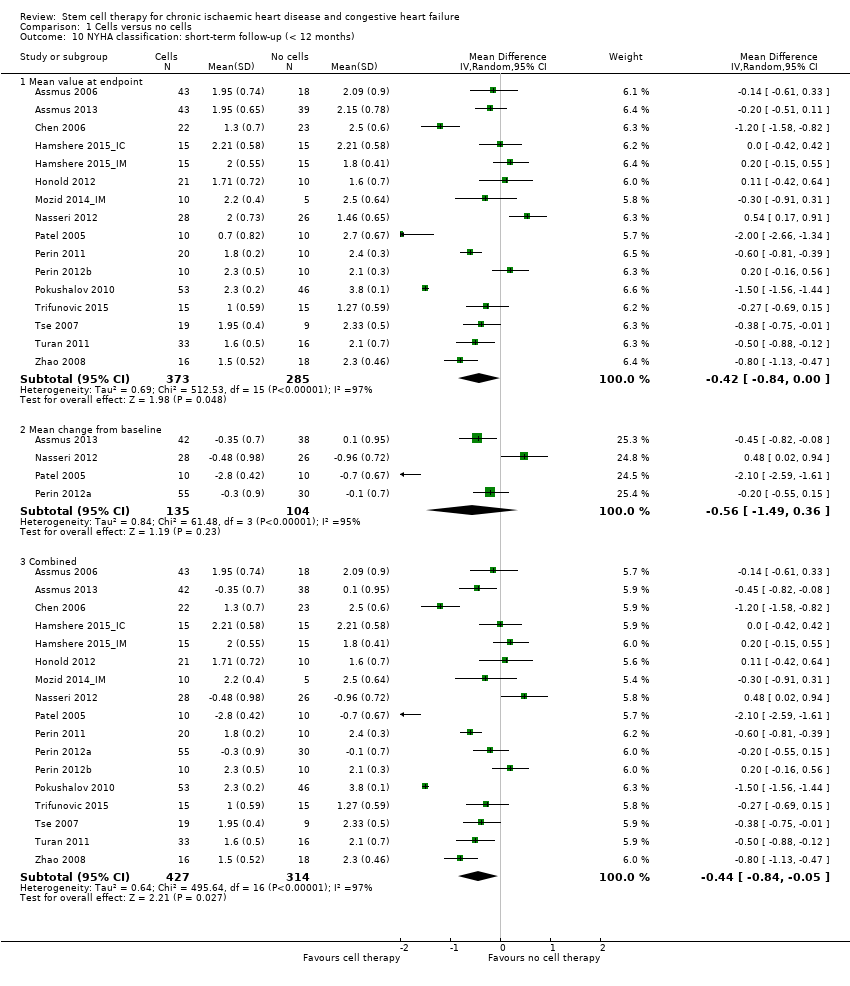
Comparison 1 Cells versus no cells, Outcome 10 NYHA classification: short‐term follow‐up (< 12 months).

Comparison 1 Cells versus no cells, Outcome 11 NYHA classification: long term follow‐up (≥ 12 months).

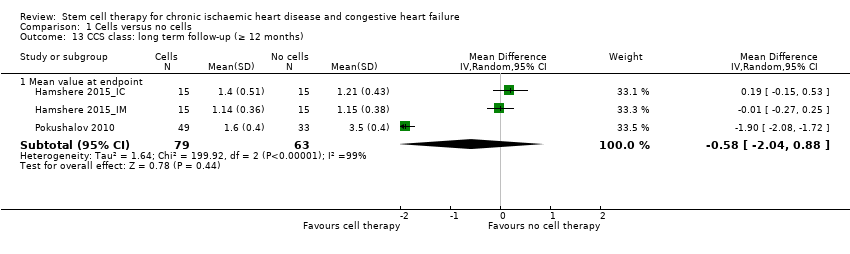
Comparison 1 Cells versus no cells, Outcome 12 CCS class: short term follow‐up (< 12 months).
Comparison 1 Cells versus no cells, Outcome 13 CCS class: long term follow‐up (≥ 12 months).
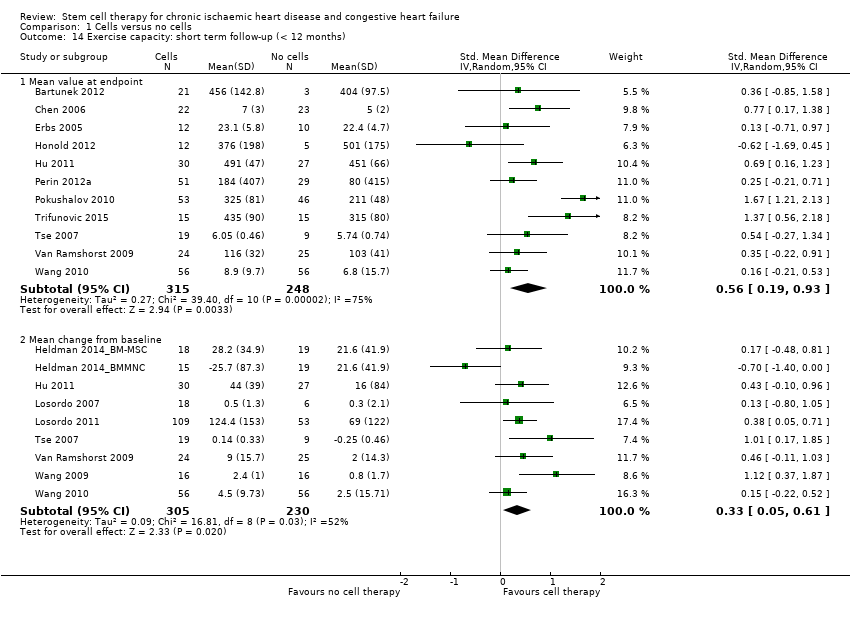
Comparison 1 Cells versus no cells, Outcome 14 Exercise capacity: short term follow‐up (< 12 months).

Comparison 1 Cells versus no cells, Outcome 15 Exercise capacity: long term follow‐up (≥ 12 months).
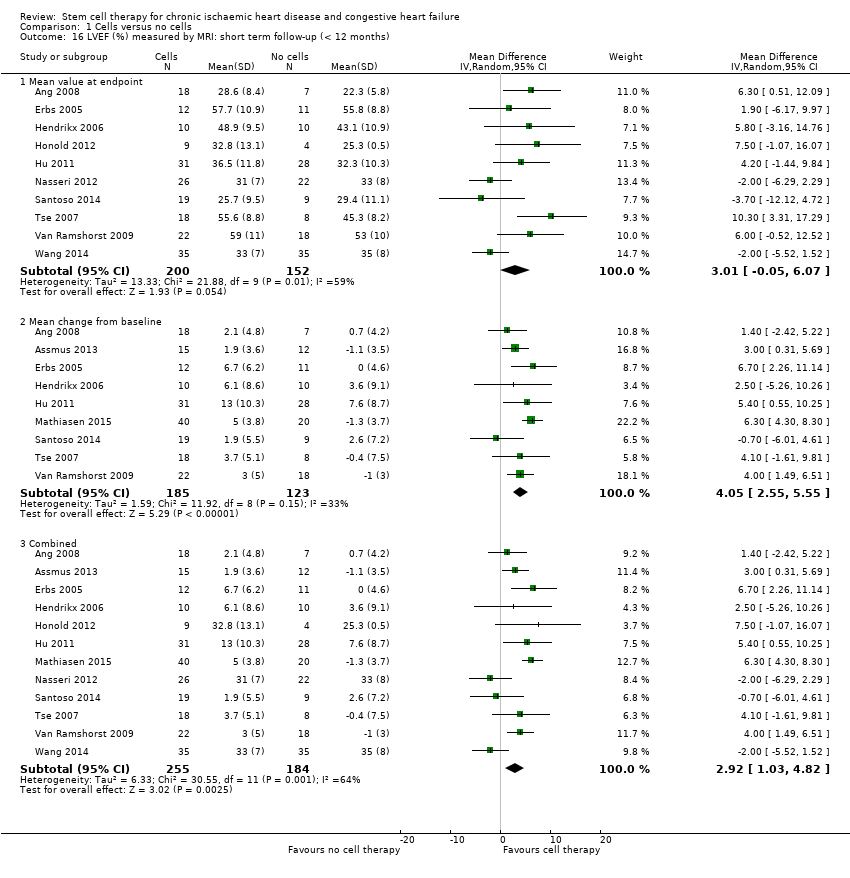
Comparison 1 Cells versus no cells, Outcome 16 LVEF (%) measured by MRI: short term follow‐up (< 12 months).

Comparison 1 Cells versus no cells, Outcome 17 LVEF (%) measured by MRI: long term follow‐up (≥ 12 months).
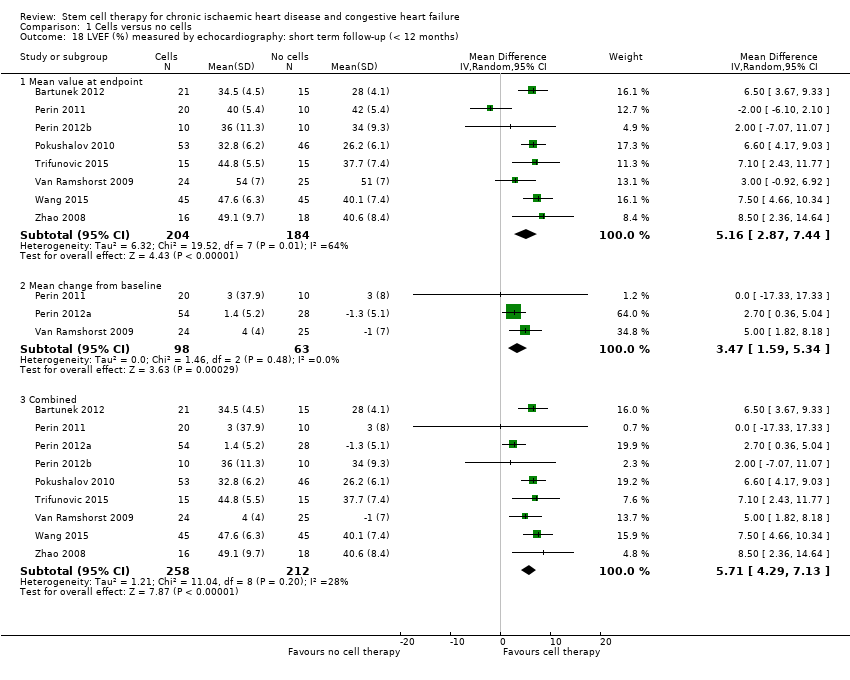
Comparison 1 Cells versus no cells, Outcome 18 LVEF (%) measured by echocardiography: short term follow‐up (< 12 months).
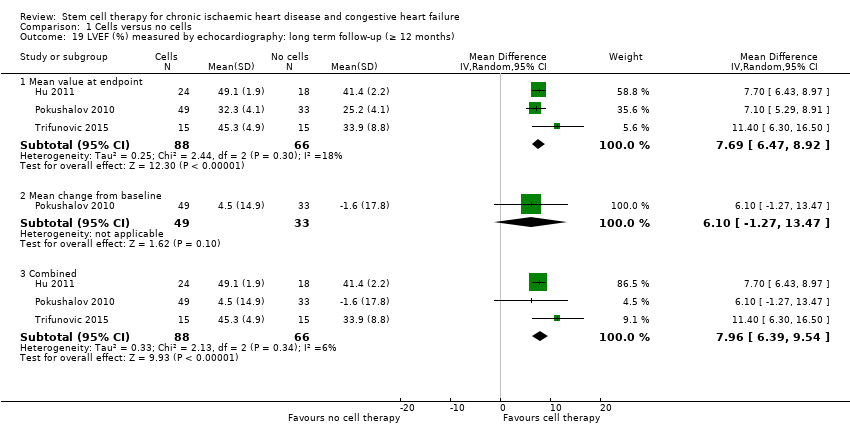
Comparison 1 Cells versus no cells, Outcome 19 LVEF (%) measured by echocardiography: long term follow‐up (≥ 12 months).

Comparison 1 Cells versus no cells, Outcome 20 LVEF (%) measured by SPECT: short term follow‐up (< 12 months).
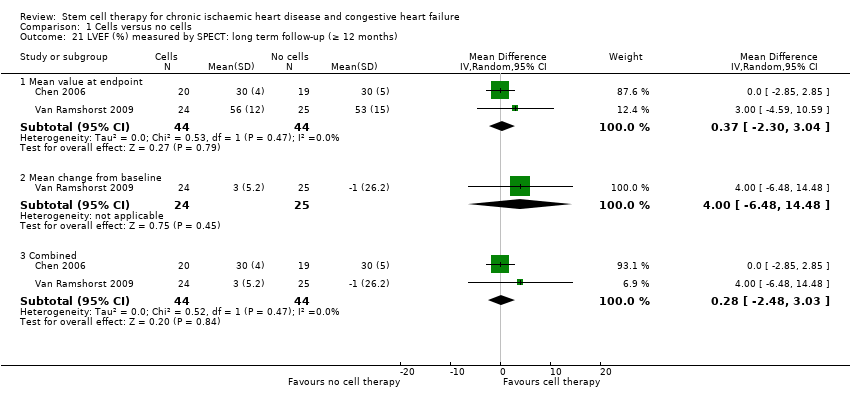
Comparison 1 Cells versus no cells, Outcome 21 LVEF (%) measured by SPECT: long term follow‐up (≥ 12 months).
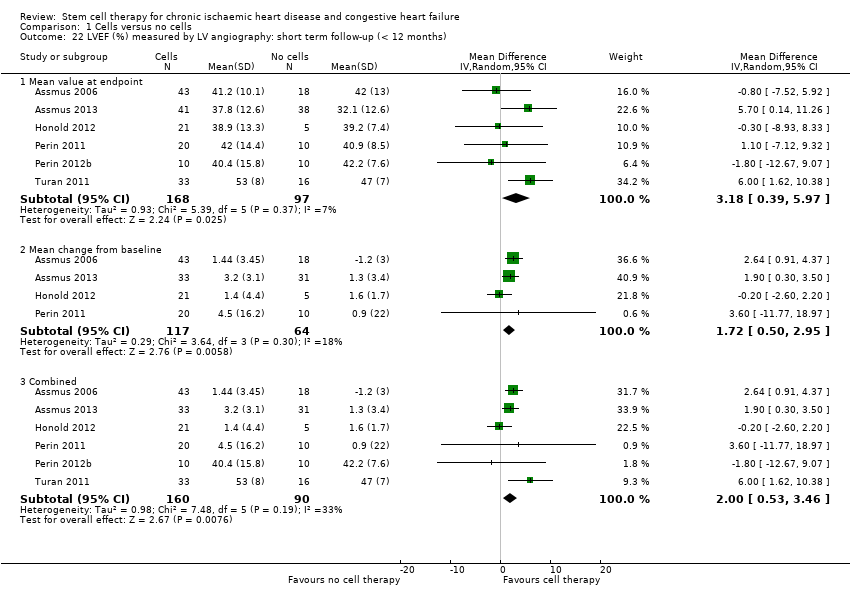
Comparison 1 Cells versus no cells, Outcome 22 LVEF (%) measured by LV angiography: short term follow‐up (< 12 months).

Comparison 1 Cells versus no cells, Outcome 23 LVEF (%) measured by LV angiography: long term follow‐up (≥ 12 months).

Comparison 2 Cell dose: subgroup analysis, Outcome 1 Mortality (all‐cause): short term follow‐up (< 12 months).
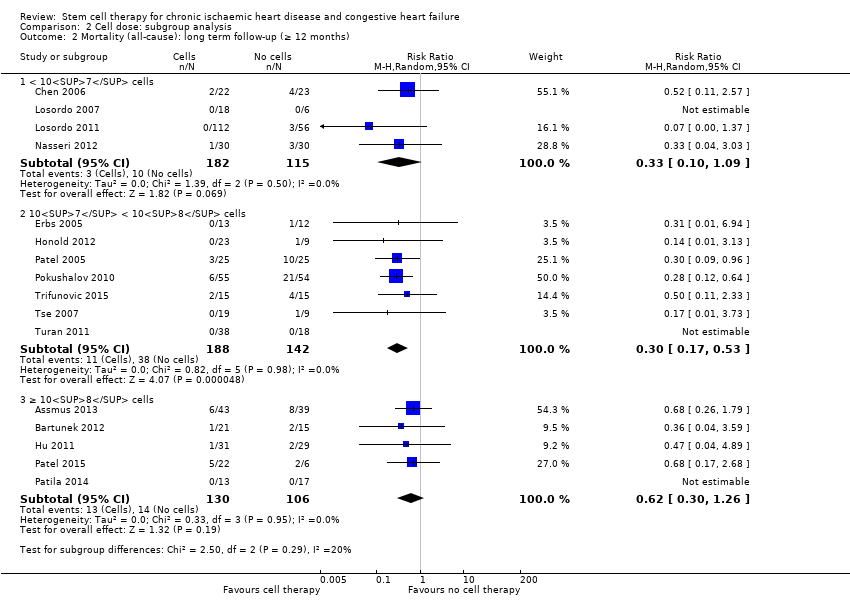
Comparison 2 Cell dose: subgroup analysis, Outcome 2 Mortality (all‐cause): long term follow‐up (≥ 12 months).

Comparison 2 Cell dose: subgroup analysis, Outcome 3 NYHA classification: short term follow‐up (< 12 months).
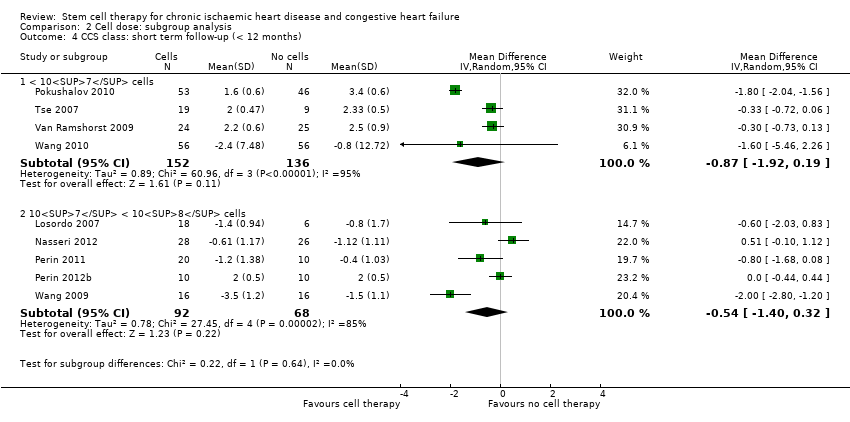
Comparison 2 Cell dose: subgroup analysis, Outcome 4 CCS class: short term follow‐up (< 12 months).
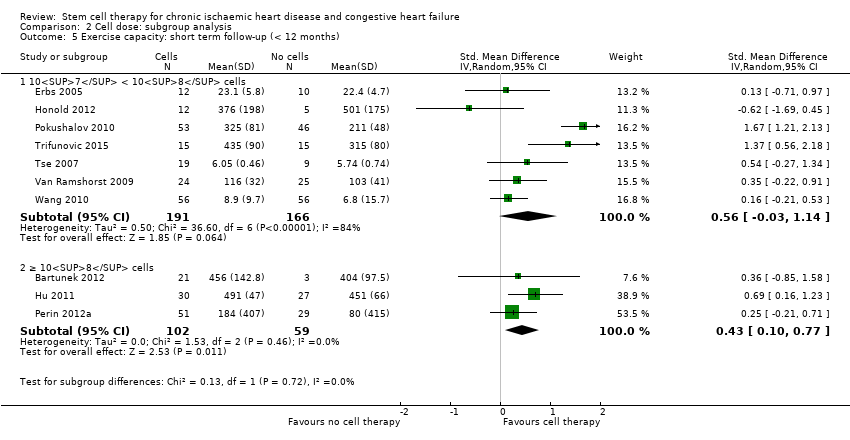
Comparison 2 Cell dose: subgroup analysis, Outcome 5 Exercise capacity: short term follow‐up (< 12 months).

Comparison 2 Cell dose: subgroup analysis, Outcome 6 LVEF (%) measured by MRI: short term follow‐up (< 12 months).

Comparison 3 Baseline cardiac function: subgroup analysis, Outcome 1 Mortality (all‐cause): short term follow‐up (< 12 months).
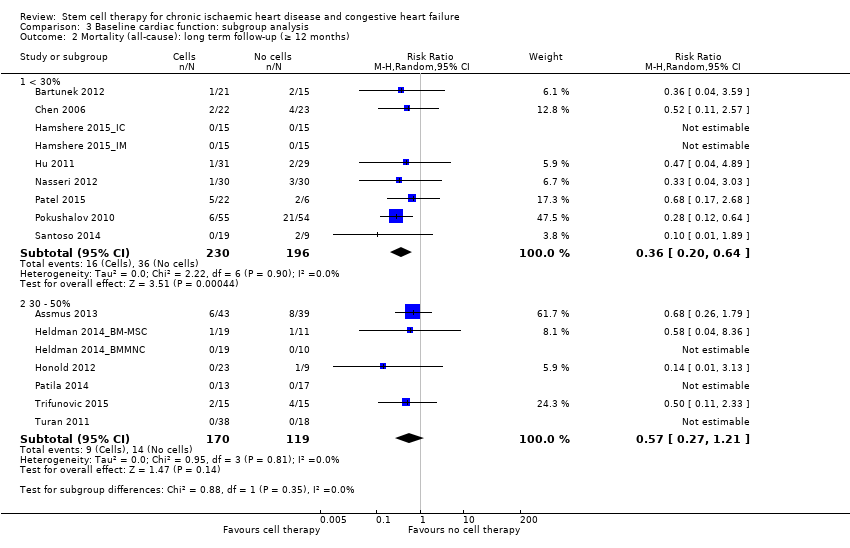
Comparison 3 Baseline cardiac function: subgroup analysis, Outcome 2 Mortality (all‐cause): long term follow‐up (≥ 12 months).

Comparison 3 Baseline cardiac function: subgroup analysis, Outcome 3 NYHA classification: short term follow‐up (< 12 months).

Comparison 3 Baseline cardiac function: subgroup analysis, Outcome 4 NYHA classification: long term follow‐up (≥ 12 months).

Comparison 3 Baseline cardiac function: subgroup analysis, Outcome 5 CCS class: short term follow‐up (< 12 months).

Comparison 3 Baseline cardiac function: subgroup analysis, Outcome 6 Exercise capacity: short term follow‐up (< 12 months).
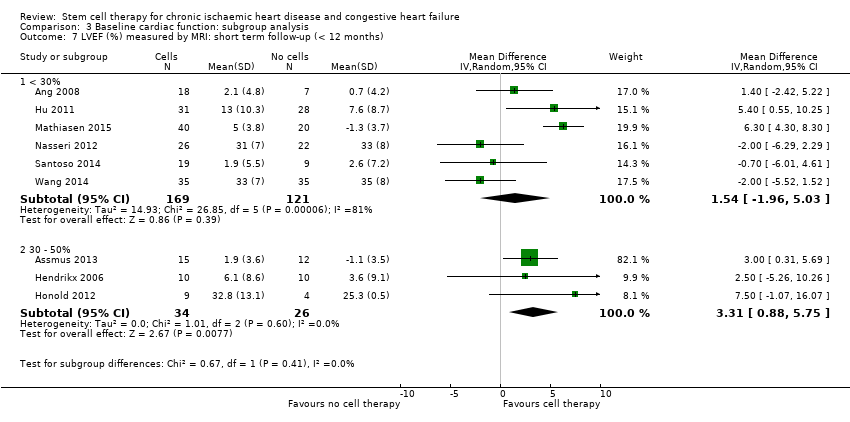
Comparison 3 Baseline cardiac function: subgroup analysis, Outcome 7 LVEF (%) measured by MRI: short term follow‐up (< 12 months).

Comparison 4 Route of cell administration: subgroup analysis, Outcome 1 Mortality (all‐cause): short term follow‐up (< 12 months).

Comparison 4 Route of cell administration: subgroup analysis, Outcome 2 Mortality (all‐cause): long term follow‐up (≥ 12 months).
Comparison 4 Route of cell administration: subgroup analysis, Outcome 3 NYHA classification: short term follow‐up (< 12 months).

Comparison 4 Route of cell administration: subgroup analysis, Outcome 4 NYHA classification: long term follow‐up (≥ 12 months).

Comparison 4 Route of cell administration: subgroup analysis, Outcome 5 CCS class: short term follow‐up (< 12 months).

Comparison 4 Route of cell administration: subgroup analysis, Outcome 6 Exercise capacity: short term follow‐up (< 12 months).

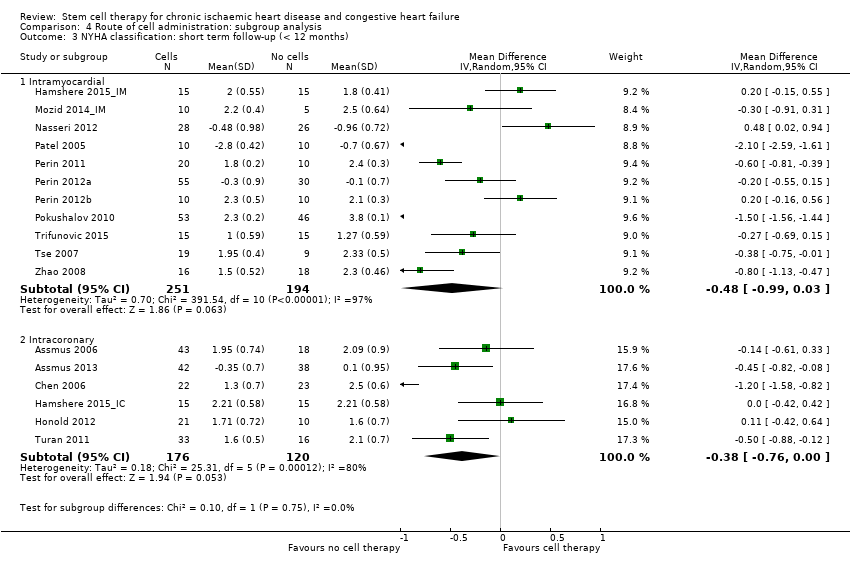
Comparison 4 Route of cell administration: subgroup analysis, Outcome 7 LVEF (%) measured by MRI: short term follow‐up (< 12 months).

Comparison 5 Cell type: subgroup analysis, Outcome 1 Mortality (all‐cause): short term follow‐up (< 12 months).
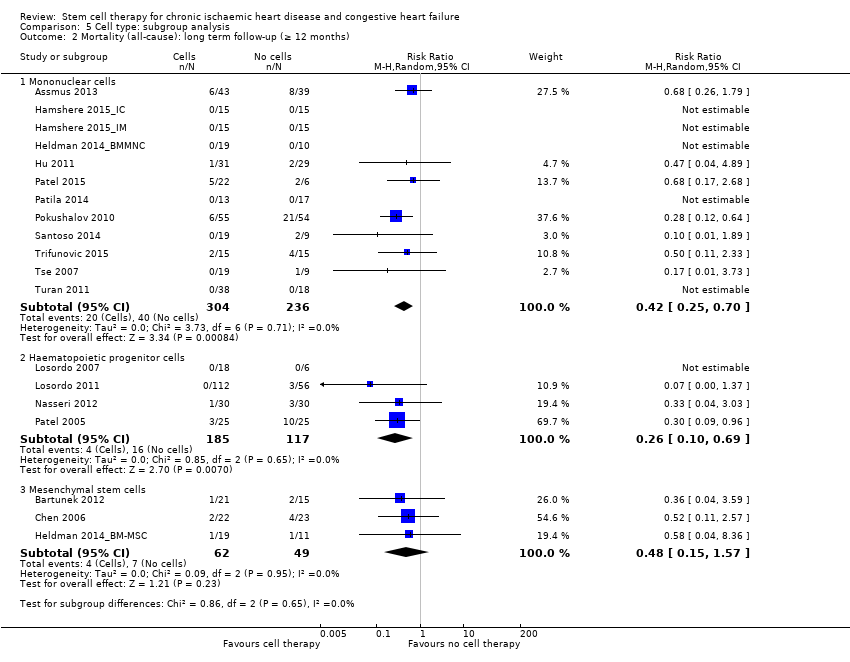
Comparison 5 Cell type: subgroup analysis, Outcome 2 Mortality (all‐cause): long term follow‐up (≥ 12 months).
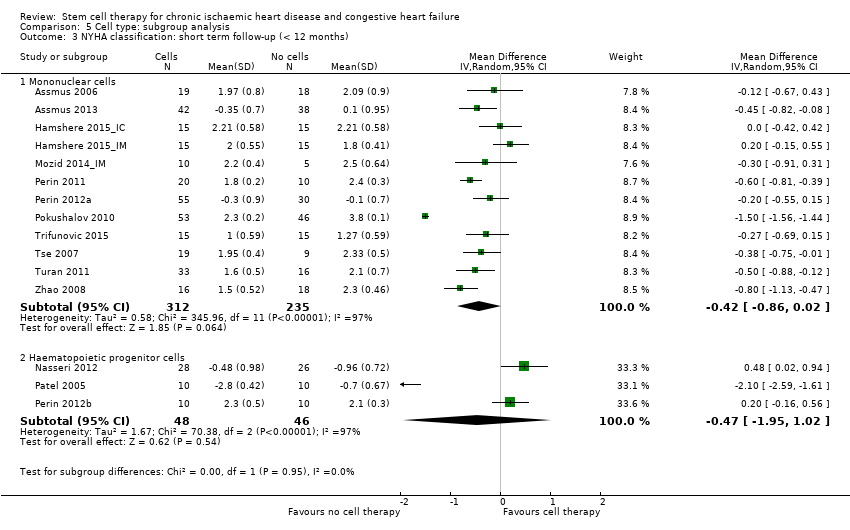
Comparison 5 Cell type: subgroup analysis, Outcome 3 NYHA classification: short term follow‐up (< 12 months).
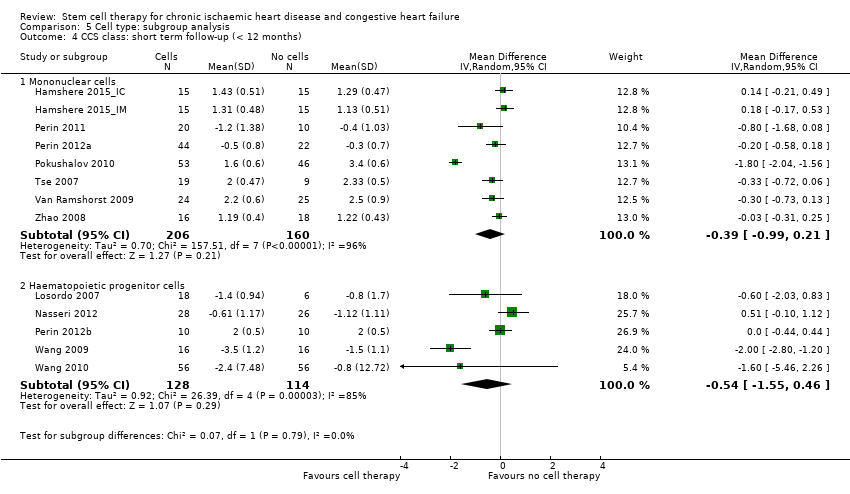
Comparison 5 Cell type: subgroup analysis, Outcome 4 CCS class: short term follow‐up (< 12 months).

Comparison 6 Participant diagnosis: subgroup analysis, Outcome 1 Mortality (all‐cause): short term follow‐up (< 12 months).
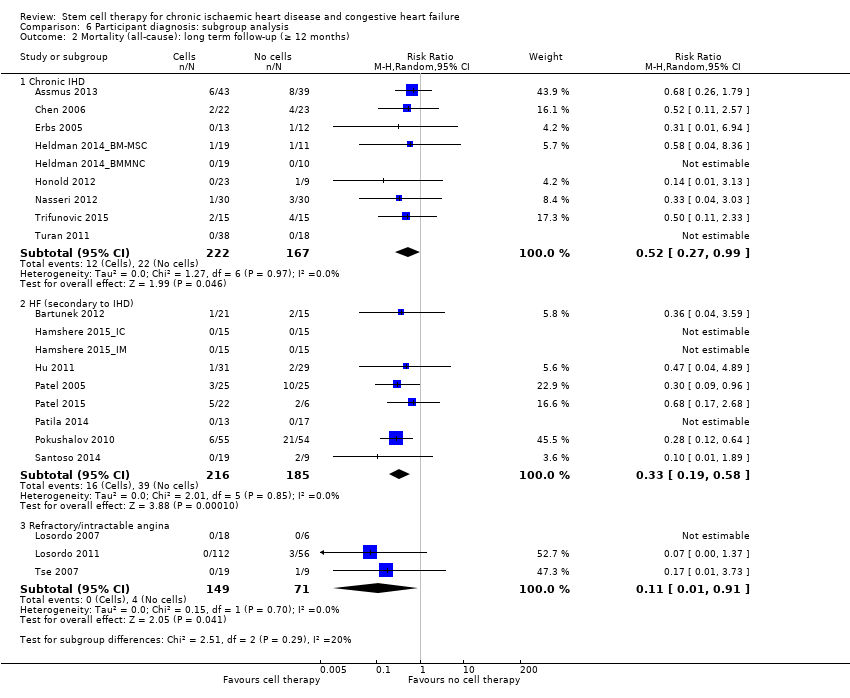
Comparison 6 Participant diagnosis: subgroup analysis, Outcome 2 Mortality (all‐cause): long term follow‐up (≥ 12 months).

Comparison 6 Participant diagnosis: subgroup analysis, Outcome 3 NYHA classification: short term follow‐up (< 12 months).
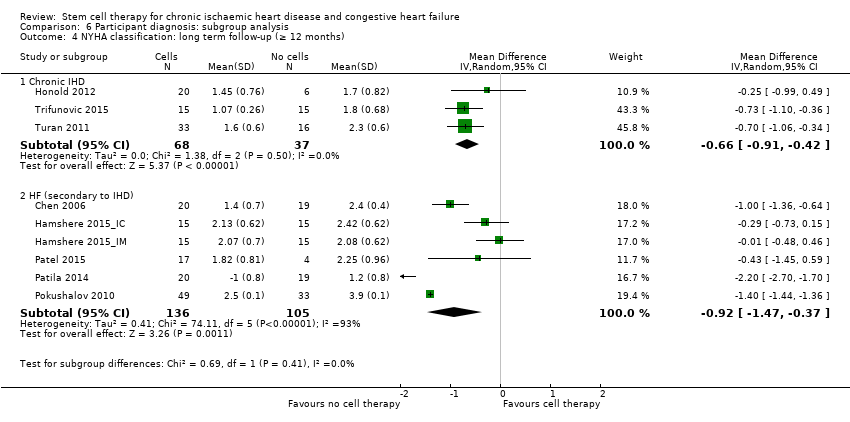
Comparison 6 Participant diagnosis: subgroup analysis, Outcome 4 NYHA classification: long term follow‐up (≥ 12 months).

Comparison 6 Participant diagnosis: subgroup analysis, Outcome 5 CCS class: short term follow‐up (< 12 months).

Comparison 6 Participant diagnosis: subgroup analysis, Outcome 6 Exercise capacity: short term follow‐up (< 12 months).
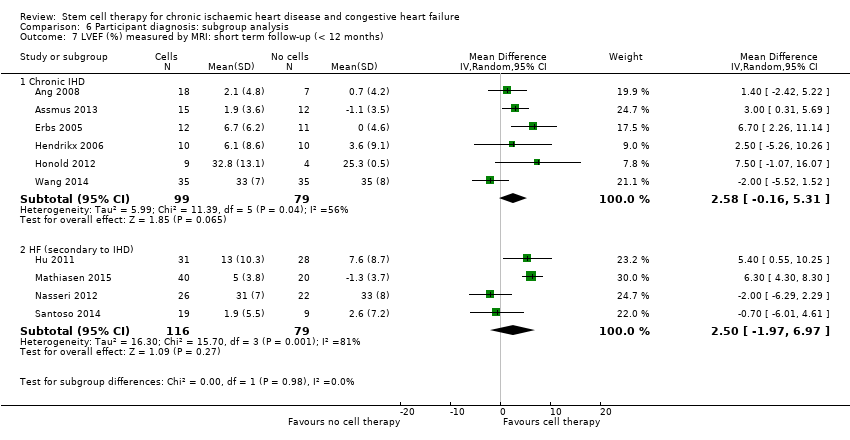
Comparison 6 Participant diagnosis: subgroup analysis, Outcome 7 LVEF (%) measured by MRI: short term follow‐up (< 12 months).

Comparison 7 Co‐interventions: subgroup analysis, Outcome 1 Mortality (all‐cause): short term follow‐up (< 12 months).
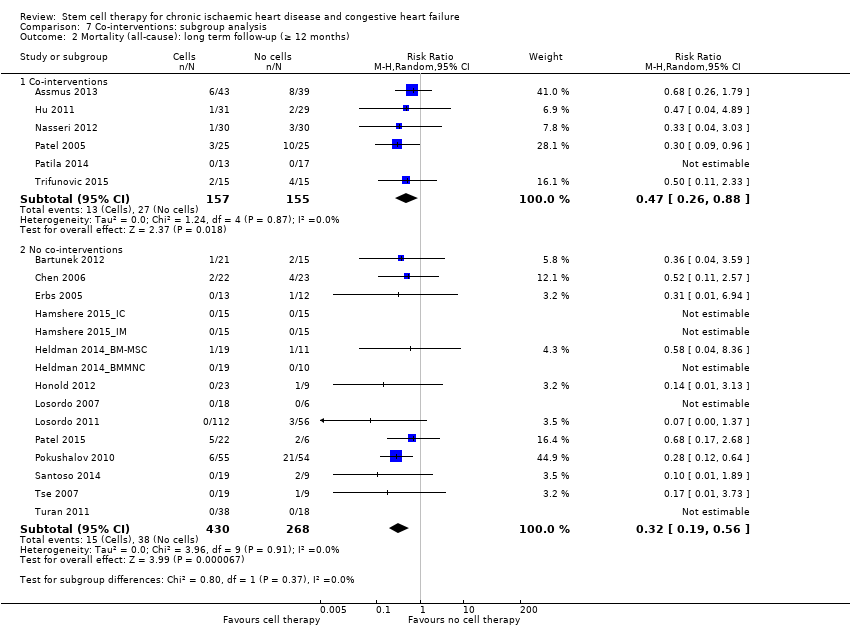
Comparison 7 Co‐interventions: subgroup analysis, Outcome 2 Mortality (all‐cause): long term follow‐up (≥ 12 months).

Comparison 7 Co‐interventions: subgroup analysis, Outcome 3 NYHA classification: short term follow‐up (< 12 months).

Comparison 7 Co‐interventions: subgroup analysis, Outcome 4 LVEF (%) measured by MRI: short term follow‐up (< 12 months).
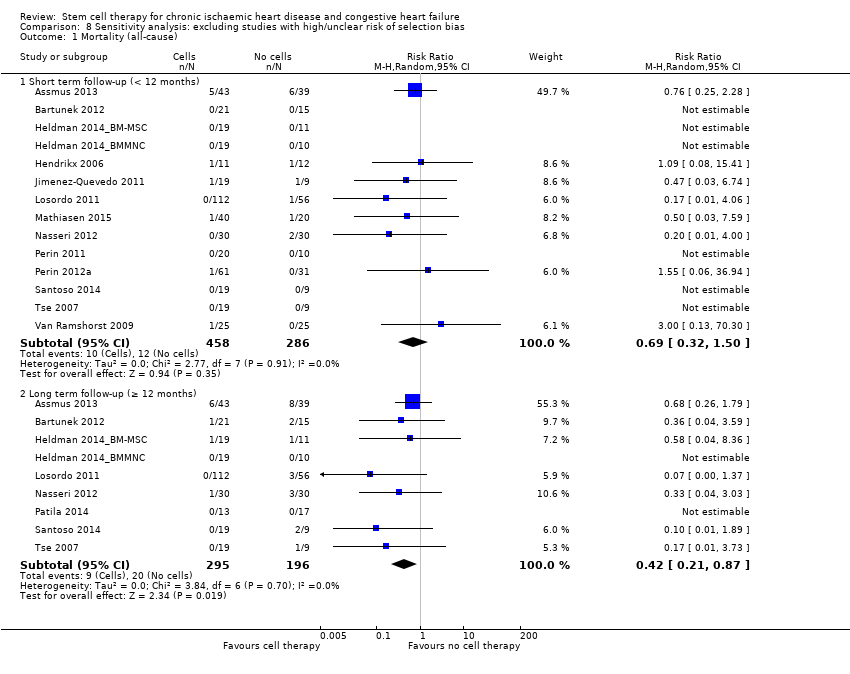
Comparison 8 Sensitivity analysis: excluding studies with high/unclear risk of selection bias, Outcome 1 Mortality (all‐cause).
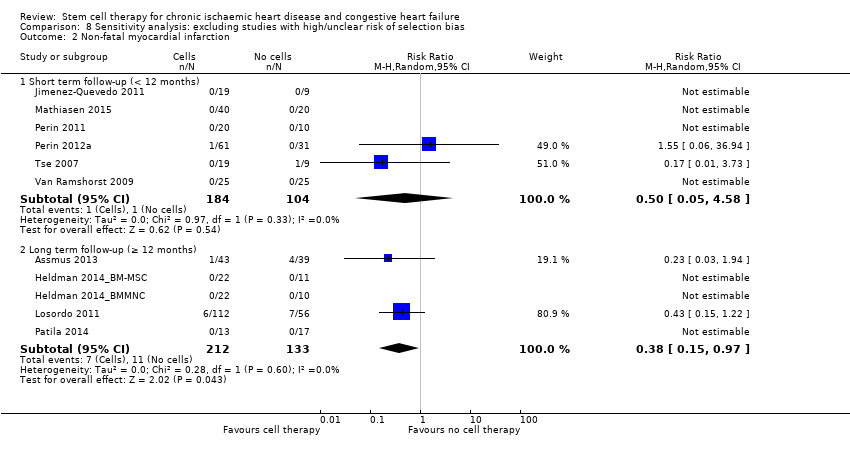
Comparison 8 Sensitivity analysis: excluding studies with high/unclear risk of selection bias, Outcome 2 Non‐fatal myocardial infarction.

Comparison 8 Sensitivity analysis: excluding studies with high/unclear risk of selection bias, Outcome 3 Rehospitalisation due to heart failure.

Comparison 8 Sensitivity analysis: excluding studies with high/unclear risk of selection bias, Outcome 4 Arrhythmias.

Comparison 8 Sensitivity analysis: excluding studies with high/unclear risk of selection bias, Outcome 5 Composite MACE.
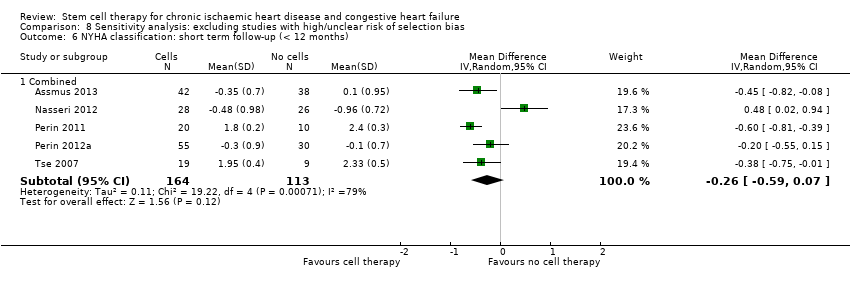
Comparison 8 Sensitivity analysis: excluding studies with high/unclear risk of selection bias, Outcome 6 NYHA classification: short term follow‐up (< 12 months).

Comparison 8 Sensitivity analysis: excluding studies with high/unclear risk of selection bias, Outcome 7 NYHA classification: long term follow‐up (≥ 12 months).

Comparison 8 Sensitivity analysis: excluding studies with high/unclear risk of selection bias, Outcome 8 LVEF (%) measured by MRI: short term follow‐up (< 12 months).

Comparison 8 Sensitivity analysis: excluding studies with high/unclear risk of selection bias, Outcome 9 LVEF (%) measured by MRI: long term follow‐up (≥ 12 months).

Comparison 9 Sensitivity analysis: excluding studies with high/unclear risk of performance bias, Outcome 1 Mortality (all‐cause).

Comparison 10 Sensitivity analysis: excluding studies with high/unclear risk of attrition bias, Outcome 1 Mortality (all‐cause).
| Bone marrow‐derived cell therapy for people with chronic ischaemic heart disease and congestive heart failure | ||||||
| Patient or population: people with chronic ischaemic heart disease and congestive heart failure Comparison: no cell therapy | ||||||
| Outcomes | Illustrative comparative risks* (95% CI) | Relative effect | No of Participants | Quality of the evidence | Comments | |
| Assumed risk | Corresponding risk | |||||
| No cell therapy | Bone marrow‐derived cell therapy | |||||
| Mortality (all cause) Long‐term follow‐up (≥ 12 months) | 102 per 1000 | 43 per 1000 | RR 0.42 | 491 | ⊕⊕⊝⊝ | The required information size of 1899 participants to detect a RRR of 35% has not been reached. |
| Periprocedural adverse events | See comment | See comment | Not estimable | 1695 (34 studies) | See comment | Adverse events occurring during the mapping or cell/placebo injection procedure included ventricular tachycardia (7), ventricular fibrillation (1), atrial fibrillation (1), transient complete heart block (1), transient pulmonary oedema (3), thrombus on mapping catheter tip (1), visual disturbances (2), myocardial perforation (2), limited retrograde catheter‐related dissection of the abdominal aorta (1). |
| Non‐fatal myocardial infarction Long‐term follow‐up (≥ 12 months) | 83 per 1000 | 31 per 1000 | RR 0.38 | 345 | ⊕⊕⊝⊝ | The required information size of 2383 participants to detect a RRR of 35% has not been reached. |
| Rehospitalisation due to heart failure Long‐term follow‐up (≥ 12 months) | 155 per 1000 | 98 per 1000 | RR 0.63 | 375 | ⊕⊕⊝⊝ | The required information size of 1193 participants to detect a RRR of 35% has not been reached. |
| Arrhythmias Long‐term follow‐up (≥ 12 months) | 333 per 1000 | 140 per 1000 | RR 0.42 | 82 | ⊕⊕⊝⊝ | The required information size of 461 participants to detect a RRR of 35% has not been reached. |
| Composite MACE Long‐term follow‐up (≥ 12 months) | 350 per 1000 | 224 per 1000 | RR 0.64 | 141 | ⊕⊕⊝⊝ | The required information size of 431 participants to detect a RRR of 35% has not been reached. |
| LVEF (%) measured by MRI Long‐term follow‐up (≥ 12 months) | ‐ | The mean LVEF (%) measured by MRI in the intervention groups was 1.6 lower (8.7 lower to 5.5 higher). | ‐ | 25 | ⊕⊕⊝⊝ | The required information size of 322 participants to detect a mean difference of 4% has not been reached. |
| *The risk in the intervention group (and its 95% confidence interval) is based on the assumed risk in the comparison group and the relative effect of the intervention (and its 95% CI). ¶Only studies with a low risk of selection bias are included. | ||||||
| GRADE Working Group grades of evidence | ||||||
| 1Six trials received full or partial commercial funding, which could have resulted in a biased assessment of the intervention effect and were therefore deemed to have a high risk of bias. One trial was not blinded (high risk of performance bias) and had a high risk of attrition bias. | ||||||
| Study ID | Country of study | Patient population | Mean (SD) age of participants (years) | % Male | No. randomised participants receiving intervention | No. randomised participants receiving comparator | Mean duration of follow‐up |
| UK | CIHD (> 1 chronic myocardial scar; elective CABG) | BMMNC‐IM: 64.7 (8.7) BMMNC‐IC: 62.1 (8.7) Controls: 61.3 (8.3) | BMMNC‐IM: 71.4% BMMNC‐IC: 90.5% Controls: 90.0% | 42 (21 IM, 21 IC) | 21 | 6 months | |
| Germany | CIHD (MI > 3 months; LV dysfunction) | BMMNC: 59 (12) CPC: 54 (12) Controls: 61 (9) | BMMNC: 89% CPC: 79% Controls: 100% | 52 (28 MNC, 24 CPC) | 23 | 3 months | |
| Germany | CIHD (MI > 3 months; LVEF < 50%; NYHA class II or greater) | BMMNC‐LDSW: 65 (12) BMMNC‐HDSW: 58 (11) Controls‐LDSW: 60 (10) Controls‐HDSW: 63 (10) | BMMNC‐LDSW: 77% BMMNC‐HDSW: 86% Controls‐LDSW: 80% Controls‐HDSW: 90% | 43 (22 LDSW, 21 HDSW) | 39 (20 LDSW, 19 HDSW) | 45.7 (17) months | |
| Belgium/ Serbia/ Switzerland | HF (LVEF 15% to 40%; ischaemic event > 2 months) | BM‐MSC: 55.3 (SE 10.4) Controls: 58.7 (SE 8.2) | BM‐MSC: 90.5% Controls: 86.7% | 32 | 15 | 24 months | |
| China | CIHD (isolated, chronic LAD; LVEF < 40%) | BM‐MSC: 59.3 (6.8) Controls: 57.8 (7.2) | BM‐MSC: 88% Controls: 92% | 24 | 24 | 12 months | |
| Germany | CIHD (chronic total occlusion; myocardial ischaemia) | CPC: 63 (7) Controls: 61 (9) | CPC: 71% Controls: 86% | 14 | 14 | 15 months | |
| UK | HF (NYHA class II‐IV; no revascularisation options) | BMMNC: n/r Controls: n/r | BMMNC: n/r Controls: n/r | 15 | 15 | 12 months | |
| UK | HF (NYHA class II‐IV; no revascularisation options) | BMMNC: n/r Controls: n/r | BMMNC: n/r Controls: n/r | 15 | 15 | 12 months | |
| USA | CIHD (chronic MI; LV dysfunction) | BMMNC: 61.1 (8.4) Controls: 61.3 (9.0) | BMMNC: 89.5% Controls: 100% | 22 | 10 | 12 months | |
| USA | CIHD (chronic MI; LV dysfunction) | BM‐MSC: 57.1 (10.6) Controls: 60.0 (12.0) | BM‐MSC: 94.7% Controls: 90.9% | 22 | 11 | 12 months | |
| Belgium | CIHD (transmural MI; LV dysfunction; elective CABG) | BMMNC: 63.2 (8.5) Controls: 66.8 (9.2) | BMMNC: 100% Controls: 70% | 11 | 12 | 4 months | |
| Germany | CIHD (MI > 3 months; LV regional wall motion abnormality) | CPC: 53.4 (12.3) Controls: 58.8 (7.3) | CPC: 82% Controls: 100% | 23 | 10 | 60 months | |
| China | HF (MI > 3 months; LVEF < 30%; elective CABG) | BMMNC: 56.6 (9.7) Controls: 58.3 (8.9) | BMMNC: 88% Controls: 96% | 31 | 29 | 12 months | |
| Spain | Refractory angina (CCS class II‐IV) | CD133+: median 70.0 Controls: median 58.2 | CD133+: 78.9% Controls: 100% | 19 | 9 | 6 months | |
| USA | Refractory angina (CCS class III‐IV) | CD34+/controls pooled: 62.4 (range 48 to 84) | CD34+/controls pooled: 80% | 18 (6 LD, 6 MD 6, HD) | 6 | 6 months | |
| USA | Refractory angina (CCS class III‐IV) | CD34+/LD: 61.3 (9.1) CD34+/HD: 59.8 (9.2) Controls: 61.8 (8.5) | CD34+/LD: 83.6% CD34+/HD: 87.5% Controls: 89.3% | 112 (56 LD, 56 HD) | 56 | 12 months | |
| Denmark | HF (NYHA class II‐III; LVEF < 45%; no revascularisation options) | BM‐MSC: 66.1 (7.7) Controls: 64.2 (10.6) | BM‐MSC: 90% Controls: 70% | 40 | 20 | 6 months | |
| UK | HF (NYHA class II‐IV; no revascularisation options) | BMMNC/controls pooled (16 participants): 70 (10) | BMMNC/controls pooled (16 participants): 94% | 14 | 2 | 6 months | |
| UK | HF (NYHA class II‐IV; no revascularisation options) | BMMNC/controls pooled (18 participants): 64 (9) | BMMNC/controls pooled (18 participants): 100% | 10 | 8 | 6 months | |
| Germany | HF (LVEF < 35%; elective CABG) | CD133+: 61.9 (7.3) Controls: 62.7 (10.6) | CD133+: 93% Controls: 97% | 30 | 30 | 6 months | |
| Argentina | HF (LVEF < 35%; NYHA class III‐IV; elective CABG) | CD34+: 64.8 (7.1) Controls: 63.6 (5.2) | CD34+: 80% Controls: 80% | 25 | 25 | 10 years | |
| USA/Germany/India | HF (LVEF < 40%; NYHA class III‐IV) | BMAC: 58.5 (12.7) Controls: 52.7 (8.5) | BMAC: 91.7% Controls: 100% | 24 | 6 | 12 months | |
| Finland | HF (LVEF 15% to 40%; NYHA class II‐IV; elective CABG) | BMMNC: median 65 (range 57 to 73) Controls: median 64 (range 58 to 70) | BMMNC: 94.7% Controls: 95.0% | 20 | 19 | 12 months | |
| USA | HF (angina/HF symptoms; chronic CAD; LVEF < 40%; no revascularisation options) | BMMNC: 56.3 (8.6) Controls: 60.5 (6.4) | BMMNC: 50% Controls: 80% | 20 | 10 | 6 months | |
| USA | HF (CCS class II‐IV or NYHA class II‐III, or both; LVEF < 45%; no revascularisation options) | BMMNC: 64.0 (10.9) Controls: 62.3 (8.3) | BMMNC: 86.9% Controls: 93.7% | 61 | 31 | 6 months | |
| USA | HF (CCS class II‐IV or NYHA class II‐III, or both; LVEF < 45%; no revascularisation options) | ALDH+: 58.2 (6.1) Controls: 57.8 (5.5) | ALDH+: 90% Controls: 80% | 10 | 10 | 6 months | |
| Russia | HF (LVEF < 35%; no revascularisation options) | BMMNC: 61 (9) Controls: 62 (5) | BMMNC: 87% Controls: 85% | 55 | 54 | 12 months | |
| Indonesia/China | HF (NYHA class III‐IV; LVEF < 40%; no revascularisation options) | BMMNC: 58 (5.9) Controls: 60 (5.6) | BMMNC: 95% Controls: 100% | 19 | 9 | 6 months | |
| Serbia | CIHD (MI < 30 days; LVEF < 40%; NYHA class III‐IV; elective CABG) | BMMNC: 53.8 (10.1) Controls: 60.0 (6.8) | BMMNC: 93.3% Controls: 93.3% | 15 | 15 | Median 5 years (IQR 2.5 to 7.5) | |
| China/Australia | Refractory angina (CCS class III‐IV) | BMMNC: 65.2 (8.3) Controls: 68.9 (6.3) | BMMNC: 79% Controls: 88% | 19 | 9 | 6 months | |
| Germany | CIHD (MI > 3 months; LV dysfunction) | BMMNC: 62 (10) Controls: 60 (9) | BMMNC: 52.6% Controls: 55.6% | 38 | 18 | 12 months | |
| The Netherlands | Refractory angina (CCS class II‐IV) | BMMNC: 64 (8) Controls: 62 (9) | BMMNC: 92% Controls: 80% | 25 | 25 | 6 months | |
| China | Refractory angina (MI > 1 month) | CD34+: 60.6 (n/r) Controls: 60.0 (n/r) | CD34+: 56.3% Controls: 63.3% | 16 | 16 | 6 months | |
| China | Refractory angina (CCS class III‐IV) | CD34+: range 42 to 80 Controls: range 43 to 80 | CD34+: 51.8% Controls: 50.0% | 56 | 56 | 6 months | |
| China | CIHD (LVEF < 35%) | CD133+: n/r Controls: n/r | CD133+: n/r Controls: n/r | 35 | 35 | 6 months | |
| China | CIHD (multivessel disease; MI > 4 weeks; elective CABG) | BMMNC: 61.4 (7.5) Controls: 62.9 (6.9) | BMMNC: 82% Controls: 78% | 45 | 45 | 6 months | |
| China | CIHD (MI > 6 months) | BMMNC: 54.8 (11.5) Controls: 56.3 (7.9) | BMMNC: 96% Controls: 96% | 24 | 23 | 6 months | |
| China | HF (LVEF < 40%; elective CABG) | BMMNC: 60.3 (10.4) Controls: 59.1 (15.7) | BMMNC: 83.3% Controls: 83.3% | 18 | 18 | 6 months | |
| ALDH: aldehyde dehydrogenase | |||||||
| Study ID | Co‐intervention | Intervention given by: | Route of cell administration | Intervention cell type | How are cells obtained? | What were they resuspended in? | Dose administered? | Comparator arm (placebo or control) |
| CABG | Cardiothoracic surgeon | IC or IM | BMMNC | BM aspiration (**) | Autologous serum | IM: 84 (56) million cells IC: 115 (73) million cells | No additional therapy (control) | |
| Standard medical therapy | Cardiologist | IC | BMMNC or CPC | BM aspiration (**) for BMMNC. Vein puncture, mononuclear cell isolation by gradient centrifugation and culture for 3 days for CPC | n/r | BMMNC: 205 (110) million cells CPC: 22 (11) million cells | No additional therapy (control) | |
| Shockwave | Cardiologist | IC | BMMNC | BM aspiration (**) | X‐VIVO 10 medium and autologous serum | HDSW: 123 (69) million cells LDSW: 150 (77) million cells | Placebo (10 mL X‐VIVO 10 medium and autologous serum) | |
| Standard medical therapy | Cardiologist | IC | BM‐MSC (cardiopoietic cells) | BM aspiration (**), culture for 6 days and exposure to cardiopoietic factors | Preservation solution (no details) | 733 (range 605 to 1168) million cells | No additional therapy (control) | |
| Standard medical therapy | Cardiologist | IC | BM‐MSC | BM aspiration (**), culture for 7 days to select MSC | Heparinised saline | 5 million cells | No additional therapy (control) | |
| G‐CSF | Cardiologist | IC | CPC | G‐CSF infusion for 4 days prior to vein puncture, mononuclear cell isolation by gradient centrifugation and culture for 3 days for CPC | Saline and 10% autologous serum | 69 (14) million cells | Placebo (cell‐free serum solution) | |
| G‐CSF | Cardiologist | IC | BMMNC | G‐CSF infusion for 5 days and BM aspiration (**) | Autologous serum | n/r | Placebo (10 mL autologous serum) | |
| G‐CSF | Cardiologist | IM | BMMNC | G‐CSF infusion for 5 days and BM aspiration (**) | Autologous serum | n/r | Placebo (2 mL autologous serum) | |
| Standard medical therapy | Cardiologist | IM | BMMNC | BM aspiration (**) | n/r | n/r | Placebo (vehicle medium) | |
| Standard medical therapy | Cardiologist | IM | BM‐MSC | BM aspiration (**), culture to select MSC | n/r | n/r | Placebo (vehicle medium) | |
| CABG | Cardiothoracic surgeon | IM | BMMNC | BM aspiration (**) | Heparinised saline | 60 (31) million cells | Placebo (heparinised saline) | |
| G‐CSF | Cardiologist | IC | CPC | G‐CSF infusion for 5 days prior to vein puncture, mononuclear cell isolation by gradient centrifugation and culture for 4 days for CPC | n/r | 29 (12) million cells | No additional therapy (control) | |
| CABG | Cardiothoracic surgeon | IC | BMMNC | BM aspiration (**) | Saline solution and 20% autologous serum | 132 (107) million cells | Placebo (8 mL saline; 2 mL autologous serum) | |
| G‐CSF | Cardiologist | IM | CD133+ | G‐CSF infusion for 5 days prior to leukapheresis, mononuclear cell isolation by gradient centrifugation immunomagnetic selection to isolate CD133+ cells | Normal saline solution | 20 to 30 million cells | No additional therapy (control) | |
| G‐CSF | Cardiologist | IM | CD34+ | G‐CSF infusion for 5 days prior to leukapheresis, mononuclear cell isolation by gradient centrifugation immunomagnetic selection to isolate CD34+ cells | Saline solution and 5% autologous serum | LD: 0.05 million cells MD: 0.1 million cells HD: 0.5 million cells | Placebo (0.9% sodium chloride; 5% autologous plasma) | |
| G‐CSF | Cardiologist | IM | CD34+ | G‐CSF infusion for 5 days prior to leukapheresis, mononuclear cell isolation by gradient centrifugation immunomagnetic selection to isolate CD34+ cells | Saline solution and 5% autologous serum | LD: 0.1 million cells HD: 0.5 million cells | Placebo (0.9% sodium chloride; 5% autologous plasma) | |
| Standard medical therapy | Cardiologist | IM | BM‐MSC | BM aspiration (**), culture for 14 to 35 days to select MSC | Phosphate buffered saline with a drop of the participant’s blood | 77.5 (68) million cells | Placebo (phosphate buffered saline mixed with drop of participant’s blood) | |
| G‐CSF | Cardiologist | IC | BMMNC | G‐CSF infusion for 5 days and BM aspiration (**) | Autologous serum | 86 (110) million cells | Placebo (10 mL autologous serum) | |
| G‐CSF | Cardiologist | IM | BMMNC | G‐CSF infusion for 5 days and BM aspiration (**) | Autologous serum | 52 (53) million cells | Placebo (2 mL autologous serum) | |
| CABG | Cardiothoracic surgeon | IM | CD133+ | BM aspiration (**), immunomagnetic selection to isolate CD133+ cells | Sodium chloride and 10% autologous serum | Median 5.1 million cells | Placebo (isotonic saline solution; 10% autologous serum) | |
| CABG | Cardiothoracic surgeon | IM | CD34+ | BM aspiration (**), immunomagnetic selection to isolate CD34+ cells | Heparinised saline and autologous serum | Median 22 million cells | No additional therapy (control) | |
| Standard medical therapy | Cardiologist | IC | BMAC | BM aspiration (**) and concentration | Autologous serum | 3700 (900) million cells | No additional therapy (control) | |
| CABG | Cardiothoracic surgeon | IM | BMMNC | BM aspiration (**) | Medium 199 containing albumin, heparin | Median 840 (range 52 to 135) million cells | Placebo (vehicle medium) | |
| Standard medical therapy | Cardiologist | IM | BMMNC | BM aspiration (**) | Saline containing 5% human serum albumin | 2 million cells | No additional therapy (control) | |
| Standard medical therapy | Cardiologist | IM | BMMNC | BM aspiration (**) | Saline containing 5% human serum albumin | 100 million cells | Placebo (cell‐free suspension in same volume) | |
| Standard medical therapy | Cardiologist | IM | ALDH+ | BM aspiration (**) and cell sorting | Pharmaceutical grade human serum albumin | 2.4 (1.3) million cells | Placebo (5% pharmaceutical serum albumin) | |
| Standard medical therapy | Cardiologist | IM | BMMNC | BM aspiration (**) | Heparinised saline | 41 (16) million cells | No additional therapy (control) | |
| Standard medical therapy | Cardiologist | IM | BMMNC | BM aspiration (**) | Phosphate buffered saline with 10% autologous plasma | n/r | Placebo (phosphate buffered saline; 10% autologous plasma) | |
| CABG | Cardiothoracic surgeon | IM | BMMNC | BM aspiration (**) | n/r | 70.7 (32.4) million cells | No additional therapy (control) | |
| Standard medical therapy | Cardiologist | IM | BMMNC | BM aspiration (**) | Phosphate buffered saline with 10% autologous plasma | 15 million cells | Placebo (8 ‐ 12 x 0.1 mL phosphate buffered saline with 10% autologous serum) | |
| Standard medical therapy | Cardiologist | IC | BMMNC | BM aspiration (**) | n/r | 99 (25) million cells | No additional therapy (control) | |
| Standard medical therapy | Cardiologist | IM | BMMNC | BM aspiration (**) | Phosphate buffered saline with 0.5% human serum albumin | 98 (6) million cells | Placebo (0.9% sodium chloride; 0.5% human serum albumin) | |
| Standard medical therapy | Cardiologist | IC | CD34+ | BM aspiration (**), immunomagnetic selection to isolate CD34+ cells | Normal saline | Range 1.0 to 6.1 million cells | No additional therapy (control) | |
| Standard medical therapy | Cardiologist | IC | CD34+ | BM aspiration (**), immunomagnetic selection to isolate CD34+ cells | Saline and human serum albumin | 56 (23) million cells | Placebo (saline; human serum albumin) | |
| Standard medical therapy | Cardiologist | IM | CD133+ | n/r | n/r | n/r | Placebo (n/r) | |
| CABG | Cardiothoracic surgeon | IM | BMMNC | BM aspiration (**) | Heparinised saline | 521 (44) million cells | Placebo (saline solution) | |
| Standard medical therapy | Cardiologist | IC | BMMNC | BM aspiration (**) | Heparinised saline | 72 million cells | Placebo (0.9% sodium chloride containing heparin) | |
| CABG | Cardiothoracic surgeon | IM | BMMNC | BM aspiration (**) | Heparinised saline | 659 (512) million cells | Placebo (saline) | |
| **BM aspiration ‐ bone marrow aspiration and isolation of bone marrow mononuclear cells by gradient centrifugation. ALDH: aldehyde dehydrogenase | ||||||||
| Study ID | Primary outcomes | Secondary outcomes | ||||||||||||||||||||
| All‐cause mortality | Non‐fatal MI | Hospital readmission for HF | Composite MACEa | Arrhythmias | NYHA class | CCS class | Angina frequency | Exercise tolerance | Quality of life | LVEFb | ||||||||||||
| ST | LT | ST | LT | ST | LT | ST | LT | ST | LT | ST | LT | ST | LT | ST | LT | ST | LT | ST | LT | ST | LT | |
| FR | NR | PR* | NR | NR | NR | NR | NR | PR* | NR | PR | NR | PR | NR | NR | NR | NR | NR | NR | NR | FR | NR | |
| FR | NR | FR | NR | FR | NR | FR | NR | FR | NR | FR | NR | NR | NR | NR | NR | NR | NR | NR | NR | FR | NR | |
| FR | FR | NR | FR | FR | FR | NR | FR | NR | FR | FR | NR | NR | NR | NR | NR | NR | NR | NR | NR | FR | NR | |
| PR* | FR | NR | NR | NR | FR | NR | NR | PR | PR | PR | NR | NR | NR | NR | NR | FR | NR | PR | NR | FR | NR | |
| NR | FR | NR | NR | NR | NR | NR | NR | PR* | NR | FR | FR | NR | NR | NR | NR | FR | FR | NR | NR | FR | FR | |
| PR* | FR | NR | NR | NR | NR | NR | NR | NR | NR | NR | NR | NR | NR | NR | NR | FR | FR | NR | NR | FR | FR | |
| PR* | PR* | PR* | FR | PR* | PR* | PR* | FR | FR | FR | FR | FR | FR | FR | NR | NR | NR | NR | NR | NR | PR | PR | |
| PR* | PR* | PR* | PR* | FR | FR | FR | FR | FR | FR | FR | FR | FR | FR | NR | NR | NR | NR | NR | NR | PR | PR | |
| PR* | PR* | NR | PR* | NR | FR | PR* | FR | NR | NR | NR | PR | NR | NR | NR | NR | FR | FR | FR | FR | NR | PR | |
| PR* | FR | NR | PR* | NR | PR* | PR* | FR | NR | NR | NR | PR | NR | NR | NR | NR | FR | FR | FR | FR | NR | PR | |
| FR | NR | NR | NR | NR | NR | NR | NR | NR | NR | NR | NR | NR | NR | NR | NR | NR | NR | NR | NR | FR | NR | |
| PR* | FR | FR | FR | PR* | FR | NR | NR | NR | NR | FR | FR | NR | NR | NR | NR | FR | FR | NR | NR | FR | FR | |
| FR | FR | PR* | NR | NR | NR | FR | NR | PR* | FR | NR | NR | NR | NR | NR | NR | FR | NR | NR | NR | FR | FR | |
| FR | NR | PR* | NR | NR | NR | PR | NR | FR | NR | NR | NR | PR | NR | PR | NR | PR | NR | PR | NR | PR | NR | |
| PR* | PR* | PR* | PR* | NR | NR | NR | NR | FR | FR | NR | NR | FR | NR | FR | NR | FR | NR | PR | NR | NR | NR | |
| FR | FR | NR | FR | NR | FR | NR | PR | NR | NR | NR | NR | PR | PR | FR | NR | FR | FR | FR | FR | NR | NR | |
| FR | NR | PR* | NR | FR | NR | NR | NR | FR | NR | PR | NR | PR | NR | PR | NR | PR | NR | PR | NR | FR | NR | |
| FR | NR | PR* | NR | FR | NR | FR | NR | PR* | NR | FR | NR | FR | NR | NR | NR | NR | NR | NR | NR | NR | NR | |
| FR | NR | PR* | NR | PR* | NR | FR | NR | FR | NR | FR | NR | FR | NR | NR | NR | NR | NR | NR | NR | NR | NR | |
| FR | FR | NR | NR | NR | NR | NR | NR | NR | NR | FR | NR | FR | NR | NR | NR | PR | NR | PR | NR | FR | NR | |
| PR* | FR | NR | NR | NR | NR | NR | NR | PR* | NR | FR | NR | NR | NR | NR | NR | NR | NR | NR | NR | PR | PR | |
| NR | FR | NR | NR | NR | FR | NR | NR | NR | PR* | NR | FR | NR | PR | NR | NR | NR | NR | NR | PR | PR | PR | |
| NR | PR* | NR | PR* | NR | FR | NR | NR | NR | NR | NR | FR | NR | NR | NR | NR | NR | NR | NR | PR | NR | FR | |
| PR* | NR | PR* | NR | NR | NR | NR | NR | PR* | NR | FR | NR | FR | NR | NR | NR | NR | NR | FR | NR | FR | NR | |
| FR | NR | FR | NR | FR | NR | NR | NR | NR | NR | FR | NR | FR | NR | NR | NR | FR | NR | NR | NR | FR | NR | |
| PR* | NR | FR | NR | NR | NR | NR | NR | FR | NR | FR | NR | FR | NR | NR | NR | NR | NR | NR | NR | FR | NR | |
| FR | FR | NR | NR | NR | NR | NR | NR | PR* | PR* | FR | FR | FR | FR | FR | FR | FR | FR | FR | FR | FR | FR | |
| PR* | FR | NR | NR | NR | NR | NR | NR | FR | NR | PR | NR | NR | NR | NR | NR | PR | NR | NR | NR | FR | NR | |
| NR | FR | NR | NR | NR | NR | NR | NR | NR | NR | FR | FR | NR | NR | NR | NR | FR | FR | NR | NR | FR | FR | |
| PR* | FR | FR | NR | NR | NR | NR | NR | PR* | NR | FR | NR | FR | NR | NR | NR | FR | NR | NR | NR | FR | NR | |
| PR* | PR* | NR | NR | NR | NR | NR | NR | NR | NR | FR | FR | NR | NR | NR | NR | NR | NR | NR | NR | FR | FR | |
| FR | NR | PR* | NR | NR | NR | NR | NR | PR* | NR | NR | NR | FR | NR | NR | NR | FR | NR | FR | NR | FR | FR | |
| PR* | NR | PR* | NR | NR | NR | NR | NR | PR* | NR | NR | NR | FR | NR | FR | NR | FR | NR | NR | NR | NR | NR | |
| PR* | NR | PR* | NR | NR | NR | NR | NR | FR | NR | NR | NR | FR | NR | FR | NR | FR | NR | NR | NR | NR | NR | |
| NR | NR | NR | NR | NR | NR | NR | NR | NR | NR | PR | NR | NR | NR | NR | NR | PR | NR | NR | NR | FR | NR | |
| PR* | NR | NR | NR | NR | NR | NR | NR | PR | NR | NR | NR | NR | NR | NR | NR | NR | NR | NR | NR | FR | NR | |
| PR* | NR | FR | NR | FR | NR | NR | NR | PR* | NR | NR | NR | NR | NR | NR | NR | NR | NR | NR | NR | PR | NR | |
| FR | NR | PR* | NR | NR | NR | NR | NR | FR | NR | FR | NR | FR | NR | NR | NR | NR | NR | NR | NR | FR | NR | |
| Total (%) analysedc | 1637 (85.8) | 1010 (53.0) | 881 (46.2) | 461 (24.2) | 482 (25.3) | 495 (26.0) | 288 (15.1) | 201 (10.5) | 959 (50.3) | 363 (19.0) | 741 (38.9) | 346 (18.1) | 608 (31.9) | 142 (7.4) | 428 (22.4) | 82 (4.3)d | 535 (28.1) | 227 (11.9) | 197 (10.3)e | 151 (7.9)e | 439 (23.0)f | 110 (5.8)f |
| CCS: Canadian Cardiovascular Society; FR: full reporting, outcome included in analysis; HF: heart failure; LT: long‐term follow‐up (≥ 12 months); LVEF: left ventricular ejection fraction; MACE: major adverse clinical events; MI: myocardial infarction; NR: outcome not reported; NYHA: New York Heart Association; PR: partial reporting with insufficient information on outcome reported for inclusion in analysis; PR*: no incidence of outcome observed; ST: short‐term follow‐up (< 12 months) aComposite measure of mortality, reinfarction, or rehospitalisation for heart failure. | ||||||||||||||||||||||
| Study ID | Number of analysed participants | All‐cause mortality events | Non‐fatal MI events | Hospital readmission for HF | Composite MACEa | Arrhythmia events | |||||||||||
| Cells | No cells | Cells | No cells | Length of follow‐up | Cells | No cells | Length of follow‐up | Cells | No cells | Length of follow‐up | Cells | No cells | Length of follow‐up | Cells | No cells | Length of follow‐up | |
| 42 | 19 | 1 | 1 | 6 mthsa | 0 | 0 | 6 mths | n/r | n/r | n/r | n/r | n/r | n/r | 0 | 0 | 6 mths | |
| 52 | 23 | 0 | 1 | 3 mths | 1 | 0 | 3 mths | 1 | 1 | 3 mths | 1 | 1 | 3 mths | 0 | 1 | 3 mths | |
| 43 | 39 | 6 | 8 | 45.7 (17) mths | 1 | 4 | 45.7 (17) mths | 8 | 13 | 45.7 (17) mths | 14 | 19 | 45.7 (17) mths | 6 | 13 | 45.7 (17) mths | |
| 21 | 15 | 1 | 2 | 24 mths | n/r | n/r | n/r | 6 | 4 | 24 mths | n/r | n/r | n/r | n/r | n/r | n/r | |
| 22 | 23 | 2 | 4 | 12 mths | n/r | n/r | n/r | n/r | n/r | n/r | n/r | n/r | n/r | 0 | 0 | 6 mths | |
| 13 | 12 | 0 | 1 | 15 mths | n/r | n/r | n/r | n/r | n/r | n/r | n/r | n/r | n/r | n/r | n/r | n/r | |
| 15 | 15 | 0 | 0 | 12 mths | 1 | 0 | 12 mths | 0 | 0 | 12 mths | 1 | 0 | 12 mths | 1 | 1 | 12 mths | |
| 15 | 15 | 0 | 0 | 12 mths | 0 | 0 | 12 mths | 1 | 1 | 12 mths | 1 | 1 | 12 mths | 0 | 1 | 12 mths | |
| 19 | 10 | 0 | 0 | 12 mths | 0 | 0 | 12 mths | 0 | 1 | 12 mths | 0 | 1 | 12 mths | n/r | n/r | n/r | |
| 19 | 11 | 1 | 1 | 12 mths | 0 | 0 | 12 mths | 0 | 0 | 12 mths | 1 | 1 | 12 mths | n/r | n/r | n/r | |
| 11 | 12 | 1 | 1 | 4 mths | n/r | n/r | n/r | n/r | n/r | n/r | n/r | n/r | n/r | n/r | n/r | n/r | |
| 23 | 9 | 0 | 1 | 60 mths | 1 | 2 | 60 mths | 0 | 2 | 60 mths | n/r | n/r | n/r | n/r | n/r | n/r | |
| 31 | 29 | 1 | 2 | 12 mths | 0 | 0 | 6 mths | n/r | n/r | n/r | 3 | 4 | 6 mths | 1 | 0 | 12 mths | |
| 19 | 9 | 1 | 1 | 6 mths | 0 | 0 | 6 mths | n/r | n/r | n/r | n/r | n/r | n/r | 1 | 1 | 6 mths | |
| 18 | 6 | 0 | 0 | 12 mths | 0 | 0 | 12 mths | n/r | n/r | n/r | n/r | n/r | n/r | 0 | 1 | 12 mths | |
| 112 | 56 | 0 | 3 | 12 mths | 6 | 7 | 12 mths | 3 | 4 | 12 mths | n/r | n/r | n/r | n/r | n/r | n/r | |
| 40 | 20 | 1 | 1 | 6 mths | 0 | 0 | 6 mths | 6 | 2 | 6 mths | n/r | n/r | n/r | 3 | 1 | 6 mths | |
| 14 | 2 | 0 | 1 | 6 mths | 0 | 0 | 6 mths | 1 | 0 | 6 mths | 1 | 1 | 6 mths | 0 | 0 | 6 mths | |
| 10 | 8 | 0 | 3 | 6 mths | 0 | 0 | 6 mths | 0 | 0 | 6 mths | 0 | 3 | 6 mths | 2 | 2 | 6 mths | |
| 30 | 30 | 1 | 3 | 34 mthsb | n/r | n/r | n/r | n/r | n/r | n/r | n/r | n/r | n/r | n/r | n/r | n/r | |
| 25 | 25 | 3 | 10 | 10 yrs | n/r | n/r | n/r | n/r | n/r | n/r | n/r | n/r | n/r | 0 | 0 | 6 mths | |
| 22 | 6 | 5 | 2 | 12 mths | n/r | n/r | n/r | 2 | 0 | 12 mths | n/r | n/r | n/r | 0 | 0 | 12 mths | |
| 13c | 17c | 0 | 0 | Median 60 mths | 0 | 0 | Median 60 mths | 1 | 1 | Median 60 mths | n/r | n/r | n/r | n/r | n/r | n/r | |
| 20 | 10 | 0 | 0 | 6 mths | 0 | 0 | 6 mths | n/r | n/r | n/r | n/r | n/r | n/r | 0 | 0 | 6 mths | |
| 61 | 31 | 1 | 0 | 6 mths | 1 | 0 | 6 mths | 3 | 5 | 6 mths | n/r | n/r | n/r | n/r | n/r | n/r | |
| 10 | 10 | 0 | 0 | 6 mths | 1 | 0 | 6 mths | n/r | n/r | n/r | n/r | n/r | n/r | 3 | 2 | 6 mths | |
| 55 | 54 | 6 | 21 | 12 mths | n/r | n/r | n/r | n/r | n/r | n/r | n/r | n/r | n/r | 0 | 0 | 12 mths | |
| 19 | 9 | 0 | 2 | 23 (8) mths | n/r | n/r | n/r | n/r | n/r | n/r | n/r | n/r | n/r | 1 | 1 | 6 mths | |
| 15 | 15 | 2 | 4 | Median 5 yrs | n/r | n/r | n/r | n/r | n/r | n/r | n/r | n/r | n/r | n/r | n/r | n/r | |
| 19 | 9 | 0 | 1 | 19 (9) mths | 0 | 1 | 3 mths | n/r | n/r | n/r | n/r | n/r | n/r | 0 | 0 | 6 mths | |
| 38 | 18 | 0 | 0 | 12 mths | n/r | n/r | n/r | n/r | n/r | n/r | n/r | n/r | n/r | n/r | n/r | n/r | |
| 25 | 25 | 1 | 0 | 6 mths | 0 | 0 | 6 mths | n/r | n/r | n/r | n/r | n/r | n/r | 0 | 0 | 6 mths | |
| 16 | 16 | 0 | 0 | 6 mths | 0 | 0 | 6 mths | n/r | n/r | n/r | n/r | n/r | n/r | 0 | 0 | 6 mths | |
| 56 | 56 | 0 | 0 | 6 mths | 0 | 0 | 6 mths | n/r | n/r | n/r | n/r | n/r | n/r | 0 | 1 | 6 mthsd | |
| n/r | n/r | n/r | n/r | n/r | n/r | n/r | n/r | n/r | n/r | n/r | n/r | n/r | n/r | n/r | n/r | n/r | |
| 45 | 45 | 0 | 0 | 6 mths | n/r | n/r | n/r | n/r | n/r | n/r | n/r | n/r | n/r | n/r | n/r | n/r | |
| 24 | 23 | 0 | 0 | 6 mths | 0 | 1 | 6 mths | 1 | 2 | 6 mths | n/r | n/r | n/r | 0 | 0 | 6 mths | |
| 18 | 18 | 2 | 0 | 6 mths | 0 | 0 | 6 mths | n/r | n/r | n/r | n/r | n/r | n/r | 1 | 0 | 6 mths | |
| HF: heart failure; MACE: major adverse clinical events; MI: myocardial infarction; n/r: not reported aAng 2008: participants followed up for six months; mortality reported as “death within 30 days of treatment”. | |||||||||||||||||
| Study ID | Periprocedural adverse events |
| 2 deaths (1 control, 1 intracoronary cell therapy) occurred within 30 days of treatment. Reasons were not given, but neither was considered to be related to cell therapy. | |
| In‐hospital events: MI occurred in 1 CPC participant and ventricular arrhythmia detected during monitoring in 1 control participant. | |
| n/r (only safety of shockwave procedure reported) | |
| In the cell therapy group, 1 participant had ventricular tachycardia during procedure which was resolved by cardioversion, and 1 participant had blurred vision after intervention (participant had pre‐existing ophthalmic migraines). Other reported adverse events (gastrointestinal, hepatobiliary, respiratory, thoracic, mediastinal, and peripheral vascular disorders) were not considered to be related to cell therapy. | |
| 3 participants in cell therapy group experienced a transient episode of pulmonary oedema during the injection of stem cells. No sustained arrhythmias were monitored during the procedure. | |
| 1 cell therapy and 1 control participant reported headache, and 1 control participant developed fever during G‐CSF stimulation. G‐CSF resulted in comparable increases in serum C‐reactive protein levels and blood leukocyte count in both CPC and control groups (returned to baseline values within 4 days after G‐CSF). Neither G‐CSF injection nor intracoronary transplantation of CPC caused any elevation in troponin T levels. | |
| n/r | |
| n/r | |
| No participant had significant postprocedural pericardial effusion. Small transient increases in CK‐MB and serum troponin I were observed. There were no treatment emergent serious adverse events among any of participants who received cell therapy. | |
| No participant had significant postprocedural pericardial effusion. Small transient increases in CK‐MB and serum troponin I were observed. There were no treatment emergent serious adverse events among any of participants who received cell therapy. | |
| 1 cell therapy participant died on postoperative day 7 from a perforated oesophageal ulcer complicated by mediastinitis. 1 control participant died on the 5th postoperative day from multiorgan failure secondary to low cardiac output syndrome. | |
| Mild cephalgies and episodes of mild to moderate bone and muscular pain were reported during 5‐day course of G‐CSF. No participant developed chest pain episodes or clinical signs of decompensated HF. No novel ischaemia‐related ECG changes were observed during G‐CSF treatment and after intracoronary CPC infusion. Troponin T levels remained unchanged. Moreover, no specific G‐CSF‐mediated severe complications occurred. Intracoronary infusions were successfully performed without any procedural complications. | |
| 2 participants (unclear which treatment arm) had neurological complications but recovered and were discharged. No participants had arrhythmia. | |
| G‐CSF treatment was well tolerated, all participants presented bone pain as the only symptom. After cell injection, none of the participants had a significant rise in creatine phosphokinase, symptoms, ECG changes, or echocardiographic abnormalities. | |
| 13 participants reported transient increase in angina frequency after administration of G‐CSF. There were no cardiac enzyme elevations, MIs, acute coronary syndromes, or deaths. 1 participant in the placebo group developed ventricular tachycardia during the mapping procedure. No arrhythmias were detected by implantable cardioverter defibrillator, LifeVest, or Holter monitoring in any participant during or after the injection procedure. | |
| Administration of G‐CSF was associated with bone pain (20.1%), angina (17.4%), CHF (2 participants), and 8 participants had troponin elevations consistent with non‐STEMI. In 1 participant a thrombus was observed on the mapping catheter tip as it was removed. 2 participants experienced an apparent myocardial perforation during the injection procedure (1 resulted in haemothorax, which was successfully treated; 1 resulted in cardiac tamponade; this participant died after unsuccessful pericardiocentesis procedure). Elevated troponin levels were observed in 28% of participants at some point during the mobilisation and injection period, all of which were minor and subclinical except for those mentioned above. | |
| 1 participant with a history of episodic ventricular tachycardia developed ventricular tachycardia during the NOGA mapping procedure. Another participant experienced double vision and dizziness during the injection procedure; cerebral‐CT afterwards was normal, but the incident was diagnosed as a minor stroke by the neurologist. 1 participant from the treatment group suffered a stroke 12 days after treatment. | |
| The most common side effects from G‑CSF were bone pain (22%) and low grade pyrexia (65%) (reported in all G‐CSF groups combined). Bleeding from the arterial access site did not differ significantly between the 2 intervention arms. All episodes were minor and resolved with conservative treatment within 24 h of the procedure. As expected, there were increases in troponin and creatine kinase levels postprocedure in both arms. | |
| The most common side effects from G‑CSF were bone pain (22%) and low grade pyrexia (65%) (reported in all G‐CSF groups combined). There were 3 cases of arrhythmia during the intramyocardial procedure that required treatment. Of these, 1 participant developed atrial fibrillation, which reverted to sinus rhythm within 24 h of the procedure. Another participant developed transient complete heart block periprocedure requiring temporary pacing only. The final participant suffered an episode of pulseless ventricular tachycardia following intramyocardial injection, which was successfully cardioverted with a single 200 J external defibrillation and remained haemodynamically stable afterwards. 1 participant died from suspected acute LV failure 6 days after discharge. Bleeding from the arterial access site did not differ significantly between the two intervention arms. All episodes were minor and resolved with conservative treatment within 24 h of the procedure. As expected, there were increases in troponin and creatine kinase levels postprocedure in both arms. | |
| 2 participants in the placebo group died early postoperatively: 1 died on day 8 after developing Candida sepsis following LV failure despite intra‐aortic balloon pump and catecholamine treatment and mechanical assist device implantation, and 1 died on day 22 (reason not given). | |
| 1 participant in the OPCAB plus stem cell therapy group had a haematoma at the bone marrow harvest site. There were no other adverse events in either group (i.e. neurologic, haematologic, vascular, death, or infection events). No participants had any postoperative arrhythmias. | |
| 5 participants who received BMAC experienced “non‐serious adverse events possibly related to the procedure”. Procedure‐related complications included haematomas at the catheterisation site and elevated serum creatinine levels. | |
| There were no differences between treatment groups in participants’ haemodynamics, arterial blood gases, systemic vein oxygen level, blood glucose, acid–base balance, lactate, haemoglobin, body temperature, and diuresis, as well as medications needed. Perioperative measures are reported in detail in Lehtinen 2014. | |
| No perforations or arrhythmias were associated with cell injection procedures. Postprocedural transient left bundle‐branch block (resolved in 24 h) was seen in 1 treated and 1 control participant. 1 treated participant had non‐significant pericardial effusion. No sustained ventricular arrhythmias were observed by Holter monitoring in any participant. Transient fever but no sepsis occurred in 1 control participant. | |
| 1 participant experienced a limited retrograde catheter‐related dissection of the abdominal aorta (withdrawn from study). 1 participant experienced recurrent ventricular tachycardia with hypotension (and received only a small volume of cell product). | |
| No major adverse clinical cardiac events were associated with the cell injection procedures, including no perforations. Electromechanical mapping–related ventricular tachycardia occurred in 2 control participants, and ventricular fibrillation occurred in 1 control participant. No deaths occurred, and HF was not exacerbated in any participant. Holter monitoring showed no sustained ventricular arrhythmia in any participant. | |
| No periprocedural complications occurred in participants who received cell therapy. 2‐dimensional echocardiography did not reveal postprocedural pericardial effusion. Creatine kinase activity and peak troponin T level remained unaltered. No new periprocedural arrhythmias were recorded during 24 h of consecutive electrocardiographic monitoring. An implantable cardioverter defibrillator was implanted to 2 participants with ventricular tachycardia prior to cell injections. | |
| There were no acute procedural‐related complications, including stroke, transient ischaemic attack, ECG changes, sustained ventricular or atrial arrhythmias, and elevation of CPK‐MB. There was also no echocardiographic evidence of pericardial effusion in any participant within the first 24 h of the procedure. | |
| The early postoperative course was uneventful in both groups with no significant differences between them with regard to adverse side effects during hospital stay. There were no significant differences in cardiac‐specific enzymes activities after the operation or the number of atrial fibrillation episodes or appearance of pericardial effusion between the groups. | |
| There were no acute procedure‐related complications, including stroke, transient ischaemic attack, ECG changes, sustained ventricular or atrial arrhythmias, elevation of CPK‐MB, or echocardiographic evidence of pericardial effusion within the first 24 h after the procedure. | |
| There was no inflammatory response or myocardial reaction (white blood cell count, C‐reactive protein, CK, troponin) after cell therapy. There were no immediate pre‐ or postprocedure adverse complications, new electrocardiographic changes, or significant elevations in CK or troponin, and no inflammatory response was observed in participants with bone marrow cell transplant. | |
| In the placebo group, a greater than 0.5‐centimetre pericardial effusion was detected on 2‐dimensional echocardiography in an asymptomatic participant 2 days after the injection procedure, and pericardiocentesis was subsequently performed. | |
| No periprocedural adverse events; cardiac proteins in normal range. | |
| No increase in angina frequency or usage of sublingual NTG was observed in participants of either group. There were no cardiac enzyme elevations, MIs, acute coronary syndromes, or deaths. No participants from either group developed ventricular tachycardia during the cell or saline infusion procedure. No arrhythmias were detected by Holter monitoring in any participant during or after the infusion process. | |
| n/r | |
| Predischarge arrhythmias were reported (as number of events) in both cell therapy and control participants. | |
| Intracoronary application of BMC was performed without any acute or long‐term side effects. There was no inflammatory response or myocardial reaction (i.e. white blood cell count, C‐reactive protein, and creatinine phosphokinase) after cell therapy. | |
| In the perioperative period, sporadic ventricular premature beats and self terminating bouts of rapid atrial fibrillation were observed in both groups. However, 2 participants developed VF, and 1 died in the BMMNC group: 1 participant developed VF on the 5th day postoperatively but was successfully resuscitated and VF well‐controlled, and the other developed refractory VF 5 hours' postoperatively with death on postoperative day 3. There were no ventricular arrhythmias in the control group. | |
| AMI: acute myocardial infarction | |
| Study ID | No. analysed participants | Performance assessment | Mean follow‐up | No. analysed participants | Quality of life assessment | Mean follow‐up | ||||
| Cells | No cells | ST | LT | Cells | No cells | ST | LT | |||
| 21 | 21 | NYHA class (SR)a | 6 mths | n/r | ‐ | ‐ | ‐ | ‐ | ‐ | |
| 21 | 21 | CCS class (SR)b | 6 mths | n/r | ‐ | ‐ | ‐ | ‐ | ‐ | |
| 43 | 18 | NYHA class (EP) | 3 mths | n/r | ‐ | ‐ | ‐ | ‐ | ‐ | |
| 43 | 39 | NYHA class (EP/MC) | 4 mths | n/r | ‐ | ‐ | ‐ | ‐ | ‐ | |
| 21 | 15 | NYHA class (SR)c | 6 mths | n/r | 21 | 15 | MLHFQ (SR)c | 6 mths | n/r | |
| 21 | 15 | 6MWT (distance) (EP) | 6 mths | n/r | ‐ | ‐ | ‐ | ‐ | ‐ | |
| 22d | 23d | NYHA class (EP) | 6 mths | 12 mths | ‐ | ‐ | ‐ | ‐ | ‐ | |
| 22d | 23d | ETT (METs) (EP) | 6 mths | 12 mths | ‐ | ‐ | ‐ | ‐ | ‐ | |
| 12 | 10 | Bike test (max O2 update) (EP) | 3 mths | 15 mths | ‐ | ‐ | ‐ | ‐ | ‐ | |
| 15 | 15 | NYHA class (EP) | 6 mths | 12 mths | ‐ | ‐ | ‐ | ‐ | ‐ | |
| 15 | 15 | CCS class (EP) | 6 mths | 12 mths | ‐ | ‐ | ‐ | ‐ | ‐ | |
| 15 | 15 | NYHA class (EP) | 6 mths | 12 mths | ‐ | ‐ | ‐ | ‐ | ‐ | |
| 15 | 15 | CCS class (EP) | 6 mths | 12 mths | ‐ | ‐ | ‐ | ‐ | ‐ | |
| 17 | 16 | NYHA class (SR)e | n/r | 12 mths | 15 | 19 | MLHFQ (MC) | 6 mths | 12 mths | |
| 15f | 19f | 6MWT (distance) (MC) | 6 mths | 12 mths | ‐ | ‐ | ‐ | ‐ | ‐ | |
| 17 | 16 | NYHA class (SR)e | n/r | 12 mths | 19g | 19g | MLHFQ (MC) | 6 mths | 12 mths | |
| 18h | 19h | 6MWT (distance) (MC) | 6 mths | 12 mths | ‐ | ‐ | ‐ | ‐ | ‐ | |
| 21j | 10j | NYHA class (EP) | 3 mths | 60 mths | ‐ | ‐ | ‐ | ‐ | ‐ | |
| 12k | 5k | Bike test (sec) (EP) | 3 mths | 12 mths | ‐ | ‐ | ‐ | ‐ | ‐ | |
| 30 | 27 | 6MWT (distance) (EP/MC) | 6 mths | n/r | ‐ | ‐ | ‐ | ‐ | ‐ | |
| 19 | 9 | CCS class (median)m | 6 mths | n/r | n/r | n/r | SAQ (median)m | 6 mths | n/r | |
| 15 | 7 | ETT (time; METs) (median)m | 6 mths | n/r | 19 | 9 | Angina frequency (median)n | 6 mths | n/r | |
| 18 | 6 | CCS class (MC) | 6 mths | n/r | 18 | 6 | SAQ (SR)p | 6 mths | n/r | |
| 18 | 6 | ETT (time) (MC) | 6 mths | n/r | 17 | 6 | Angina frequency (EP/MC) | 6 mths | n/r | |
| 109q | 53q | CCS class (SR)r | 6 mths | 12 mths | 109q | 53q | SAQ (MC) | 6 mths | 12 mths | |
| 109q | 53q | ETT (time) (MC) | 6 mths | 12 mths | 109 | 53 | Angina frequency (EP) | 6 mths | n/r | |
| 40 | 40 | NYHA class (SR)s | 6 mths | n/r | 40 | 40 | KCCQ‐QOL (SR)s | 6 mths | n/r | |
| 40 | 40 | CCS class (SR)s | 6 mths | n/r | 40 | 40 | SAQ (SR)s | 6 mths | n/r | |
| 40 | 40 | 6MWT (SR)s | 6 mths | n/r | 40 | 40 | Angina frequency (SR)s | 6 mths | n/r | |
| 14 | 2 | NYHA class (EP) | 6 mths | n/r | ‐ | ‐ | ‐ | ‐ | ‐ | |
| 14 | 2 | CCS class (SR) | 6 mths | n/r | ‐ | ‐ | ‐ | ‐ | ‐ | |
| 10 | 8 | NYHA class (EP) | 6 mths | n/r | ‐ | ‐ | ‐ | ‐ | ‐ | |
| 10 | 8 | CCS class (SR) | 6 mths | n/r | ‐ | ‐ | ‐ | ‐ | ‐ | |
| 28 | 26 | NYHA class (EP/MC)t | 6 mths | n/r | 28 | 26 | MLHFQu | 6 mths | n/r | |
| 28 | 26 | 6MWTu | 6 mths | n/r | ‐ | ‐ | ‐ | ‐ | ‐ | |
| 28 | 26 | CCS class (EP/MC)t | 6 mths | n/r | ‐ | ‐ | ‐ | ‐ | ‐ | |
| 10 | 10 | NYHA class (EP/MC)t | 6 mths | n/r | ‐ | ‐ | ‐ | ‐ | ‐ | |
| 17 | 4 | NYHA class (EP)t | n/r | 12 mths | 17 | 4 | MLHFQ (SR) | n/r | 12 mths | |
| 17 | 4 | CCS class (SR) | n/r | 12 mths | ‐ | ‐ | ‐ | ‐ | ‐ | |
| 20 | 19 | NYHA class (EP/MC) | n/r | 12 mthsv | 20 | 19 | SF‐36w | n/r | 60 mths | |
| 20 | 10 | NYHA class (EP) | 6 mths | n/r | 17 | 9 | MLHFQ (EP) | 6 mths | n/r | |
| 20 | 10 | CCS class (EP/MC) | 6 mths | n/r | 13 | 10 | SF‐36 (physical/mental) (EP) | 6 mths | n/r | |
| 55 | 30 | NYHA class (MC) | 6 mths | n/r | ‐ | ‐ | ‐ | ‐ | ‐ | |
| 44 | 22 | CCS class (MC) | 6 mths | n/r | ‐ | ‐ | ‐ | ‐ | ‐ | |
| 51 | 29 | 6MWT (distance) (EP) | 6 mths | n/r | ‐ | ‐ | ‐ | ‐ | ‐ | |
| 10 | 10 | NYHA class (EP) | 6 mths | n/r | ‐ | ‐ | ‐ | ‐ | ‐ | |
| 10 | 10 | CCS class (EP) | 6 mths | n/r | ‐ | ‐ | ‐ | ‐ | ‐ | |
| 53x | 46x | NYHA class (EP) | 6 mths | 12 mths | 53x | 46x | MLHFQ (EP) | 6 mths | 12 mths | |
| 53x | 46x | CCS class (EP) | 6 mths | 12 mths | 53x | 46x | Angina frequency (EP) | 6 mths | 12 mths | |
| 53x | 46x | 6MWT (distance) (EP) | 6 mths | 12 mths | ‐ | ‐ | ‐ | ‐ | ‐ | |
| 19 | 9 | NYHA class (EP)y | 6 mths | n/r | ‐ | ‐ | ‐ | ‐ | ‐ | |
| 19 | 9 | 6MWT (distance) (EP)y | 6 mths | n/r | ‐ | ‐ | ‐ | ‐ | ‐ | |
| 15 | 15 | NYHA class (EP) | 6 mths | 12 mths | ‐ | ‐ | ‐ | ‐ | ‐ | |
| 15 | 15 | 6MWT (distance) (EP) | 6 mths | 12 mths | ‐ | ‐ | ‐ | ‐ | ‐ | |
| 19 | 9 | NYHA class (EP)t | 6 mths | n/r | ‐ | ‐ | ‐ | ‐ | ‐ | |
| 19 | 9 | CCS class (EP)t | 6 mths | n/r | ‐ | ‐ | ‐ | ‐ | ‐ | |
| 19 | 9 | Treadmill test (time; METs) (EP/MC) | 6 mths | n/r | ‐ | ‐ | ‐ | ‐ | ‐ | |
| 33 | 16 | NYHA class (EP) | 6 mths | 12 mths | ‐ | ‐ | ‐ | ‐ | ‐ | |
| 24 | 25 | CCS class (EP) | 6 mths | n/r | 24 | 25 | SAQ (EP/MC) | 6 mths | n/r | |
| 24 | 25 | Bike test (workload) (EP/MC) | 6 mths | n/r | ‐ | ‐ | ‐ | ‐ | ‐ | |
| 16 | 16 | CCS class (MC) | 6 mths | n/r | 16 | 16 | Angina frequency (MC) | 6 mths | n/r | |
| 16 | 16 | ETT (min) (MC) | 6 mths | n/r | ‐ | ‐ | ‐ | ‐ | ‐ | |
| 56 | 56 | CCS class (EP/MC) | 6 mths | n/r | 56 | 56 | Angina frequency (EP/MC) | 6 mths | n/r | |
| 56 | 56 | ETT (min) (EP/MC) | 6 mths | n/r | ‐ | ‐ | ‐ | ‐ | ‐ | |
| n/r | n/r | NYHA class (SR) | 6 mths | n/r | ‐ | ‐ | ‐ | ‐ | ‐ | |
| n/r | n/r | 5MWT (distance) (SR) | 6 mths | n/r | ‐ | ‐ | ‐ | ‐ | ‐ | |
| 16 | 18 | NYHA class (EP) | 6 mths | n/r | ‐ | ‐ | ‐ | ‐ | ‐ | |
| 16 | 18 | CCS class (EP) | 6 mths | n/r | ‐ | ‐ | ‐ | ‐ | ‐ | |
| CCS: Canadian Cardiovascular Society; EP: endpoint; ETT: exercise tolerance test; KCCQ‐QOL: Kansas City Cardiomyopathy Questionnaire – Quality of Life; LT: long term; MC: mean change from baseline; MET: metabolic equivalent test (mL/kg/min); MLHFQ: Minnesota Living with Heart Failure Questionnaire; n/r: not reported; NYHA: New York Heart Association; SAQ: Seattle Angina Questionnaire; SF‐36: 36‐Item Short Form Health Survey; SR: summary results; ST: short term; 5MWT: 5‐minute walk test; 6MWT: 6‐minute walk test aReported as number of participants in NYHA class III/IV. | ||||||||||
| Study ID | No. randomised participants | No. analysed participants | Baseline LVEF: Mean (SD) | Mean follow‐up of LVEF | ||||
| Cells | No cells | Cells | No cells | Cells | No cells | ST | LT | |
| Measured by MRI | ||||||||
| 42 | 21 | 18 | 7 | IM: 25.4 (8.1) IC: 28.5 (6.5) | 20.9 (8.9) | 6 mths | ‐ | |
| 43 | 39 | 15 | 12 | n/r | n/r | 4 mths | ‐ | |
| 14 | 14 | 12a | 11a | 51.0 (12.1) | 55.8 (12.4) | 3 mths | 15 mths | |
| 11 | 12 | 10 | 10 | 42.9 (10.3) | 39.5 (5.5) | 4 mths | ‐ | |
| 23 | 10 | 9 | 4 | 33.4 (SEM 12.7) | 23.3 (SEM 7.2) | 3 mths | 12 mths | |
| 31 | 29 | 31b | 28b | 23.5 (6.7) | 24.8 (5.2) | 6 mths | 12 mths | |
| 40 | 20 | 40 | 20 | 28.2 (9.3) | 25.1 (8.5) | 6 mths | ‐ | |
| 30 | 30 | 26 | 22 | 27 (6) | 26 (6) | 6 mths | ‐ | |
| 20 | 19 | 18 | 7 | 37.1 (9.5) | 38.5 (13.5) | ‐ | 60 mths | |
| 19 | 9 | 19 | 9 | 23.6 (8.4) | 26.8 (8.8) | 6 mths | ‐ | |
| 19 | 9 | 18 | 8 | 51.9 (8.5) | 45.7 (8.3) | 6 mths | ‐ | |
| 25 | 25 | 22 | 18 | 56 (12) | 54 (10) | 6 mths | ‐ | |
| 35 | 35 | 35 | 35 | 29 (7) | 28 (6) | 6 mths | ‐ | |
| Measured by echocardiography | ||||||||
| 32 | 15 | 21 | 15 | 27.5 (95% CI 25.5, 29.5) | 27.8 (95% CI 25.9, 29.8) | 6 mths | ‐ | |
| 31 | 29 | 24 | 18 | 36.0 (1.2) | 34.7 (1.4) | ‐ | 12 mths | |
| 20 | 10 | 20 | 10 | 37.0 (10.6) | 39.0 (9.1) | 6 mths | ‐ | |
| 61 | 31 | 54 | 28 | 34.7 (8.8) | 32.3 (8.6) | 6 mths | ‐ | |
| 10 | 10 | 10 | 10 | 36.1 (10.9) | 32.1 (10.6) | 6 mths | ‐ | |
| 55 | 54 | 53c | 46c | 27.8 (3.4) | 26.8 (3.8) | 6 mths | 12 mths | |
| 15 | 15 | 15 | 15 | 35.3 (3.9) | 36.5 (5.3) | 6 mths | 12 mths | |
| 25 | 25 | 24 | 25 | 50 (5) | 52 (5) | 6 mths | ‐ | |
| 45 | 45 | 45 | 45 | 39.3 (6.2) | 38.2 (8.0) | 6 mths | ‐ | |
| 18 | 18 | 16 | 18 | 35.8 (7.3) | 36.7 (9.2) | 6 mths | ‐ | |
| Measured by SPECT | ||||||||
| 24 | 24 | 22d | 23d | 26 (6) | 23 (8) | 6 mths | 12 mths | |
| 20 | 10 | 20 | 10 | 41.5 (11.2) | 43.0 (10.4) | 6 mths | ‐ | |
| 25 | 25 | 24 | 25 | 53 (12) | 54 (12) | 6 mths | 12 mths | |
| Measured by LV angiography | ||||||||
| 52 | 23 | 43 | 18 | BMMNC: 41 (11) CPC: 39 (10) | 43 (13) | 3 mths | ‐ | |
| 43 | 39 | 41 | 38 | LDSW: 37.2 (95% CI 31.7, 42.7) HDSW: 32.4 (95% CI 26.9, 37.9) | LDSW: 29.9 (95% CI 24.0, 35.7) HDSW: 32.3 (95% CI 26.5, 38.1) | 4 mths | ‐ | |
| 23 | 10 | 21 | 5 | 37.5 (SEM 12.9) | 37.6 (SEM 7.5) | 3 mths | ‐ | |
| 20 | 10 | 20 | 10 | 37.5 (8.2) | 40.0 (3.2) | 6 mths | ‐ | |
| 10 | 10 | 10 | 10 | 38.0 (17.5) | 41.9 (11.8) | 6 mths | ‐ | |
| 38 | 18 | 33 | 16 | 46 (10) | 46 (10) | 3 mths | 12 mths | |
| 95% CI: 95% confidence interval; BMMNC: bone marrow mononuclear cells; CPC: circulating progenitor cells; HDSW: high‐dose shockwave; IC: intracoronary; IM: intramyocardial; LDSW: low‐dose shockwave; LT: long term; LV: left ventricular; LVEF: left ventricular ejection fraction; SD: standard deviation; SEM: standard error of the mean; SPECT: single‐photon emission computed tomography; ST: short term a12/10 at 15 months. | ||||||||
| Outcome or subgroup title | No. of studies | No. of participants | Statistical method | Effect size |
| 1 Mortality (all‐cause) Show forest plot | 37 | Risk Ratio (M‐H, Random, 95% CI) | Subtotals only | |
| 1.1 Short term follow‐up (< 12 months) | 33 | 1637 | Risk Ratio (M‐H, Random, 95% CI) | 0.48 [0.26, 0.87] |
| 1.2 Long term follow‐up (≥ 12 months) | 21 | 1010 | Risk Ratio (M‐H, Random, 95% CI) | 0.38 [0.25, 0.58] |
| 2 Non‐fatal myocardial infarction Show forest plot | 25 | Risk Ratio (M‐H, Random, 95% CI) | Subtotals only | |
| 2.1 Short term follow‐up (< 12 months) | 20 | 881 | Risk Ratio (M‐H, Random, 95% CI) | 0.60 [0.17, 2.15] |
| 2.2 Long term follow‐up (≥ 12 months) | 9 | 461 | Risk Ratio (M‐H, Random, 95% CI) | 0.40 [0.17, 0.93] |
| 3 Rehospitalisation due to heart failure Show forest plot | 16 | Risk Ratio (M‐H, Random, 95% CI) | Subtotals only | |
| 3.1 Short term follow‐up (< 12 months) | 10 | 482 | Risk Ratio (M‐H, Random, 95% CI) | 0.63 [0.36, 1.12] |
| 3.2 Long term follow‐up (≥ 12 months) | 10 | 495 | Risk Ratio (M‐H, Random, 95% CI) | 0.62 [0.36, 1.04] |
| 4 Arrhythmias Show forest plot | 24 | Risk Ratio (M‐H, Random, 95% CI) | Subtotals only | |
| 4.1 Short term follow‐up (< 12 months) | 22 | 959 | Risk Ratio (M‐H, Random, 95% CI) | 0.70 [0.33, 1.45] |
| 4.2 Long term follow‐up (≥ 12 months) | 7 | 363 | Risk Ratio (M‐H, Random, 95% CI) | 0.46 [0.22, 0.97] |
| 5 Composite MACE Show forest plot | 9 | Risk Ratio (M‐H, Random, 95% CI) | Subtotals only | |
| 5.1 Short term follow‐up (< 12 months) | 8 | 288 | Risk Ratio (M‐H, Random, 95% CI) | 0.51 [0.18, 1.42] |
| 5.2 Long term follow‐up (≥ 12 months) | 5 | 201 | Risk Ratio (M‐H, Random, 95% CI) | 0.68 [0.41, 1.12] |
| 6 MLHFQ: short term follow‐up (< 12 months) Show forest plot | 4 | Mean Difference (IV, Random, 95% CI) | Subtotals only | |
| 6.1 Mean value at endpoint | 2 | 125 | Mean Difference (IV, Random, 95% CI) | ‐29.52 [‐33.76, ‐25.27] |
| 6.2 Mean change from baseline | 2 | 72 | Mean Difference (IV, Random, 95% CI) | ‐9.07 [‐22.09, 3.95] |
| 6.3 Combined | 4 | 197 | Mean Difference (IV, Random, 95% CI) | ‐18.96 [‐31.97, ‐5.94] |
| 7 MLHFQ: long term follow‐up (≥ 12 months) Show forest plot | 3 | Mean Difference (IV, Random, 95% CI) | Subtotals only | |
| 7.1 Mean value at endpoint | 1 | 82 | Mean Difference (IV, Random, 95% CI) | ‐36.5 [‐42.21, ‐30.79] |
| 7.2 Mean change from baseline | 2 | 69 | Mean Difference (IV, Random, 95% CI) | ‐7.63 [‐16.35, 1.09] |
| 7.3 Combined | 3 | 151 | Mean Difference (IV, Random, 95% CI) | ‐17.80 [‐39.87, 4.26] |
| 8 Seattle Angina Questionnaire: short term follow‐up (< 12 months) Show forest plot | 2 | Mean Difference (IV, Random, 95% CI) | Subtotals only | |
| 8.1 Mean value at endpoint | 1 | 49 | Mean Difference (IV, Random, 95% CI) | 5.0 [‐3.21, 13.21] |
| 8.2 Mean change from baseline | 2 | 211 | Mean Difference (IV, Random, 95% CI) | 9.34 [2.62, 16.07] |
| 8.3 Combined | 2 | 211 | Mean Difference (IV, Random, 95% CI) | 9.34 [2.62, 16.07] |
| 9 Angina episodes per week: short term follow‐up (< 12 months) Show forest plot | 5 | Mean Difference (IV, Random, 95% CI) | Subtotals only | |
| 9.1 Mean value at endpoint | 4 | 396 | Mean Difference (IV, Random, 95% CI) | ‐6.96 [‐11.99, ‐1.93] |
| 9.2 Mean change from baseline | 3 | 167 | Mean Difference (IV, Random, 95% CI) | ‐1.77 [‐14.61, 11.08] |
| 9.3 Combined | 5 | 428 | Mean Difference (IV, Random, 95% CI) | ‐5.11 [‐11.30, 1.09] |
| 10 NYHA classification: short‐term follow‐up (< 12 months) Show forest plot | 17 | Mean Difference (IV, Random, 95% CI) | Subtotals only | |
| 10.1 Mean value at endpoint | 16 | 658 | Mean Difference (IV, Random, 95% CI) | ‐0.42 [‐0.84, ‐0.00] |
| 10.2 Mean change from baseline | 4 | 239 | Mean Difference (IV, Random, 95% CI) | ‐0.56 [‐1.49, 0.36] |
| 10.3 Combined | 17 | 741 | Mean Difference (IV, Random, 95% CI) | ‐0.44 [‐0.84, ‐0.05] |
| 11 NYHA classification: long term follow‐up (≥ 12 months) Show forest plot | 9 | Mean Difference (IV, Random, 95% CI) | Subtotals only | |
| 11.1 Mean value at endpoint | 9 | 346 | Mean Difference (IV, Random, 95% CI) | ‐0.57 [‐1.03, ‐0.10] |
| 11.2 Mean change from baseline | 1 | 39 | Mean Difference (IV, Random, 95% CI) | ‐2.2 [‐2.70, ‐1.70] |
| 11.3 Combined | 9 | 346 | Mean Difference (IV, Random, 95% CI) | ‐0.81 [‐1.23, ‐0.39] |
| 12 CCS class: short term follow‐up (< 12 months) Show forest plot | 13 | Mean Difference (IV, Random, 95% CI) | Subtotals only | |
| 12.1 Mean value at endpoint | 10 | 486 | Mean Difference (IV, Random, 95% CI) | ‐0.32 [‐0.82, 0.18] |
| 12.2 Mean change from baseline | 6 | 318 | Mean Difference (IV, Random, 95% CI) | ‐0.62 [‐1.40, 0.17] |
| 12.3 Combined | 13 | 608 | Mean Difference (IV, Random, 95% CI) | ‐0.43 [‐0.92, 0.06] |
| 13 CCS class: long term follow‐up (≥ 12 months) Show forest plot | 3 | Mean Difference (IV, Random, 95% CI) | Subtotals only | |
| 13.1 Mean value at endpoint | 3 | 142 | Mean Difference (IV, Random, 95% CI) | ‐0.58 [‐2.04, 0.88] |
| 14 Exercise capacity: short term follow‐up (< 12 months) Show forest plot | 16 | Std. Mean Difference (IV, Random, 95% CI) | Subtotals only | |
| 14.1 Mean value at endpoint | 11 | 563 | Std. Mean Difference (IV, Random, 95% CI) | 0.56 [0.19, 0.93] |
| 14.2 Mean change from baseline | 9 | 535 | Std. Mean Difference (IV, Random, 95% CI) | 0.33 [0.05, 0.61] |
| 15 Exercise capacity: long term follow‐up (≥ 12 months) Show forest plot | 8 | Std. Mean Difference (IV, Random, 95% CI) | Subtotals only | |
| 15.1 Mean value at endpoint | 5 | 178 | Std. Mean Difference (IV, Random, 95% CI) | 1.14 [0.04, 2.25] |
| 15.2 Mean change from baseline | 3 | 227 | Std. Mean Difference (IV, Random, 95% CI) | 0.34 [0.07, 0.62] |
| 16 LVEF (%) measured by MRI: short term follow‐up (< 12 months) Show forest plot | 12 | Mean Difference (IV, Random, 95% CI) | Subtotals only | |
| 16.1 Mean value at endpoint | 10 | 352 | Mean Difference (IV, Random, 95% CI) | 3.01 [‐0.05, 6.07] |
| 16.2 Mean change from baseline | 9 | 308 | Mean Difference (IV, Random, 95% CI) | 4.05 [2.55, 5.55] |
| 16.3 Combined | 12 | 439 | Mean Difference (IV, Random, 95% CI) | 2.92 [1.03, 4.82] |
| 17 LVEF (%) measured by MRI: long term follow‐up (≥ 12 months) Show forest plot | 4 | Mean Difference (IV, Random, 95% CI) | Subtotals only | |
| 17.1 Mean value at endpoint | 4 | 110 | Mean Difference (IV, Random, 95% CI) | 2.37 [‐1.54, 6.29] |
| 17.2 Mean change from baseline | 3 | 97 | Mean Difference (IV, Random, 95% CI) | 3.83 [‐0.42, 8.08] |
| 17.3 Combined | 4 | 110 | Mean Difference (IV, Random, 95% CI) | 4.38 [0.82, 7.93] |
| 18 LVEF (%) measured by echocardiography: short term follow‐up (< 12 months) Show forest plot | 9 | Mean Difference (IV, Random, 95% CI) | Subtotals only | |
| 18.1 Mean value at endpoint | 8 | 388 | Mean Difference (IV, Random, 95% CI) | 5.16 [2.87, 7.44] |
| 18.2 Mean change from baseline | 3 | 161 | Mean Difference (IV, Random, 95% CI) | 3.47 [1.59, 5.34] |
| 18.3 Combined | 9 | 470 | Mean Difference (IV, Random, 95% CI) | 5.71 [4.29, 7.13] |
| 19 LVEF (%) measured by echocardiography: long term follow‐up (≥ 12 months) Show forest plot | 3 | Mean Difference (IV, Random, 95% CI) | Subtotals only | |
| 19.1 Mean value at endpoint | 3 | 154 | Mean Difference (IV, Random, 95% CI) | 7.69 [6.47, 8.92] |
| 19.2 Mean change from baseline | 1 | 82 | Mean Difference (IV, Random, 95% CI) | 6.1 [‐1.27, 13.47] |
| 19.3 Combined | 3 | 154 | Mean Difference (IV, Random, 95% CI) | 7.96 [6.39, 9.54] |
| 20 LVEF (%) measured by SPECT: short term follow‐up (< 12 months) Show forest plot | 4 | Mean Difference (IV, Random, 95% CI) | Subtotals only | |
| 20.1 Mean value at endpoint | 4 | 145 | Mean Difference (IV, Random, 95% CI) | 2.41 [‐2.65, 7.46] |
| 20.2 Mean change from baseline | 1 | 30 | Mean Difference (IV, Random, 95% CI) | ‐2.3 [‐17.33, 12.73] |
| 20.3 Combined | 4 | 145 | Mean Difference (IV, Random, 95% CI) | 5.22 [2.60, 7.85] |
| 21 LVEF (%) measured by SPECT: long term follow‐up (≥ 12 months) Show forest plot | 2 | Mean Difference (IV, Random, 95% CI) | Subtotals only | |
| 21.1 Mean value at endpoint | 2 | 88 | Mean Difference (IV, Random, 95% CI) | 0.37 [‐2.30, 3.04] |
| 21.2 Mean change from baseline | 1 | 49 | Mean Difference (IV, Random, 95% CI) | 4.0 [‐6.48, 14.48] |
| 21.3 Combined | 2 | 88 | Mean Difference (IV, Random, 95% CI) | 0.28 [‐2.48, 3.03] |
| 22 LVEF (%) measured by LV angiography: short term follow‐up (< 12 months) Show forest plot | 6 | Mean Difference (IV, Random, 95% CI) | Subtotals only | |
| 22.1 Mean value at endpoint | 6 | 265 | Mean Difference (IV, Random, 95% CI) | 3.18 [0.39, 5.97] |
| 22.2 Mean change from baseline | 4 | 181 | Mean Difference (IV, Random, 95% CI) | 1.72 [0.50, 2.95] |
| 22.3 Combined | 6 | 250 | Mean Difference (IV, Random, 95% CI) | 2.00 [0.53, 3.46] |
| 23 LVEF (%) measured by LV angiography: long term follow‐up (≥ 12 months) Show forest plot | 1 | Mean Difference (IV, Random, 95% CI) | Subtotals only | |
| 23.1 Mean value at endpoint | 1 | 49 | Mean Difference (IV, Random, 95% CI) | 6.0 [0.81, 11.19] |
| Outcome or subgroup title | No. of studies | No. of participants | Statistical method | Effect size |
| 1 Mortality (all‐cause): short term follow‐up (< 12 months) Show forest plot | 30 | Risk Ratio (M‐H, Random, 95% CI) | Subtotals only | |
| 1.1 < 107 cells | 6 | 334 | Risk Ratio (M‐H, Random, 95% CI) | 0.18 [0.02, 1.63] |
| 1.2 107 < 108 cells | 18 | 771 | Risk Ratio (M‐H, Random, 95% CI) | 0.34 [0.15, 0.79] |
| 1.3 ≥ 108 cells | 8 | 487 | Risk Ratio (M‐H, Random, 95% CI) | 0.83 [0.35, 1.94] |
| 2 Mortality (all‐cause): long term follow‐up (≥ 12 months) Show forest plot | 16 | Risk Ratio (M‐H, Random, 95% CI) | Subtotals only | |
| 2.1 < 107 cells | 4 | 297 | Risk Ratio (M‐H, Random, 95% CI) | 0.33 [0.10, 1.09] |
| 2.2 107 < 108 cells | 7 | 330 | Risk Ratio (M‐H, Random, 95% CI) | 0.30 [0.17, 0.53] |
| 2.3 ≥ 108 cells | 5 | 236 | Risk Ratio (M‐H, Random, 95% CI) | 0.62 [0.30, 1.26] |
| 3 NYHA classification: short term follow‐up (< 12 months) Show forest plot | 15 | Mean Difference (IV, Random, 95% CI) | Subtotals only | |
| 3.1 < 107 cells | 4 | 149 | Mean Difference (IV, Random, 95% CI) | ‐0.29 [‐0.94, 0.36] |
| 3.2 107 < 108 cells | 8 | 309 | Mean Difference (IV, Random, 95% CI) | ‐0.65 [‐1.22, ‐0.08] |
| 3.3 ≥ 108 cells | 4 | 241 | Mean Difference (IV, Random, 95% CI) | ‐0.41 [‐0.72, ‐0.11] |
| 4 CCS class: short term follow‐up (< 12 months) Show forest plot | 9 | Mean Difference (IV, Random, 95% CI) | Subtotals only | |
| 4.1 < 107 cells | 4 | 288 | Mean Difference (IV, Random, 95% CI) | ‐0.87 [‐1.92, 0.19] |
| 4.2 107 < 108 cells | 5 | 160 | Mean Difference (IV, Random, 95% CI) | ‐0.54 [‐1.40, 0.32] |
| 5 Exercise capacity: short term follow‐up (< 12 months) Show forest plot | 10 | Std. Mean Difference (IV, Random, 95% CI) | Subtotals only | |
| 5.1 107 < 108 cells | 7 | 357 | Std. Mean Difference (IV, Random, 95% CI) | 0.56 [‐0.03, 1.14] |
| 5.2 ≥ 108 cells | 3 | 161 | Std. Mean Difference (IV, Random, 95% CI) | 0.43 [0.10, 0.77] |
| 6 LVEF (%) measured by MRI: short term follow‐up (< 12 months) Show forest plot | 9 | Mean Difference (IV, Random, 95% CI) | Subtotals only | |
| 6.1 107 < 108 cells | 7 | 199 | Mean Difference (IV, Random, 95% CI) | 5.23 [3.91, 6.54] |
| 6.2 ≥ 108 cells | 3 | 101 | Mean Difference (IV, Random, 95% CI) | 2.37 [‐0.92, 5.66] |
| Outcome or subgroup title | No. of studies | No. of participants | Statistical method | Effect size |
| 1 Mortality (all‐cause): short term follow‐up (< 12 months) Show forest plot | 28 | Risk Ratio (M‐H, Random, 95% CI) | Subtotals only | |
| 1.1 < 30% | 11 | 508 | Risk Ratio (M‐H, Random, 95% CI) | 0.23 [0.09, 0.59] |
| 1.2 30 ‐ 50% | 13 | 642 | Risk Ratio (M‐H, Random, 95% CI) | 0.87 [0.36, 2.11] |
| 1.3 > 50% | 4 | 271 | Risk Ratio (M‐H, Random, 95% CI) | 0.61 [0.11, 3.35] |
| 2 Mortality (all‐cause): long term follow‐up (≥ 12 months) Show forest plot | 16 | Risk Ratio (M‐H, Random, 95% CI) | Subtotals only | |
| 2.1 < 30% | 9 | 426 | Risk Ratio (M‐H, Random, 95% CI) | 0.36 [0.20, 0.64] |
| 2.2 30 ‐ 50% | 7 | 289 | Risk Ratio (M‐H, Random, 95% CI) | 0.57 [0.27, 1.21] |
| 3 NYHA classification: short term follow‐up (< 12 months) Show forest plot | 15 | Mean Difference (IV, Random, 95% CI) | Subtotals only | |
| 3.1 < 30% | 6 | 273 | Mean Difference (IV, Random, 95% CI) | ‐0.40 [‐1.22, 0.43] |
| 3.2 30 ‐ 50% | 9 | 420 | Mean Difference (IV, Random, 95% CI) | ‐0.32 [‐0.54, ‐0.10] |
| 4 NYHA classification: long term follow‐up (≥ 12 months) Show forest plot | 9 | Mean Difference (IV, Random, 95% CI) | Subtotals only | |
| 4.1 < 30% | 5 | 202 | Mean Difference (IV, Random, 95% CI) | ‐0.66 [‐1.28, ‐0.04] |
| 4.2 30 ‐ 50% | 4 | 144 | Mean Difference (IV, Random, 95% CI) | ‐0.98 [‐1.72, ‐0.25] |
| 5 CCS class: short term follow‐up (< 12 months) Show forest plot | 8 | Mean Difference (IV, Random, 95% CI) | Subtotals only | |
| 5.1 < 30% | 4 | 213 | Mean Difference (IV, Random, 95% CI) | ‐0.25 [‐1.47, 0.97] |
| 5.2 30 ‐ 50% | 4 | 150 | Mean Difference (IV, Random, 95% CI) | ‐0.11 [‐0.31, 0.09] |
| 6 Exercise capacity: short term follow‐up (< 12 months) Show forest plot | 7 | Std. Mean Difference (IV, Random, 95% CI) | Subtotals only | |
| 6.1 < 30% | 4 | 225 | Std. Mean Difference (IV, Random, 95% CI) | 0.96 [0.37, 1.56] |
| 6.2 30 ‐ 50% | 3 | 127 | Std. Mean Difference (IV, Random, 95% CI) | 0.38 [‐0.57, 1.33] |
| 7 LVEF (%) measured by MRI: short term follow‐up (< 12 months) Show forest plot | 9 | Mean Difference (IV, Random, 95% CI) | Subtotals only | |
| 7.1 < 30% | 6 | 290 | Mean Difference (IV, Random, 95% CI) | 1.54 [‐1.96, 5.03] |
| 7.2 30 ‐ 50% | 3 | 60 | Mean Difference (IV, Random, 95% CI) | 3.31 [0.88, 5.75] |
| Outcome or subgroup title | No. of studies | No. of participants | Statistical method | Effect size |
| 1 Mortality (all‐cause): short term follow‐up (< 12 months) Show forest plot | 33 | Risk Ratio (M‐H, Random, 95% CI) | Subtotals only | |
| 1.1 Intramyocardial | 22 | 1049 | Risk Ratio (M‐H, Random, 95% CI) | 0.47 [0.21, 1.03] |
| 1.2 Intracoronary | 12 | 607 | Risk Ratio (M‐H, Random, 95% CI) | 0.51 [0.21, 1.23] |
| 2 Mortality (all‐cause): long term follow‐up (≥ 12 months) Show forest plot | 21 | Risk Ratio (M‐H, Random, 95% CI) | Subtotals only | |
| 2.1 Intramyocardial | 13 | 652 | Risk Ratio (M‐H, Random, 95% CI) | 0.29 [0.17, 0.50] |
| 2.2 Intracoronary | 8 | 358 | Risk Ratio (M‐H, Random, 95% CI) | 0.57 [0.30, 1.09] |
| 3 NYHA classification: short term follow‐up (< 12 months) Show forest plot | 17 | Mean Difference (IV, Random, 95% CI) | Subtotals only | |
| 3.1 Intramyocardial | 11 | 445 | Mean Difference (IV, Random, 95% CI) | ‐0.48 [‐0.99, 0.03] |
| 3.2 Intracoronary | 6 | 296 | Mean Difference (IV, Random, 95% CI) | ‐0.38 [‐0.76, 0.00] |
| 4 NYHA classification: long term follow‐up (≥ 12 months) Show forest plot | 9 | Mean Difference (IV, Random, 95% CI) | Subtotals only | |
| 4.1 Intramyocardial | 4 | 181 | Mean Difference (IV, Random, 95% CI) | ‐1.09 [‐1.76, ‐0.41] |
| 4.2 Intracoronary | 5 | 165 | Mean Difference (IV, Random, 95% CI) | ‐0.61 [‐0.92, ‐0.30] |
| 5 CCS class: short term follow‐up (< 12 months) Show forest plot | 13 | Mean Difference (IV, Random, 95% CI) | Subtotals only | |
| 5.1 Intramyocardial | 10 | 434 | Mean Difference (IV, Random, 95% CI) | ‐0.33 [‐0.87, 0.22] |
| 5.2 Intracoronary | 3 | 174 | Mean Difference (IV, Random, 95% CI) | ‐1.00 [‐2.87, 0.86] |
| 6 Exercise capacity: short term follow‐up (< 12 months) Show forest plot | 11 | Std. Mean Difference (IV, Random, 95% CI) | Subtotals only | |
| 6.1 Intramyocardial | 6 | 310 | Std. Mean Difference (IV, Random, 95% CI) | 0.78 [0.19, 1.36] |
| 6.2 Intracoronary | 5 | 253 | Std. Mean Difference (IV, Random, 95% CI) | 0.33 [‐0.06, 0.72] |
| 7 LVEF (%) measured by MRI: short term follow‐up (< 12 months) Show forest plot | 12 | Mean Difference (IV, Random, 95% CI) | Subtotals only | |
| 7.1 Intramyocardial | 8 | 309 | Mean Difference (IV, Random, 95% CI) | 2.18 [‐0.41, 4.77] |
| 7.2 Intracoronary | 5 | 137 | Mean Difference (IV, Random, 95% CI) | 3.72 [0.86, 6.57] |
| Outcome or subgroup title | No. of studies | No. of participants | Statistical method | Effect size |
| 1 Mortality (all‐cause): short term follow‐up (< 12 months) Show forest plot | 33 | Risk Ratio (M‐H, Random, 95% CI) | Subtotals only | |
| 1.1 Mononuclear cells | 20 | 966 | Risk Ratio (M‐H, Random, 95% CI) | 0.54 [0.28, 1.04] |
| 1.2 Circulating progenitor cells | 3 | 104 | Risk Ratio (M‐H, Random, 95% CI) | 0.32 [0.01, 7.48] |
| 1.3 Haematopoietic progenitor cells | 8 | 464 | Risk Ratio (M‐H, Random, 95% CI) | 0.27 [0.05, 1.46] |
| 1.4 Mesenchymal stem cells | 3 | 126 | Risk Ratio (M‐H, Random, 95% CI) | 0.5 [0.03, 7.59] |
| 2 Mortality (all‐cause): long term follow‐up (≥ 12 months) Show forest plot | 19 | Risk Ratio (M‐H, Random, 95% CI) | Subtotals only | |
| 2.1 Mononuclear cells | 12 | 540 | Risk Ratio (M‐H, Random, 95% CI) | 0.42 [0.25, 0.70] |
| 2.2 Haematopoietic progenitor cells | 4 | 302 | Risk Ratio (M‐H, Random, 95% CI) | 0.26 [0.10, 0.69] |
| 2.3 Mesenchymal stem cells | 3 | 111 | Risk Ratio (M‐H, Random, 95% CI) | 0.48 [0.15, 1.57] |
| 3 NYHA classification: short term follow‐up (< 12 months) Show forest plot | 15 | Mean Difference (IV, Random, 95% CI) | Subtotals only | |
| 3.1 Mononuclear cells | 12 | 547 | Mean Difference (IV, Random, 95% CI) | ‐0.42 [‐0.86, 0.02] |
| 3.2 Haematopoietic progenitor cells | 3 | 94 | Mean Difference (IV, Random, 95% CI) | ‐0.47 [‐1.95, 1.02] |
| 4 CCS class: short term follow‐up (< 12 months) Show forest plot | 13 | Mean Difference (IV, Random, 95% CI) | Subtotals only | |
| 4.1 Mononuclear cells | 8 | 366 | Mean Difference (IV, Random, 95% CI) | ‐0.39 [‐0.99, 0.21] |
| 4.2 Haematopoietic progenitor cells | 5 | 242 | Mean Difference (IV, Random, 95% CI) | ‐0.54 [‐1.55, 0.46] |
| Outcome or subgroup title | No. of studies | No. of participants | Statistical method | Effect size |
| 1 Mortality (all‐cause): short term follow‐up (< 12 months) Show forest plot | 33 | Risk Ratio (M‐H, Random, 95% CI) | Subtotals only | |
| 1.1 Chronic IHD | 11 | 550 | Risk Ratio (M‐H, Random, 95% CI) | 0.65 [0.26, 1.62] |
| 1.2 HF (secondary to IHD) | 15 | 645 | Risk Ratio (M‐H, Random, 95% CI) | 0.33 [0.14, 0.82] |
| 1.3 Refractory/intractable angina | 7 | 442 | Risk Ratio (M‐H, Random, 95% CI) | 0.61 [0.11, 3.35] |
| 2 Mortality (all‐cause): long term follow‐up (≥ 12 months) Show forest plot | 21 | Risk Ratio (M‐H, Random, 95% CI) | Subtotals only | |
| 2.1 Chronic IHD | 9 | 389 | Risk Ratio (M‐H, Random, 95% CI) | 0.52 [0.27, 0.99] |
| 2.2 HF (secondary to IHD) | 9 | 401 | Risk Ratio (M‐H, Random, 95% CI) | 0.33 [0.19, 0.58] |
| 2.3 Refractory/intractable angina | 3 | 220 | Risk Ratio (M‐H, Random, 95% CI) | 0.11 [0.01, 0.91] |
| 3 NYHA classification: short term follow‐up (< 12 months) Show forest plot | 16 | Mean Difference (IV, Random, 95% CI) | Subtotals only | |
| 3.1 Chronic IHD | 6 | 296 | Mean Difference (IV, Random, 95% CI) | ‐0.43 [‐0.78, ‐0.07] |
| 3.2 HF (secondary to IHD) | 10 | 417 | Mean Difference (IV, Random, 95% CI) | ‐0.47 [‐1.02, 0.09] |
| 4 NYHA classification: long term follow‐up (≥ 12 months) Show forest plot | 9 | Mean Difference (IV, Random, 95% CI) | Subtotals only | |
| 4.1 Chronic IHD | 3 | 105 | Mean Difference (IV, Random, 95% CI) | ‐0.66 [‐0.91, ‐0.42] |
| 4.2 HF (secondary to IHD) | 6 | 241 | Mean Difference (IV, Random, 95% CI) | ‐0.92 [‐1.47, ‐0.37] |
| 5 CCS class: short term follow‐up (< 12 months) Show forest plot | 13 | Mean Difference (IV, Random, 95% CI) | Subtotals only | |
| 5.1 HF (secondary to IHD) | 8 | 363 | Mean Difference (IV, Random, 95% CI) | ‐0.25 [‐0.90, 0.40] |
| 5.2 Refractory/intractable angina | 5 | 245 | Mean Difference (IV, Random, 95% CI) | ‐0.78 [‐1.44, ‐0.11] |
| 6 Exercise capacity: short term follow‐up (< 12 months) Show forest plot | 11 | Std. Mean Difference (IV, Random, 95% CI) | Subtotals only | |
| 6.1 Chronic IHD | 4 | 114 | Std. Mean Difference (IV, Random, 95% CI) | 0.48 [‐0.26, 1.22] |
| 6.2 HF (secondary to IHD) | 4 | 260 | Std. Mean Difference (IV, Random, 95% CI) | 0.79 [0.04, 1.53] |
| 6.3 Refractory/intractable angina | 3 | 189 | Std. Mean Difference (IV, Random, 95% CI) | 0.26 [‐0.03, 0.55] |
| 7 LVEF (%) measured by MRI: short term follow‐up (< 12 months) Show forest plot | 10 | Mean Difference (IV, Random, 95% CI) | Subtotals only | |
| 7.1 Chronic IHD | 6 | 178 | Mean Difference (IV, Random, 95% CI) | 2.58 [‐0.16, 5.31] |
| 7.2 HF (secondary to IHD) | 4 | 195 | Mean Difference (IV, Random, 95% CI) | 2.50 [‐1.97, 6.97] |
| Outcome or subgroup title | No. of studies | No. of participants | Statistical method | Effect size |
| 1 Mortality (all‐cause): short term follow‐up (< 12 months) Show forest plot | 33 | Risk Ratio (M‐H, Random, 95% CI) | Subtotals only | |
| 1.1 Co‐interventions | 8 | 432 | Risk Ratio (M‐H, Random, 95% CI) | 0.74 [0.32, 1.70] |
| 1.2 No co‐interventions | 25 | 1205 | Risk Ratio (M‐H, Random, 95% CI) | 0.31 [0.13, 0.72] |
| 2 Mortality (all‐cause): long term follow‐up (≥ 12 months) Show forest plot | 21 | Risk Ratio (M‐H, Random, 95% CI) | Subtotals only | |
| 2.1 Co‐interventions | 6 | 312 | Risk Ratio (M‐H, Random, 95% CI) | 0.47 [0.26, 0.88] |
| 2.2 No co‐interventions | 15 | 698 | Risk Ratio (M‐H, Random, 95% CI) | 0.32 [0.19, 0.56] |
| 3 NYHA classification: short term follow‐up (< 12 months) Show forest plot | 17 | Mean Difference (IV, Random, 95% CI) | Subtotals only | |
| 3.1 Co‐interventions | 6 | 233 | Mean Difference (IV, Random, 95% CI) | ‐0.57 [‐1.20, 0.05] |
| 3.2 No co‐interventions | 11 | 508 | Mean Difference (IV, Random, 95% CI) | ‐0.37 [‐0.87, 0.13] |
| 4 LVEF (%) measured by MRI: short term follow‐up (< 12 months) Show forest plot | 12 | Mean Difference (IV, Random, 95% CI) | Subtotals only | |
| 4.1 Co‐interventions | 5 | 179 | Mean Difference (IV, Random, 95% CI) | 2.01 [‐0.26, 4.29] |
| 4.2 No co‐interventions | 7 | 260 | Mean Difference (IV, Random, 95% CI) | 3.55 [0.82, 6.27] |
| Outcome or subgroup title | No. of studies | No. of participants | Statistical method | Effect size |
| 1 Mortality (all‐cause) Show forest plot | 15 | Risk Ratio (M‐H, Random, 95% CI) | Subtotals only | |
| 1.1 Short term follow‐up (< 12 months) | 14 | 744 | Risk Ratio (M‐H, Random, 95% CI) | 0.69 [0.32, 1.50] |
| 1.2 Long term follow‐up (≥ 12 months) | 9 | 491 | Risk Ratio (M‐H, Random, 95% CI) | 0.42 [0.21, 0.87] |
| 2 Non‐fatal myocardial infarction Show forest plot | 11 | Risk Ratio (M‐H, Random, 95% CI) | Subtotals only | |
| 2.1 Short term follow‐up (< 12 months) | 6 | 288 | Risk Ratio (M‐H, Random, 95% CI) | 0.50 [0.05, 4.58] |
| 2.2 Long term follow‐up (≥ 12 months) | 5 | 345 | Risk Ratio (M‐H, Random, 95% CI) | 0.38 [0.15, 0.97] |
| 3 Rehospitalisation due to heart failure Show forest plot | 8 | Risk Ratio (M‐H, Random, 95% CI) | Subtotals only | |
| 3.1 Short term follow‐up (< 12 months) | 3 | 234 | Risk Ratio (M‐H, Random, 95% CI) | 0.65 [0.32, 1.32] |
| 3.2 Long term follow‐up (≥ 12 months) | 6 | 375 | Risk Ratio (M‐H, Random, 95% CI) | 0.63 [0.36, 1.09] |
| 4 Arrhythmias Show forest plot | 7 | Risk Ratio (M‐H, Random, 95% CI) | Subtotals only | |
| 4.1 Short term follow‐up (< 12 months) | 6 | 224 | Risk Ratio (M‐H, Random, 95% CI) | 0.77 [0.18, 3.21] |
| 4.2 Long term follow‐up (≥ 12 months) | 1 | 82 | Risk Ratio (M‐H, Random, 95% CI) | 0.42 [0.18, 0.99] |
| 5 Composite MACE Show forest plot | 3 | Risk Ratio (M‐H, Random, 95% CI) | Subtotals only | |
| 5.1 Short term follow‐up (< 12 months) | 2 | 59 | Risk Ratio (M‐H, Random, 95% CI) | 0.0 [0.0, 0.0] |
| 5.2 Long term follow‐up (≥ 12 months) | 3 | 141 | Risk Ratio (M‐H, Random, 95% CI) | 0.64 [0.38, 1.08] |
| 6 NYHA classification: short term follow‐up (< 12 months) Show forest plot | 5 | Mean Difference (IV, Random, 95% CI) | Subtotals only | |
| 6.1 Combined | 5 | 277 | Mean Difference (IV, Random, 95% CI) | ‐0.26 [‐0.59, 0.07] |
| 7 NYHA classification: long term follow‐up (≥ 12 months) Show forest plot | 1 | Mean Difference (IV, Random, 95% CI) | Subtotals only | |
| 7.1 Combined | 1 | 39 | Mean Difference (IV, Random, 95% CI) | ‐2.2 [‐2.70, ‐1.70] |
| 8 LVEF (%) measured by MRI: short term follow‐up (< 12 months) Show forest plot | 7 | Mean Difference (IV, Random, 95% CI) | Subtotals only | |
| 8.1 Combined | 7 | 249 | Mean Difference (IV, Random, 95% CI) | 2.92 [0.67, 5.17] |
| 9 LVEF (%) measured by MRI: long term follow‐up (≥ 12 months) Show forest plot | 1 | Mean Difference (IV, Random, 95% CI) | Subtotals only | |
| 9.1 Combined | 1 | 25 | Mean Difference (IV, Random, 95% CI) | ‐1.60 [‐8.70, 5.50] |
| Outcome or subgroup title | No. of studies | No. of participants | Statistical method | Effect size |
| 1 Mortality (all‐cause) Show forest plot | 26 | Risk Ratio (M‐H, Random, 95% CI) | Subtotals only | |
| 1.1 Short term follow‐up (< 12 months) | 25 | 1216 | Risk Ratio (M‐H, Random, 95% CI) | 0.58 [0.29, 1.16] |
| 1.2 Long term follow‐up (≥ 12 months) | 13 | 624 | Risk Ratio (M‐H, Random, 95% CI) | 0.43 [0.21, 0.86] |
| Outcome or subgroup title | No. of studies | No. of participants | Statistical method | Effect size |
| 1 Mortality (all‐cause) Show forest plot | 32 | Risk Ratio (M‐H, Random, 95% CI) | Subtotals only | |
| 1.1 Short term follow‐up (< 12 months) | 28 | 1449 | Risk Ratio (M‐H, Random, 95% CI) | 0.48 [0.26, 0.89] |
| 1.2 Long term follow‐up (≥ 12 months) | 17 | 883 | Risk Ratio (M‐H, Random, 95% CI) | 0.39 [0.25, 0.60] |