Laufbandtraining für Patienten mit der Parkinson‐Krankheit
Abstract
Background
Treadmill training is used in rehabilitation and is described as improving gait parameters of patients with Parkinson's disease.
Objectives
To assess the effectiveness of treadmill training in improving the gait of patients with Parkinson's disease and the acceptability and safety of this type of therapy.
Search methods
We searched the Cochrane Movement Disorders Group Specialised Register (see Review Group details for more information) (last searched September 2014), Cochrane Central Register of Controlled Trials (The Cochrane Library 2014, Issue 10), MEDLINE (1950 to September 2014), and EMBASE (1980 to September 2014). We also handsearched relevant conference proceedings, searched trials and research registers, and checked reference lists (last searched September 2014). We contacted trialists, experts and researchers in the field and manufacturers of commercial devices.
Selection criteria
We included randomised controlled trials comparing treadmill training with no treadmill training in patients with Parkinson's disease.
Data collection and analysis
Two review authors independently selected trials for inclusion, assessed trial quality and extracted data. We contacted the trialists for additional information. We analysed the results as mean differences (MDs) for continuous variables and relative risk differences (RD) for dichotomous variables.
Main results
We included 18 trials (633 participants) in this update of this review. Treadmill training improved gait speed (MD = 0.09 m/s; 95% confidence interval (CI) 0.03 to 0.14; P = 0.001; I2 = 24%; moderate quality of evidence), stride length (MD = 0.05 metres; 95% CI 0.01 to 0.09; P = 0.01; I2 = 0%; low quality of evidence), but walking distance (MD = 48.9 metres; 95% CI ‐1.32 to 99.14; P = 0.06; I2 = 91%; very low quality of evidence) and cadence did not improve (MD = 2.16 steps/minute; 95% CI ‐0.13 to 4.46; P = 0.07; I2 = 28%; low quality of evidence) at the end of study. Treadmill training did not increase the risk of patients dropping out from intervention (RD = ‐0.02; 95% CI ‐0.06 to 0.02; P = 0.32; I2 = 13%; moderate quality of evidence). Adverse events were not reported in included studies.
Authors' conclusions
This update of our systematic review provides evidence from eighteen trials with moderate to low risk of bias that the use of treadmill training in patients with PD may improve clinically relevant gait parameters such as gait speed and stride length (moderate and low quality of evidence, respectively). This apparent benefit for patients is, however, not supported by all secondary variables (e.g. cadence and walking distance). Comparing physiotherapy and treadmill training against other alternatives in the treatment of gait hypokinesia such as physiotherapy without treadmill training this type of therapy seems to be more beneficial in practice without increased risk. The gain seems small to moderate clinically relevant. However, the results must be interpreted with caution because it is not known how long these improvements may last and some studies used no intervention in the control group and underlie some risk of bias. Additionally the results were heterogenous and we found variations between the trials in patient characteristics, the duration and amount of training, and types of treadmill training applied.
PICO
Laienverständliche Zusammenfassung
Laufbandtraining für Menschen mit der Parkinson‐Krankheit
Fragestellung: Wir untersuchten, ob Laufbandtraining und Körpergewichtsentlastung (einzeln oder in Kombination) das Gehen bei Menschen mit der Parkinson‐Krankheit verbessern kann, wenn es mit anderen Methoden zum Gehtraining oder keiner Behandlung verglichen wird.
Hintergrund: Ein verlangsamter Gang ist ein häufiges Problem für Menschen mit der Parkinson‐Krankheit. Für Menschen mit leichter bis mittelschwerer Parkinson‐Krankheit beeinträchtigt er die Alltagsfähigkeit und Lebensqualität. Ein Laufbandtraining bedient sich speziell entwickelter Maschinen, um die Rehabilitation des Ganges zu unterstützen. Es ist jedoch noch unklar, welche Rolle das Laufbandtraining bei der Verbesserung verschiedener Aspekte des Gehens von Menschen mit der Parkinson‐Krankheit spielt.
Studienmerkmale: Bis September 2014 schlossen wir 18 für die Beantwortung der Fragestellung bedeutsame Studien mit 633 Teilnehmern ein, die diese Therapieform untersuchten.
Hauptergebnisse und Qualität der Evidenz: Laufbandtraining verbesserte die Gehgeschwindigkeit und Schrittlänge, nicht aber die Gehstrecke und die Kadenz (Anzahl der Schritte pro Minute). Die Akzeptanz des Laufbandtrainings durch die Studienteilnehmer war gut, und unerwünschte Nebenwirkungen waren selten. Scheinbar sind Geräte zur Laufbandtherapie vorteilhaft und könnten routinemäßig in der Rehabilitation angewandt werden. Allerdings ist es noch nicht klar, wann und wie oft diese genutzt werden sollten, und wie lange die erzielten Vorteile anhalten.
Die Qualität der Evidenz (des wissenschaftlichen Belegs) für die primären Endpunkte (Zielgrößen) war moderat bis niedrig. In den Studien wurden keine Nebenwirkungen (unerwünschten Ereignisse) berichtet, und die Anzahl der Studienabbrecher war in den Gruppen, die Laufbandtraining erhielten, nicht höher als in den Vergleichsgruppen. Wir untersuchten lediglich den Einfluss auf verschiedene Aspekte des Gehens; der Einfluss auf die Aktivitäten des täglichen Lebens oder die Lebensqualität waren nicht Gegenstand dieser Untersuchung.
Authors' conclusions
Summary of findings
| Treadmill training versus no treadmill training or active control intervention or gait training for patients with Parkinson's disease | ||||||
| Patient or population: patients with patients with Parkinson's disease | ||||||
| Outcomes | Illustrative comparative risks* (95% CI) | Relative effect | No of Participants | Quality of the evidence | Comments | |
| Assumed risk | Corresponding risk | |||||
| Control | Treadmill training versus no treadmill training or active control intervention or gait training | |||||
| Gait speed at the end of the study ‐ Active control group (co‐interventions were similar in both groups) | The mean gait speed at the end of the study ‐ active control group (co‐interventions were similar in both groups) in the control groups was | The mean gait speed at the end of the study ‐ active control group (co‐interventions were similar in both groups) in the intervention groups was | 434 | ⊕⊕⊕⊝ | ||
| Gait speed at the end of the study ‐ No interventioncontrol group (co‐interventions were not similar in both groups) | The mean gait speed at the end of the study ‐ no intervention control group (co‐interventions were not similar in both groups) in the control groups was | The mean gait speed at the end of the study ‐ no intervention control group (co‐interventions were not similar in both groups) in the intervention groups was | 76 | ⊕⊝⊝⊝ | ||
| walking distance in m (at the end of study; all studies) ‐ Active control group (co‐interventions were similar in both groups) | The mean walking distance in m (at the end of study; all studies) ‐ active control group (co‐interventions were similar in both groups) in the control groups was | The mean walking distance in m (at the end of study; all studies) ‐ active control group (co‐interventions were similar in both groups) in the intervention groups was | 385 | ⊕⊕⊝⊝ | ||
| walking distance in m (at the end of study; all studies) ‐ No intervention control group (co‐interventions were not similar in both groups) | The mean walking distance in m (at the end of study; all studies) ‐ no intervention control group (co‐interventions were not similar in both groups) in the control groups was | The mean walking distance in m (at the end of study; all studies) ‐ no intervention control group (co‐interventions were not similar in both groups) in the intervention groups was | 31 | See comment | ||
| acceptability and safety of treadmill training ‐ Active control group (co‐interventions were similar in both groups) | Study population | See comment | 531 | ⊕⊕⊕⊝ | Risks were calculated from pooled risk differences | |
| 131 per 1000 | 122 per 1000 | |||||
| Moderate | ||||||
| 0 per 1000 | 0 per 1000 | |||||
| acceptability and safety of treadmill training ‐ No intervention control group (co‐interventions were not similar in both groups) | Study population | See comment | 102 | ⊕⊕⊝⊝ | Risks were calculated from pooled risk differences | |
| 392 per 1000 | 255 per 1000 | |||||
| Moderate | ||||||
| 200 per 1000 | 130 per 1000 | |||||
| *The basis for the assumed risk (e.g. the median control group risk across studies) is provided in footnotes. The corresponding risk (and its 95% confidence interval) is based on the assumed risk in the comparison group and the relative effect of the intervention (and its 95% CI). | ||||||
| GRADE Working Group grades of evidence | ||||||
| 1 Final values reported | ||||||
Background
Description of the condition
Parkinson's disease (PD) is a progressive and disabling degenerative disorder characterised clinically by bradykinesia, tremor, rigidity, and postural instability. Disability occurs at all stages of the disease and the severity of disabilities usually increases with disease duration. Patients frequently have gait impairments, difficulty in linking movements together smoothly, and episodes of freezing. These problems together with balance disturbances lead to an increased incidence of falls with the concomitant risk of fractures. In fact one study found that 27% of Parkinson's patients have had a hip fracture within 10 years of their diagnosis (Johnell 1992).
Gait hypokinesia is one of the primary movement disorders associated with PD (Morris 2000). It is an important contributor to disability and quality of life in mild to moderate Parkinson disease (Muslimovic 2008). Kinematic measures have occasionally been found to been altered in individual patients but slowness of gait is the only symptom that has been consistently reported in group comparisons between control patients and patients with idiopathic PD (Morris 2000). Cadence control remains unaffected throughout its entire range in PD and gait hypokinesia is directly attributable to an inability to internally generate sufficiently large steps. Therefore, improvements of walking speed and stride length are the primary goals of gait rehabilitation in patients with PD (Pohl 2003), and reducing gait freezing when it is present.
The current management of PD focuses on pharmacological therapy; at present levodopa is regarded as the most effective treatment. However, many patients show abnormal involuntary movements due to levodopa known as dyskinesias (Jankovic 2000). Drugs other than levodopa such as dopamine agonists may initially control symptoms for many patients but levodopa and polytherapy are often necessary in the treatment of PD, particularly in the advanced stages (Motto 2003).
Despite new pharmacological interventions, treatment becomes unsatisfactory in a large proportion of patients. After five years of levodopa treatment, many patients experience severe motor complications such as motor fluctuations and dyskinesias. Theseare difficult to manage with the available drug strategies. Complications cause functional disability and impact on the person's quality of life (Motto 2003).
In recent years, interest in functional neurosurgery of basal ganglia has increased. Patients who have developed severe motor complications that are resistant to the available pharmacological interventions could be considered surgical candidates (Motto 2003). Three major targets for functional neurosurgery are; the thalamus ventro‐intermediate nucleus, internal globus pallidus, and subthalamic nucleus. Two different techniques, radiofrequency lesioning or high frequency stimulation (Limousin 1998) have been proposed. However, there is still debate concerning risks and benefits of surgery. A Cochrane review team is evaluating theses issues (Motto 2003).
Description of the intervention
Despite optimal medical and surgical therapies for PD, patients develop progressive disability (Deane 2001). However, the effectiveness of non‐pharmacological options such as exercises have recently been demonstrated (Goodwin 2008). A good example for patient‐tailored exercises is physiotherapy (Ashburn 2004; Comella 1994; de Goede 2001; Tomlinson 2013). The aim of physiotherapy is to enable PD patients to maintain their maximum level of mobility, activity, and independence. This outcome can be attained through monitoring of the patient’s condition, implementation of appropriate physical treatments, and incorporating a range of approaches to movement rehabilitation (Tomlinson 2013). However, in spite of established pharmacological and conventional approaches there is still a need for new interventions to improve the gait of people with PD.
Recently, the use of electromechanical devices such as treadmill training has provided a promising new therapeutic approach in the rehabilitation of patients with hemiparesis and impaired gait (Mehrholz 2014). Augmenting conventional therapy with treadmill training as a supplement to conventional therapies may improve the results of other gait training therapies. With seriously afflicted hemiparetic patients who cannot walk under their own power, treadmill training with bodyweight support (BWS) might be recommended.
How the intervention might work
As described recently, treadmill training with BWS has also been used with PD patients. Results of single studies suggested better improvement in gait parameters when compared with conventional gait therapy (Miyai 2002; Pohl 2003).
Treadmill training can be used to give people with PD intensive practice (in terms of high repetitions) of complex gait cycles. Treadmill training can be used to train at higher gait speeds and to achieve greater step length compared to physiotherapy not using such devices (Cakit 2007; Pohl 2003).
However, the most effective combination of training parameters (for example, amount and timing of BWS during the gait cycle and belt speed and acceleration) is still unknown. There is, therefore, still a need for a systematic evaluation in the form of a systematic review of the available literature. The present review assesses the effectiveness and acceptability of treadmill training to augment conventional gait rehabilitation for patients with PD.
Why it is important to do this review
As the scientific evidence for the benefits of treadmill training may have changed since our Cochrane Review was first published in 2009 (Mehrholz 2010), an update of the review seems to be required in order to justify the large equipment and human resource cost needed to implement treadmill training devices as well as to confirm the safety and acceptance of this type of training. Therefore, it seems to be important that this version of our review provides an update of the best available evidence about the above‐mentioned approach.
Objectives
To assess the effectiveness of treadmill training in improving the gait function of patients with Parkinson's disease and the acceptability and safety of this type of therapy. A secondary objective of this review is to find the most effective combination of training parameters (for example belt speed and acceleration).
Methods
Criteria for considering studies for this review
Types of studies
We included randomised controlled trials (RCTs) and randomised controlled cross‐over trials where only the first period was analysed as a parallel group trial.
Types of participants
We included studies with participants of both genders and all ages who were diagnosed with PD using the UK Parkinson's Disease Brain Bank Criteria (or PD diagnostic criteria as defined by the study authors) regardless of drug therapy, duration of treatment, duration of PD, or level of initial impairment.
Types of interventions
We compared treadmill training versus no treadmill training (main analysis) for improving gait. We assumed that co‐ interventions such as other rehabilitation interventions and medication or treatment were comparable between groups. Because this can not be assumed we compared treadmill training with a variety of other interventions in the (control group) and described these in an additional table. If co‐ interventions were comparable between groups e.g. active versus no‐active control intervention we did a separate comparison.
No restriction was placed for the duration or characteristics of the intervention. We considered end‐of‐treatment assessments as provided by the studies.
Types of outcome measures
Primary outcomes
The primary outcomes were walking speed (continuous outcome) and stride length (continuous). According to Hass 2014 we defined the cut‐off value representing a minimal clinical important difference (CID) for walking speed at 0.06 m/s, a moderate CID at 0.14 m/s and a large CID at 0.22 m/s
Secondary outcomes
The secondary outcomes were cadence (continuous) and walking distance (continuous).
Another secondary outcome was the acceptability and safety of treadmill training. We investigated the safety of treadmill training using the incidence of adverse events such as cardiovascular events, injuries, and pain, and any other reported adverse events. To measure the acceptance of treadmill training we used drop outs from the study due to any reason.
We provided all primary and secondary outcomes in a summary of findings table. If we had more than seven outcomes to present we prioritised them according to their relevance and presented the most important outcomes.
Search methods for identification of studies
Electronic searches
We used the search strategy developed for the Movement Disorders Group and identified relevant trials by searching the following electronic databases:
-
Cochrane Movement Disorders Group Specialised Register;
-
Cochrane Central Register of Controlled Trials (CENTRAL) (The Cochrane Library; last searched September 2014);
-
MEDLINE (1966 to September 2014);
-
EMBASE (1966 to September 2014);
-
Pedro (last search September 2014).
The MeEDLINE and EMBASE searches can be found in the Appendices
Searching other resources
In addition, we also
-
searched the reference lists for identified trials and review articles;
-
hand‐searched and screened reference lists of potentially relevant conference proceedings (1998 to September 2014;Appendix 5) searched ongoing trials and research registers; contacted trialists, other researchers, and manufacturers of commercial devices in our field of study to identify published, unpublished, and ongoing trials not available in the major databases; contacted trialists and other researchers to obtain additional information on trials published elsewhere and unpublished trials.
Publication status or language did not influence our decision to include.
Data collection and analysis
Selection of studies
Selection and identification of relevant trials
Two authors (JM and MP) independently read titles and, when available, abstracts of identified references and eliminated obviously irrelevant studies. Two review authors (MP and BE) independently examined potentially relevant studies using the predetermined criteria for including studies. We obtained the full text for the remaining studies. Based on our inclusion criteria (types of studies, participants, aims of interventions, outcome measures) two review authors (BE and MP) independently ranked these studies as relevant, irrelevant, or possibly relevant. We excluded all trials ranked initially as irrelevant, but included all other trials at this stage. We resolved disagreement among authors through discussion. If further information was needed to reach consensus we contacted trialists in an effort to obtain missing information
Data extraction and management
Two review authors (JM and MP) independently extracted trial and outcome data from the selected trials. If any review author was involved in any of the selected studies another member of our author group who was not involved in the study was requested to review the study information.
We established the characteristics of unpublished trials through correspondence with the trial co‐ordinator or principal investigator. We used checklists to independently record details of the:
-
methods of generating randomisation schedule;
-
methods of concealment of allocation;
-
blinding of assessors;
-
use of an intention‐to‐treat analysis (all participants initially randomised were included in the analyses as allocated to groups);
-
adverse events and drop outs for all reasons;
-
important imbalance in prognostic factors;
-
participants (country, number of participants, age, gender, stage of PD as assessed by Hoehn Yahr for entry to the study, inclusion and exclusion criteria);
-
comparison (details of the intervention in treatment and control groups; details of co‐intervention(s) in both groups; duration of treatment);
-
outcomes and time points of measures (number of participants in each group and outcome, regardless of compliance).
We checked all of the extracted data for agreement among review authors, with another review author (BE or JK) arbitrating any items where consensus was not reached. If necessary, we contacted trialists to request more information, clarification, or missing data. If data was still missing we analysed the available data, but did not impute data.
The primary outcome variables of interest were continuous data, entered as means and standard deviations. We calculated a pooled estimate of the mean differences (MD) with 95% confidence intervals (CI). If studies did not use the same outcome, we use the standardised mean difference (SMD) with 95% CI.
For all binary outcomes (such as the secondary outcome 'drop out, from all causes') we calculated risk differences (RD), again with 95% CI.
If necessary we combined the results of different treadmill training groups in one (collapsed, treadmill) group and compared this with the combined results of the control group. We combined continuous data for pooled arms using the implemented RevMan Calculator. We have built a summary of findings table using the software GRADEprofiler and conducted GRADE assessments according to the GRADEprofiler help.
Assessment of risk of bias in included studies
For this update of the review two authors (BE and JM) independently assessed the risk of bias in the included trials in accordance with the Cochrane Handbook for Systematic Reviews of Interventions (Higgins 2011). We described the agreement between authors during the assessment of risk of bias, and we resolved disagreement by reaching consensus through discussion. We contacted trialists for clarification and to request missing information.
We checked all methodological quality assessments for agreement among the review authors and resolved disagreements by discussion among authors. Two review authors (MP and JM) were co‐authors of one included trial (Pohl 2003); other review authors (BE and JK) did the quality assessment for this trial. We contacted study authors for clarification and to request missing information. We did test the robustness of the main results in a sensitivity analysis (Analysis 2.1).
Measures of treatment effect
For all outcomes representing continuous data, we entered means and standard deviations. We calculated a pooled estimate of the mean difference (MD) with 95%confidence interval (CI). For all binary outcomes
we calculated risk differences (RD) with 95% CI. For all analyses we used The Cochrane Collaboration’s Review Manager software, RevMan 5.2 and used a random‐effects model for all analyses.
Dealing with missing data
We contacted the relevant principal investigators to retrieve missing data.
Assessment of heterogeneity
We used the I² statistic to assess heterogeneity. We used a random effects model, regardless of the level of heterogeneity. Thus, in the case of heterogeneity we did not violate the preconditions of a fixed‐effect model approach. We visually examined publication bias using funnel plots.
Subgroup analysis and investigation of heterogeneity
To quantify for heterogeneity we used the I2 statistic for all comparisons. We always used random‐effects model regardless of the level of heterogeneity. We described variability in participants, interventions, and outcomes studied (clinical diversity) in an additional table (Table 1) and in the Description of studies. The variability of studies did not influence our intention to pool trials. For all statistical analyses we used the latest version of The Cochrane Collaboration's software Review Manager (RevMan).
| Study ID | Age, mean (SD) EXP | Age, mean (SD) CON | Hoehn & Yahr stages | mean Duration of disease EXP | mean Duration of disease CON | female/male EXP | female/male CON | Duration of therapy | frequency of training | intensity of training in terms of minutes per session | intensity of training in terms of treadmill speed paradigm |
| 60 (11) | 58 (9) | 1 to 3 | 5 years | 5 years | 4/7 | 5/6 | 5 weeks | 3 times a week | 16' with increments of 4 ' per week | constant and as individually preferred speed | |
| 72 (6)* | 1 to 2 | 6 years* | 15/16* | 8 weeks | not described | 30 | relatively similar to so called speed dependent treadmill approach (Pohl 2002) | ||||
| 61 (6) | 63 (10) | 1 to 2 | 6 years | 6 years | 5/5 | 4/6 | 6 weeks | 4 times a week | 20‐40 | gradually increased speed | |
| 61 (6) | 63 (10) | 1 to 2 | 6 years | 5 years | not described | 6 weeks | 4 times a week | 30 | high, (80% of max), gradually increased | ||
| 68 (5) | 69 (5) | 2 to 3 | 6 years | 4 years | 0/10 | 0/10 | 4 weeks | 3 times a week | 20 | slightly higher than preferred | |
| 64 (15) | 62 (10) | 1 to 2 | 1 year | 1 year | 4/6 | 13/7 | 8 weeks | 3 times a week | 45 | progression of speed in high intensity group/ and low to moderate progression of speed in low intensity group | |
| 71 (8) | 71 (7) | 3 | 13 years | 13 years | 12/8 | 11/9 | 4 weeks | 7 times a week | 20 | 60% of max speed at start, then gradually increased | |
| 65 (9) | 67 (11) | 1 to 3 | 4 years | 9 years | 5/5 | 2/8 | 6 weeks | 3 times a week | 30 | both groups received speed training relatively similar to so called speed dependent approach (Pohl 2002) | |
| 64 (11) | 66 (5) | mean 2.2 to 2.5 | 5 years | 5 years | 7/5 | 5/7 | 6 weeks | 3 times a week | 40 | gradually increased speed | |
| 67 (2)* | 2.5 to 3 | 4 years* | 5/5* | 4 weeks | 3 times a week | 36‐45 | gradually increased speed | ||||
| 70 (2) | 70 (2) | 2.5 to 3 | 4 years | 4.5 years | 6/5 | 4/5 | 4 weeks | 3 times a week | 45 | gradually increased speed | |
| 62 (7) | 64 (6) | 1 to 2 | Not reported | 2/9 | 5/18 | 24 weeks | 3 times a week | 60 | gradually increased speed | ||
| 69 (8) | 68 (9) | 3 | 7 years | 7 years | 14/6 | 23/17 | 4 weeks | 3 times a week | 30 | gradually increased speed | |
| 61 (9) | 61 (9) | 1 to 2.5 | 3 years | 3 years | 3/5 | 2/7 | 1 session | N.a. | 30 | similar to so called speed dependent treadmill approach (Pohl 2002) | |
| 71 (7) | 74 (9) | 2 to 3 | 7 years | 8 years | not described | 8 weeks | 3 times a week | 30 | relatively similar to so called speed dependent treadmill approach (Pohl 2002) | ||
| 68 (9) | 70 (10) | 2.5 to 3.5 | 9 years | 8 years | 5/5 | 6/4 | 4 weeks | 5 times a week | 45 | gradually increased speed | |
| 66 (10) | 65 (11) | 2 to 3 | 6 years | 6 years | 17/32 | 4/18 | 12 weeks | 3 times a week | 30‐50 | no clear speed increases but depending on maximal heart reserve speed was increased | |
| 68 (8) | 66 (11) | 1 to 3 | 5 years | 5 years | 6/9 | 8/7 | 4 weeks | 3 times a week | 30 | constant, comfortable speed | |
* information not available by group
Sensitivity analysis
We incorporated a post hoc sensitivity analysis for methodological quality to test the robustness of our results for the primary outcome gait speed. We analysed random sequence generation, allocation concealment, blinding of outcome assessors.
Results
Description of studies
See:Characteristics of included studies; Characteristics of excluded studies;Characteristics of studies awaiting classification; and Characteristics of ongoing studies.
Studies that were included compared treadmill training with a variety of other active interventions and none (Characteristics of included studies; Table 2; Additional tables).
| Study ID | active treatment | no interventions | gait training | control group |
| yes | yes | overground gait training, 3 times a week for 5 weeks (72 min a week) | ||
| yes | not described further | |||
| yes | usual care including advice to maintain usual physical activity levels | |||
| yes | yes | robotic gait training, 3 times a week for 4 weeks (120 min a week) | ||
| yes | yes | home walking program, 6 times a week for 4 weeks (180 min a week) | ||
| yes | 1 | (2) low‐intensity group: general or traditional physiotherapy, for 24 sessions in 8 weeks (3) zero‐intensity (no‐exercise) group: six 1 hour education class over 8 weeks | ||
| yes | 1 | traditional rehabilitation with visual and auditory cues, 7 times a week for 4 weeks (140 min a week) | ||
| yes | yes | 6 weeks rhythmic auditory‐cueing with incremental speed increases in small groups of five participants, 30 minutes a session, not described how often a week | ||
| yes | not further described by the authors | |||
| yes | 4 weeks conventional physiotherapy, 45 minutes a day, 3 days a week | |||
| yes | 4 weeks conventional physiotherapy, 45 minutes a day, 3 days a week, with a total of 12 sessions | |||
| yes | low exercise intensity training in seated position, 3 times a week for 24 weeks (180 min a week) | |||
| yes | yes | 3 arms:(1) robotic gait training group, twelve, 45‐min sessions, three days a week for 4 consecutive weeks (3) Physical Therapy group, twelve, 45‐min sessions, three days a week for 4 consecutive weeks | ||
| yes | yes | 4 arms(3) physiotherapy group: 1 session physiotherapy including gait training, 30 minutes (4) control group: resting in a chair for 30 minutes | ||
| yes | no training | |||
| yes | yes | robot‐assisted gait training (device: G‐EO), 5 times a week for 4 weeks (225 min a week) | ||
| yes | stretching and resistance training, 3 times a week for 12 weeks (duration of sessions not described) | |||
| yes | conventional therapy, 3 times a week for 4 weeks (90 min a week) |
The age of participants was between 58 and 74 [BJ1] years and the disease severity was in most studies between Hoehn & Yahr stages 1 and 3.
13 out of 18 studies (72%) used UPDRS (total or subscales) at baseline for patient description but only 8 out of 18 included studies (44%) at study end (Table 3).
| Study ID | U PDRS at baseline | UPDRS at study end | QoL at baseline | Follow‐Up |
| UPDRS motor score | UPDRS motor score | ‐ | no | |
| UPDRS motor score | ‐ | ‐ | no | |
| UPDRS motor score | UPDRS motor score | PDQ‐39 | after 6 weeks | |
| UPDRS motor score | UPDRS motor score | SF‐12 PCS and MCS | after 3, 6 months | |
| ‐ | ‐ | ‐ | after 1 months | |
| UPDRS (total and subscales) | UPDRS (total and subscales) | ‐ | no | |
| UPDRS motor score | ‐ | ‐ | no | |
| ‐ | ‐ | ‐ | 3mo | |
| ‐ | ‐ | ‐ | no | |
| UPDRS (total and subscales) | UPDRS (total and subscales) | ‐ | no | |
| UPDRS (total and subscales) | UPDRS (total and subscales) | ‐ | after 2,3,4,5 and 6 months | |
| UPDRS (total and subscales) | UPDRS (total and subscales) | PDQ‐39 | after 6 months | |
| UPDRS (total) | UPDRS (total) | ‐ | 3 months | |
| UPDRS (total and subscales) | ‐ | ‐ | no | |
| ‐ | ‐ | ‐ | no | |
| UPDRS (total and subscales) | ‐ | ‐ | no | |
| UPDRS (total and subscales) | ‐ | ‐ | no | |
| ‐ | ‐ | ‐ | after 1 months |
Only 3 out of 18 studies (17%) assessed quality of life (2 studies used the PDQ‐39 and 1 study used the SF‐12 PCS and MCS (Table 3).
Eight out of 18 studies (44%) described a follow‐up assessment after study end (Table 3).
No adverse events were reported.
The trials were relatively comparable regarding patient’s characteristics (Table 1), but experimental and control interventions varied (Table 1; Table 2). E.g. some studies used a active control group doing time and dose matched gait exercises, but some did not described what was done.
Results of the search
Figure 1 shows the flow diagram for the selection of studies. The searches of the electronic databases and trials registers generated 925 unique references for screening.
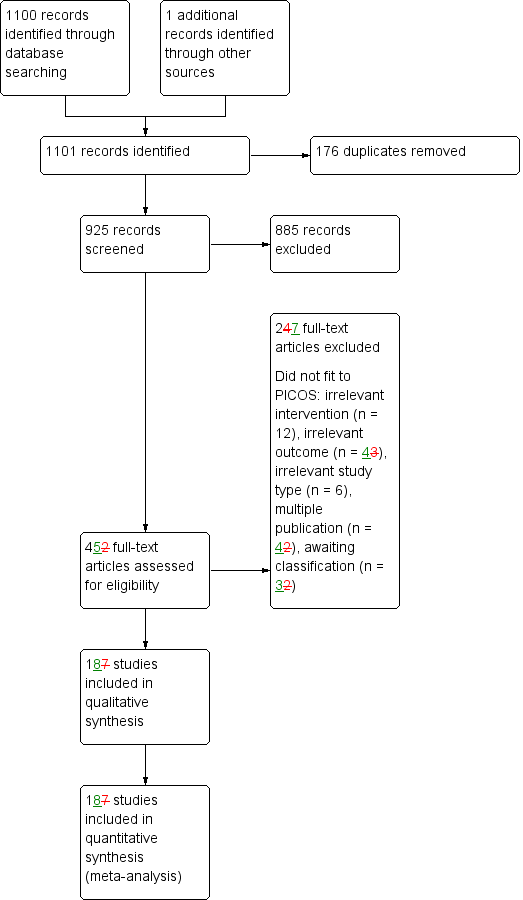
Study flow diagram.
After excluding non‐relevant citations we obtained the full texts of 45 papers; of these, we included 18 trials in the qualitative analysis and 18 trials in the quantitative analysis of the review.
Included studies
We included 18 trials involving a total of 623 participants in the quantitative analysis of this review (Bello 2013; Cakit 2007; Canning 2012; Carda 2012; Chaiwanichsiri 2011; Fisher 2008; Frazzitta 2009; Harro 2014; Kurtais 2008; Miyai 2000; Miyai 2002; Nadeau 2013; Picelli 2013; Pohl 2003; Protas 2005; Sale 2013; Shulman 2013; Yang 2010); see the Characteristics of included studies; Table 1;).
The characteristics of participants and the characteristics of the experimental interventions in the included studies are listed and described in detail in Table 1.
The included trials compared treadmill training with a variety of other interventions. We conducted a meta‐analysis of studies that measured the same treatment effect. Thus we combined treadmill training versus all other approaches as an estimate of the effect of treadmill training compared with a different treatment. However, we did not compare treadmill training type A with treadmill training type B as these are measuring different treatment effects.
Studies used a variety of primary outcomes, which are described in Characteristics of included studies.
Because only 44% of studies reported follow‐up data we did not conduct a separate analysis of ‚end‐of‐treatment’ and ‚follow‐up’ data.
Excluded studies
Six studies were excluded (Bello 2008; Fisher 2013; Ganesan 2010; Gianfrancesco 2009; Diaz de la Fe 2008; Schenkman 2012). These trials were excluded for various reasons and the details are described in Characteristics of excluded studies. If there was any doubt whether the study should be excluded or not, we retrieved the full text of the article. In cases of disagreement between the review authors, another member of the author group reviewed the information to decide on inclusion or exclusion of a study.
One ongoing study was identified. Two studies (Horak 2011; Mezzarobba 2013) are still awaiting classification and are described in Characteristics of studies awaiting classification.
Risk of bias in included studies
All details about the methodological quality are provided for each included study in Figure 2.
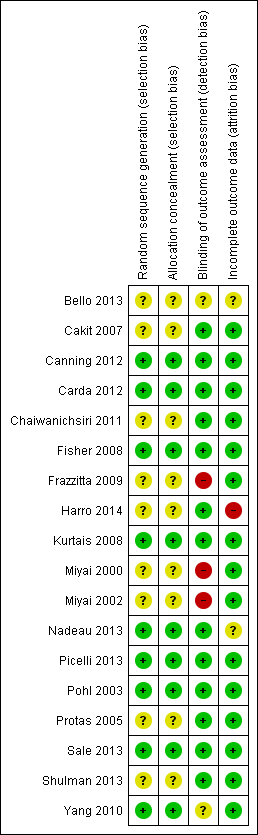
Risk of bias summary: review authors' judgements about each risk of bias item for each included study.
We wrote to the authors of all the included studies requesting (if necessary) clarification of some design features or missing information in order to complete the quality ratings. The correspondence was via email and letter, and we wrote reminders every two weeks if we did not receive an answer. The risk of bias decisions are described in the (Characteristics of included studies and Figure 2).
Allocation
Nine out of 18 studies (50%) described an appropriate random sequence generation and some studies described allocation concealment appropriately (Figure 2). No included study described an inappropriate random sequence generation or allocation concealment.
Blinding
Twelve out of 18 studies (67%) used an appropriate blinding of outcome assessors and three out of 18 studies did not blind outcome assessors (17%) for two out of 18 studies (11%) this was unclear (Figure 2).
Incomplete outcome data
Fourteen studies (83%) described outcome data appropriately (Figure 2).
Effects of interventions
See: summary of findings Table for the main comparison for the main comparison 'Treadmill training versus all other interventions'.
Treadmill training versus all other interventions (no treadmill training)
Comparison 1.1 Gait speed at the end of intervention phase (primary outcome measure)
Seventeen studies with a total of 520 participants compared treadmill training versus no treadmill training on gait speed. Treadmill training improved gait speed significantly. The pooled standardised mean difference (MD, random‐effect model) for gait speed was 0.09 m/s (95% CI 0.03 to 0.14; P = 0.001; level of heterogeneity I2 = 24%; moderate quality of evidence) at the end of the study (Analysis 1.1).
Comparison 1.1.1 Active control group
Fourteen studies with a total of 434 participants used an active control group and compared treadmill training versus no treadmill training on gait speed. Treadmill training improved gait speed significantly. The pooled standardised mean difference (MD, random‐effect model) for gait speed was 0.07 m/s (95% CI 0.03 to 0.12; P = 0.001; level of heterogeneity I2 = 2%) at the end of the study (Analysis 1.1).
Comparison 1.1.2 No intervention control group
Three studies with a total of 76 participants used no intervention in the control group and compared treadmill training versus no treadmill training on gait speed. Treadmill training did not improve gait speed significantly. The pooled standardised mean difference (MD, random‐effect model) for gait speed was 0.40 m/s (95% CI ‐0.06 to 0.87; P = 0.09; level of heterogeneity I2 = 49%) at the end of the study (Analysis 1.1).
Comparison 1.2 Stride length at the end of intervention phase (primary outcome measure)
Overall ten studies with a total of 333 participants compared treadmill training versus no treadmill training on stride length. Treadmill training improved stride length significantly. The MD (random‐effect model) for stride length was 0.05 metres (95% CI 0.01 to 0.09; P = 0.01; I2 = 0%; low quality of evidence) at the end of the study (Analysis 1.2).
Comparison 1.2.1 Active control group (co‐interventions were similar in both groups)
Nine studies with a total of 315 participants used an active control group and compared treadmill training versus no treadmill training on stride length. Treadmill training did not improve stride length significantly. The MD (random‐effect model) for stride length was 0.04 metres (95% CI 0.00 to 0.09; P = 0.05; I2 = 0%) at the end of the study (Analysis 1.2).
Comparison 1.2.2 No intervention control group (co‐interventions were not similar in both groups)
One study (Protas 2005) with 18 participants used no intervention in the control group and compared treadmill training versus no treadmill training on stride length. Treadmill training did not improve stride length significantly. The MD (random‐effect model) for stride length was 0.11 metres (95% CI ‐0.02 to 0.24; P = 0.09; I2 = not applicable) at the end of the study (Analysis 1.2).
Comparison 1.3 Walking distance at the end of intervention phase
Overall ten studies with a total of 416 participants compared treadmill training versus no treadmill training on walking distance. Treadmill training did not improve walking distance significantly. The MD (random‐effect model) for walking distance was 48.9 metres (95% CI ‐1.32 to 99.1; P = 0.06; I2 = 91%; very low quality of evidence) at the end of the study (Analysis 1.3).
It should be noted however that the described effect (treadmill training on walking distance) is mainly due to one trial (Cakit 2007), additionally the results for walking distance are very heterogeneous due to this trial (Cakit 2007). After leaving out the study by (Cakit 2007) there would be no effect: The MD (random‐effect model) for walking distance would be 8 metres (95% CI ‐3 to 20; P = 0.05; I2 = 0%).
Comparison 1.3.1 Active control group (co‐interventions were similar in both groups)
Nine studies with a total of 385 participants used an active control group and compared treadmill training versus no treadmill training on walking distance. Treadmill training did not improve walking distance significantly. The MD (random‐effect model) for walking distance was 9.48 metres (95% CI ‐0.47 to 19.42; P = 0.06; I2 = 0%) at the end of the study (Analysis 1.3).
Comparison 1.3.2 No intervention control group (co‐interventions were not similar in both groups)
One study (Cakit 2007) with 31 participants used no intervention in the control group and compared treadmill training versus no treadmill training on walking distance. Treadmill training improve walking distance significantly. The MD (random‐effect model) for walking distance was 364 metres (95% CI 294 to 434; P < 0.00001; I2 = not applicable) at the end of the study (Analysis 1.3).
Comparison 1.4 Cadence at the end of intervention phase
Overalls, ten studies with a total of 336 participants compared treadmill training versus no treadmill training on cadence. Treadmill training did not improve cadence significantly. The MD (random‐effect model) for cadence was 2.16 steps per minute (95% CI ‐0.13 to 4.46; P = 0.07; I2 = 17%; low quality of evidence) at the end of the study (Analysis 1.4).
Comparison 1.4.1 Active control group (co‐interventions were similar in both groups)
Nine studies with a total of 318 participants used an active control group and compared treadmill training versus no treadmill training on cadence. Treadmill training did improve cadence significantly. The MD (random‐effect model) for cadence was 2.42 steps per minute (95% CI 0.07 to 4.77; P = 0.04; I2 = 19%) at the end of the study (Analysis 1.4).
Comparison 1.4.2 No intervention control group (co‐interventions were not similar in both groups)
One study (Protas 2005) with 18 participants used no intervention in the control group and compared treadmill training versus no treadmill training on cadence. Treadmill training did not improve cadence significantly. The MD (random‐effect model) for cadence was ‐4 steps per minute (95% CI ‐15.11 to 7.11; P = 0.48; I2 = not applicable) at the end of the study (Analysis 1.4).
Comparison 1.5 Acceptability and safety at the end of intervention phase
All 18 trials, with a total of 633 participants, reported drop‐out rates. We pooled the reported drop outs from all causes during the trial period. The use of treadmill training in patients with PD did not increase the risk of participants dropping out (risk difference (RD) (random‐effects model) ‐0.02; 95% CI ‐0.06 to 0.02; P = 0.32; I2 = 13%; moderate quality of evidence). No adverse events were reported in included studies (Analysis 1.5).
It should be noted that the acceptability might be influenced by one trial (Cakit 2007), however this study contributes to this analysis only by 2.9% (weight) (Analysis 1.5).
Comparison 1.5.1 Active control group (co‐interventions were similar in both groups)
15 trials, with a total of 531 participants used an active control group and reported drop‐out rates. We pooled the reported drop outs from all causes during the trial period. The use of treadmill training in patients with PD did not increase the risk of participants dropping out (risk difference (RD) (random‐effects model) ‐0.01; 95% CI ‐0.05 to 0.03; P = 0.66; I2 = 0%). No adverse events were reported in included studies (Analysis 1.5).
Comparison 1.5.2 No intervention control group (co‐interventions were not similar in both groups)
Three trials, with a total of 102 participants used no intervention in the control group and reported drop‐out rates. We pooled the reported drop outs from all causes during the trial period. The use of treadmill training in patients with PD did not increase the risk of participants dropping out (risk difference (RD) (random‐effects model) ‐0.14; 95% CI ‐0.43 to 0.16; P = 0.37; I2 = 79%). No adverse events were reported in included studies (Analysis 1.5).
Comparison 2.1: Sensitivity analysis by trial methodology
To test the robustness of the main results we used for our planned sensitivity analysis subgroups of the methodological features of randomisation, concealment of allocation, and blinding of assessors (Analysis 2.1).
To examine the robustness of results, we specified variables in a sensitivity analysis that we believed could influence the size of effect observed (method of randomisation, concealed allocation and blinding of assessors; Analysis 2.1).
-
Including only studies with described method of randomisation analysis
Eight trials with a total of 237 patients described a method of randomisation analysis. Treadmill training did improve gait speed. The pooled mean difference (MD, random‐effects model) for gait speed was 0.08; 95% confidence interval (CI) 0.02 to 0.13; P = 0.006; level of heterogeneity I2= 0%) at the end of study (Analysis 2.1).
-
Including only studies with adequate concealed allocation for the primary outcome gait speed
Eight trials with a total of 237 patients with adequate concealment of allocation were included. Treadmill training did improve gait speed. The pooled mean difference (MD, random‐effects model) for gait speed was 0.08 95% confidence interval (CI) 0.02 to 0.13; P = 0.006; level of heterogeneity I2= 0%) at the end of study (Analysis 2.1).
-
Including only studies with blinded assessors for the primary outcome gait speed
Twelve trials with a total of 375 patients described a blinded assessor for the primary outcome gait speed. Treadmill training did improve gait speed. The pooled mean difference (MD, random‐effects model) for gait speed was 0.07; 95% confidence interval (CI) 0.00 to 0.13; P = 0.04; level of heterogeneity I2= 31%) at the end of study (Analysis 2.1).
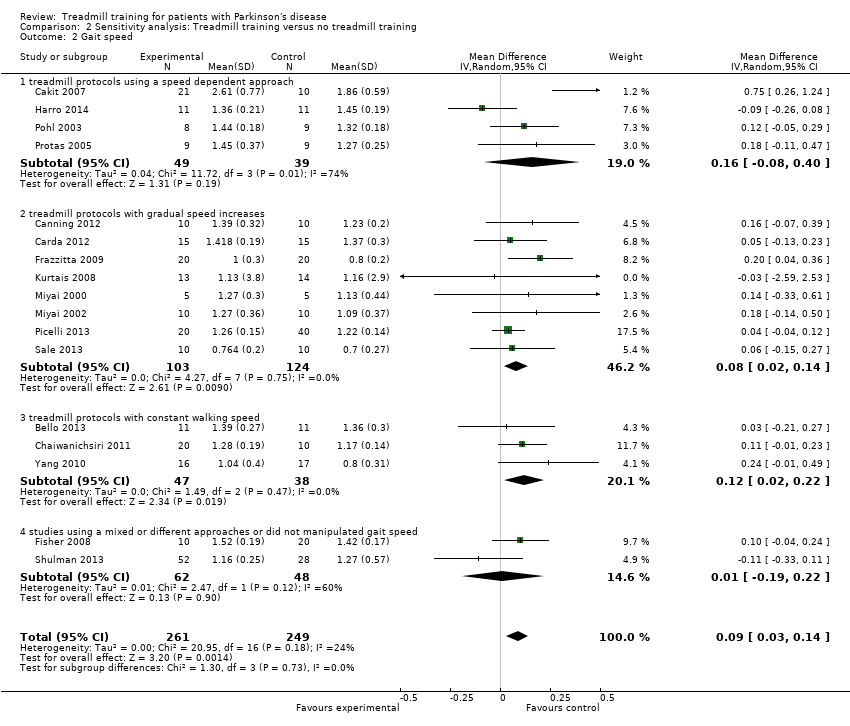
Comparison 2. 2: Sensitivity analysis by treadmill protocol used (gait speed increments)
To test the robustness of the main results we used for our second sensitivity analysis subgroups of the treadmill protocols used in studies (speed dependent approach, gradually increases of gait speed, constant gait speed or mixed) (Analysis 2.2).
To examine the robustness of results, we categorised variables in this second sensitivity analysis that we believed could influence the size of effect observed (treadmill protocols used in studies Analysis 2.2).
-
Including only studies with speed dependent approach
Four trials with a total of 88 patients described a speed dependent approach. Treadmill training did not improve gait speed. The pooled mean difference (MD, random‐effects model) for gait speed was 0.16; 95% confidence interval (CI) ‐0.08 to 0.40; P = 0.19; level of heterogeneity I2= 74%) at the end of study (Analysis 2.2).
It should be noted however that the described effect might be affected by one trial (Harro 2014). This trial investigated a very small contrast between groups because in the experimental as in the control group a speed dependent approach was used (see Table 1 and Table 2). After leaving out the study by (Harro 2014) the effect would be (MD (random‐effect model) for gait speed would be higher (not significant) 0.27 m/s (95% CI ‐0.02 to 0.56; P = 0.06; and less heterogenous with I2 = 64%).
-
Including only studies with gradual gait speed increases
Eight trials with a total of 227 patients described a treadmill protocol with gradual increases of gait speed. Treadmill training did improve gait speed. The pooled mean difference (MD, random‐effects model) for gait speed was 0.08 95% confidence interval (CI) 0.02 to 0.14; P = 0.009; level of heterogeneity I2= 0%) at the end of study (Analysis 2.2).
-
Including only studies with constant gait speed
Three trials with a total of 85 patients described a treadmill protocol with constant gait speed. Treadmill training did improve gait speed. The pooled mean difference (MD, random‐effects model) for gait speed was 0.12; 95% confidence interval (CI) 0.02 to 0.22; P = 0.02; level of heterogeneity I2= 0%) at the end of study (Analysis 2.2).
-
Including only studies with a mixed or different gait speed approaches used
Two trials with a total of 110 patients described a treadmill protocol with mixed or different approaches. Treadmill training did not improve gait speed. The pooled mean difference (MD, random‐effects model) for gait speed was 0.01; 95% confidence interval (CI) ‐0.19 to 0.22; P = 0.90; level of heterogeneity I2= 60%) at the end of study (Analysis 2.2).
Subgroup analysis
Although initially planned, we decided to do only one sensitivity analysis (Analysis 2.2) instead of a formal subgroup analysis, due to limited number of studies and limited detailed information (Differences between protocol and review).
Discussion
Summary of main results
The aim of this review, which included 18 trials with a total of 623 participants, was to evaluate the effects of treadmill training on gait in patients with PD. We found evidence that the use of treadmill training may improve gait parameters, such as gait speed and stride length, of patients with PD at Hoehn Yahr stages one to three. However, walking distance and cadence did not improve [BJ1] significantly. Additionally, it is not known how long gait improvements after treadmill training may last. Adverse events and drop‐outs did not occur more frequently in people receiving treadmill training than control interventions and were not judged to be clinically serious adverse events.
Overall completeness and applicability of evidence
The results of this review seem to be quite generalisable to both in and outpatient settings in industrialised countries. More specifically our results may not apply to an assumed average older patient with Parkinson's disease or patients with Hoehn & Yahr stages higher than 3. The results may therefore not be broadly generalisable to more severe or older patients. There are factors producing uncertainty for generalisations:
1. The investigated study population was quite heterogeneous (e.g. stage of disease, age, duration of illness, and walking ability).
2. The investigated experimental and control conditions were heterogeneous (e.g. type of training, frequency and duration of training; some studies had no real 'active' control group and some compared treadmill training with no active therapy).
Hence, the results may be of limited applicability for all people with PD.
One potential limitation could be that only gait parameters were considered in this update of our review. More general patient‐reported scales as UPDRS, quality of life scales (e.g. PDQ‐39) and health economics outcomes were not included neither in our protocol for this review (Mehrholz 2009) nor in this update of our review. The inclusion of such an analysis may be interesting, but would be beyond the scope of this update. Additionally the analysis of outcomes other than gait parameters was hardly possible because only a small amount of studies used such scales (e.g. only 4 out of 18 included studies described UPDRS total scores and subscale scores at baseline and at study end ; see Table 3). Eventually, the results of this review are only applicable to gait parameters of people with PD. However, gait hypokinesia is one of the primary movement disorders associated with PD(Morris 2000) and an important determinant of activities and quality of life in mild to moderate Parkinson disease (Muslimovic 2008).
We were not able to find any description of adverse events of treadmill training. It is not clear whether adverse events were not reported or did not occur.
The lack of long‐term follow‐up in more than the half of included trials might be a crucial point, but PD is a progressive condition and therefore benefits are not expected to be longlasting (Table 3). The small but clinical benefit may well have disappeared by after 3 to 12 months. However, from the results of our review it is unclear how much of the short term benefit will lasting for how long. Studies investigating the lasting of effects of treadmill training or studies of re‐intervention are therefore warranted.
Quality of the evidence
We presented the quality of evidence for our outcomes in summary of findings Table for the main comparison.
We found heterogeneity between the trials in terms of trial design (two, three, or four arms; parallel group or cross‐over trial; duration of follow up; selection criteria for patients), characteristics of the
therapy interventions (especially frequency and duration of intervention), and participant characteristics (Hoehn Yahr severity at baseline), but it is not clear whether this limited the quality of the evidence.
Although the methodological quality of the included trials seemed generally good to moderate (Figure 2), trials investigating treadmill training are subject to potential methodological limitations; for example;
inability to blind the therapist and participants, so‐called contamination (provision of the intervention to the control group) and co‐intervention (when the same therapist unintentionally provides additional care to either treatment or comparison group). All these potential methodological limitations introduce the possibility of performance bias, even though not supported by our sensitivity analyses of methodological quality (Analysis 2.1).
Potential biases in the review process
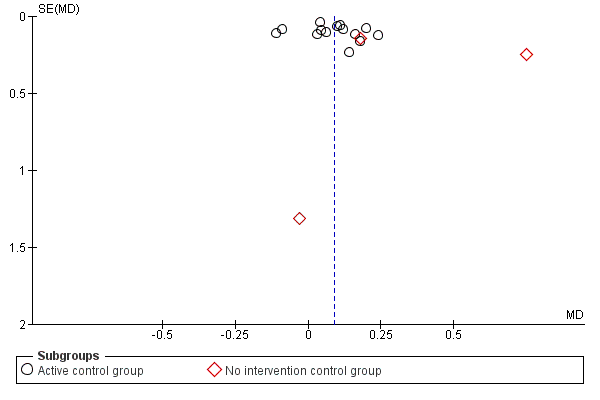
A risk of publication bias is present in all systematic reviews. However, we searched extensively for relevant literature in databases and trial registers and handsearched reference lists and conference abstracts. Additionally, we contacted and asked authors, trialists and experts in the field for information on other unpublished and ongoing trials. No statistical or graphical evidence for publication bias has been found (Figure 3 and Figure 4).

Funnel plot of comparison: 1 Treadmill training versus no treadmill training or active control intervention or gait training, outcome: 1.1 Gait speed at the end of the study.

Funnel plot of comparison: 1 Treadmill training versus no treadmill training or active control intervention or gait training, outcome: 1.2 stride length (at the end of study; all studies).
One could argue that the clinical diversity of included trials with respect to duration and frequency of intervention and content of the control group could compromise a pooled analysis. The analyses of the primary outcome however did not reveal statistically heterogeneity (Analysis 1.1). Lastly, our aim was to provide a systematic overview about the current evidence and decided to pool the data of all available trials in a formal meta‐analysis.
The exclusion of patient groups, such as those with unstable cardiovascular conditions, cognitive and communication deficits and a limited range of joint motion at the start of the intervention may limit applicability of the findings to these groups.
However, using the results from the primary outcomes it is possible to explore the apparent effectiveness of treadmill training for improving gait in patients with PD. It might be important to consider that treadmill training might be just one way to apply many repetitions of gait cycles. However, one could argue that the gait training provided by a treadmill will lead to better results because people are forced to use higher gait speeds than over ground, as recently shown in one included study. In this study of Pohl and co‐workers, patients with PD were able to walk up to three times faster on a treadmill than over ground (Pohl 2003). Gait training on a treadmill could be seen as a 'forced‐use‐therapy, because patients are forced to use faster gait cycles and therefore higher velocities as they would self‐select over ground.
The trials included explored quite different training programs and used different intensities and doses of therapy (see Table 1). For example one could argue, that the studies of Pohl 2003 and Cakit 2007 and also Harro 2014 and Protas 2005 are somewhat different from all other included trials, because a rigorous and systematic speed increments approach was used (see Table 1).
These trials were therefore somewhat different in terms of duration of training and intensity of training and effect. For instance the investigators of the Cakit 2007 trial used a speed depended treadmill approach with increments of belt speed until the highest walking speed at which the patient could walk safely (similar to the 'speed‐depended walking' approach as described firstly in Pohl 2003) and trained patients for eight weeks. The study of Cakit 2007 is therefore, compared to all other studies very long and used a very intensive training paradigm. It is therefore that this at most lasting and very intensive training program results in the largest effects compared to all other studies(see Analysis 1.1; see Table 1 and Table 2)
However after excluding the studies of Pohl 2003 and Cakit 2007 from the pooled analysis (not figured), our main effects for gait speed were still present. According to our predefined inclusion and exclusion criteria (Mehrholz 2009), and in an effort to find all randomised controlled trials on treadmill training, we decided to include these studies.
We analysed only the type of treadmill protocol used in studies as part of an analysis to explore the influence of the intensity of treadmill training. The influence of specific training parameters such duration, frequency, and intensity of treadmill training on the gait parameters of patients with PD will be the subject of further evaluation in our next update, when more studies are available.
Treadmill training has the potential to increase the number of repetitions of practice. It is important to mention however that not all of the included studies had an active control group with matched number of repetitions of practice as in the experimental group. Also the co‐interventions varied greatly. In one study it was unclear what intervention the control group received (Cakit 2007). One could argue that these variations in the control interventions would lead to bias and may therefore overestimate the effect sizes, which seems clinically meaningful.
We were not aware of missing data and analysed the available data according to the Cochrane Handbook (chapter 16.1.2 General principles for dealing with missing data). We described the risk of bias due to missing data in Risk of bias in included studies (see also Figure 2). We assumed that if missing data have occurred that these data missing was at random. It is not clear how this can the results of our review biased.
Agreements and disagreements with other studies or reviews
At the time of writing the protocol for this Cochrane review we were not aware of any systematic reviews about the topic (Mehrholz 2009). However, we have found a review by Herman et al which included randomised controlled and non‐controlled studies on treadmill training in PD (Herman 2008). Although Herman et al gave a comprehensive overview of all the randomised studies we found, a pooled analysis for a possible treatment effect was not done. Additionally, descriptions of patient acceptance and side effects of treadmill training in PD were not conveniently provided. According to our protocol (Mehrholz 2009), and with the intention of reducing possible sources of bias, we only included randomised controlled trials.
The authors of the review of Herman 2008 reached in the end the conclusion that 'high quality randomized controlled studies are needed before TT can be recommended with evidence based support'. Our review from 2014 includes now 18 RCTs and more than 50% of them have a low risk of bias. We might conclude based on relatively precise estimators that there is evidence that the use of treadmill training in patients with PD may improve gait parameters such as gait speed, stride length and walking distance.
Another review about physiotherapy intervention in Parkinson's disease by Tomlinson 2012 found and described the effects of eight studies compared to 18 studies in our review. The authors included in their quantitative analysis (about the effects of treadmill training) three studies with only 56 patients and estimated the treatment effect of treadmill training on gait speed with a mean difference of 0.04 m/s (Tomlinson 2012). In our review we, however, included 18 trials with 623 patients and reached a more precise effect estimation compared to (Tomlinson 2012).
The authors of the review of Tomlinson 2012 concluded that most of the observed differences between the treatments were small or for some outcomes (e.g. velocity), the differences observed were at, or approaching, what are considered minimally clinical important changes. Our conclusions are in the same line: the effect of treadmill training on gait speed might be considered as minimally clinical important. For example the benefit in walking speed of treadmill training over no or no active control intervention was a large and clinical important difference of 0.4 m/s (mainly due to Cakit 2007), while the benefit in walking speed of treadmill training over 'conventional physiotherapy' was 0.07 m/s. The latter benefit is quite lower but still a minimal clinical important difference. Eventually, this benefit is observed both with and without gait training in the control group.
Whereas benefits of gait speed can be considered to be close to the minimally clinical important difference, it should be argued that such small change in gait speed would not be automatically be seen as relevant to the general public, administrators and policy makers though.
Another up to date Cochrane review about physical therapies versus active interventions (Tomlinson 2014) should also be mentioned here. This review investigated physiotherapy interventions and rated all interventions into one of the six categories (general physiotherapy, exercise, treadmill training, cueing, dance and martial arts). On the one hand the review of Tomlinson 2014 used compared to our review a greater gamut of outcome measures e.g. UPDRS and quality of life measures and described not just gait parameters as we did. On the other, we found and included seven randomised controlled trials more (Bello 2013; Canning 2012; Carda 2012; Harro 2014; Sale 2013; Shulman 2013; Pohl 2003) than the group of Tomlinson et al. about treadmill training (six out of these seven RCTs were not found with their search). We believe therefore that our review is more specific and used a more sensitive search.
This update of our Cochrane review seems therefore to our knowledge the most up to date systematic review about treadmill training in people with PD with a pooled estimate of treatment effects and patient acceptance.
Additionally our review seems to have the most robust and strongest recommendations for treadmill training for patients with PD so far.

Study flow diagram.

Risk of bias summary: review authors' judgements about each risk of bias item for each included study.
Funnel plot of comparison: 1 Treadmill training versus no treadmill training or active control intervention or gait training, outcome: 1.1 Gait speed at the end of the study.

Funnel plot of comparison: 1 Treadmill training versus no treadmill training or active control intervention or gait training, outcome: 1.2 stride length (at the end of study; all studies).

Comparison 1 Treadmill training versus no treadmill training or active control intervention or gait training, Outcome 1 Gait speed at the end of the study.

Comparison 1 Treadmill training versus no treadmill training or active control intervention or gait training, Outcome 2 stride length (at the end of study; all studies).

Comparison 1 Treadmill training versus no treadmill training or active control intervention or gait training, Outcome 3 walking distance in m (at the end of study; all studies).

Comparison 1 Treadmill training versus no treadmill training or active control intervention or gait training, Outcome 4 cadence (at the end of study; all studies).
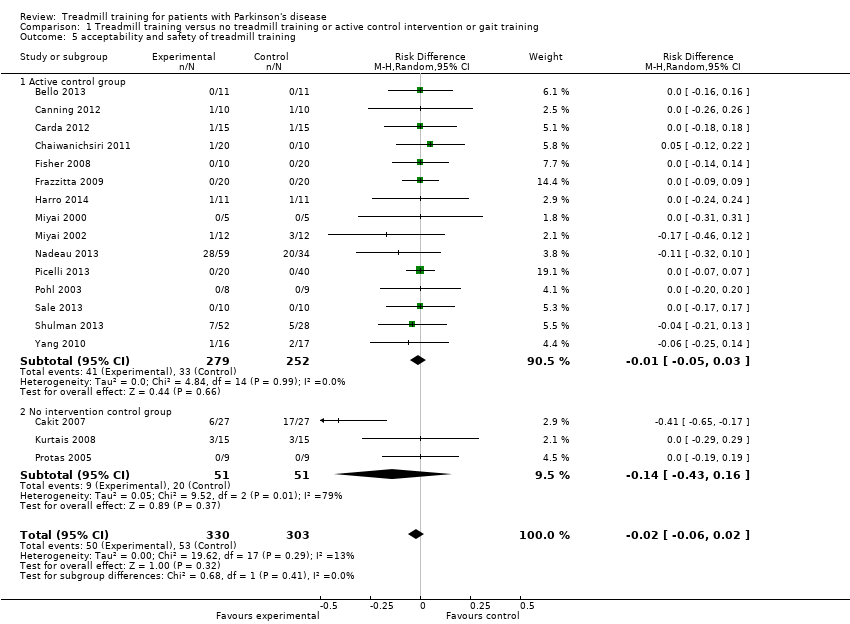
Comparison 1 Treadmill training versus no treadmill training or active control intervention or gait training, Outcome 5 acceptability and safety of treadmill training.

Comparison 2 Sensitivity analysis: Treadmill training versus no treadmill training, Outcome 1 Gait speed.
Comparison 2 Sensitivity analysis: Treadmill training versus no treadmill training, Outcome 2 Gait speed.
| Treadmill training versus no treadmill training or active control intervention or gait training for patients with Parkinson's disease | ||||||
| Patient or population: patients with patients with Parkinson's disease | ||||||
| Outcomes | Illustrative comparative risks* (95% CI) | Relative effect | No of Participants | Quality of the evidence | Comments | |
| Assumed risk | Corresponding risk | |||||
| Control | Treadmill training versus no treadmill training or active control intervention or gait training | |||||
| Gait speed at the end of the study ‐ Active control group (co‐interventions were similar in both groups) | The mean gait speed at the end of the study ‐ active control group (co‐interventions were similar in both groups) in the control groups was | The mean gait speed at the end of the study ‐ active control group (co‐interventions were similar in both groups) in the intervention groups was | 434 | ⊕⊕⊕⊝ | ||
| Gait speed at the end of the study ‐ No interventioncontrol group (co‐interventions were not similar in both groups) | The mean gait speed at the end of the study ‐ no intervention control group (co‐interventions were not similar in both groups) in the control groups was | The mean gait speed at the end of the study ‐ no intervention control group (co‐interventions were not similar in both groups) in the intervention groups was | 76 | ⊕⊝⊝⊝ | ||
| walking distance in m (at the end of study; all studies) ‐ Active control group (co‐interventions were similar in both groups) | The mean walking distance in m (at the end of study; all studies) ‐ active control group (co‐interventions were similar in both groups) in the control groups was | The mean walking distance in m (at the end of study; all studies) ‐ active control group (co‐interventions were similar in both groups) in the intervention groups was | 385 | ⊕⊕⊝⊝ | ||
| walking distance in m (at the end of study; all studies) ‐ No intervention control group (co‐interventions were not similar in both groups) | The mean walking distance in m (at the end of study; all studies) ‐ no intervention control group (co‐interventions were not similar in both groups) in the control groups was | The mean walking distance in m (at the end of study; all studies) ‐ no intervention control group (co‐interventions were not similar in both groups) in the intervention groups was | 31 | See comment | ||
| acceptability and safety of treadmill training ‐ Active control group (co‐interventions were similar in both groups) | Study population | See comment | 531 | ⊕⊕⊕⊝ | Risks were calculated from pooled risk differences | |
| 131 per 1000 | 122 per 1000 | |||||
| Moderate | ||||||
| 0 per 1000 | 0 per 1000 | |||||
| acceptability and safety of treadmill training ‐ No intervention control group (co‐interventions were not similar in both groups) | Study population | See comment | 102 | ⊕⊕⊝⊝ | Risks were calculated from pooled risk differences | |
| 392 per 1000 | 255 per 1000 | |||||
| Moderate | ||||||
| 200 per 1000 | 130 per 1000 | |||||
| *The basis for the assumed risk (e.g. the median control group risk across studies) is provided in footnotes. The corresponding risk (and its 95% confidence interval) is based on the assumed risk in the comparison group and the relative effect of the intervention (and its 95% CI). | ||||||
| GRADE Working Group grades of evidence | ||||||
| 1 Final values reported | ||||||
| Study ID | Age, mean (SD) EXP | Age, mean (SD) CON | Hoehn & Yahr stages | mean Duration of disease EXP | mean Duration of disease CON | female/male EXP | female/male CON | Duration of therapy | frequency of training | intensity of training in terms of minutes per session | intensity of training in terms of treadmill speed paradigm |
| 60 (11) | 58 (9) | 1 to 3 | 5 years | 5 years | 4/7 | 5/6 | 5 weeks | 3 times a week | 16' with increments of 4 ' per week | constant and as individually preferred speed | |
| 72 (6)* | 1 to 2 | 6 years* | 15/16* | 8 weeks | not described | 30 | relatively similar to so called speed dependent treadmill approach (Pohl 2002) | ||||
| 61 (6) | 63 (10) | 1 to 2 | 6 years | 6 years | 5/5 | 4/6 | 6 weeks | 4 times a week | 20‐40 | gradually increased speed | |
| 61 (6) | 63 (10) | 1 to 2 | 6 years | 5 years | not described | 6 weeks | 4 times a week | 30 | high, (80% of max), gradually increased | ||
| 68 (5) | 69 (5) | 2 to 3 | 6 years | 4 years | 0/10 | 0/10 | 4 weeks | 3 times a week | 20 | slightly higher than preferred | |
| 64 (15) | 62 (10) | 1 to 2 | 1 year | 1 year | 4/6 | 13/7 | 8 weeks | 3 times a week | 45 | progression of speed in high intensity group/ and low to moderate progression of speed in low intensity group | |
| 71 (8) | 71 (7) | 3 | 13 years | 13 years | 12/8 | 11/9 | 4 weeks | 7 times a week | 20 | 60% of max speed at start, then gradually increased | |
| 65 (9) | 67 (11) | 1 to 3 | 4 years | 9 years | 5/5 | 2/8 | 6 weeks | 3 times a week | 30 | both groups received speed training relatively similar to so called speed dependent approach (Pohl 2002) | |
| 64 (11) | 66 (5) | mean 2.2 to 2.5 | 5 years | 5 years | 7/5 | 5/7 | 6 weeks | 3 times a week | 40 | gradually increased speed | |
| 67 (2)* | 2.5 to 3 | 4 years* | 5/5* | 4 weeks | 3 times a week | 36‐45 | gradually increased speed | ||||
| 70 (2) | 70 (2) | 2.5 to 3 | 4 years | 4.5 years | 6/5 | 4/5 | 4 weeks | 3 times a week | 45 | gradually increased speed | |
| 62 (7) | 64 (6) | 1 to 2 | Not reported | 2/9 | 5/18 | 24 weeks | 3 times a week | 60 | gradually increased speed | ||
| 69 (8) | 68 (9) | 3 | 7 years | 7 years | 14/6 | 23/17 | 4 weeks | 3 times a week | 30 | gradually increased speed | |
| 61 (9) | 61 (9) | 1 to 2.5 | 3 years | 3 years | 3/5 | 2/7 | 1 session | N.a. | 30 | similar to so called speed dependent treadmill approach (Pohl 2002) | |
| 71 (7) | 74 (9) | 2 to 3 | 7 years | 8 years | not described | 8 weeks | 3 times a week | 30 | relatively similar to so called speed dependent treadmill approach (Pohl 2002) | ||
| 68 (9) | 70 (10) | 2.5 to 3.5 | 9 years | 8 years | 5/5 | 6/4 | 4 weeks | 5 times a week | 45 | gradually increased speed | |
| 66 (10) | 65 (11) | 2 to 3 | 6 years | 6 years | 17/32 | 4/18 | 12 weeks | 3 times a week | 30‐50 | no clear speed increases but depending on maximal heart reserve speed was increased | |
| 68 (8) | 66 (11) | 1 to 3 | 5 years | 5 years | 6/9 | 8/7 | 4 weeks | 3 times a week | 30 | constant, comfortable speed | |
| * information not available by group | |||||||||||
| Study ID | active treatment | no interventions | gait training | control group |
| yes | yes | overground gait training, 3 times a week for 5 weeks (72 min a week) | ||
| yes | not described further | |||
| yes | usual care including advice to maintain usual physical activity levels | |||
| yes | yes | robotic gait training, 3 times a week for 4 weeks (120 min a week) | ||
| yes | yes | home walking program, 6 times a week for 4 weeks (180 min a week) | ||
| yes | 1 | (2) low‐intensity group: general or traditional physiotherapy, for 24 sessions in 8 weeks (3) zero‐intensity (no‐exercise) group: six 1 hour education class over 8 weeks | ||
| yes | 1 | traditional rehabilitation with visual and auditory cues, 7 times a week for 4 weeks (140 min a week) | ||
| yes | yes | 6 weeks rhythmic auditory‐cueing with incremental speed increases in small groups of five participants, 30 minutes a session, not described how often a week | ||
| yes | not further described by the authors | |||
| yes | 4 weeks conventional physiotherapy, 45 minutes a day, 3 days a week | |||
| yes | 4 weeks conventional physiotherapy, 45 minutes a day, 3 days a week, with a total of 12 sessions | |||
| yes | low exercise intensity training in seated position, 3 times a week for 24 weeks (180 min a week) | |||
| yes | yes | 3 arms:(1) robotic gait training group, twelve, 45‐min sessions, three days a week for 4 consecutive weeks (3) Physical Therapy group, twelve, 45‐min sessions, three days a week for 4 consecutive weeks | ||
| yes | yes | 4 arms(3) physiotherapy group: 1 session physiotherapy including gait training, 30 minutes (4) control group: resting in a chair for 30 minutes | ||
| yes | no training | |||
| yes | yes | robot‐assisted gait training (device: G‐EO), 5 times a week for 4 weeks (225 min a week) | ||
| yes | stretching and resistance training, 3 times a week for 12 weeks (duration of sessions not described) | |||
| yes | conventional therapy, 3 times a week for 4 weeks (90 min a week) |
| Study ID | U PDRS at baseline | UPDRS at study end | QoL at baseline | Follow‐Up |
| UPDRS motor score | UPDRS motor score | ‐ | no | |
| UPDRS motor score | ‐ | ‐ | no | |
| UPDRS motor score | UPDRS motor score | PDQ‐39 | after 6 weeks | |
| UPDRS motor score | UPDRS motor score | SF‐12 PCS and MCS | after 3, 6 months | |
| ‐ | ‐ | ‐ | after 1 months | |
| UPDRS (total and subscales) | UPDRS (total and subscales) | ‐ | no | |
| UPDRS motor score | ‐ | ‐ | no | |
| ‐ | ‐ | ‐ | 3mo | |
| ‐ | ‐ | ‐ | no | |
| UPDRS (total and subscales) | UPDRS (total and subscales) | ‐ | no | |
| UPDRS (total and subscales) | UPDRS (total and subscales) | ‐ | after 2,3,4,5 and 6 months | |
| UPDRS (total and subscales) | UPDRS (total and subscales) | PDQ‐39 | after 6 months | |
| UPDRS (total) | UPDRS (total) | ‐ | 3 months | |
| UPDRS (total and subscales) | ‐ | ‐ | no | |
| ‐ | ‐ | ‐ | no | |
| UPDRS (total and subscales) | ‐ | ‐ | no | |
| UPDRS (total and subscales) | ‐ | ‐ | no | |
| ‐ | ‐ | ‐ | after 1 months |
| Outcome or subgroup title | No. of studies | No. of participants | Statistical method | Effect size |
| 1 Gait speed at the end of the study Show forest plot | 17 | 510 | Mean Difference (IV, Random, 95% CI) | 0.09 [0.03, 0.14] |
| 1.1 Active control group | 14 | 434 | Mean Difference (IV, Random, 95% CI) | 0.07 [0.03, 0.12] |
| 1.2 No intervention control group | 3 | 76 | Mean Difference (IV, Random, 95% CI) | 0.40 [‐0.06, 0.87] |
| 2 stride length (at the end of study; all studies) Show forest plot | 10 | 333 | Mean Difference (IV, Random, 95% CI) | 0.05 [0.01, 0.09] |
| 2.1 Active control group | 9 | 315 | Mean Difference (IV, Random, 95% CI) | 0.04 [0.00, 0.09] |
| 2.2 No intervention control group | 1 | 18 | Mean Difference (IV, Random, 95% CI) | 0.11 [‐0.02, 0.24] |
| 3 walking distance in m (at the end of study; all studies) Show forest plot | 10 | 416 | Mean Difference (IV, Random, 95% CI) | 48.91 [‐1.32, 99.14] |
| 3.1 Active control group | 9 | 385 | Mean Difference (IV, Random, 95% CI) | 9.48 [‐0.47, 19.42] |
| 3.2 No intervention control group | 1 | 31 | Mean Difference (IV, Random, 95% CI) | 364.0 [294.45, 433.55] |
| 4 cadence (at the end of study; all studies) Show forest plot | 10 | 336 | Mean Difference (IV, Random, 95% CI) | 2.16 [‐0.13, 4.46] |
| 4.1 Active control group | 9 | 318 | Mean Difference (IV, Random, 95% CI) | 2.42 [0.07, 4.77] |
| 4.2 No intervention control group | 1 | 18 | Mean Difference (IV, Random, 95% CI) | ‐4.0 [‐15.11, 7.11] |
| 5 acceptability and safety of treadmill training Show forest plot | 18 | 633 | Risk Difference (M‐H, Random, 95% CI) | ‐0.02 [‐0.06, 0.02] |
| 5.1 Active control group | 15 | 531 | Risk Difference (M‐H, Random, 95% CI) | ‐0.01 [‐0.05, 0.03] |
| 5.2 No intervention control group | 3 | 102 | Risk Difference (M‐H, Random, 95% CI) | ‐0.14 [‐0.43, 0.16] |
| Outcome or subgroup title | No. of studies | No. of participants | Statistical method | Effect size |
| 1 Gait speed Show forest plot | 17 | Mean Difference (IV, Random, 95% CI) | Subtotals only | |
| 1.1 All studies | 16 | 488 | Mean Difference (IV, Random, 95% CI) | 0.10 [0.05, 0.15] |
| 1.2 All studies with random allocation | 8 | 237 | Mean Difference (IV, Random, 95% CI) | 0.08 [0.02, 0.13] |
| 1.3 all studies with concealed allocation | 8 | 237 | Mean Difference (IV, Random, 95% CI) | 0.08 [0.02, 0.13] |
| 1.4 All studies with blinded assessors | 12 | 375 | Mean Difference (IV, Random, 95% CI) | 0.07 [0.00, 0.13] |
| 2 Gait speed Show forest plot | 17 | 510 | Mean Difference (IV, Random, 95% CI) | 0.09 [0.03, 0.14] |
| 2.1 treadmill protocols using a speed dependent approach | 4 | 88 | Mean Difference (IV, Random, 95% CI) | 0.16 [‐0.08, 0.40] |
| 2.2 treadmill protocols with gradual speed increases | 8 | 227 | Mean Difference (IV, Random, 95% CI) | 0.08 [0.02, 0.14] |
| 2.3 treadmill protocols with constant walking speed | 3 | 85 | Mean Difference (IV, Random, 95% CI) | 0.12 [0.02, 0.22] |
| 2.4 studies using a mixed or different approaches or did not manipulated gait speed | 2 | 110 | Mean Difference (IV, Random, 95% CI) | 0.01 [‐0.19, 0.22] |