| Heated CO2 with or without humidification for laparoscopic abdominal surgery |
| Patient or population: Laparoscopic abdominal surgery (pain score)
Setting: Hospital
Intervention: Heated gas
Comparison: Cold gas |
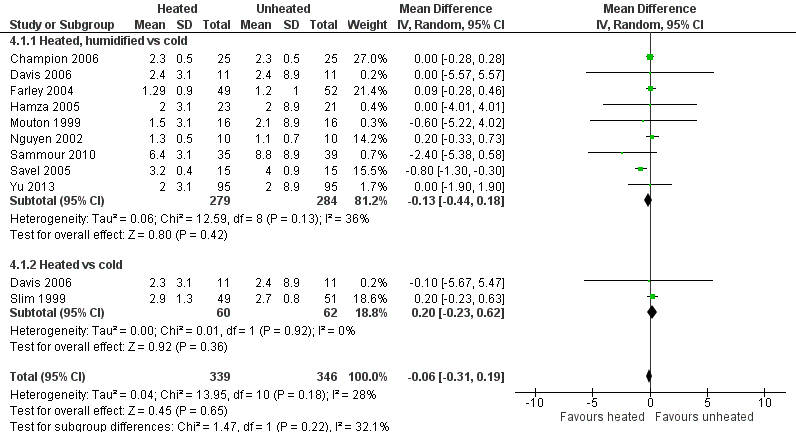
| Day 1 pain score (0 to 10‐point VAS) | The mean day 1 pain score was 2.8 | The mean day 1 pain score in the intervention group was 0.04 fewer (‐0.42 to 0.34) | 991
(14 RCTs) | ⨁⨁◯◯
LOW 1 2 | Higher score indicates more pain for participants |
| Day 1 pain score: heated, humidified vs cold (abdominal) | The mean day 1 pain score: heated, humidified vs cold (abdominal) was 4 | The mean day 1 pain score: heated, humidified vs cold (abdominal) in the intervention group was 0.14 fewer (‐0.6 to 0.33) | 670
(10 RCTs) | ⨁⨁◯◯
LOW 1 2 | |
| Day 1 pain score: heated, humidified vs cold (shoulder) | The mean day 1 pain score: heated, humidified vs cold (shoulder) was 2 | The mean day 1 pain score: heated, humidified vs cold (shoulder) in the intervention group was 0.35 fewer (‐1.75 to 1.05) | 171
(3 RCTs) | ⨁◯◯◯
VERY LOW 1 2 4 | |
| Day 1 pain score: heated only vs cold | The mean day 1 pain score: heated vs cold was 2.8 | The mean day 1 pain score: heated vs cold in the intervention group was 0.5 more (‐0.11 to 1.12) | 150
(3 RCTs) | ⨁⨁⨁◯
MODERATE 1 | |
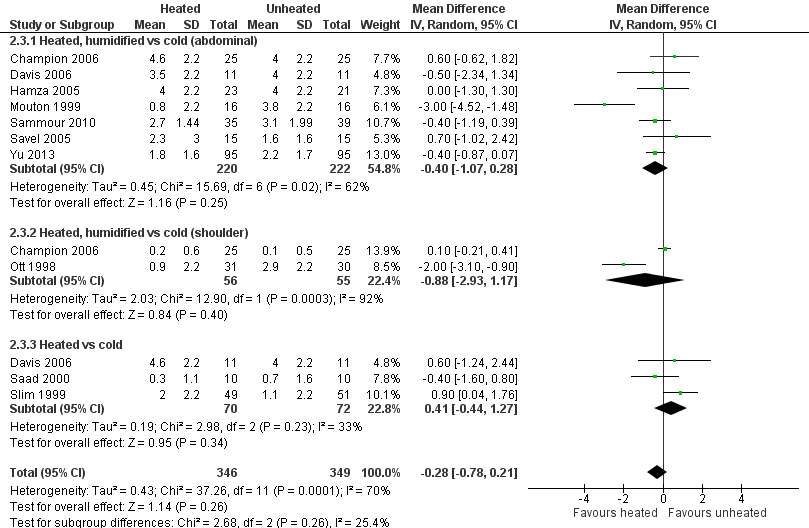
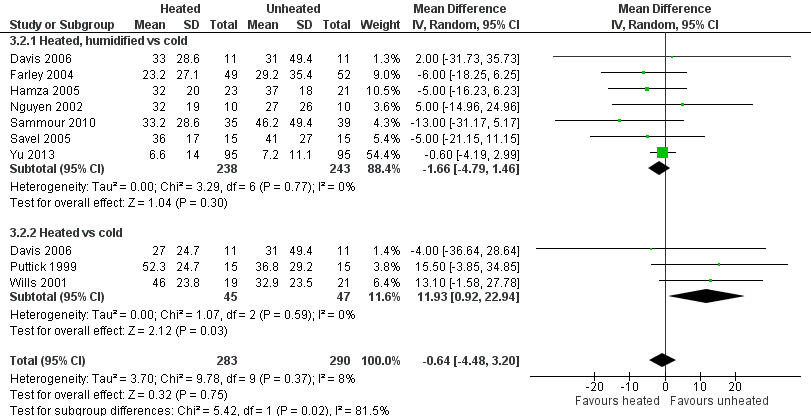
| Day 2 pain score | The mean day 2 pain score was 2.2 | The mean day 2 pain score in the intervention group was 0.28 fewer (‐0.78 to 0.21) | 695
(10 RCTs) | ⨁⨁◯◯
LOW 1 2 | |
| Day 2 pain score: heated, humidified vs cold (abdominal) | The mean day 2 pain score: heated, humidified vs cold (abdominal) was 3.2 | The mean day 2 pain score: heated, humidified vs cold (abdominal) in the intervention group was 0.4 fewer (‐1.07 to 0.28) | 442
(7 RCTs) | ⨁⨁◯◯
LOW 1 2 | |
| Day 2 pain score: heated, humidified vs cold (shoulder) | The mean day 2 pain score: heated, humidified vs cold (shoulder) was 1.5 | The mean day 2 pain score: heated, humidified vs cold (shoulder) in the intervention group was 0.88 fewer (‐2.93 to 1.17) | 111
(2 RCTs) | ⨁◯◯◯
VERY LOW 1 2 4 | |
| Day 2 pain score: heated only vs cold | The mean day 2 pain score: heated vs cold was 1.9 | The mean day 2 pain score: heated vs cold in the intervention group was 0.41 more (‐0.44 to 1.27) | 142
(3 RCTs) | ⨁⨁◯◯
LOW 1 2 | |
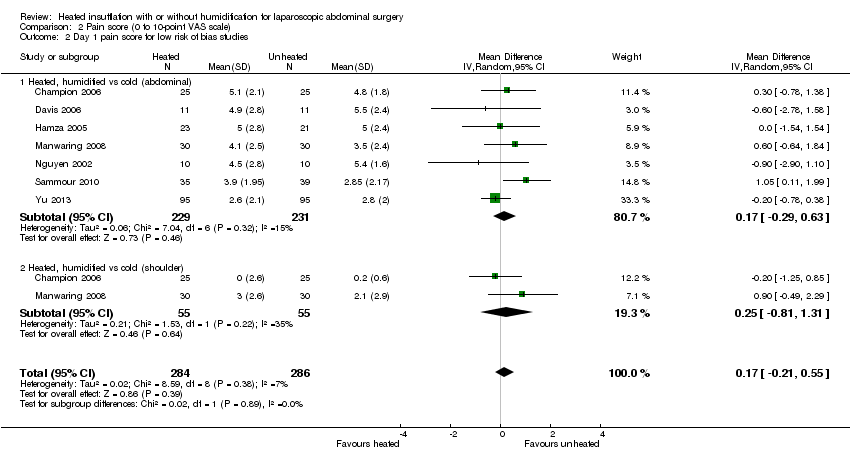
| Day 1 pain score for low risk of bias studies | The mean day 1 pain score for low risk of bias studies was 2.7 | The mean day 1 pain score for low risk of bias studies in the intervention group was 0.17 more (‐0.21 to 0.55) | 570
(7 RCTs) | ⨁⨁⨁⨁
HIGH3 | |
| Day 1 pain score for low risk of bias studies: heated, humidified vs cold (abdominal) | The mean day 1 pain score for low risk of bias studies: heated, humidified vs cold (abdominal) was 4.3 | The mean day 1 pain score for low risk of bias studies: heated, humidified vs cold (abdominal) in the intervention group was 0.17 more (‐0.29 to 0.63) | 460
(7 RCTs) | ⨁⨁⨁⨁
HIGH3 | |
| Day 1 pain score for low risk of bias studies: heated, humidified vs cold (shoulder) | The mean day 1 pain score for low risk of bias studies: heated, humidified vs cold (shoulder) was 1.2 | The mean day 1 pain score for low risk of bias studies: heated, humidified vs cold (shoulder) in the intervention group was 0.25 more (‐0.81 to 1.31) | 110
(2 RCTs) | ⨁⨁⨁◯
MODERATE 4 | |
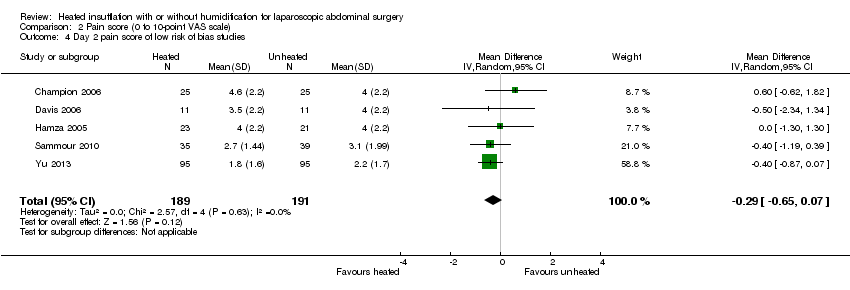
| Day 2 pain score for low risk of bias studies | The mean day 2 pain score for low risk of bias studies was 3.5 | The mean day 2 pain score for low risk of bias studies in the intervention group was 0.29 fewer (‐0.65 to 0.07) | 380
(5 RCTs) | ⨁⨁⨁⨁
HIGH3 | |
| *The risk in the intervention group (and its 95% confidence interval) is based on the assumed risk in the comparison group and the relative effect of the intervention (and its 95% CI).
CI: Confidence interval; RR: Risk ratio; OR: Odds ratio; |
| GRADE Working Group grades of evidence
High quality: We are very confident that the true effect lies close to that of the estimate of the effect
Moderate quality: We are moderately confident in the effect estimate: The true effect is likely to be close to the estimate of the effect, but there is a possibility that it is substantially different
Low quality: Our confidence in the effect estimate is limited: The true effect may be substantially different from the estimate of the effect
Very low quality: We have very little confidence in the effect estimate: The true effect is likely to be substantially different from the estimate of effect |