Chlorpromazine dose for people with schizophrenia
Abstract
Background
The World Health Organization (WHO) Model Lists of Essential Medicines lists chlorpromazine as one of its five medicines used in psychotic disorders.
Objectives
To determine chlorpromazine dose response and dose side‐effect relationships for schizophrenia and schizophrenia‐like psychoses.
Search methods
We searched the Cochrane Schizophrenia Group’s Study‐Based Register of Trials (December 2008; 2 October 2014; 19 December 2016).
Selection criteria
All relevant randomised controlled trials (RCTs) comparing low doses of chlorpromazine (≤ 400 mg/day), medium dose (401 mg/day to 800 mg/day) or higher doses (> 800 mg/day) for people with schizophrenia, and which reported clinical outcomes.
Data collection and analysis
We included studies meeting review criteria and providing useable data. Review authors extracted data independently. For dichotomous data, we calculated fixed‐effect risk ratios (RR) and their 95% confidence intervals (CIs). For continuous data, we calculated mean differences (MD) and their 95% CIs based on a fixed‐effect model. We assessed risk of bias for included studies and graded trial quality using GRADE (Grading of Recommendations Assessment, Development and Evaluation).
Main results
As a result of searches undertaken in 2014, we found one new study and in 2016 more data for already included studies. Five relevant studies with 1132 participants (585 are relevant to this review) are now included. All are hospital‐based trials and, despite over 60 years of chlorpromazine use, have durations of less than six months and all are at least at moderate risk of bias. We found only data on low‐dose (≤ 400 mg/day) versus medium‐dose chlorpromazine (401 mg/day to 800 mg/day) and low‐dose versus high‐dose chlorpromazine (> 800 mg/day).
When low‐dose chlorpromazine (≤ 400 mg/day) was compared to medium‐dose chlorpromazine (401 mg/day to 800 mg/day), there was no clear benefit of one dose over the other for both global and mental state outcomes (low‐quality and very low‐quality evidence). There was also no clear evidence for people in one dosage group being more likely to leave the study early, over the other dosage group (moderate‐quality evidence). Similar numbers of participants from each group experienced agitation and restlessness (very low‐quality evidence). However, significantly more people in the medium‐dose group (401 mg/day to 800 mg/day) experienced extrapyramidal symptoms in the short term (2 RCTS, n = 108, RR 0.47, 95% CI 0.30 to 0.74, moderate‐quality evidence). No data for death were available.
When low‐dose chlorpromazine (≤ 400 mg/day) was compared to high‐dose chlorpromazine (> 800 mg/day), data from one study with 416 patients were available. Clear evidence of a benefit of the high dose was found with regards to global state. The low‐dose group had significantly fewer people improving (RR 1.13, 95% CI 1.01 to 1.25, moderate‐quality evidence). There was also a marked difference between the number of people leaving the study from each group for any reason, with significantly more people leaving from the high‐dose group (RR 0.60, 95% CI 0.40 to 0.89, moderate‐quality evidence). More people in the low‐dose group had to leave the study due to deterioration in behaviour (RR 2.70, 95% CI 1.34 to 5.44, low‐quality evidence). There was clear evidence of a greater risk of people experiencing extrapyramidal symptoms in general in the high‐dose group (RR 0.43, 95% CI 0.32 to 0.59, moderate‐quality evidence). One death was reported in the high‐dose group yet no effect was shown between the two dosage groups (RR 0.33, 95% CI 0.01 to 8.14, moderate‐quality evidence). No data for mental state were available.
Authors' conclusions
The dosage of chlorpromazine has changed drastically over the past 50 years with lower doses now being the preferred of choice. However, this change was gradual and arose not due to trial‐based evidence, but due to clinical experience and consensus. Chlorpromazine is one of the most widely used antipsychotic drugs yet appropriate use of lower levels has come about after many years of trial and error with much higher doses. In the absence of high‐grade evaluative studies, clinicians have had no alternative but to learn from experience. However, such an approach can lack scientific rigor and does not allow for proper dissemination of information that would assist clinicians find the optimum treatment dosage for their patients. In the future, data for recently released medication should be available from high‐quality trials and studies to provide optimum treatment to patients in the shortest amount of time.
PICO
Plain language summary
Chlorpromazine dose for people with schizophrenia
Review question
This review looks at the best dose of chlorpromazine for treating people with schizophrenia.
Background
Schizophrenia is a serious mental illness affecting around 1% of the adult population worldwide. People with schizophrenia often hear voices or see things (hallucinations) and have strange beliefs (delusions). The main treatment for these symptoms of schizophrenia are antipsychotic drugs. Chlorpromazine was one of the first antipsychotic drugs discovered to be effective in the treatment of schizophrenia during the 1950s. It still remains one of the most commonly used and inexpensive treatments even today. However, it also has serious side effects, such as blurred vision, a dry mouth, tremors or uncontrollable shaking, depression, muscle stiffness and restlessness.
Study characteristics
An updated search for relevant randomised controlled trials was run in October 2014, and again, in December 2016 and found one new study. Five studies have now been found that meet the review inclusion criteria. The included studies are all randomised, and investigate the effects of giving different doses of chlorpromazine to people with schizophrenia. The total number of participants was 585.
Key results
Chlorpromazine showed different effects at varying doses. Based on weak evidence, the effects on people’s mental health at low dosage and medium dosage are much the same. However, there are more side effects at medium dose. There is more improvement in people’s mental health at high dose compared to low dose. However, side effects are much more numerous and debilitating at high dose. In the past fifty years, low dose has been the favoured amount to use with patients. This change has come about gradually and is based on everyday experience and consensus rather than hard scientific evidence. Chlorpromazine is low‐cost and widely available. Despite its many side effects, chlorpromazine is likely to remain a benchmark or ‘gold standard’ drug and one of the most widely used treatments for schizophrenia worldwide.
Quality of the evidence
All trials in the review are hospital‐ based and all but one date from 20 years ago. There are a limited number of studies of limited quality and these are poorly reported and short term. Further research and trials on chlorpromazine dose are justified.
Ben Gray, Senior Peer Researcher, McPin Foundation. http://mcpin.org/
Authors' conclusions
Summary of findings
| CHLORPROMAZINE LOW DOSE (≤ 400 mg/day) compared to MEDIUM DOSE (401 mg/day to 800 mg/day) for people with schizophrenia | |||||
| Patient or population: people with schizophrenia | |||||
| Outcomes | Illustrative comparative risks* (95% CI) | Relative effect | No of Participants | Quality of the evidence | |
| Assumed risk | Corresponding risk | ||||
| MEDIUM DOSE (401‐800 mg/day) | CHLORPROMAZINE LOW DOSE (≤ 400 mg/day) | ||||
| Global state: no improvement ‐ short term | Low1 | RR 0.83 | 60 | ⊕⊝⊝⊝ | |
| 100 per 1000 | 83 per 1000 | ||||
| Moderate1 | |||||
| 200 per 1000 | 166 per 1000 | ||||
| High1 | |||||
| 300 per 1000 | 249 per 1000 | ||||
| Global state: needing additional medication (sedation with chloral hydrate or a barbiturate > 5 times) ‐ medium term | Low1 | RR 3.09 | 50 | ⊕⊕⊝⊝ | |
| 20 per 1000 | 62 per 1000 | ||||
| Moderate1 | |||||
| 60 per 1000 | 185 per 1000 | ||||
| High1 | |||||
| 100 per 1000 | 309 per 1000 | ||||
| Mental state: average endpoint score (PANSS total, high=poor) | The mean mental state: average endpoint score (PANSS total, high = poor) in the intervention groups was | 60 | ⊕⊝⊝⊝ | ||
| Leaving the study early ‐ any reason | Low1 | RR 1.06 | 70 | ⊕⊕⊕⊝ | |
| 50 per 1000 | 53 per 1000 | ||||
| Moderate1 | |||||
| 100 per 1000 | 106 per 1000 | ||||
| High1 | |||||
| 150 per 1000 | 159 per 1000 | ||||
| Behaviour: agitation and restlessness ‐ medium term (categorised as adverse event) | Study population | RR 1.59 | 50 | ⊕⊝⊝⊝ | |
| 0 per 1000 | 0 per 1000 | ||||
| Moderate | |||||
| 0 per 1000 | 0 per 1000 | ||||
| Adverse effects: extrapyramidal symptoms (unspecified extrapyramidal symptoms ‐ short term) | Low | RR 0.47 | 108 | ⊕⊕⊕⊝ | |
| 200 per 1000 | 94 per 1000 | ||||
| Moderate | |||||
| 500 per 1000 | 235 per 1000 | ||||
| High | |||||
| 800 per 1000 | 376 per 1000 | ||||
| Adverse event: death | No trial reported this outcome | ||||
| *The basis for the assumed risk (e.g. the median control group risk across studies) is provided in footnotes. The corresponding risk (and its 95% confidence interval) is based on the assumed risk in the comparison group and the relative effect of the intervention (and its 95% CI). | |||||
| GRADE Working Group grades of evidence | |||||
| 1 Indirectness: rated serious: downgraded by 1 ‐ unclear if clinically important improvement, no prespecified medium‐term data available. | |||||
| CHLORPROMAZINE LOW DOSE (≤ 400 mg/day) compared to HIGH DOSE (> 800 mg/day‐ all medium term) for people with schizophrenia | ||||||
| Patient or population: patients with people with schizophrenia | ||||||
| Outcomes | Illustrative comparative risks* (95% CI) | Relative effect | No of Participants | Quality of the evidence | Comment | |
| Assumed risk | Corresponding risk | |||||
| HIGH DOSE (>800 mg/day‐ all medium term) | CHLORPROMAZINE LOW DOSE (≤ 400 mg/day) | |||||
| Global state: no clinically important improvement ‐ medium term | Low1 | RR 1.13 | 416 | ⊕⊕⊕⊝ | ||
| 300 per 1000 | 339 per 1000 | |||||
| Moderate1 | ||||||
| 700 per 1000 | 791 per 1000 | |||||
| High1 | ||||||
| 900 per 1000 | 1000 per 1000 | |||||
| Global state: requiring additional medication (sedation with chloral hydrate or a barbiturate > 5 times) | See comment | See comment | Not estimable | 0 | See comment | No data available |
| Mental state: no clinically important change in mental state | See comment | See comment | Not estimable | 0 | See comment | No data available |
| Leaving the study early ‐ any reason | Low1 | RR 0.60 | 416 | ⊕⊕⊕⊝ | ||
| 100 per 1000 | 60 per 1000 | |||||
| Moderate1 | ||||||
| 250 per 1000 | 150 per 1000 | |||||
| High1 | ||||||
| 500 per 1000 | 300 per 1000 | |||||
| Behaviour: deterioration of behaviour (categorised as reason to leave early) | Low | RR 2.70 | 416 | ⊕⊕⊝⊝ | ||
| 20 per 1000 | 54 per 1000 | |||||
| Moderate | ||||||
| 50 per 1000 | 135 per 1000 | |||||
| High | ||||||
| 100 per 1000 | 270 per 1000 | |||||
| Adverse effects: unspecified extrapyramidal symptoms | Low | RR 0.43 | 416 | ⊕⊕⊕⊝ | ||
| 200 per 1000 | 86 per 1000 | |||||
| Moderate | ||||||
| 500 per 1000 | 215 per 1000 | |||||
| High | ||||||
| 700 per 1000 | 301 per 1000 | |||||
| Adverse event: death | Low | RR 0.33 | 416 | ⊕⊕⊕⊝ | ||
| 0 per 1000 | 0 per 1000 | |||||
| Moderate | ||||||
| 5 per 1000 | 2 per 1000 | |||||
| High | ||||||
| 50 per 1000 | 17 per 1000 | |||||
| *The basis for the assumed risk (e.g. the median control group risk across studies) is provided in footnotes. The corresponding risk (and its 95% confidence interval) is based on the assumed risk in the comparison group and the relative effect of the intervention (and its 95% CI). | ||||||
| GRADE Working Group grades of evidence | ||||||
| 1 Risk of bias: rated serious: downgraded by 1 ‐ randomisation not described well, no mention of allocation concealment, concern regarding selective reporting. 2Indirectness: rated serious: downgraded by 1 ‐ unclear if clinically important change in behaviour, rated within trial as leaving the study early outcome. | ||||||
Background
Description of the condition
Schizophrenia is a severe mental illness comprising a range of different symptoms that vary greatly between individuals (Weinberger 2011). Typical symptoms include hallucinations (perceptions without external stimuli), delusions (fixed false beliefs and ideas), disorders of thinking, as well as changes in emotion and behaviour (Barbato 1998). People with schizophrenia may recover fully (20%), have recurrences (60%) or have a longer‐term illness (20%), (WHO 2001). About one per cent of people will experience at least one schizophrenic episode with two thirds of them going on to suffer later episodes. Twenty‐six million people in the world are affected by schizophrenia with over 50% not receiving appropriate treatment (MHF 2014).
Description of the intervention
Chlorpromazine is a drug from the phenothiazine group originally developed in the 1950s as an antihistamine to be used in anaesthesia (chemical name: 3‐(2‐chloro‐10H‐phenothiazin‐10‐yl)‐N,N‐dimethyl‐propan‐1‐amine; formula C17H19ClN2S ‐ Figure 1). Calming effects were noted and later tested. Being the first effective antipsychotic drug, referred to as ‘psychic penicillin', it greatly reduced the number of people admitted to asylums. It also transformed the way people with schizophrenia were cared for after 1956 (Turner 2007). At present, the World Health Organization (WHO) Model Lists of Essential Medicines lists chlorpromazine as one of five medicines used in psychotic disorders (WHO 2013).

Chlorpromazine structure
How the intervention might work
There are many theories about the causes of schizophrenia involving neurotransmitters and neuronal pathways. However, the most fixed theory would be the dopamine hypothesis: excess dopamine activity in the mesolimbic pathway (Bazire 2014). Hyperactivity of dopaminergic pathways would result in positive symptoms such as hallucinations and delusions while hypo‐activity would cause negative symptoms like cognitive dysfunctions and altered mood (Weinberger 2001).
All antipsychotic drugs act as a dopamine D2 receptor antagonist. However, as chlorpromazine is a first‐generation antipsychotic, these D2 receptors are blocked far more permanently than the newer, atypical antipsychotics. This leads to extrapyramidal side effects such as tardive dyskinesia, tremor, akinesia, etc. (Seeman 2002). Chlorpromazine is not selective and so will block the four alternative dopamine pathways as well as ones involving other neurotransmitters (BNF 2014). Many of the side effects can be attributed to chlorpromazine blocking these neurotransmitter receptors.
Why it is important to do this review
Chlorpromazine is a well‐established antipsychotic treatment. This old drug remains a ‘benchmark’ for the treatment of schizophrenia (Bazire 2014).
Newer antipsychotics are more expensive than drugs such as chlorpromazine and are less accessible. There is no definite evidence that the newer antipsychotics are a more effective treatment yet they are believed to cause fewer extrapyramidal symptoms (Geddes 2000). However, these findings may be biased because they are compared to doses of traditional antipsychotics that are far higher than recommended (Leucht 2003).
Little research is being done regarding optimum doses of traditional antipsychotics. These drugs do not provide the opportunity of patenting and hence are not studies for which large pharmaceutical industries would consider funding or encourage further investigations. The benefits of antipsychotic must plateau above a certain dose, yet the adverse effects will continue to accrue as doses increase. This exact ranges for many antipsychotic drugs are still debated (Bollini 1994), and so, reviewing the best evidence on comparisons for these drugs is important.
Objectives
To determine chlorpromazine dose response and dose side‐effect relationships for schizophrenia and schizophrenia‐like psychoses.
Methods
Criteria for considering studies for this review
Types of studies
All relevant randomised control trials. We excluded quasi‐randomised trials, such as those where allocation is undertaken on alphabetical order. If a trial had been described as double‐blinded, but it was implied it had been randomised, we would have included these trials in a Sensitivity analysis. Randomised cross‐over studies were eligible for inclusion, but if identified, we would only have included data up to the point of first cross‐over because of the likely carry‐over effects of treatments.
Types of participants
People with schizophrenia and other types of schizophrenia‐like psychoses (schizophreniform and schizoaffective disorders). There is no clear evidence that the schizophrenia‐like psychoses are caused by fundamentally different pathophysiologic processes or require different treatments (Carpenter 1994).
Types of interventions
Chlorpromazine alone; given in any dose irrespective of the administration method. We predefined the dosage categories as follows.
1. Chlorpromazine: 0 mg to 400 mg/day (low dose)
2. Chlorpromazine: 401 mg to 800 mg/day (medium dose)
3. Chlorpromazine: higher than 800 mg/day (high dose)
Types of outcome measures
Where possible, we divided outcomes into three groups: short term (up to 12 weeks), medium term (13 to 26 weeks) and long term (over 26 weeks).
Primary outcomes
1. Global state: No clinically important improvement in global state (as defined by individual studies) at medium term
2. Adverse effects: Extrapyramidal side effects (specifically pseudoparkinsonism, tardive dyskinesia and neuroleptic malignant syndrome) at long term.
Secondary outcomes
1. Global state
1.1 Relapse (as defined by the individual studies)
1.2 No clinically important improvement in global state (as defined by individual studies) at short and long term
1.3 Average endpoint global state score
1.4 Average change in global state scores
1.5 Needing additional medication
1.6 Healthy days
2. Mental state (with particular reference to the positive and negative symptoms of schizophrenia)
2.1 No clinically important change in general mental state
2.2 Average endpoint general mental state score
2.3 Average change in general mental state scores
2.4 No clinically important change in specific symptoms (positive and negative symptoms of schizophrenia)
2.5 Average endpoint specific symptom score
2.6 Average change in specific symptom scores
3. Leaving the studies early
3.1 Inefficacy of treatment
3.2 Disabling adverse effects
3.3 Any reason provided
3.4 Others
4. General functioning
4.1 No clinically important change in general functioning
4.2 Average endpoint general functioning score
4.3 Average change in general functioning scores
4.4 No clinically important change in specific aspects of functioning, such as social or life skills
4.5 Average endpoint specific aspects of functioning, such as social or life skills
4.6 Average change in specific aspects of functioning, such as social or life skills
5. Behaviour
5.1 No clinically important change in general behaviour
5.2 Average endpoint general behaviour score
5.3 Average change in general behaviour scores
5.4 No clinically important change in specific aspects of behaviour
5.5 Average endpoint specific aspects of behaviour
5.6 Average change in specific aspects of behaviour
6. Quality of life/satisfaction with treatment
6.1 No clinically important change in general quality of life
6.2 Average endpoint general quality of life score
6.3 Average change in general quality of life scores
7. Cognitive functioning
7.1 No clinically important change in overall cognitive functioning
7.2 Average endpoint of overall cognitive functioning score
7.3 Average change of overall cognitive functioning scores
8. Service use
8.1 Number of participants hospitalised
8.2 Time to hospitalisation
9. Adverse effects
9.1 Number of participants with at least one adverse effect
9.2 Clinically important specific adverse effects (cardiovascular, ocular, haematological, hepatic, gastrointestinal, genitourinary, endocrine and metabolic, dermatologic, and central nervous system disorders)
9.3 Average endpoint in specific adverse effects
9.4 Average change in specific adverse effects
9.5 Use of any drugs for adverse effects
9.6 Death
10. Economic (cost of care)
11. 'Summary of findings' table
We used the GRADE approach to interpret findings (Schünemann 2008; Schünemann 2011) and used the GRADE profiler to import data from Review Manager 5 (RevMan) to create 'Summary of findings' tables. These tables provide outcome‐specific information concerning the overall quality of evidence from each included study in the comparison, the magnitude of effect of the interventions examined, and the sum of available data on all outcomes we rated as important to patient‐care and decision making. We selected the following main outcomes for inclusion in the summary of findings table.
1. Global state: no clinically important improvement in global state (as defined by individual studies) at medium term.
2. Global state: needing additional medication.
3. Mental state: no clinically important change in general mental state (as defined by individual studies).
4. Leaving the study early.
5. Behaviour: no clinically important change in general behaviour (as defined by individual studies) at long term.
6. Adverse effects: important movement disorder (as defined by individual studies).
7. Adverse effects: death.
Search methods for identification of studies
For previous searches, please see also Appendix 1.
Electronic searches
Cochrane Schizophrenia Group’s Study‐Based Register of Trials
On December 19, 2016, the Information Specialist searched the register using the following search strategy.
Dosage ‐ Chlorpromazine in Intervention Field of STUDY
In such study‐based register, searching the major concept retrieves all the synonyms and relevant studies because all the studies have already been organised based on their interventions and linked to the relevant topics.
This register is compiled by systematic searches of major resources (including AMED, BIOSIS, CINAHL, Embase, MEDLINE, PsycINFO, PubMed, and registries of clinical trials) and their monthly updates, handsearches, grey literature, and conference proceedings (see Group’s Module). There is no language, date, document type, or publication status limitations for inclusion of records into the register.
Searching other resources
1. Reference lists
We searched all references of articles selected for inclusion for further relevant trials.
2. Personal contact
If required, we contacted the first author of each included study for information regarding unpublished trials and noted response or non‐response in Characteristics of included studies
Data collection and analysis
For previous data collection and analysis methods please see Appendix 2.
Selection of studies
For the 2016 and 2014 searches, review author KD independently inspected citations from the new electronic search and identified relevant abstracts. KD also inspected full articles of the abstracts meeting inclusion criteria.
Data extraction and management
1. Extraction
For the 2016 and 2014 searches, review author KD extracted data from new included studies. KD extracted data presented only in graphs and figures whenever it was possible. When further information was necessary, KD contacted authors of studies in order to obtain missing data or for clarification. If studies were multi‐centre, where possible, KD extracted data relevant to each component centre separately.
2. Management
2.1 Forms
We extracted data onto standard, simple forms.
2.2 Scale‐derived data
We included continuous data from rating scales only if:
a. the psychometric properties of the measuring instrument had been described in a peer‐reviewed journal (Marshall 2000); and
b. the measuring instrument had not been written or modified by one of the trialists for that particular trial; or
c) the instrument should be a global assessment of an area of functioning and not subscores which are not, in themselves, validated or shown to be reliable.
However there are exceptions, we included subscores from mental state scales measuring positive and negative symptoms of schizophrenia.
Ideally, the measuring instrument was either i. a self‐report or ii. completed by an independent rater or relative (not the therapist). We realised that this was not often reported clearly; we have noted whether or not this was the case in Description of studies.
2.3 Endpoint versus change data
There are advantages of both endpoint and change data. Change data can remove a component of between‐person variability from the analysis. On the other hand, calculation of change needs two assessments (baseline and endpoint), which can be difficult in unstable and difficult to measure conditions such as schizophrenia. We decided primarily to use endpoint data, and only use change data if the former were not available. We combined endpoint and change data in the analysis as we used mean differences (MD) rather than standardised mean differences (SMD) throughout (Deeks 2011).
2.4 Skewed data
Continuous data on clinical and social outcomes are often not normally distributed. To avoid the pitfall of applying parametric tests to non‐parametric data, we applied the following standards.
For change data
-
We entered change data, as when continuous data are presented on a scale that included a possibility of negative values (such as change data), it was difficult to tell whether data were skewed or not. We presented and entered change data into statistical analyses.
For endpoint data from studies < 200 participants
-
When a scale starts from the finite number 0, we subtracted the lowest possible value from the mean, and divided this by the standard deviation (SD). If this value is lower than 1, it strongly suggests a skew, and we would exclude such data. If this ratio is higher than 1 but below 2, there is a suggestion of skew. We would enter such data and test whether its inclusion or exclusion changes the results substantially. Finally, if the ratio is larger than 2, we would include such data because skew is less likely (Altman 1996; Higgins 2011).
-
If a scale started from a positive value (such as the Positive and Negative Syndrome Scale (PANSS), which could have values from 30 to 210) (Kay 1986), we modified the calculation described above to take into account the scale starting point. In such cases skew is present if 2 SD > (S ‐ S min), where S was the mean score and S min was the minimum score.
(Please note, irrespective of the above rules, we planned to enter endpoint data from studies of at least 200 participants in the analysis because skewed data pose less of a problem in large studies).
2.5 Common measure
To facilitate comparison between trials, we planned to convert variables that can be reported in different metrics, such as days in hospital (mean days per year, per week or per month) to a common metric (e.g. mean days per month).
2.6 Conversion of continuous to binary
Where possible, we made efforts to convert outcome measures to dichotomous data. This was done by identifying cut‐off points on rating scales and dividing participants accordingly into 'clinically improved' or 'not clinically improved'. It is generally assumed that if there is a 50% reduction in a scale‐derived score such as the Brief Psychiatric Rating Scale (BPRS, Overall 1962) or the Positive and Negative Syndrome Scale (PANSS, Kay 1986), this could be considered as a clinically significant response (Leucht 2005; Leucht 2005a). If data based on these thresholds were not available, we used the primary cut‐off presented by the original authors.
2.7 Direction of graphs
Where possible, we entered data in such a way that the area to the left of the line of no effect indicated a favourable outcome for chlorpromazine dose. If keeping to this was not possible, we reported data where the left of the line indicates an unfavourable outcome and noted this on the graph.
Assessment of risk of bias in included studies
For the 2016 and 2014 updates, KD worked independently by using criteria described in the Cochrane Handbook for Systematic Reviews of Interventions (Higgins 2011a) to assess trial quality. This new set of criteria is based on evidence of associations between overestimate of effect and high risk of bias of the article such as sequence generation, allocation concealment, blinding, incomplete outcome data and selective reporting.
Where inadequate details of randomisation and other characteristics of trials were provided, we contacted authors of the studies in order to obtain additional information.
We noted the level of risk of bias in both the text of the review and in the summary of findings Table for the main comparison and the summary of findings Table 2.
Measures of treatment effect
1. Binary data
For binary outcomes we calculated a standard estimation of the risk ratio (RR) and its 95% confidence interval (CI). It has been shown that RR is more intuitive (Boissel 1999) than odds ratios and that odds ratios tend to be interpreted as RR by clinicians (Deeks 2000). The Number Needed to Treat/Harm (NNT/H) statistic with its confidence intervals is intuitively attractive to clinicians but is problematic both in its accurate calculation in meta‐analyses and interpretation (Hutton 2009). For binary data presented in the 'Summary of findings' table/s, where possible, we calculated illustrative comparative risks.
2. Continuous data
For continuous outcomes, we estimated mean difference (MD) between groups. We preferred not to calculate effect size measures (standardised mean difference SMD). However, if scales of very considerable similarity had been used, we would have presumed there was a small difference in measurement, and we would have calculated the effect size and transformed the effect back to the units of one or more of the specific instruments.
Unit of analysis issues
1. Cluster trials
Studies increasingly employ 'cluster randomisation' (such as randomisation by clinician or practice), but analysis and pooling of clustered data poses problems. Authors often fail to account for intra‐class correlation in clustered studies, leading to a 'unit of analysis' error (Divine 1992) whereby P values are spuriously low, confidence intervals unduly narrow and statistical significance overestimated. This causes type I errors (Bland 1997; Gulliford 1999).
If we had found cluster trials not accounted for in primary studies, we would have presented data in a table, with a (*) symbol to indicate the presence of a probable unit of analysis error. If such trials are identified in subsequent versions of this review, we will attempt to contact first authors of studies to obtain intra‐class correlation coefficients (ICCs) for their clustered data and adjust for this by using accepted methods (Gulliford 1999). Where clustering has been incorporated into the analysis of these primary studies, we will present these data as if from a non‐cluster randomised study, but adjust for the clustering effect.
We have sought statistical advice and have been advised that the binary data as presented in a report should be divided by a 'design effect'. This is calculated using the mean number of participants per cluster (m) and the ICC [Design effect = 1+(m‐1)*ICC] (Donner 2002). If the ICC is not reported it was assumed to be 0.1 (Ukoumunne 1999).
If cluster studies have been appropriately analysed taking into account ICCs and relevant data documented in the report, synthesis with other studies will be possible using the generic inverse variance technique.
2. Cross‐over trials
A major concern of cross‐over trials is the carry‐over effect. It occurs if an effect (e.g. pharmacological, physiological or psychological) of the treatment in the first phase is carried over to the second phase. As a consequence, on entry to the second phase the participants can differ systematically from their initial state despite a wash‐out phase. For the same reason cross‐over trials are not appropriate if the condition of interest is unstable (Elbourne 2002). As both effects are very likely in severe mental illness, if we had included cross‐over trials, we would have used only data from the first phase of cross‐over studies.
3. Studies with multiple treatment groups
Where a study involved more than two treatment arms, if relevant, we presented the additional treatment arms in comparisons. If data were binary we simply added these and combined within the two‐by‐two table. If data were continuous, we combined data following the formula in chapter 7 of the Cochrane Handbook for Systematic Reviews of Interventions (Higgins 2011). Where the additional treatment arms were not relevant, we did not reproduce these data.
Dealing with missing data
1. Overall loss of credibility
At some degree of loss of follow‐up, data must lose credibility (Xia 2009). We chose that, for any particular outcome, should more than 50% of data be unaccounted for, we would not reproduce these data or use them within analyses. If, however, more than 50% of those in one arm of a study was lost, but the total loss was less than 50%, we would have addressed this within the 'Summary of findings' table/s by down‐rating quality. Finally, we would have also downgraded quality within the 'Summary of findings' table/s had loss been 25% to 50% in total.
2. Binary
In the case where attrition for a binary outcome was between 0% and 50% and where these data were not clearly described, we presented data on a 'once‐randomised‐always‐analyse' basis (an intention‐to‐treat (ITT) analysis). Those leaving the study early were all assumed to have the same rates of negative outcome as those who completed, with the exception of the outcome of death and adverse effects. For these outcomes, we used the rate of those who stayed in the study ‐ in that particular arm of the trial ‐ for those who did not. We undertook a sensitivity analysis to test how prone the primary outcomes were to change when 'completer' data only were compared to the ITT analysis using the above assumptions.
3. Continuous
3.1 Attrition
Had we found data where attrition for a continuous outcome was between 0% and 50%, and data only from people who completed the study to that point were reported, we would have reproduced and presented these data.
3.2 Standard deviations
If we had found data where standard deviations (SDs) were not reported, we would have first tried to obtain the missing values from the authors. If not available, where there were missing measures of variance for continuous data, but an exact standard error (SE) and confidence intervals available for group means, and either 'P' value or 't' value available for differences in mean, we would have calculated them according to the rules described in the Cochrane Handbook for Systematic reviews of Interventions (Higgins 2011): When only the SE was reported, SDs would have been calculated by the formula SD = SE * square root (n). The Cochrane Handbook for Systematic reviews of Interventions (Higgins 2011) presents detailed formulae for estimating SDs from P values, t or F values, confidence intervals, ranges or other statistics. If these formulae did not apply, we would have calculated the SDs according to a validated imputation method which is based on the SDs of the other included studies (Furukawa 2006). Although some of these imputation strategies can introduce error, the alternative would have been to exclude a given study’s outcome and thus to lose information. We nevertheless would have examined the validity of the imputations in a sensitivity analysis excluding imputed values.
3.3 Assumptions about participants who left the trials early or were lost to follow‐up
Various methods are available to account for participants who left the trials early or were lost to follow‐up. Some trials just present the results of study completers, others use the method of last observation carried forward (LOCF), while more recently methods such as multiple imputation or mixed‐effects models for repeated measurements (MMRM) have become more of a standard. While the latter methods seem to be somewhat better than LOCF (Leon 2006), we feel that the high percentage of participants leaving the studies early and differences in the reasons for leaving the studies early between groups is often the core problem in randomised schizophrenia trials. We would therefore have not excluded studies based on the statistical approach used. However, we would have preferably used the more sophisticated approaches. For example, we prefer MMRM or multiple‐imputation to LOCF and we would only present completer analyses if some kind of ITT data were not available at all. Moreover, we would have addressed this issue in the item "incomplete outcome data" of the 'Risk of bias' tool.
Assessment of heterogeneity
1. Clinical heterogeneity
We considered all included studies initially, without seeing comparison data, to judge clinical heterogeneity. We simply inspected all studies for clearly outlying people or situations which we had not predicted would arise. If we had such situations or participant groups, we would have discussed these.
2. Methodological heterogeneity
We considered all included studies initially, without seeing comparison data, to judge methodological heterogeneity. We simply inspected all studies for clearly outlying methods which we had not predicted would arise. When such methodological outliers arose, we fully discussed these.
3. Statistical heterogeneity
3.1 Visual inspection
We visually inspected graphs to investigate the possibility of statistical heterogeneity.
3.2 Employing the I2 statistic
We investigated heterogeneity between studies by considering the I2 method alongside the Chi2 P value. The I2 provides an estimate of the percentage of inconsistency thought to be due to chance (Higgins 2003). The importance of the observed value of I2 depends on i. magnitude and direction of effects and ii. strength of evidence for heterogeneity (e.g. P value from Chi2 test, or a confidence interval for I2). An I2 estimate greater than or equal to around 50% accompanied by a statistically significant Chi2 statistic was interpreted as evidence of substantial levels of heterogeneity (Deeks 2011). When substantial levels of heterogeneity were found in the primary outcome, we explored reasons for heterogeneity (Subgroup analysis and investigation of heterogeneity).
Assessment of reporting biases
Reporting biases arise when the dissemination of research findings is influenced by the nature and direction of results (Egger 1997). These are described in Section 10 of the Handbook (Sterne 2011). We are aware that funnel plots may be useful in investigating reporting biases, but are of limited power to detect small‐study effects. We proposed to not use funnel plots for outcomes where there were 10 or fewer studies, or where all studies were of similar size so we did not produce a funnel plot as all outcomes were measured in fewer than 10 studies. In future versions of this review, if funnel plots are possible, we will seek statistical advice in their interpretation.
Data synthesis
We understand that there is no closed argument for preference for use of fixed‐effect or random‐effects models. The random‐effects method incorporates an assumption that the different studies are estimating different, yet related, intervention effects. This often seems to be true to us and the random‐effects model takes into account differences between studies even if there is no statistically significant heterogeneity. There is, however, a disadvantage to the random‐effects model: it puts added weight onto small studies, which often are the most biased ones. Depending on the direction of effect, these studies can either inflate or deflate the effect size. We chose the fixed‐effect model for all analyses.
Subgroup analysis and investigation of heterogeneity
1. Subgroup analyses ‐ only primary outcomes
1.1 Clinical state, stage or problem
We proposed to undertake this review and provide an overview of the effects of different chlorpromazine doses for people with schizophrenia in general. In addition, we also proposed to report, if possible, data on subgroups of people in the same clinical state, stage and with similar problems. Such data were not available.
2. Investigation of heterogeneity
If inconsistency was high, we have reported this. First, we investigated whether data had been entered correctly. Second, if data were correct, we visually inspected the graph and successively removed outlying studies to see if homogeneity was restored. For this review, we decided that should this occur with data contributing to the summary finding of no more than around 10% of the total weighting, we would present the data. If not, then we did not pool data and discussed issues. We know of no supporting research for this 10% cut‐off, but we use prediction intervals as an alternative to this unsatisfactory state.
When unanticipated clinical or methodological heterogeneity was obvious, we simply stated hypotheses regarding these for future reviews or versions of this review. We do not anticipate undertaking analyses relating to these.
Sensitivity analysis
1. Implication of randomisation
If trials had been described in some way so as to imply randomisation, for the primary outcomes we would have included these studies, and if there was no substantive difference when the implied randomised studies were added to those with better description of randomisation, then we entered all data from these studies.
2. Assumptions for lost binary data
Where assumptions had to be made regarding people lost to follow‐up and missing SD data (see Dealing with missing data), we compared the findings on primary outcomes when we used our assumption compared with complete data only. We undertook a sensitivity analysis to test how prone results were to change when we compared 'completer' data only to the imputed data using the above assumption. If there was a substantial difference, we reported results and discussed them, but continued to employ our assumption.
3. Risk of bias
We analysed the effects of excluding trials that were judged to be at high risk of bias across one or more of the domains of randomisation (see also Assessment of risk of bias in included studies) reporting data for the meta‐analysis of the primary outcome. If the exclusion of trials at high risk of bias did not substantially alter the direction of effect or the precision of the effect estimates, then we included data from these trials in the analysis.
4. Imputed values
We planned to undertake a sensitivity analysis to assess the effects of including data from trials where we used imputed values for ICC in calculating the design effect in cluster‐randomised trials.
If we noted substantial differences in the direction or precision of effect estimates in any of the sensitivity analyses listed above, we did not pool data from the excluded trials with the other trials contributing to the outcome, but presented them separately.
5. Fixed‐effect and random‐effects
We synthesised data using a random‐effects model to compare results from primary outcomes when using our preferred fixed‐effect model. Had we found substantial differences, we would have noted this.
Results
Description of studies
Results of the search
1. Cochrane Schizophrenia Trials Register
We carried out searches of the Cochrane Schizophrenia Trials Register in 2008, 2014 and 2016. For full details please see Search methods for identification of studies.
1. 2008 search
The December 2008 search identified 449 references from 169 studies. We also inspected the reference sections of selected studies for additional trials. We identified 25 additional citations of studies possibly relevant to this review. Out of these 449 articles 434 were easily excluded, mostly because they compared one fixed‐dose chlorpromazine with another antipsychotic drug. From the 13 remaining articles, seven were excluded, mostly for inappropriate data presentation or insufficient data specification. Another two were unusable due to differing classification of dosage than in our review. We inspected references of all identified studies for further trials. This left four studies to include.
2. 2014 search
In October 2014, 22 records were identified through database searching and these trials were added to 'Classification pending references' section of the review . Five additional records were identified through further consideration of two records. Twenty‐seven articles were assessed for eligibility. Three full‐text articles (one new study) were included in qualitative synthesis but two references related to studies already identified for the 2009 version of this review (see Figure 2).
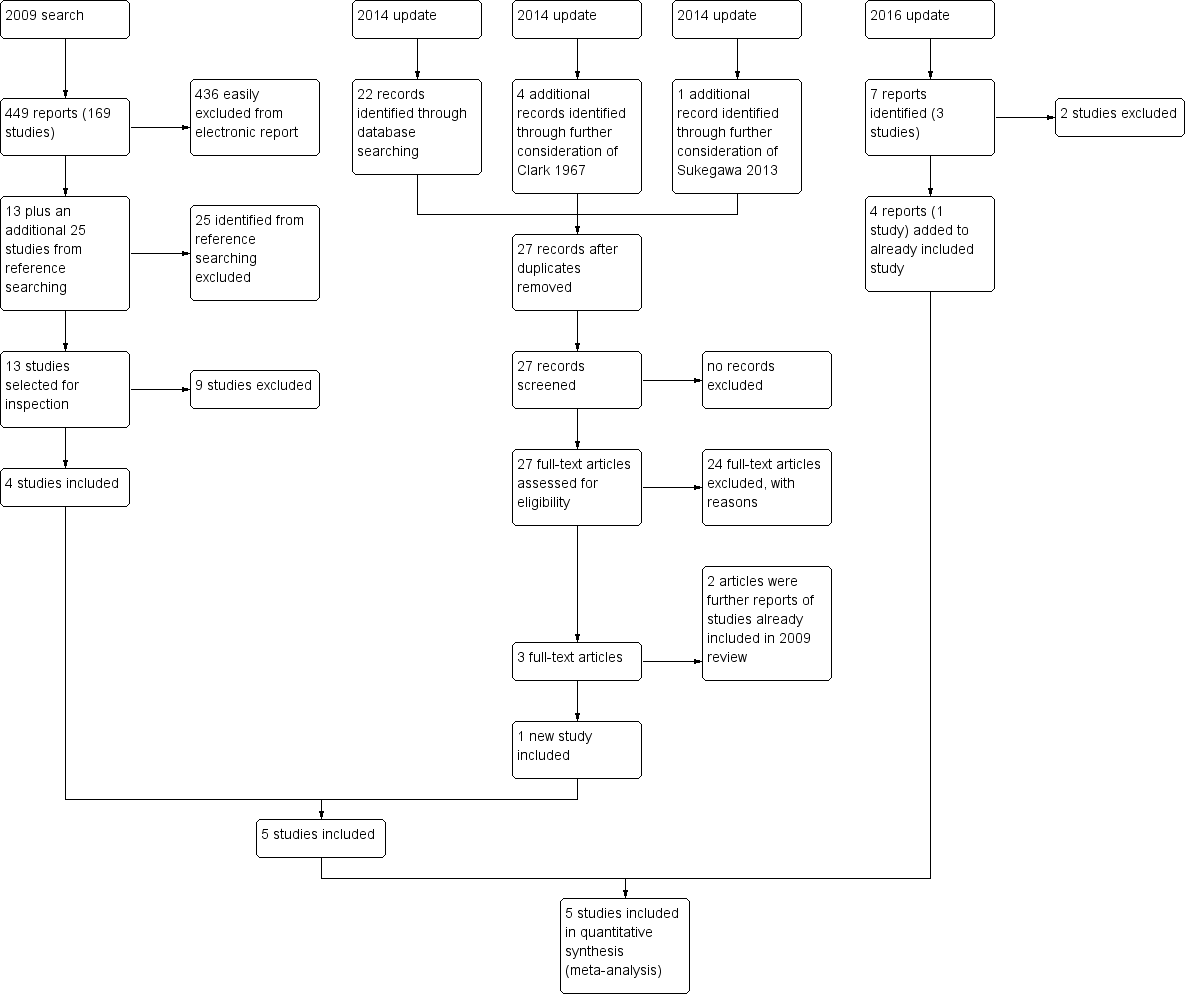
Study flow diagram
3. 2016 search
In December 2016, we found seven more reports. Four of these related to the included study Prien 1968 and have been added. Two were reports of Gibbs 1956, which unfortunately had to be excluded. Finally, Lehmann 1983 was also excluded.
Included studies
The review includes 18 papers describing five studies. All were described as being randomised.
1. Study length
Prien 1968 and Clark 1972 were longer than 13 weeks (medium term). The other three studies fall into the short‐term category with a maximum length of 12 weeks (Chouinard 1976; Wode‐Helgodt 1978; Xu 2009).
2. Design
All studies were randomised controlled trials. We were not able to include cross‐over trials. For further details, please see below.
3. Participants
A total of 1132 participants are included in the five trials, 585 of whom are relevant this review. All participants had been diagnosed with schizophrenia, but only Xu 2009 mentioned which tools were used for this assessment, CCMD‐3 (Chinese Classification of Mental Disorders Version 3) for this particular study. Only one trial reports that diagnoses were confirmed by a research psychiatrist (Chouinard 1976). The core symptoms of schizophrenia, however, are fairly easy to observe and recognise. This diminishes, but will not eliminate the risk of error because of the normal diagnostic heterogeneity.The included trials were performed between 1968 and 2009. Age of participants ranged from 18 to 69 years over all the trials with the mean age of the trials being between 30 and 44 years. Four studies reported the sex of participants (81 men, 82 women). One trial included only women (Clark 1972) and Prien 1968 stated a distribution of approximately 50‐50 (838 participants). Of the five studies, two focused specifically on people with chronic schizophrenia (Clark 1972; Prien 1968).
4. Settings
All trials were based in hospital.
5. Interventions
Four of the five studies compared low‐dose chlorpromazine (ranging between 150 mg/day and 400 mg/day) with a medium dose (always 600 mg/day, apart from Xu 2009 with doses ranging between 425 mg/day and 600 mg/day). Only Prien 1968 compared a high dose (2 gm/day) with a low dose (300 mg/day).
Studies had also included an additional control treatment (chlorpromazine in combination with alpha‐methyldopa, Chouinard 1976), conventional treatment (Prien 1968), alternative treatment (clozapine instead of chlorpromazine, Xu 2009), and placebo (Clark 1972; Prien 1968).
6. Outcomes
6.1 Outcome scales
Only details of the scales that provided usable data are shown below. Some data from rating scales were unusable. This was mainly due to missing data, especially the standard deviations. In one instance, there was a lack of numeric data. Reasons for exclusions of data are given under ‘Outcomes’ in the ‘Characteristics of included studies' tables. Several of the scales were used to produce a binary outcome. For example, the global scales listed below were used by Prien 1968 to categorise people into 'severely ill' or not and into 'improved' or not.
6.1.1 Global state
6.1.1.1 Clinical Global Improvement ‐ Severity of Illness ‐ CGI‐SI (Guy 1976)
The CGI‐SI is used to assess the degree of mental illness within the clinical experience of the therapist. Scores range from one (normal, not ill at all) to seven (extremely ill).
6.1.1.2 Global Assessment Scale ‐ GAS (Endicott 1976)
The GAS is a scale used for scoring the severity of mental disorders in a patient. It has a range from zero to 100, with higher scores indicating better psychosocial adjustment. A score of above 70 is usually considered a full remission. It is increasingly used in studies of schizophrenia, borderline patients, depression, dysthymia and mania.
6.1.2 Mental state
6.1.2.1 Brief Psychiatric Rating Scale BPRS (Overall 1962)
The BPRS measures positive symptoms, general psychopathology and affective symptoms. The original scale has 16 items, but a revised 18‐item scale is commonly used. Scores can range from zero to 126. Each item is rated on a seven‐point scale varying from ‘not present’ to ‘extremely severe’, with high scores indicating more severe symptoms. Chouinard 1976 used this scale.
6.1.2.2 Positive and Negative Syndrome Scale ‐ PANSS (Kay 1986)
This schizophrenia scale has 30 items, each of which can be defined on a seven‐point scoring system varying from one ‐ absent to seven ‐ extreme. It can be divided into three subscales for measuring the severity of general psychopathology, positive symptoms (PANSS‐P), and negative symptoms (PANSS‐N). A low score indicates lesser severity.
6.1.3 Adverse effects
6.1.3.1 Chouinard 1976's approach
Emergent symptoms were tabulated by a psychiatrist on special forms at weeks zero, two, five and eight of treatment.
6.1.3.2 Clark 1972's approach
Clark 1972 does not give a description of the methodology used to record adverse effects.
6.1.3.3 Prien 1968's approach
Side effects were recorded on a 40‐item side effect checklist by the research physician and the research nurse.
6.1.3.4 Wode‐Helgodt 1978's approach
Two psychiatrists used a modified version of a previously published scale for extrapyramidal symptoms (Simpson 1970). Within this scale each adverse effect item was rated through a seven‐point scale (range zero to three). Reported adverse effects were rated by asking the patients if they had experienced side effects of the medication. If a symptom was present before treatment, its score at R0 was subtracted from the figures in later ratings.
6.1.3.5 Xu 2009's approach
Adverse effects were reported using treatment‐emergent symptom side effect (TESS) scale (Guy 1976).
6.2 Missing outcomes
We did find some data for our primary outcomes (Types of outcome measures) and some additional data. There were, however, very few data overall and no useful information on general functioning, behaviour, quality of life/satisfaction with treatment, cognitive functioning, service use or cost of care.
Excluded studies
1. 2008 search
The original review authors excluded 165 studies at initial screening. One hundred and fifty‐six of these studies were easily seen not to be relevant, most frequently because in these chlorpromazine was compared with another antipsychotic such as clozapine or haloperidol. Five of the remaining nine studies had investigated the interventions in question for people with schizophrenia (Andrews 1976; Bartko 1988; Clark 1978; Crane 1968; Janakiramaiah 1982). Clark 1961 and Schiele 1959 had used sliding doses of chlorpromazine and not the fixed doses we were looking for. Finally, Curry 1976 was not randomised and Green 1996 included only healthy people.
2. 2014 search
We excluded 24 studies from the review. Initially, these studies were not clearly irrelevant and so we assessed the full text of these articles for eligibility. Overall, many studies were rejected as chlorpromazine was being compared with another antipsychotic or placebo (Borison 1991; Caffey 1975; Chen 2002; Clark 1970a; Clark 1970b) or were being compared in conjunction with a varying dose of antipsychotic/medication (Casey 1961; Joshi 1982 ). Additionally, some studies were rejected because the different doses of chlorpromazine fell under the same category (Altman 1973; Yuan‐Guang 1994), only useful if reviewing differences in ultra‐low doses of chlorpromazine. Clark 1960, Cooper 1973 and Pigache 1993 were not randomised by dose. Clark 1967 used increasing doses of chlorpromazine to make comparisons against a placebo. Danion 1992 and Hartley 1978 only included healthy people. Jeste 1977 and Kalyanasundaram 1981 compared different schedules rather than dose. Ota 1974 compared different brands rather than dose. Sukegawa 2008, Sukegawa 2012 and Sukegawa 2014 compared dose reduction methods of multiple antipsychotics against a control group.
3. 2016 search
In 2016, we identified Gibbs 1956. This clearly reported randomised study compared outcomes for two levels of dosage (expressed in ranges), which we really could not justify including in our medium‐dose range ‐ both fell into the lower‐dose range which we had pre‐stated in our protocol. Finally, Lehmann 1983 also had to be excluded. This was a randomised study but randomisation had not been entirely successful and that alone may have been reason to exclude it. However, this trial compared unspecified antipsychotics given in doses at levels that were expressed in chlorpromazine equivalents ‐ so we are unclear if this even included the drug chlorpromazine at all.
Risk of bias in included studies
For graphical display please see Figure 3 and Figure 4. Please also see the tables of Characteristics of included studies.

Methodological quality summary: review authors' judgements about each methodological quality item for each included study.

'Risk of bias' graph: review authors' judgements about each risk of bias item presented as percentages across all included studies.
Allocation
All studies were randomised, but the description of allocation was poor in all but Wode‐Helgodt 1978, where the trialists seemed to have given considerable consideration to the process. Although the method used was referenced (Armitage 1971), the technique used was 'restricted'. Hence this method was poor and could have easily introduced selection bias with an overestimation of positive effect (Jüni 2001). Therefore, all studies, apart from Wode‐Helgodt 1978, were labelled as having an 'unclear risk' with regards to selection bias. Furthermore, none of the studies mentioned allocation concealment.
Blinding
We rated Chouinard 1976, Clark 1972, Prien 1968 and Wode‐Helgodt 1978 low risk for this domain as they were stated to be double‐blinded and briefly described the methods used. However, none of the studies tested the success of this blinding. Xu 2009 presents an unclear risk as blinding was not mentioned or described.
Incomplete outcome data
Overall, the number, treatment group and reasons for people who left the studies early was reported adequately. Prien 1968 did not describe the losses in the text but provided a table of percentage losses and reasons, which could be converted to absolute numbers. However, Chouinard 1976 failed to report from what treatment group the person who left the study was from. Clark 1972 provided the number of people as well as their individual reasons for leaving the study early, without revealing which treatment group they belonged to. In both studies the missing information could not be calculated from any tables of results.
Selective reporting
Overall, data reporting was poor. All but two studies (Chouinard 1976 and Xu 2009) had a high risk of reporting bias. We were unable to use a lot of data from the five included trials. Continuous data and data about general state were especially problematic. Very often the reason for exclusion was a lack of reporting standard deviations with no additional numerical data from which estimates could be generated. Another common reason for exclusion was the failure to provide any numerical information about specific outcomes at all. For example, Clark 1972 reported people's reasons for leaving the study but provided no information about their distribution among the treatment groups. Wode‐Helgodt 1978 presented many findings in graphs, but it was only possible in one graph to extract data. We had to give Prien 1968 a rating of high risk ‐ there were no variances for several continuous outcomes, several outcomes not reported at all, and only data of patients evaluated by same rater at pre‐treatment and termination were reported in general state.
Other potential sources of bias
Only Clark 1972 stated that they had gained the drugs from Smith, Kline and French Laboratories. This is a form of support, but we are unclear if the company had any more influence on the study ‐ and marked the level of bias as 'unclear'. Other potential sources of bias were not found.
Effects of interventions
See: Summary of findings for the main comparison CHLORPROMAZINE LOW DOSE (≤ 400 mg/day) compared to MEDIUM DOSE (401 mg/day to 800 mg/day) for people with schizophrenia; Summary of findings 2 CHLORPROMAZINE LOW DOSE (≤ 400 mg/day) compared to HIGH DOSE (> 800 mg/day ‐ all medium term) for people with schizophrenia
COMPARISON 1: CHLORPROMAZINE LOW DOSE ( ≤ 400 mg/day) versus MEDIUM DOSE (401 mg/day to 800 mg/day)
1.1 Global state: Not improved ‐ short term
We identified one relevant trial (n = 60, Xu 2009) and there was no evidence of a clear difference between chlorpromazine low dose (≤ 400 mg/day) and medium dose (401 mg/day to 800 mg/day, risk ratio (RR) 0.83, 95% confidence interval (CI) 0.28 to 2.44, Analysis 1.1).
1.2 Global state: Requiring additional medication (sedation with chloral hydrate or a barbiturate > five times) ‐ medium term
We identified one relevant trial (n = 50, Clark 1972) and there was no evidence of a clear difference between chlorpromazine low dose (≤ 400 mg/day) and medium dose (401 mg/day to 800 mg/day, RR 3.09, 95% CI 0.40 to 23.64, Analysis 1.2).
1.3 Leaving the study early
This outcome was reported by Chouinard 1976 and Wode‐Helgodt 1978 with extractable data. Wode‐Helgodt 1978 reported this more fully and we were able to divide this outcome into subgroups.
1.3.1 Any reason
In this subgroup we found two relevant trials (n = 70). There was no significant difference between chlorpromazine low dose (≤ 400 mg/day) and medium dose (401 mg/day to 800 mg/day, RR 1.06, 95% CI 0.32 to 3.55, Analysis 1.3).
1.3.2 Adverse effects
In this subgroup we identified one relevant trial (n = 48, Wode‐Helgodt 1978) reporting no evidence of a clear difference between chlorpromazine low dose (≤ 400 mg/day) and medium dose (401 mg/day to 800 mg/day, RR 0.23, 95% CI 0.02 to 2.32, Analysis 1.3).
1.3.3 Inefficacy of treatment
In this subgroup we identified one relevant trial (n = 48, Wode‐Helgodt 1978). This single study found no evidence of a clear difference between chlorpromazine low dose (≤ 400 mg/day) and medium dose (401 mg/day to 800 mg/day, RR 4.24, 95% CI 0.24 to 74.01, Analysis 1.3).
1.3.4 Other reason
In this subgroup we found two relevant trials (n = 70). There was no significant difference between chlorpromazine low dose (≤ 400 mg/day) and medium dose (401 mg/day to 800 mg/day, RR 0.91, 95% CI 0.09 to 9.27, Analysis 1.3).
1.4 Mental state: 1a. Average endpoint score (BPRS total, high = poor)
The BPRS score was not expressed as a total so we have presented this outcome in subgroups. One trial with a total of 22 relevant participants reported this outcome.
1.4.1 Anxious depression
Within this subgroup we identified one relevant trial (n = 22, Chouinard 1976) reporting no evidence of a clear difference between chlorpromazine low dose (≤ 400 mg/day) and medium dose (401 mg/day to 800 mg/day, mean difference (MD) ‐0.60, 95% CI ‐1.35 to 0.15, Analysis 1.4).
1.4.2 Thinking disturbance
In this subgroup we identified one relevant trial (n = 22, Chouinard 1976) reporting no evidence of a clear difference between chlorpromazine low dose (≤ 400 mg/day) and medium dose (401 mg/day to 800 mg/day, MD, 2.60 95% CI ‐0.24 to 5.44, Analysis 1.4).
1.4.3 Withdrawal retardation
Within this subgroup we identified one relevant trial (n = 22, Chouinard 1976) reporting evidence of a clear difference between chlorpromazine low dose (≤ 400 mg/day) and medium dose (401 mg/day to 800 mg/day, MD ‐2.00, 95% CI ‐3.76 to ‐0.24, Analysis 1.4).
1.5 Mental state: 1b. Average endpoint score (PANSS total and subscores, high = poor)
One study with 60 participants relevant to the review recorded PANSS total score as well as subscores.
1.5.1 Negative
In this subgroup we identified one relevant trial (n = 60, Xu 2009). This single study found no evidence of a clear difference between chlorpromazine low dose (≤ 400 mg/day) and medium dose (401 mg/day to 800 mg/day, MD ‐0.17, 95% CI ‐2.34 to 2.00, Analysis 1.5).
1.5.2 Positive
In this subgroup we identified one relevant trial (n = 60, Xu 2009). This single study found no evidence of a clear difference between chlorpromazine low dose (≤ 400 mg/day) and medium dose (401 mg/day to 800 mg/day, MD ‐0.24, 95% CI ‐1.98 to 1.50, Analysis 1.5).
1.5.3 Total
In this subgroup we identified one relevant trial (n = 60, Xu 2009) reporting no evidence of a clear difference between chlorpromazine low dose (≤ 400 mg/day) and medium dose (401mg/day to 800 mg/day, MD 0.36, 95% CI ‐5.39 to 6.11, Analysis 1.5).
1.6 Adverse effects: 1. Central nervous system ‐ extrapyramidal symptoms
Chouinard 1976 and Wode‐Helgodt 1978 reported specific extrapyramidal symptoms in the short term while Clark 1972 reported unspecific extrapyramidal symptoms in the medium term.
1.6.1 Akathisia ‐ short term
In this subgroup we found two relevant trials (n = 70). There was no significant difference between chlorpromazine low dose (≤ 400 mg/day) and medium dose (401 mg/day to 800 mg/day, RR 1.37, 95% CI 0.28 to 6.68, Analysis 1.6).
1.6.2 Akinesia ‐ short term
In this subgroup we identified one relevant trial (n = 22, Chouinard 1976). This single study found no evidence of a clear difference between chlorpromazine low dose (≤ 400 mg/day) and medium dose (401 mg/day to 800 mg/day, RR 0.50, 95% CI 0.05 to 4.75, Analysis 1.6).
1.6.3 Dystonia ‐ short term
In this subgroup we identified two relevant trials (n = 70). There was no significant difference between chlorpromazine low dose (≤ 400 mg/day) and medium dose (401 mg/day to 800 mg/day, RR 0.24, 95% CI 0.05 to 1.29, Analysis 1.6).
1.6.4 Gait disturbance ‐ short term
In this subgroup we identified one relevant trial (n = 48, Wode‐Helgodt 1978). This single study found no evidence of a clear difference between chlorpromazine low dose (≤ 400 mg/day) and medium dose (401 mg/day to 800 mg/day, RR 0.36, 95% CI 0.11 to 1.17, Analysis 1.6).
1.6.5 Muscle tension ‐ short term
In this subgroup we identified one relevant trial (n = 48, Wode‐Helgodt 1978). This single study found evidence of a clear difference between chlorpromazine low dose (≤ 400 mg/day) and medium dose (401‐800 mg/day, RR 0.15, 95% CI 0.03 to 0.67, Analysis 1.6).
1.6.6 Rigidity ‐ elbow ‐ short term
In this subgroup we identified one relevant trial (n = 48, Wode‐Helgodt 1978) reporting no evidence of a clear difference between chlorpromazine low dose (≤400 mg/day) and medium dose (401 mg/day to 800 mg/day, RR 0.53, 95% CI 0.21 to 1.31, Analysis 1.6).
1.6.7 Rigidity ‐ unspecified ‐ short term
In this subgroup we identified one relevant trial (n = 22, Chouinard 1976) reporting no evidence of a clear difference between chlorpromazine low dose (≤ 400 mg/day) and medium dose (401 mg/day to 800 mg/day, RR 1.00, 95% CI 0.07 to 14.05, Analysis 1.6).
1.6.8 Tremor ‐ short term
In this subgroup we identified two relevant trials (n = 70). There was no significant difference between chlorpromazine low dose (≤ 400 mg/day) and medium dose (401 mg/day to 800 mg/day, RR 0.44, 95% CI 0.17 to 1.10, Analysis 1.6).
1.6.9 Unspecified extrapyramidal symptoms ‐ short term
In this subgroup we identified two relevant trials (n = 108) reporting evidence of a clear difference between chlorpromazine low dose (≤ 400 mg/day) and medium dose (401 mg/day to 800 mg/day, RR 0.47, 95% CI 0.30 to 0.74, Analysis 1.6).
1.6.10 Unspecified extrapyramidal symptoms ‐ medium term
In this subgroup we identified one relevant trial (n = 50, Clark 1972). This single study found no evidence of a clear difference between chlorpromazine low dose (≤ 400 mg/day) and medium dose (401 mg/day to 800 mg/day, RR 0.26, 95% CI 0.05 to 1.27, Analysis 1.6).
1.7 Adverse effects: 2. Anticholinergic
We reported the broad range of adverse effects under subheadings such as anticholinergic, cardiovascular, central nervous system, etc. We found that this method of categorisation allowed the data to be inputted clearly without losing too much detail.
Three trials with a total of 120 participants reported data of one or more anticholinergic side effects of both short and medium term. Some of the reported side effects were particularly specific. However, 'urinary disturbance' and 'trouble starting urination' were reported by two separate trials but not explained. Therefore, we assumed these terms to be referring to the same outcome.
1.7.1 Blurred vision ‐ short term
In this subgroup we identified one relevant trial (n = 48, Wode‐Helgodt 1978). This single study found no evidence of a clear difference between chlorpromazine low dose (≤ 400 mg/day) and medium dose (401 mg/day to 800 mg/day, RR 0.30, 95% CI 0.06 to 1.63, Analysis 1.7).
1.7.2 Constipation ‐ short term
In this subgroup we identified two relevant trials (n = 70). There was no significant difference between chlorpromazine low dose (≤ 400 mg/day) and medium dose (401 mg/day to 800 mg/day, RR 1.82, 95% CI 0.42 to 7.99, Analysis 1.7).
1.7.3 Constipation ‐ medium term
In this subgroup we identified one relevant trial (n = 50, Clark 1972). This single study found no evidence of a clear difference between chlorpromazine low dose (≤ 400 mg/day) and medium dose (401 mg/day to 800 mg/day, RR 0.11, 95% CI 0.01 to 2.09, Analysis 1.7).
1.7.4 Ejaculation disturbance ‐ short term
In this subgroup we identified one relevant trial (n = 20, Wode‐Helgodt 1978). Of the 20 people, no one had this adverse effect in either dosage group (Analysis 1.7).
1.7.5 Erectile disturbance ‐ short term
In this subgroup we identified one relevant trial (n = 20, Wode‐Helgodt 1978). Of the 20 people, no one had this adverse effect in either dosage group (Analysis 1.7).
1.7.6 Salivation ‐ dry mouth ‐ short term
In this subgroup we identified two relevant trials (n = 70). There was no significant difference between chlorpromazine low dose (≤ 400 mg/day) and medium dose (401 mg/day to 800 mg/day, RR 1.16, 95% CI 0.58 to 2.34, Analysis 1.7).
1.7.7 Salivation ‐ too much ‐ short term
In this subgroup we identified one relevant trial (n = 48, Wode‐Helgodt 1978). This single study found no evidence of a clear difference between chlorpromazine low dose (≤ 400 mg/day) and medium dose (401 mg/day to 800 mg/day, RR 0.09, 95% CI 0.0 to 1.85, Analysis 1.7).
1.7.8 Tachycardia ‐ short term
In this subgroup we identified one relevant trial (n = 22, Chouinard 1976). This single study found no evidence of a clear difference between chlorpromazine low dose (≤ 400 mg/day) and medium dose (401 mg/day to 800 mg/day, RR 0.50, 95% CI 0.05 to 4.75, Analysis 1.7).
1.7.9 Urinary disturbance/trouble starting urination ‐ short term
In this subgroup we identified two relevant trials (n = 70). There was no significant difference between chlorpromazine low dose (≤ 400 mg/day) and medium dose (401 mg/day to 800 mg/day, RR 3.00, 95% CI 0.37 to 24.58, Analysis 1.7).
1.8 Adverse effects: 3. Cardiovascular
In total, four trials consisting of 182 participants reported data of one or more cardiovascular adverse effects, of both short and medium term.
1.8.1 Electrocardiogram abnormal ‐ short term
Within this subgroup we identified one relevant trial (n = 60, Xu 2009) reporting evidence of a clear difference between chlorpromazine low dose (≤ 400 mg/day) and medium dose (401 mg/day to 800 mg/day, RR 0.22, 95% CI 0.05 to 0.94, Analysis 1.8).
1.8.2 Orthostatic symptoms (faint, dizzy, weak) ‐ short term
In this subgroup we identified one relevant trial (n = 22, Chouinard 1976) reporting no evidence of a clear difference between chlorpromazine low dose (≤ 400 mg/day) and medium dose (401 mg/day to 800 mg/day, RR 2.00, 95% CI 0.21 to 18.98, Analysis 1.8).
1.8.3 Orthostatic symptoms ‐ medium term
In this subgroup we identified one relevant trial (n = 50, Clark 1972). This single study found no evidence of a clear difference between chlorpromazine low dose (≤ 400 mg/day) and medium dose (401 mg/day to 800 mg/day, RR 0.11, 95% CI 0.01 to 2.09, Analysis 1.8).
1.8.4 Tachycardia ‐ short term
In this subgroup we identified one relevant trial (n = 22, Chouinard 1976). This single study found no evidence of a clear difference between chlorpromazine low dose (≤ 400 mg/day) and medium dose (401 mg/day to 800 mg/day, RR 0.5, 95% CI 0.05 to 4.75, Analysis 1.8).
1.8.7 Vertigo ‐ short term
In this subgroup we identified one relevant trial (n = 50, Wode‐Helgodt 1978) reporting no evidence of a clear difference between chlorpromazine low dose (≤ 400 mg/day) and medium dose (401 mg/day to 800 mg/day, RR 1.03, 95% CI 0.21 to 5.07, Analysis 1.8).
1.9 Adverse effects: 4. Central nervous system ‐ other than extrapyramidal symptoms
Four trials with a total of 180 relevant participants reported data on central nervous system adverse effects (other than extrapyramidal) of both short and medium term.
1.9.1 Depression ‐ medium term
In this subgroup we identified one relevant trial (n = 50, Clark 1972). Of the 50 people, no one reported depression in either dosage group (Analysis 1.9).
1.9.2 Drowsiness ‐ short term
In this subgroup we identified one relevant trial (n = 22, Chouinard 1976). This single study found no evidence of a clear difference between chlorpromazine low dose (≤ 400 mg/day) and medium dose (401 mg/day to 800 mg/day, RR 1.00, 95% CI 0.47 to 2.14, Analysis 1.9).
1.9.3 EEG abnormal ‐ short term
In this subgroup we identified one relevant trial (n = 60, Xu 2009) reporting no evidence of a clear difference between chlorpromazine low dose (≤ 400 mg/day) and medium dose (401 mg/day to 800 mg/day, RR 0.78, 95% CI 0.33 to 1.82, Analysis 1.9).
1.9.4 Head feels heavy ‐ short term
In this subgroup we identified one relevant trial (n = 48, Wode‐Helgodt 1978) reporting no evidence of a clear difference between chlorpromazine low dose (≤ 400 mg/day) and medium dose (401 mg/day to 800 mg/day, RR 0.15, 95% CI 0.02 to 1.34, Analysis 1.9).
1.9.5 Headache ‐ short term
In this subgroup we identified one relevant trial (n = 48, Wode‐Helgodt 1978). This single study found no evidence of a clear difference between chlorpromazine low dose (≤ 400 mg/day) and medium dose (401 mg/day to 800 mg/day, RR 2.35, 95% CI 0.12 to 46.22, Analysis 1.9).
1.9.6 Sedation ‐ medium term
Within this subgroup we identified one relevant trial (n = 50, Clark 1972) reporting evidence of a clear difference between chlorpromazine low dose (≤ 400 mg/day) and medium dose (401 mg/day to 800 mg/day, RR 0.17, 95% CI 0.05 to 0.55, Analysis 1.9).
1.9.7 Somnolence ‐ short term
In this subgroup we identified one relevant trial (n = 48, Wode‐Helgodt 1978). This single study found no evidence of a clear difference between chlorpromazine low dose (≤ 400 mg/day) and medium dose (401 mg/day to 800 mg/day, RR 1.1, 95% CI 0.59 to 2.08, Analysis 1.9).
1.9.8 Vertigo ‐ short term
In this subgroup we identified one relevant trial (n = 48, Wode‐Helgodt 1978) reporting no evidence of a clear difference between chlorpromazine low dose (≤ 400 mg/day) and medium dose (401 mg/day to 800 mg/day, RR 0.91, 95% CI 0.19 to 4.43, Analysis 1.9).
1.10 Adverse effects: 5. Dermatological
Clark 1972 reported dermatitis as well as an erythema rash in the medium term while Chouinard 1976 reported data on rashes in the short term.
1.10.1 Dermatitis ‐ medium term
In this subgroup we identified one relevant trial (n = 50, Clark 1972) reporting no evidence of a clear difference between chlorpromazine low dose (≤ 400 mg/day) and medium dose (401 mg/day to 800 mg/day, RR 1.59, 95% CI 0.07 to 37.03, Analysis 1.10).
1.10.2 Rash ‐ short term
In this subgroup we identified one relevant trial (n = 22, Chouinard 1976). This single study found no evidence of a clear difference between chlorpromazine low dose (≤ 400 mg/day) and medium dose (401 mg/day to 800 mg/day, RR 1.33, 95% CI 0.39 to 4.62, Analysis 1.10).
1.10.3 Rash ‐ 'photosensitivity: erythema' ‐ medium term
In this subgroup we identified one relevant trial (n = 50, Clark 1972). This single study found no evidence of a clear difference between chlorpromazine low dose (≤ 400 mg/day) and medium dose (401 mg/day to 800 mg/day, RR 0.52, 95% CI 0.03 to 7.74, Analysis 1.10).
1.11 Adverse effects: 6. Endocrine and metabolic
Endocrine adverse effects were described specifically. Wode‐Helgodt 1978 reported amenorrhoea and lactation in the short term while Clark 1972 reported metrorrhagia in the medium term.
1.11.1 Amenorrhoea ‐ short term
In this subgroup we identified one relevant trial (n = 28, Wode‐Helgodt 1978). This single study found no evidence of a clear difference between chlorpromazine low dose (≤ 400 mg/day) and medium dose (401 mg/day to 800 mg/day, RR 0.47, 95% CI 0.03 to 6.74, Analysis 1.11).
1.11.2 Lactation ‐ short term
In this subgroup we identified one relevant trial (n = 28, Wode‐Helgodt 1978). This single study found no evidence of a clear difference between chlorpromazine low dose (≤ 400 mg/day) and medium dose (401 mg/day to 800 mg/day, RR 0.17, 95% CI 0.01 to 3.73, Analysis 1.11).
1.11.6 Metrorrhagia ‐ medium term
In this subgroup we identified one relevant trial (n = 50, Clark 1972). This single study found no evidence of a clear difference between chlorpromazine low dose (≤ 400 mg/day) and medium dose (401 mg/day to 800 mg/day, RR 0.18, 95% CI 0.01 to 4.11, Analysis 1.11).
1.12 Adverse effects: 7. Gastrointestinal
Unspecified gastrointestinal adverse effects were reported in the short term. However, further subgroups included constipation at short and medium term.
1.12.1 Constipation ‐ short term
In this subgroup we identified two relevant trials (n = 70). There was no significant difference between chlorpromazine low dose (≤ 400 mg/day) and medium dose (401 mg/day to 800 mg/day, RR 1.82, 95% CI 0.42 to 7.99, Analysis 1.12).
1.12.3 Constipation ‐ medium term
In this subgroup we identified one relevant trial (n = 50, Clark 1972) reporting no evidence of a clear difference between chlorpromazine low dose (≤ 400 mg/day) and medium dose (401 mg/day to 800 mg/day, RR 0.11, 95% CI 0.01 to 2.09, Analysis 1.12).
1.12.9 Unspecified ‐ short term
In this subgroup we identified one relevant trial (n = 22, Chouinard 1976). This single study found no evidence of a clear difference between chlorpromazine low dose (≤ 400 mg/day) and medium dose (401 mg/day to 800 mg/day, RR 5.00, 95% CI 0.27 to 93.55, Analysis 1.12).
1.13 Adverse effects: 8. Genitourinary
'Urinary disturbance' and 'trouble starting urination' were assumed these terms to be referring to the same outcome (see above). This outcome was also included under the 'anticholinergic adverse effects' heading as it falls under both categories.
1.13.1 Urinary disturbance/trouble starting urination ‐ short term
In this subgroup we identified two relevant trials (n = 70). There was no significant difference between chlorpromazine low dose (≤ 400 mg/day) and medium dose (401 mg/day to 800 mg/day, RR 3.00, 95% CI 0.37 to 24.58, Analysis 1.13).
1.14 Adverse effects: 9. Haematological
Clark 1972, with 50 participants, was the only trial to report data on haematological adverse effects.
1.14.1 Agranulocytosis ‐ medium term
In this subgroup we identified one relevant trial (n = 50, Clark 1972). This single study found no evidence of a clear difference between chlorpromazine low dose (≤ 400 mg/day) and medium dose (401 mg/day to 800 mg/day, RR 1.59, 95% CI 0.07 to 37.03, Analysis 1.14).
1.14.2 Anaemia ‐ medium term
In this subgroup we identified one relevant trial (n = 50, Clark 1972). This single study found no evidence of a clear difference between chlorpromazine low dose (≤ 400 mg/day) and medium dose (401 mg/day to 800 mg/day, RR 1.59, 95% CI 0.07 to 37.03, Analysis 1.14).
1.15 Adverse effects: 10. Hepatological
1.15.1 Abnormal liver function ‐ short term
In this subgroup we identified one relevant trial (n = 60, Xu 2009). This single study found no evidence of a clear difference between chlorpromazine low dose (≤ 400 mg/day) and medium dose (401 mg/day to 800 mg/day, RR 1.33, 95% CI 0.33 to 5.45, Analysis 1.15).
1.16 Adverse effects: 11. Others
The following subgroups were difficult to place under the distinct categories above and so were collectively grouped under 'others'.
1.16.1 Agitation and restlessness ‐ medium term
In this subgroup we identified one relevant trial (n = 50, Clark 1972) reporting no evidence of a clear difference between chlorpromazine low dose (≤ 400 mg/day) and medium dose (401 mg/day to 800 mg/day, RR 1.59, 95% CI 0.07 to 37.03, Analysis 1.16).
1.16.2 Excitement ‐ short term
In this subgroup we identified one relevant trial (n = 22, Chouinard 1976) reporting no evidence of a clear difference between chlorpromazine low dose (≤ 400 mg/day) and medium dose (401 mg/day to 800 mg/day, RR 1.00, 95% CI 0.07 to 14.05, Analysis 1.16).
1.16.3 Restlessness, insomnia ‐ short term
In this subgroup we identified one relevant trial (n = 22, Chouinard 1976) reporting no evidence of a clear difference between chlorpromazine low dose (≤ 400 mg/day) and medium dose (401 mg/day to 800 mg/day, RR 0.75, 95% CI 0.22 to 2.6, Analysis 1.16).
COMPARISON 2: CHLORPROMAZINE LOW DOSE (≤ 400 mg/day) versus HIGH DOSE (> 800 mg/day ‐ all medium term)
2.1 Global state: Not improved or severely ill
2.1.1 No clinically important improvement
In this subgroup we identified one relevant trial (n = 416, Prien 1968). This single study found evidence of a clear difference between chlorpromazine low dose (≤ 400 mg/day) and high dose (> 800 mg/day ‐ all medium term, RR 1.13, 95% CI 1.01 to 1.25, Analysis 2.1).
2.1.2 Severely ill
We identified one relevant trial (n = 416, Prien 1968). This single study found no evidence of a clear difference between chlorpromazine low dose (≤ 400 mg/day) and high dose (> 800 mg/day ‐ all medium term, RR 1.09, 95% CI 0.96 to 1.24, Analysis 2.1).
2.1.3 Relapse
Again, we identified one relevant trial (n = 416, Prien 1968). This study found evidence of a clear difference between chlorpromazine low dose (≤ 400 mg/day) and high dose (> 800 mg/day ‐ all medium term, RR 2.25, 95% CI 1.17 to 4.32, Analysis 2.1).
2.2 Leaving the study early
Prien 1968 provided detail as to whether the participants left the study due to 'adverse effects', 'death' or 'deterioration of behaviour'.
2.2.1 Any reason
In this subgroup we identified one relevant trial (n = 416, Prien 1968). This single study found evidence of a clear difference between chlorpromazine low dose (≤ 400 mg/day) and high dose (> 800 mg/day ‐ all medium term, RR 0.6,0 95% CI 0.40 to 0.89, Analysis 2.2).
2.2.2 Adverse effects
Within this subgroup we identified one relevant trial (n = 416, Prien 1968) reporting evidence of a clear difference between chlorpromazine low dose (≤ 400 mg/day) and high dose (> 800 mg/day ‐ all medium term, RR 0.10, 95% CI 0.03 to 0.26, Analysis 2.2).
2.2.3 Death
In this subgroup we identified one relevant trial (n = 416, Prien 1968) reporting no evidence of a clear difference between chlorpromazine low dose (≤ 400 mg/day) and high dose (> 800 mg/day ‐ all medium term, RR 0.33, 95% CI 0.01 to 8.14, Analysis 2.2).
2.2.4 Deterioration of behaviour
In this subgroup we identified one relevant trial (n = 416, Prien 1968). This single study found evidence of a clear difference between chlorpromazine low dose (≤ 400 mg/day) and high dose (> 800 mg/day ‐ all medium term, RR 2.70, 95% CI 1.34 to 5.44, Analysis 2.2).
2.3 Adverse effects: 1. Central nervous system ‐ extrapyramidal symptoms
2.3.1 Akathisia
In this subgroup we identified one relevant trial (n = 416, Prien 1968) reporting no evidence of a clear difference between chlorpromazine low dose (≤ 400 mg/day) and high dose (> 800 mg/day ‐ all medium term, RR 1.00, (95% CI 0.55 to 1.83, Analysis 2.3).
2.3.2 Dystonia
Within this subgroup we identified one relevant trial (n = 416, Prien 1968) reporting evidence of a clear difference between chlorpromazine low dose (≤ 400 mg/day) and high dose (> 800 mg/day ‐ all medium term, RR 0.11, 95% CI 0.02 to 0.45, Analysis 2.3).
2.3.3 Parkinsonian reaction
Within this subgroup we identified one relevant trial (n = 416, Prien 1968) reporting evidence of a clear difference between chlorpromazine low dose (≤ 400 mg/day) and high dose (> 800 mg/day ‐ all medium term, RR 0.52, 95% CI 0.30 to 0.90, Analysis 2.3).
2.3.4 Required antiparkinsonian medication
In this subgroup we identified one relevant trial (n = 416, Prien 1968). This single study found evidence of a clear difference between chlorpromazine low dose (≤ 400 mg/day) and high dose (> 800 mg/day ‐ all medium term, RR 0.39, 95% CI 0.26 to 0.59, Analysis 2.3).
2.3.5 Unspecified
Within this subgroup we identified one relevant trial (n = 416, Prien 1968) reporting evidence of a clear difference between chlorpromazine low dose (≤ 400 mg/day) and high dose (> 800 mg/day ‐ all medium term, RR 0.43, 95% CI 0.32 to 0.59, Analysis 2.3).
2.4 Adverse effects: 2. Anticholinergic symptoms
We reported the broad range of adverse effects under subheadings such as anticholinergic, cardiovascular, central nervous system, etc. We found that this method of categorisation allowed the data to be inputted clearly without losing too much detail.
We used subheading of adverse effects in keeping with those used in 'Comparison 1' above.
2.4.1 Blurred vision
In this subgroup we identified one relevant trial (n = 416, Prien 1968) reporting no evidence of a clear difference between chlorpromazine low dose (≤ 400 mg/day) and high dose (> 800 mg/day ‐ all medium term, RR 0.20, 95% CI 0.01 to 4.14, Analysis 2.4).
2.4.2 Constipation
In this subgroup we identified one relevant trial (n = 416, Prien 1968). This single study found evidence of a clear difference between chlorpromazine low dose (≤ 400 mg/day) and high dose (> 800 mg/day ‐ all medium term, RR 0.27, 95% CI 0.09 to 0.79, Analysis 2.4).
2.4.3 Salivation ‐ too little (dry mouth)
Within this subgroup we identified one relevant trial (n = 416, Prien 1968) reporting evidence of a clear difference between chlorpromazine low dose (≤ 400 mg/day) and high dose (> 800 mg/day ‐ all medium term, RR 0.21 95% CI 0.07, to 0.61, Analysis 2.4).
2.4.4 Salivation ‐ too much
In this subgroup we identified one relevant trial (n = 416, Prien 1968). This single study found evidence of a clear difference between chlorpromazine low dose (≤ 400 mg/day) and high dose (> 800 mg/day ‐ all medium term, RR 0.20, 95% CI 0.04 to 0.90, Analysis 2.4).
2.4.5 Urinary disturbance
In this subgroup we identified one relevant trial (n = 416, Prien 1968). This single study found no evidence of a clear difference between chlorpromazine low dose (≤ 400 mg/day) and high dose (> 800 mg/day ‐ all medium term, RR 0.50, 95% CI 0.09 to 2.70, Analysis 2.4).
2.5 Adverse effects: 3. Central nervous system ‐ other than extrapyramidal symptoms
Prien 1968 provided data on specific central nervous system adverse effects (n = 416).
2.5.1 Drowsiness
Within this subgroup we identified one relevant trial (n = 416, Prien 1968) reporting evidence of a clear difference between chlorpromazine low dose (≤ 400 mg/day) and high dose (> 800 mg/day ‐ all medium term, RR 0.39, 95% CI 0.27 to 0.57, Analysis 2.5).
2.5.2 Seizures
The single study found evidence of a clear difference between chlorpromazine low dose (≤ 400 mg/day) and high dose (> 800 mg/day ‐ all medium term, RR 0.17 95% CI 0.04 to 0.74, Analysis 2.5).
2.6 Adverse effects: 4. Cardiovascular
Prien 1968 provided data on specific cardiovascular adverse effects (n = 416). These were kept under separate subgroup headings under 'cardiovascular' in order to not lose detail.
2.6.1 Dizziness, faintness
The single study found evidence of a clear difference between chlorpromazine low dose (≤ 400 mg/day) and high dose (> 800 mg/day ‐ all medium term, RR 0.30, 95% CI 0.16 to 0.56, Analysis 2.6).
2.6.2 Peripheral oedema
Prien 1968 reported no evidence of a clear difference between chlorpromazine low dose (≤ 400 mg/day) and high dose (> 800 mg/day ‐ all medium term, RR 0.33, 95% CI 0.07 to 1.63, Analysis 2.6).
2.6.3 Syncope
This single study found no evidence of a clear difference between chlorpromazine low dose (≤ 400 mg/day) and high dose (> 800 mg/day ‐ all medium term, RR 0.50, 95% CI 0.09 to 2.70, Analysis 2.6).
2.7 Adverse effects: 5. Dermatological
2.7.1 Photosensitivity
Within this subgroup we identified one relevant trial (n = 416, Prien 1968) reporting evidence of a clear difference between chlorpromazine low dose (≤ 400 mg/day) and high dose (> 800 mg/day ‐ all medium term, RR 0.09, 95% CI 0.03 to 0.24, Analysis 2.7).
2.7.2 Rashes, itching
We found one relevant trial (n = 416, Prien 1968) reporting evidence of a clear difference between chlorpromazine low dose (≤ 400 mg/day) and high dose (> 800 mg/day ‐ all medium term, RR 0.13, 95% CI 0.03 to 0.58, Analysis 2.7).
2.8 Adverse effects: 6. Gastrointestinal
Prien 1968 provided data on specific gastrointestinal adverse effects. These were kept under separate subgroup headings under 'gastrointestinal' to avoid losing detail.
2.8.1 Constipation
There is one relevant trial (n = 416, Prien 1968). This single study found evidence of a clear difference between chlorpromazine low dose (≤ 400 mg/day) and high dose (> 800 mg/day ‐ all medium term, RR 0.27, 95% CI 0.09 to 0.79, Analysis 2.8).
2.8.2 Diarrhoea
In this subgroup we identified one relevant trial (n = 416, Prien 1968) reporting no evidence of a clear difference between chlorpromazine low dose (≤ 400 mg/day) and high dose (> 800 mg/day ‐ all medium term, RR 0.50, 95% CI 0.09 to 2.70, Analysis 2.8).
2.8.3 Nausea, vomiting
We found one relevant trial (n = 416, Prien 1968). This single study found no evidence of a clear difference between chlorpromazine low dose (≤ 400 mg/day) and high dose (> 800 mg/day ‐ all medium term, RR 0.67, 95% CI 0.19 to 2.33, Analysis 2.8).
2.9 Adverse effects: 7. Genitourinary
2.9.1 Urinary disturbance
We identified one relevant trial (n = 416, Prien 1968). This single study found no evidence of a clear difference between chlorpromazine low dose (≤ 400 mg/day) and high dose (> 800 mg/day ‐ all medium term, RR 0.50, 95% CI 0.09 to 2.70, Analysis 2.9).
2.10 Adverse effects: 8. Others
The following subgroups were difficult to place under the distinct categories above and so were collectively grouped under 'others'.
2.10.1 Occular ‐ any corneal and/or lens opacities
We identified one relevant trial (n = 416, Prien 1968) reporting several occular outcomes in a paper we identified only for the 2016 update (Prien 1970). This single study found evidence of a clear difference between chlorpromazine low dose (≤ 400 mg/day) and high dose (> 800 mg/day ‐ all medium term, RR 0.35, 95% CI 0.23 to 0.52, Analysis 2.10). From detailed data within Prien 1970 it seems that high dose disproportionally causes corneal difficulties (RR corneal changes 0.07, 95% CI 0.02 to 0.30).
2.10.2 Nasal congestion
In this subgroup we identified one relevant trial (n = 416, Prien 1968). This single study found no evidence of a clear difference between chlorpromazine low dose (≤ 400 mg/day) and high dose (> 800 mg/day ‐ all medium term, RR 1.00, 95% CI 0.14 to 7.03, Analysis 2.10).
3. Sensitivity analysis
Data for only one of the primary outcomes are available. There are data on extrapyramidal side effects but these are not in the long term. So sensitivity analyses can only be carried out for the first primary outcome of global state: no clinically important improvement in global state at medium term.
All trials were randomised. We were therefore unable to undertake a sensitivity analysis on 'implication of randomisation'. Trials were not of the highest methodological quality (Figure 3), but we judged none to be of high risk of bias in enough domains to undertake any meaningful sensitivity analysis.
With regards to assumptions for lost binary data, in this case people lost to follow‐up, these made very little difference. The analysis with assumptions made (Analysis 2.1) and the analysis with complete data only are extremely similar.
Data on the primary outcome were from a single trial and so using a random‐effects model made no difference whatsoever.
Discussion
We only have data on low dose (≤ 400 mg/day) versus medium dose (401 mg/day to 800 mg/day) and low dose versus high dose (> 800 mg/day). Despite over 60 years of use, we do not have any long‐term data at all and most data relate to less than 12 weeks duration.
Summary of main results
1. COMPARISON 1. CHLORPROMAZINE LOW DOSE (≤ 400 mg/day) versus CHLORPROMAZINE MEDIUM DOSE (> 800 mg/day)
Key findings are presented in the summary of findings Table for the main comparison for this comparison.
1.1 Global state: not improved ‐ short term
We had pre‐stated, before seeing data, that this would be a key outcome. However, only one small (n = 60) study reported data and only for the short term. These equivocal data are not convincing of a clear benefit of one dosing regimen over another and we graded these as being at ‘moderate’ risk of bias (moderate = “Further research is likely to have an important impact on our confidence in the estimate of effect and may change the estimate.”).
1.2 Global state: requiring additional medication (sedation with chloral hydrate or a barbiturate > five times)
Only one small (n = 50) study reported data but for the medium term. There was no clear evidence that one dosing regimen was disadvantaged over another with regards to requiring additional medication. We graded these data as being of ‘low’ quality (low = “Further research is very likely to have an important impact on our confidence in the estimate of effect and is likely to change the estimate.”)
1.3 Mental state: average endpoint score (PANSS total, high = poor)
Only one small (n = 60) study reported data and only for the short term. These questionable data provide no clear evidence of one dosing regimen providing a clear benefit over another and we graded these as being of ‘very low’ quality (very low = “We are very uncertain about the estimate.”).
1.4 Leaving the study early ‐ any reason
Two (n = 70) studies reported the data in the short term. These data provided no clear evidence of members of one dosage group being more likely to leave the study early over the other dosage group. Effectively, roughly equal numbers left each group. We graded these data as being of ‘moderate’ quality. Very few people left these studies relative to trials completed today. There may be important design methods to be learned from or perhaps the lack of people who left early may have been due to past attitudes with ethical implications.
1.5 Behaviour: agitation and restlessness ‐ medium term (categorised as adverse event)
Only one (n = 50) small study reported these data in the medium term. These equivocal data are not convincing of a clear benefit of one dosing regimen over another and we graded these as being of’ 'very low’ quality.
1.6 Adverse effects: extrapyramidal symptoms (unspecified extrapyramidal symptoms ‐ short term)
Two (n = 108) studies reported these data in the short term. We graded these data as being of ‘moderate’ quality.
2. COMPARISON 2. CHLORPROMAZINE LOW DOSE (≤ 400 mg/day) versus CHLORPROMAZINE HIGH DOSE (> 800 mg/day)
For these results only data from Prien 1968 were available, a study with 416 patients rated at medium term. We graded these data as ‘moderate’ in quality (moderate = “Further research is likely to have an important impact on our confidence in the estimate of effect and may change the estimate.”).
2.1 Global state: not improved
A clear benefit of chlorpromazine high dose over chlorpromazine low dose was found.
2.2 Leaving the study early ‐ any reason
A clear difference was found between people leaving the study early with a greater amount leaving the study early being from the high dose group with 25% or participants leaving the high‐dose group yet only 15% leaving the low‐dose group. Side effects were accredited very often as being the reason for people in the high‐dose group leaving the study. Indeed, High doses of chlorpromazine can be cardiotoxic (Lipka 1988). The high number of cardiovascular side effects causing early terminations supports this. Furthermore, one person in the high‐dose group died.
2.3 Behaviour: deterioration of behaviour (categorised as reason to leave early)
A clear difference was found with a greater deterioration in behaviour in the low‐dose chlorpromazine group compared to the high‐dose chlorpromazine group.
2.4 Adverse effects: extrapyramidal symptoms – unspecified
A clear difference was found with a greater risk of unspecified extrapyramidal symptoms in the high‐dosing regimen group compared to the low‐dosing regimen group.
2.5 Adverse event: death
No evidence of a clear difference between the two dosing regimens was found.
2.6 Adverse event ‐ occular changes
Although we did not include this outcome in our list predesignated for use in the 'Summary of findings' table ‐ perhaps we should have. This is important and this review provides evidence that the higher doses of chlorpromazine, in the form they were given in 1967 to 1988, were toxic to vision (> 800 mg/day ‐ all medium term, RR 0.35, 95% CI 0.23 to 0.52). This finding, in itself may be enough to discourage the use of chlorpromazine at high doses.
3. Missing outcomes
Overall, we were able to report on very little data on one of the most highly used antipsychotic drugs. The review authors of the previous version of this review stated that they hoped that better data would be reported on chlorpromazine dose within 50 years. However, this review has found only one entire study to add to the included studies (Xu 2009), but similarly to the other studies, there were no data on general functioning, behaviour, quality of life/satisfaction with treatment, cognitive functioning, service use or cost of care.
Overall completeness and applicability of evidence
1. Completeness
Considering that chlorpromazine trials have been published since 1968, it is surprising that we were only able to identify five studies that were usable for our review. Three of these were short term (up to 12 weeks) while two were medium term (13 to 26 weeks). The trials were relatively short as severe adverse effects such as agranulocytosis, aggravation of depression or even death may occur at a later stage and so may be missed entirely or under‐reported. Indeed, only one death was reported overall and this was in one of the longer trials (Prien 1968). Furthermore, more time may be necessary to improve symptoms causing impairments in social interaction. This aspect of schizophrenia is likely to be of great importance and concern for those with the disorder. Although rather limited data were provided on patient behaviour, there was no reporting of consequences for patients such as social or life skills.
The outcomes reported focused largely on symptoms of adverse effects. However, data on extrapyramidal symptoms (specifically pseudoparkinsonism, tardive dyskinesia and neuroleptic malignant syndrome) were uncommon or indirect. Cost of care was not mentioned in any of the studies. These topic areas should be given more attention in future studies.
2. Applicability
Four of these studies were completed in Western countries20 years ago. Xu 2009 was a more recent study completed in China. These reviews are intended for the world, not just westernised civilisations. Therefore, the study completed in China may be in fact more applicable as China houses about one fifth of the world's population.
All usable studies were hospital‐based. Though the setting has no influence on our primary outcomes, some of the secondary outcomes, such as general functioning, can not be assessed correctly under these circumstances.
Quality of the evidence
The quality of evidence was not very high (Figure 3). Although each study stated to be randomised, the random sequence generation was not described satisfactorily as no unequivocal details were reported. Wode‐Helgodt 1978 refers to Armitage 1971, in which their method of restricted randomisation is outlined. Furthermore, allocation concealment was not mentioned in any of the studies. This is particularly surprising and perhaps concerning of Xu 2009 considering how recent the study is. What is more, only Chouinard 1976 and Xu 2009 appeared to be free from selection bias. Nevertheless, all studies except Xu 2009 were blinded correctly with a brief description. Numerous studies were not reported completely (usually missing SD values), or failed to report all the outcomes measured. Although in Chouinard 1976, it is not clear to which treatment group the person who dropped out belonged, we are informed of the last observation carried forward (LOCF) method being employed for the statistical analysis. Clark 1972 did not report to which treatment group people who dropped out belonged, and we were not informed of their approach to analysis for those who dropped out. Furthermore, Prien 1968 does not make clear to the reader how the person who died is accounted for. Clark 1972 may be biased due to their support from Smith, Kline and French Laboratories. The other studies appeared to be free from other biases.
To conclude, it is likely that there should be an over‐estimation of the positive effect of the experimental intervention due to the degree of bias in the included studies (Jüni 2001). Although Clark 1972 was industry‐sponsored, it is not an innovative treatment being tested experimentally but an older treatment being tested for optimum dosage. This may offset the over‐estimates expected otherwise.
Regarding heterogeneity, few outcomes have more than one study and for those that do, there is no suggestion of heterogeneity from visual inspection or the I2 statistic.
Potential biases in the review process
We may have introduced a potential bias in this update by reading the original review before updating it (Liu 2009).
A potential bias may have been introduced when we did not adhere to the Methods in one instance (seeDifferences between protocol and review).
Cooper 1973 and Curry 1976 were not randomised and so had to be excluded outright. Andrews 1976; Bartko 1988; Clark 1978; Crane 1968; Janakiramaiah 1982 reported data in a way that made them unusable. Furthermore, Crane 1968 made no data available before the cross‐over and so was unusable.
Xu 2009 was the only study for which we could report all the outcomes. In the remaining included studies only a proportion of the outcomes were reported in a usable way. It is possible that the trialists reported outcomes clearly only if they regarded them as important, prohibiting inclusion of potentially meaningful findings. Nonetheless, the studies do not present findings that we would regard with high suspicion of obvious bias.
Agreements and disagreements with other studies or reviews
We updated the review and checked the information in the previous version of the review. Overall, the updated review is in agreement with the original review (Liu 2009).
We know of no past reviews on this particular area before the original review. The dose analyses of the past have tended to add together several comparisons rather than keeping the data on one compound separate (Davis 1974). We do appreciate how this perspective can also be useful, but it was not the focus of this review.
With new and innovative antipsychotics surfacing, it is unlikely that there would be a renewed commercial interest in chlorpromazine. There is not a potential to make a lot of money from chlorpromazine and so it is unlikely that the pharmaceutical industry would encourage further trials. The current and previous review has brought to light the lack of good quality and relevant trials surrounding dosage of one of the most widely used drugs for psychotic disorders. Indeed, only one relevant trial could be included since the previous review (Xu 2009). All things considered, we think that a review focusing on chlorpromazine dose remains justified.
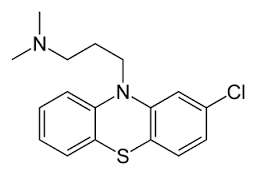
Chlorpromazine structure

Study flow diagram
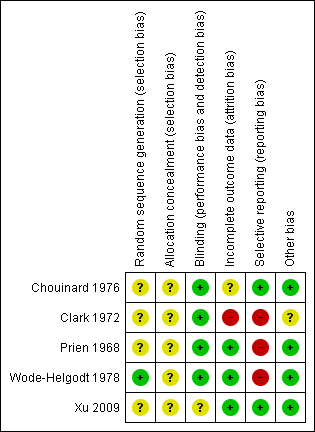
Methodological quality summary: review authors' judgements about each methodological quality item for each included study.
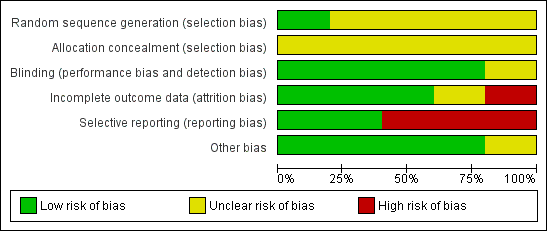
'Risk of bias' graph: review authors' judgements about each risk of bias item presented as percentages across all included studies.
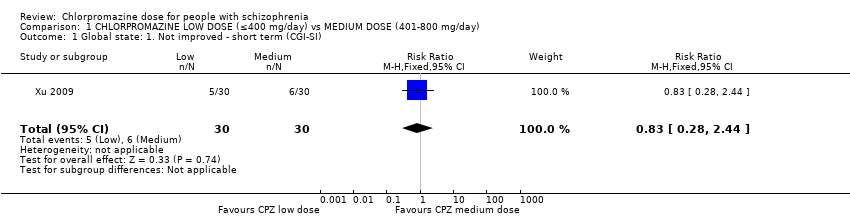
Comparison 1 CHLORPROMAZINE LOW DOSE (≤400 mg/day) vs MEDIUM DOSE (401‐800 mg/day), Outcome 1 Global state: 1. Not improved ‐ short term (CGI‐SI).
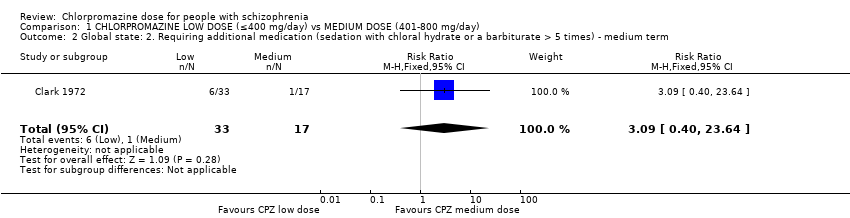
Comparison 1 CHLORPROMAZINE LOW DOSE (≤400 mg/day) vs MEDIUM DOSE (401‐800 mg/day), Outcome 2 Global state: 2. Requiring additional medication (sedation with chloral hydrate or a barbiturate > 5 times) ‐ medium term.
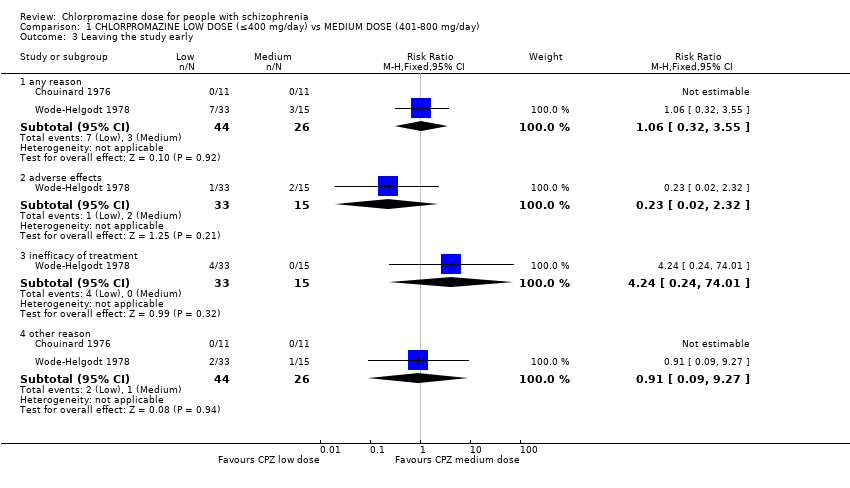
Comparison 1 CHLORPROMAZINE LOW DOSE (≤400 mg/day) vs MEDIUM DOSE (401‐800 mg/day), Outcome 3 Leaving the study early.
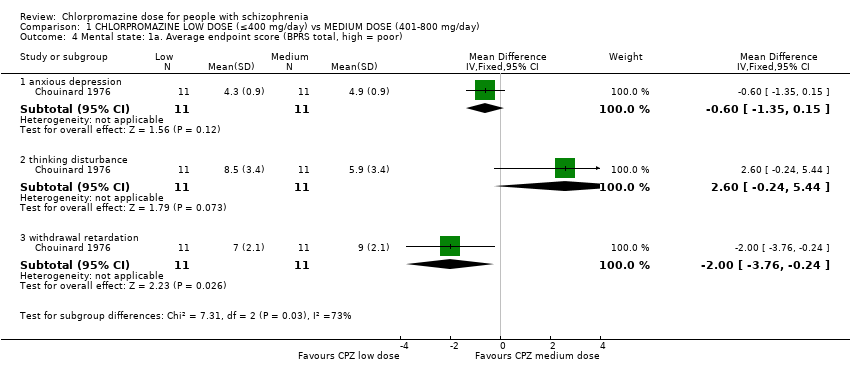
Comparison 1 CHLORPROMAZINE LOW DOSE (≤400 mg/day) vs MEDIUM DOSE (401‐800 mg/day), Outcome 4 Mental state: 1a. Average endpoint score (BPRS total, high = poor).
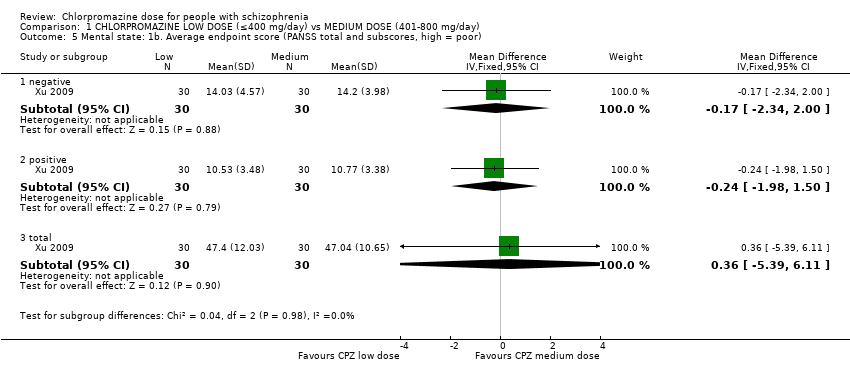
Comparison 1 CHLORPROMAZINE LOW DOSE (≤400 mg/day) vs MEDIUM DOSE (401‐800 mg/day), Outcome 5 Mental state: 1b. Average endpoint score (PANSS total and subscores, high = poor).
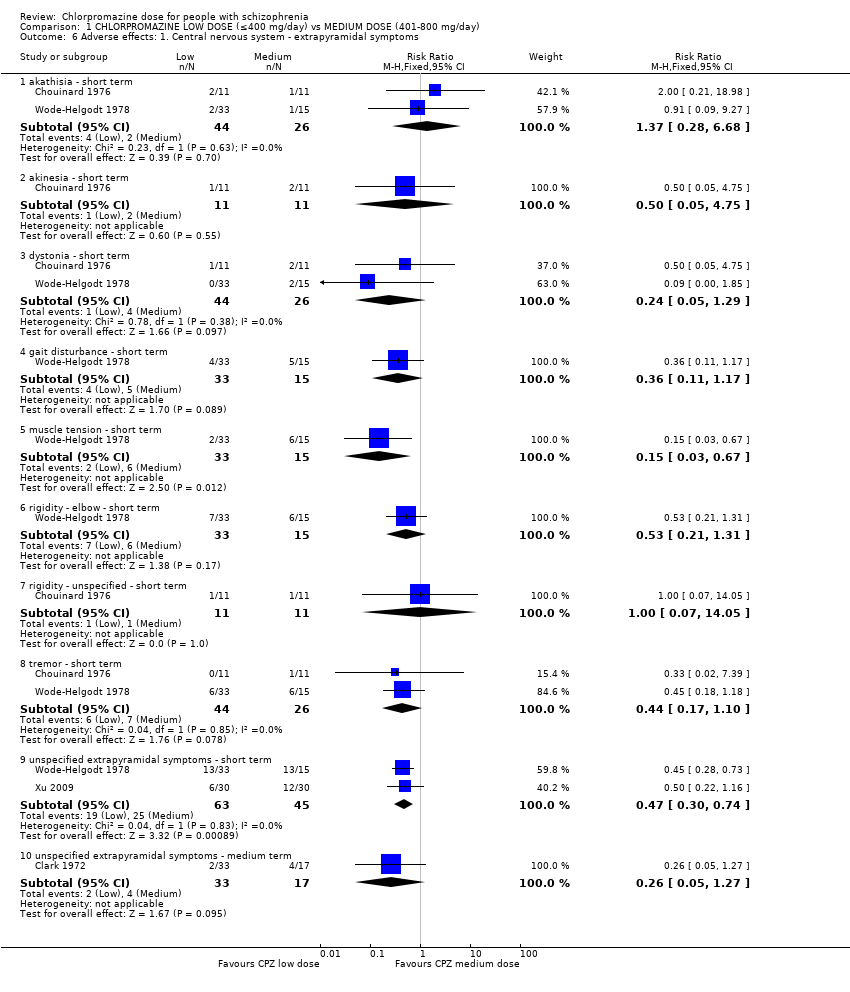
Comparison 1 CHLORPROMAZINE LOW DOSE (≤400 mg/day) vs MEDIUM DOSE (401‐800 mg/day), Outcome 6 Adverse effects: 1. Central nervous system ‐ extrapyramidal symptoms.
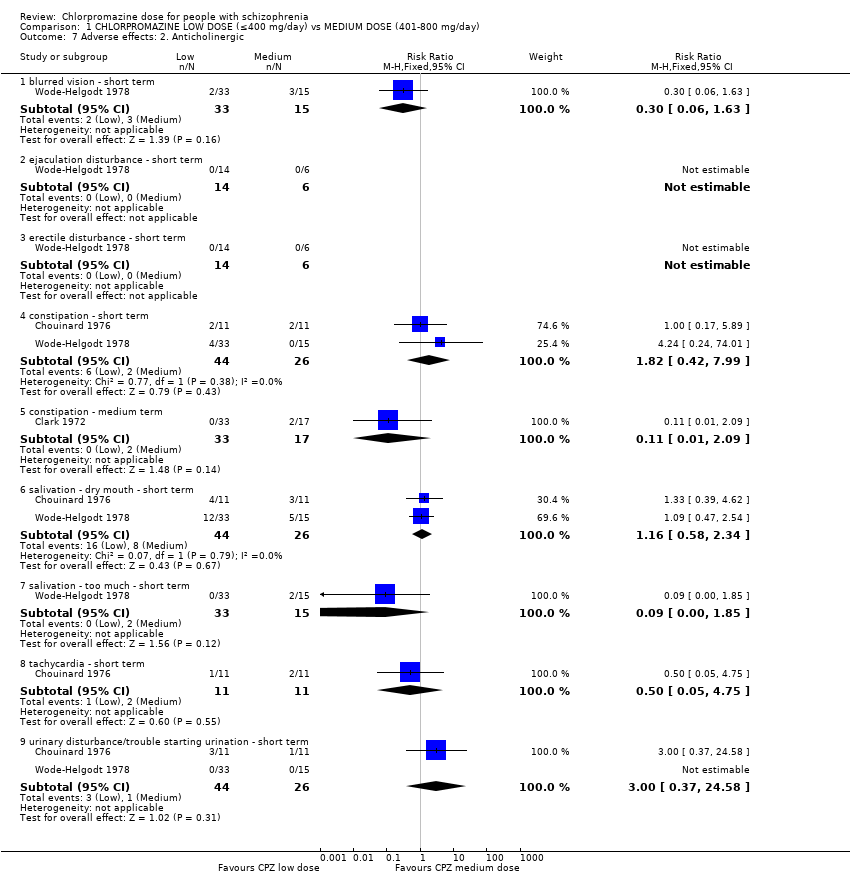
Comparison 1 CHLORPROMAZINE LOW DOSE (≤400 mg/day) vs MEDIUM DOSE (401‐800 mg/day), Outcome 7 Adverse effects: 2. Anticholinergic.
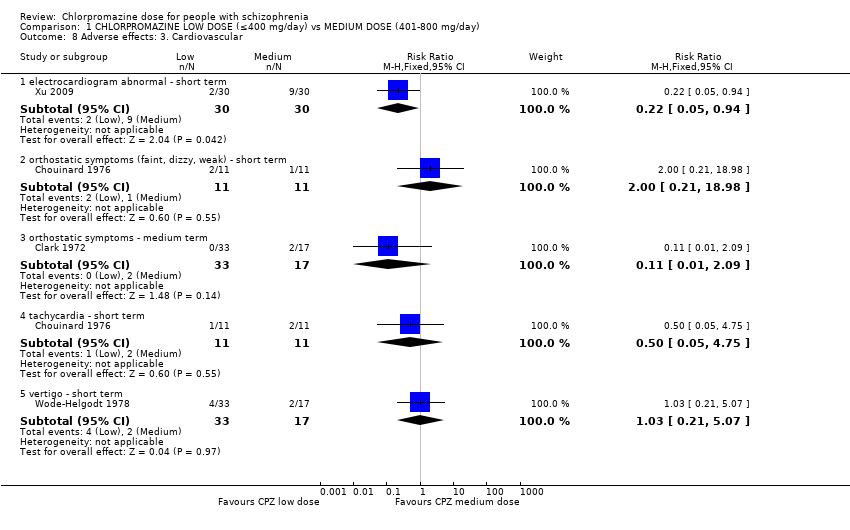
Comparison 1 CHLORPROMAZINE LOW DOSE (≤400 mg/day) vs MEDIUM DOSE (401‐800 mg/day), Outcome 8 Adverse effects: 3. Cardiovascular.
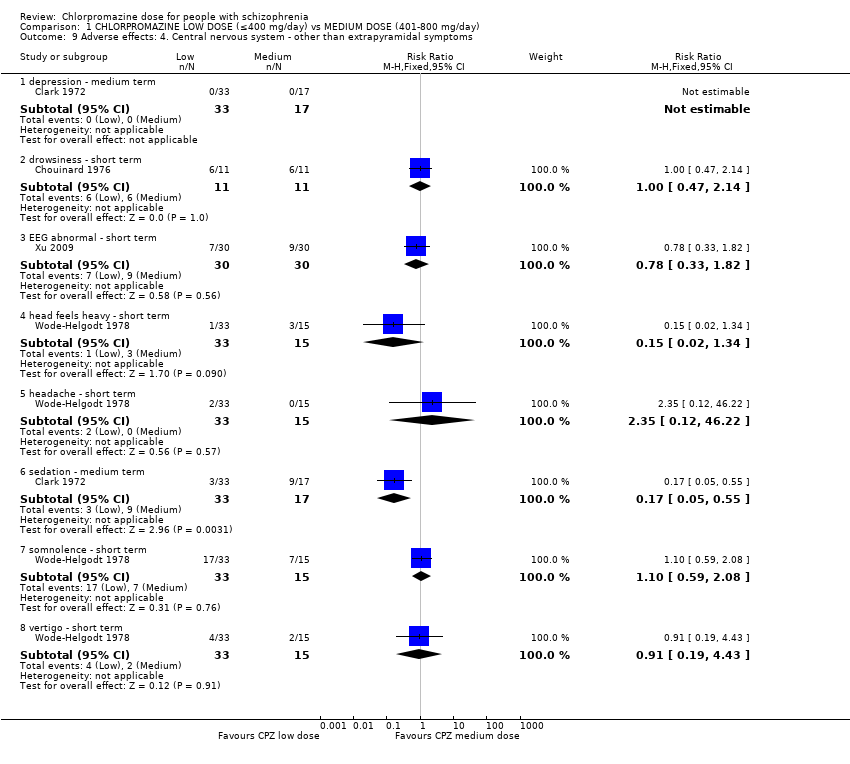
Comparison 1 CHLORPROMAZINE LOW DOSE (≤400 mg/day) vs MEDIUM DOSE (401‐800 mg/day), Outcome 9 Adverse effects: 4. Central nervous system ‐ other than extrapyramidal symptoms.
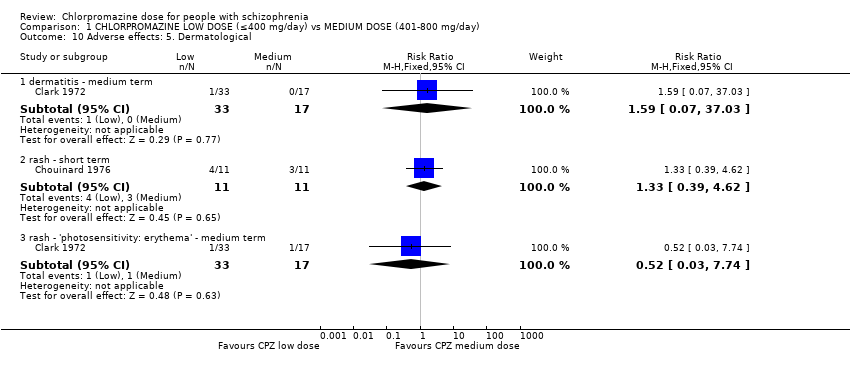
Comparison 1 CHLORPROMAZINE LOW DOSE (≤400 mg/day) vs MEDIUM DOSE (401‐800 mg/day), Outcome 10 Adverse effects: 5. Dermatological.
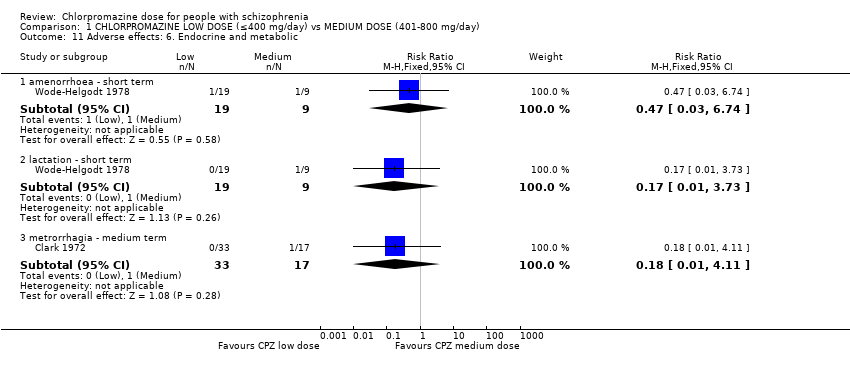
Comparison 1 CHLORPROMAZINE LOW DOSE (≤400 mg/day) vs MEDIUM DOSE (401‐800 mg/day), Outcome 11 Adverse effects: 6. Endocrine and metabolic.
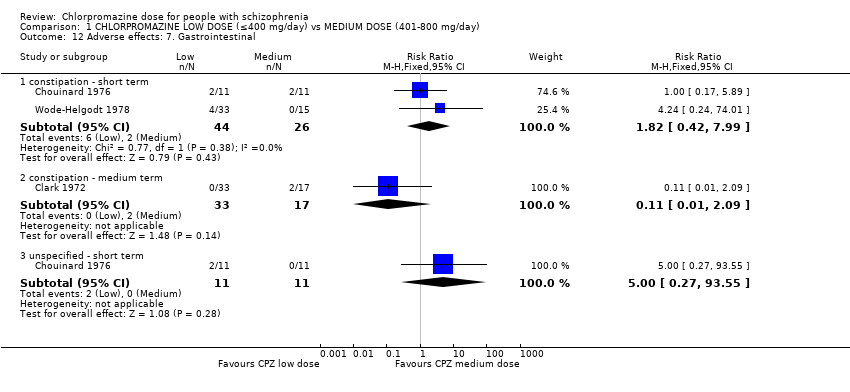
Comparison 1 CHLORPROMAZINE LOW DOSE (≤400 mg/day) vs MEDIUM DOSE (401‐800 mg/day), Outcome 12 Adverse effects: 7. Gastrointestinal.
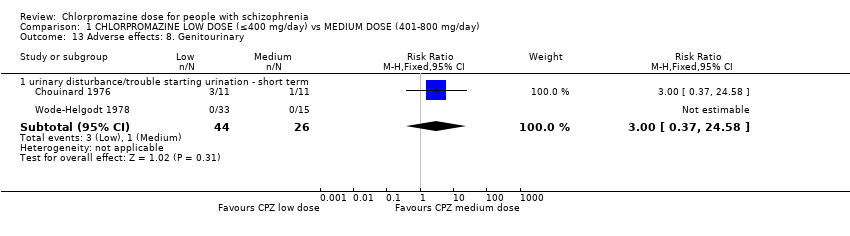
Comparison 1 CHLORPROMAZINE LOW DOSE (≤400 mg/day) vs MEDIUM DOSE (401‐800 mg/day), Outcome 13 Adverse effects: 8. Genitourinary.
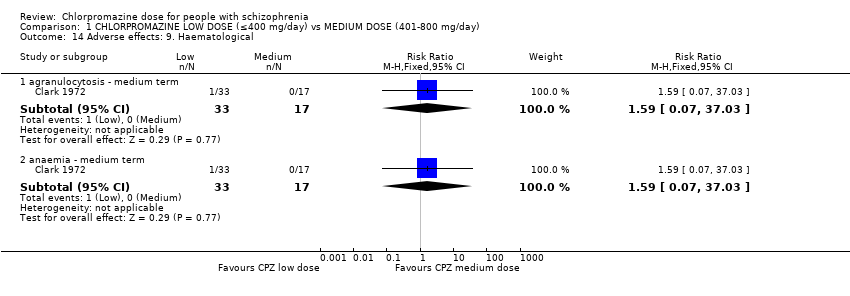
Comparison 1 CHLORPROMAZINE LOW DOSE (≤400 mg/day) vs MEDIUM DOSE (401‐800 mg/day), Outcome 14 Adverse effects: 9. Haematological.
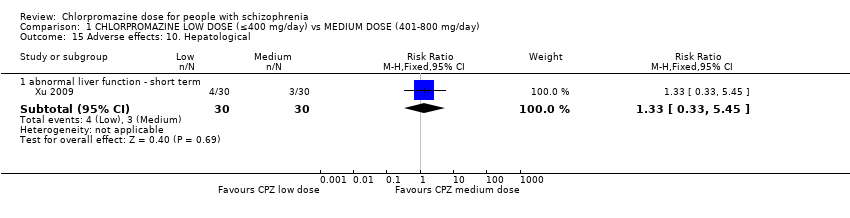
Comparison 1 CHLORPROMAZINE LOW DOSE (≤400 mg/day) vs MEDIUM DOSE (401‐800 mg/day), Outcome 15 Adverse effects: 10. Hepatological.
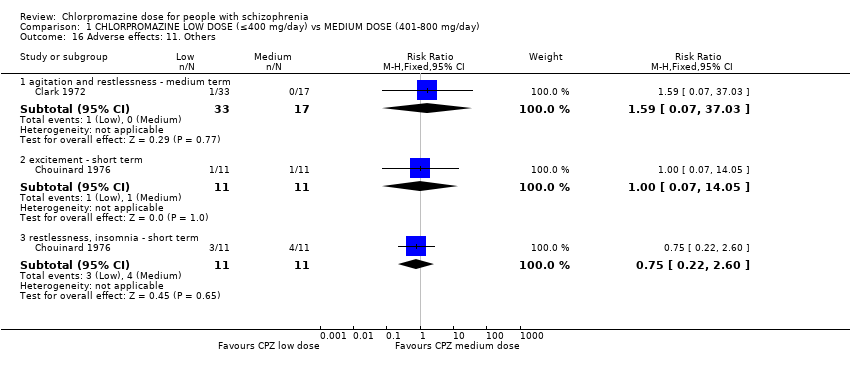
Comparison 1 CHLORPROMAZINE LOW DOSE (≤400 mg/day) vs MEDIUM DOSE (401‐800 mg/day), Outcome 16 Adverse effects: 11. Others.
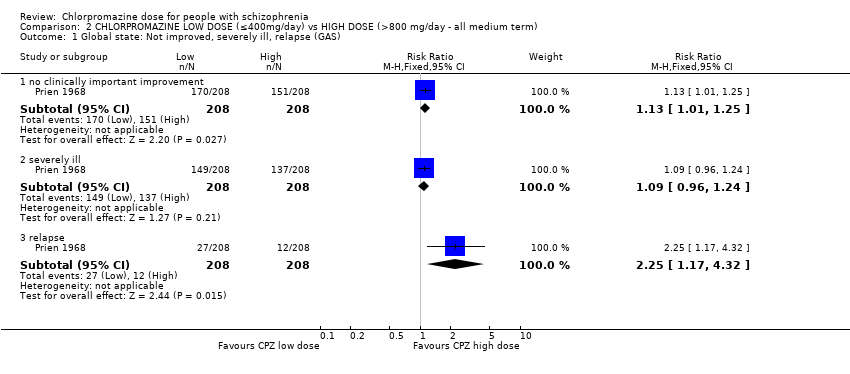
Comparison 2 CHLORPROMAZINE LOW DOSE (≤400mg/day) vs HIGH DOSE (>800 mg/day ‐ all medium term), Outcome 1 Global state: Not improved, severely ill, relapse (GAS).
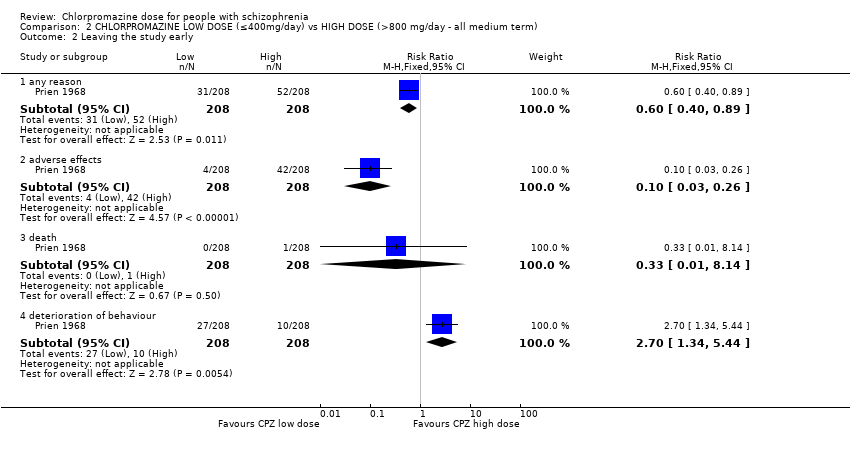
Comparison 2 CHLORPROMAZINE LOW DOSE (≤400mg/day) vs HIGH DOSE (>800 mg/day ‐ all medium term), Outcome 2 Leaving the study early.
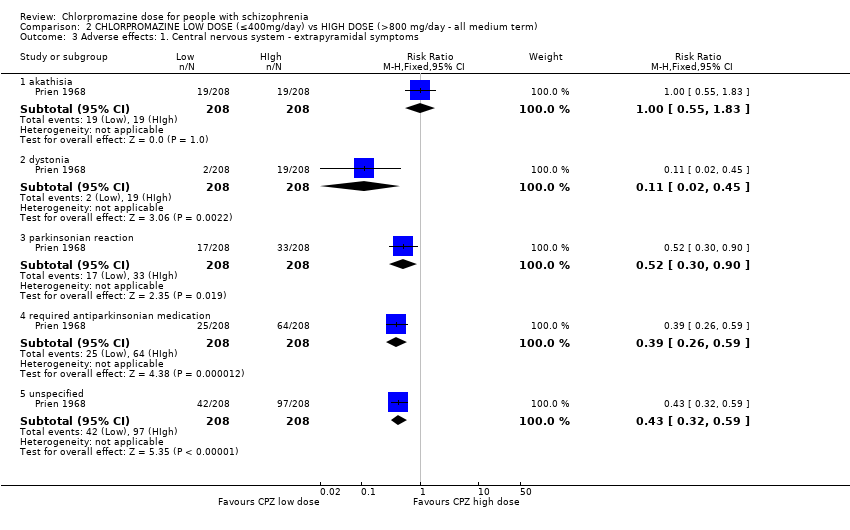
Comparison 2 CHLORPROMAZINE LOW DOSE (≤400mg/day) vs HIGH DOSE (>800 mg/day ‐ all medium term), Outcome 3 Adverse effects: 1. Central nervous system ‐ extrapyramidal symptoms.
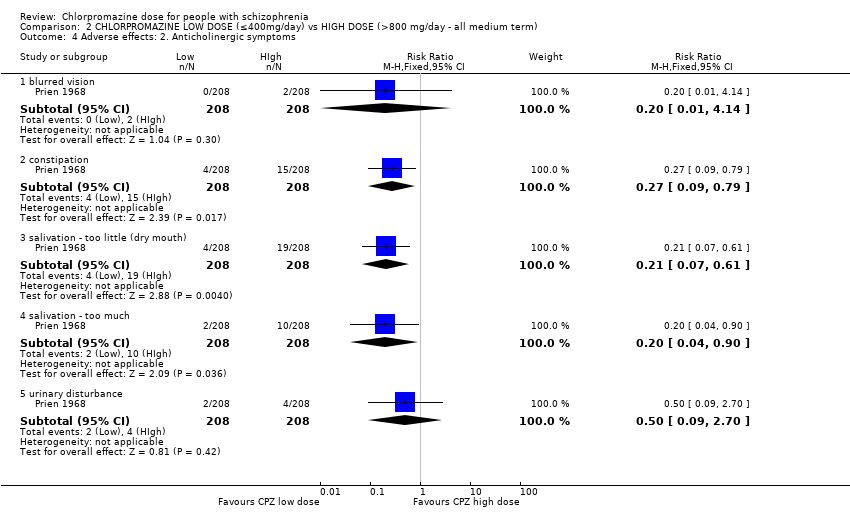
Comparison 2 CHLORPROMAZINE LOW DOSE (≤400mg/day) vs HIGH DOSE (>800 mg/day ‐ all medium term), Outcome 4 Adverse effects: 2. Anticholinergic symptoms.
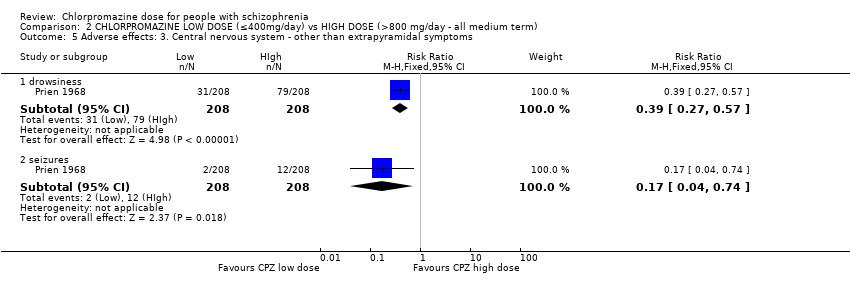
Comparison 2 CHLORPROMAZINE LOW DOSE (≤400mg/day) vs HIGH DOSE (>800 mg/day ‐ all medium term), Outcome 5 Adverse effects: 3. Central nervous system ‐ other than extrapyramidal symptoms.
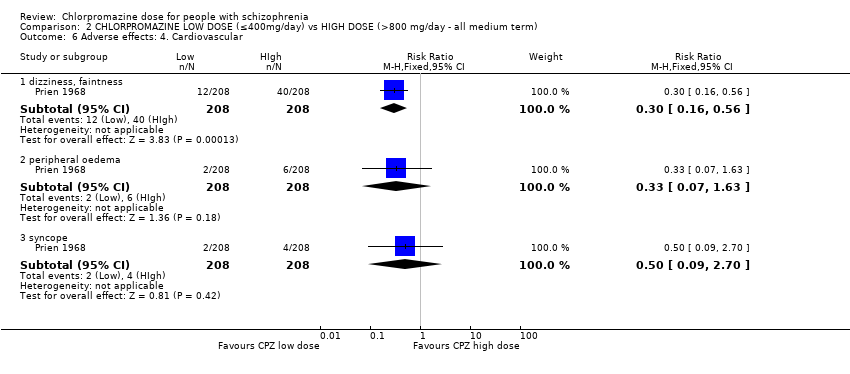
Comparison 2 CHLORPROMAZINE LOW DOSE (≤400mg/day) vs HIGH DOSE (>800 mg/day ‐ all medium term), Outcome 6 Adverse effects: 4. Cardiovascular.
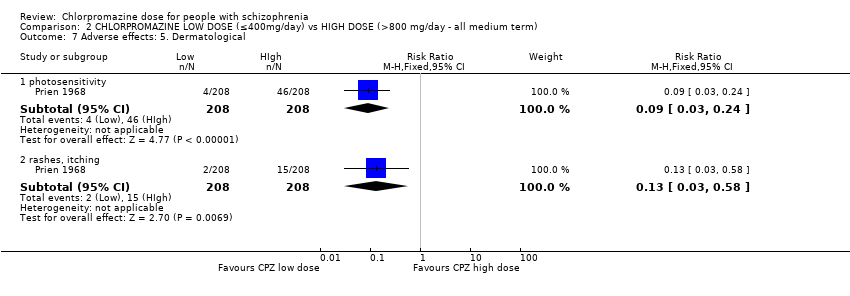
Comparison 2 CHLORPROMAZINE LOW DOSE (≤400mg/day) vs HIGH DOSE (>800 mg/day ‐ all medium term), Outcome 7 Adverse effects: 5. Dermatological.
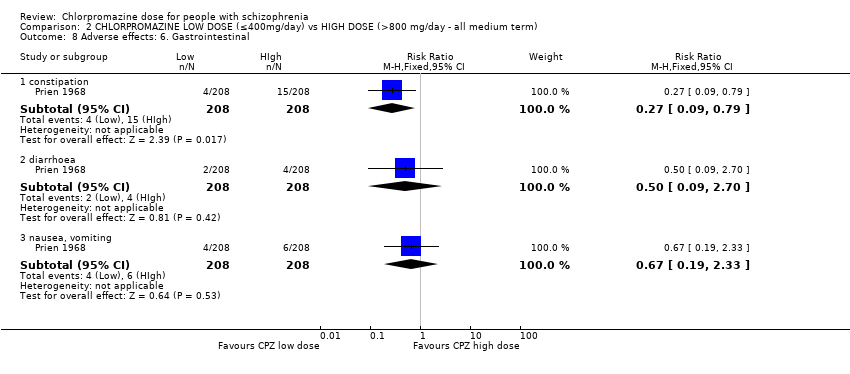
Comparison 2 CHLORPROMAZINE LOW DOSE (≤400mg/day) vs HIGH DOSE (>800 mg/day ‐ all medium term), Outcome 8 Adverse effects: 6. Gastrointestinal.
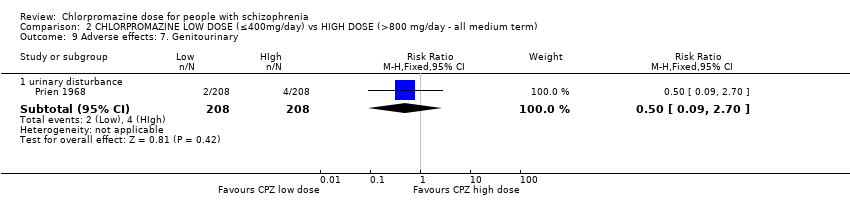
Comparison 2 CHLORPROMAZINE LOW DOSE (≤400mg/day) vs HIGH DOSE (>800 mg/day ‐ all medium term), Outcome 9 Adverse effects: 7. Genitourinary.
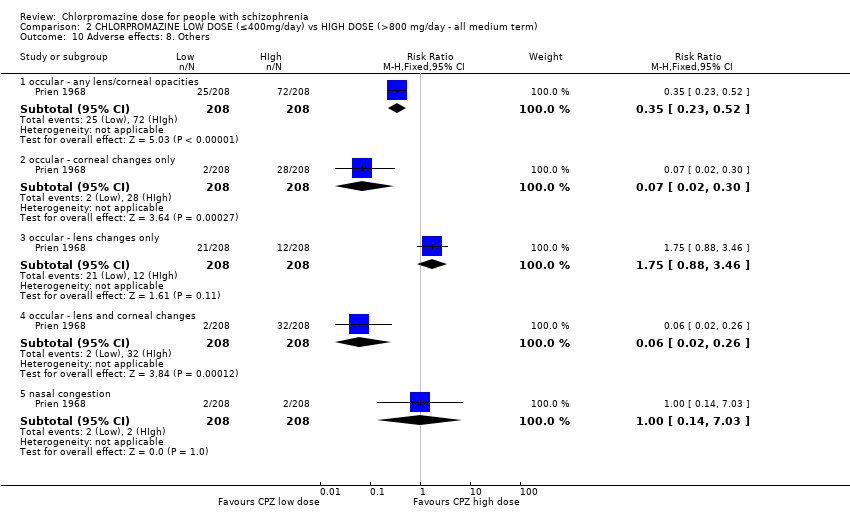
Comparison 2 CHLORPROMAZINE LOW DOSE (≤400mg/day) vs HIGH DOSE (>800 mg/day ‐ all medium term), Outcome 10 Adverse effects: 8. Others.
| Medication | Comparison | For people with | Relevant excluded study | Relevant existing Cochrane review | |
| Antiparkinsonian drug ‐ unspecified | Antiparkinsonian treatment versus placebo | Movement disorders | ‐ | ||
| Antipsychotic drugs ‐ unspecified | Doses | Any antipsychotic at high chlorpromazine equivalent dosages vs lower chlorpromazine equivalent dosages | Schizophrenia | ‐ | |
| Dose reduction of multiple antipsychotics versus control group | ‐ | ||||
| Timing of treatment | Treatment days per week of antipsychotics | ‐ | |||
| Chlorpromazine | Mostly versus other antipsychotic drug | Chlorpromazine brand comparisons | ‐ | ||
| Chlorpromazine versus clopenthixol | |||||
| Chlorpromazine versus clozapine | |||||
| Chlorpromazine versus haloperidol | |||||
| Chlorpromazine versus placebo | Borison 1991; Clark 1967; Clark 1970a; Clark 1970b; Eitan 1992 | ||||
| Chlorpromazine versus rimcazole | ‐ | ||||
| Chlorpromazine versus risperidone | |||||
| Chlorpromazine versus thioridazine | |||||
| Chlorpromazine versus trifluoperazine | |||||
| Doses | Ultra‐low doses of chlorpromazine | ‐ | |||
| Ultra‐low doses of thioridazine | ‐ | ||||
| Timing of treatment | Night doses versus daytime doses of chlorpromazine | ‐ | |||
| Single doses versus divided doses of chlorpromazine | ‐ | ||||
| Q.I.D versus O.D of chlorpromazine | ‐ | ||||
| Clopenthixol | Clopenthixol versus placebo | ||||
| Clozapine | Clozapine versus risperidone | ||||
| Dextroamphetamine | Dextroamphetamine versus imipramine | ||||
| Dextroamphetamine versus isocarboxazid | |||||
| Dextroamphetamine versus placebo | ‐ | ||||
| Dextroamphetamine versus trifluoperazine | ‐ | ||||
| Haloperidol | Haloperidol versus placebo | ||||
| Haloperidol versus trifluoperazine | |||||
| Haloperidol versus thioridazine | |||||
| Imipramine | ‐ | ‐ | |||
| Isocarboxazid | Isocarboxazid versus placebo | ||||
| Isocarboxazid versus trifluoperazine | |||||
| Rimcazole | Rimcazole versus placebo | ‐ | |||
| Doses | Rimcazole dose | ‐ | |||
| Risperidone | ‐ | ‐ | |||
| Thioridazine | Thioridazine versus placebo | ||||
| Timing of treatment | Night doses versus daytime doses of thioridazine | ‐ | |||
| Timing of treatment | Thioridazine ‐ single doses versus divided doses | ‐ | |||
| Trifluoperazine | Trifluoperazine versus placebo | ||||
| Trifluoperazine versus thioridazine | |||||
| Trihexyphenidyl | Trihexyphenidyl versus placebo | Movement disorders | ‐ | ||
| Vitamin preparation | Vitamin preparation versus placebo | Schizophrenia | |||
| Methods | Allocation: clearly randomised, well‐described concealment. Blindness: triple‐blinding clearly described including information on method administration, volume and concentration of chlorpromazine. Duration: 28 weeks (2 weeks of no antipsychotic medication). |
| Participants | Diagnosis: people with schizophrenia ‐ diagnosed by any criteria. Age: any. Sex: both. N = 450.* History: acute or long‐term illness. Excluded: borderline cases, mental deficiency (IQ < 70), bad physical health with complicating organic illness or known brain damage, medical conditions constraining use of high doses, alcoholism or drug use, showing severe suicidal or aggressive impulses. |
| Interventions | 1. Chlorpromazine: dose 300 mg/day. N = 150. |
| Outcomes | Leaving the study early (reasons, timing, gender and treatment group provided). Deaths. Adverse effects (clinically important and specific). Needing additional medication (information about doses, timings and reasons for drug administration provided). Effectiveness:
|
| Notes | * 150 in each group allows for good statistical power. |
| CHLORPROMAZINE LOW DOSE (≤ 400 mg/day) compared to MEDIUM DOSE (401 mg/day to 800 mg/day) for people with schizophrenia | |||||
| Patient or population: people with schizophrenia | |||||
| Outcomes | Illustrative comparative risks* (95% CI) | Relative effect | No of Participants | Quality of the evidence | |
| Assumed risk | Corresponding risk | ||||
| MEDIUM DOSE (401‐800 mg/day) | CHLORPROMAZINE LOW DOSE (≤ 400 mg/day) | ||||
| Global state: no improvement ‐ short term | Low1 | RR 0.83 | 60 | ⊕⊝⊝⊝ | |
| 100 per 1000 | 83 per 1000 | ||||
| Moderate1 | |||||
| 200 per 1000 | 166 per 1000 | ||||
| High1 | |||||
| 300 per 1000 | 249 per 1000 | ||||
| Global state: needing additional medication (sedation with chloral hydrate or a barbiturate > 5 times) ‐ medium term | Low1 | RR 3.09 | 50 | ⊕⊕⊝⊝ | |
| 20 per 1000 | 62 per 1000 | ||||
| Moderate1 | |||||
| 60 per 1000 | 185 per 1000 | ||||
| High1 | |||||
| 100 per 1000 | 309 per 1000 | ||||
| Mental state: average endpoint score (PANSS total, high=poor) | The mean mental state: average endpoint score (PANSS total, high = poor) in the intervention groups was | 60 | ⊕⊝⊝⊝ | ||
| Leaving the study early ‐ any reason | Low1 | RR 1.06 | 70 | ⊕⊕⊕⊝ | |
| 50 per 1000 | 53 per 1000 | ||||
| Moderate1 | |||||
| 100 per 1000 | 106 per 1000 | ||||
| High1 | |||||
| 150 per 1000 | 159 per 1000 | ||||
| Behaviour: agitation and restlessness ‐ medium term (categorised as adverse event) | Study population | RR 1.59 | 50 | ⊕⊝⊝⊝ | |
| 0 per 1000 | 0 per 1000 | ||||
| Moderate | |||||
| 0 per 1000 | 0 per 1000 | ||||
| Adverse effects: extrapyramidal symptoms (unspecified extrapyramidal symptoms ‐ short term) | Low | RR 0.47 | 108 | ⊕⊕⊕⊝ | |
| 200 per 1000 | 94 per 1000 | ||||
| Moderate | |||||
| 500 per 1000 | 235 per 1000 | ||||
| High | |||||
| 800 per 1000 | 376 per 1000 | ||||
| Adverse event: death | No trial reported this outcome | ||||
| *The basis for the assumed risk (e.g. the median control group risk across studies) is provided in footnotes. The corresponding risk (and its 95% confidence interval) is based on the assumed risk in the comparison group and the relative effect of the intervention (and its 95% CI). | |||||
| GRADE Working Group grades of evidence | |||||
| 1 Indirectness: rated serious: downgraded by 1 ‐ unclear if clinically important improvement, no prespecified medium‐term data available. | |||||
| CHLORPROMAZINE LOW DOSE (≤ 400 mg/day) compared to HIGH DOSE (> 800 mg/day‐ all medium term) for people with schizophrenia | ||||||
| Patient or population: patients with people with schizophrenia | ||||||
| Outcomes | Illustrative comparative risks* (95% CI) | Relative effect | No of Participants | Quality of the evidence | Comment | |
| Assumed risk | Corresponding risk | |||||
| HIGH DOSE (>800 mg/day‐ all medium term) | CHLORPROMAZINE LOW DOSE (≤ 400 mg/day) | |||||
| Global state: no clinically important improvement ‐ medium term | Low1 | RR 1.13 | 416 | ⊕⊕⊕⊝ | ||
| 300 per 1000 | 339 per 1000 | |||||
| Moderate1 | ||||||
| 700 per 1000 | 791 per 1000 | |||||
| High1 | ||||||
| 900 per 1000 | 1000 per 1000 | |||||
| Global state: requiring additional medication (sedation with chloral hydrate or a barbiturate > 5 times) | See comment | See comment | Not estimable | 0 | See comment | No data available |
| Mental state: no clinically important change in mental state | See comment | See comment | Not estimable | 0 | See comment | No data available |
| Leaving the study early ‐ any reason | Low1 | RR 0.60 | 416 | ⊕⊕⊕⊝ | ||
| 100 per 1000 | 60 per 1000 | |||||
| Moderate1 | ||||||
| 250 per 1000 | 150 per 1000 | |||||
| High1 | ||||||
| 500 per 1000 | 300 per 1000 | |||||
| Behaviour: deterioration of behaviour (categorised as reason to leave early) | Low | RR 2.70 | 416 | ⊕⊕⊝⊝ | ||
| 20 per 1000 | 54 per 1000 | |||||
| Moderate | ||||||
| 50 per 1000 | 135 per 1000 | |||||
| High | ||||||
| 100 per 1000 | 270 per 1000 | |||||
| Adverse effects: unspecified extrapyramidal symptoms | Low | RR 0.43 | 416 | ⊕⊕⊕⊝ | ||
| 200 per 1000 | 86 per 1000 | |||||
| Moderate | ||||||
| 500 per 1000 | 215 per 1000 | |||||
| High | ||||||
| 700 per 1000 | 301 per 1000 | |||||
| Adverse event: death | Low | RR 0.33 | 416 | ⊕⊕⊕⊝ | ||
| 0 per 1000 | 0 per 1000 | |||||
| Moderate | ||||||
| 5 per 1000 | 2 per 1000 | |||||
| High | ||||||
| 50 per 1000 | 17 per 1000 | |||||
| *The basis for the assumed risk (e.g. the median control group risk across studies) is provided in footnotes. The corresponding risk (and its 95% confidence interval) is based on the assumed risk in the comparison group and the relative effect of the intervention (and its 95% CI). | ||||||
| GRADE Working Group grades of evidence | ||||||
| 1 Risk of bias: rated serious: downgraded by 1 ‐ randomisation not described well, no mention of allocation concealment, concern regarding selective reporting. 2Indirectness: rated serious: downgraded by 1 ‐ unclear if clinically important change in behaviour, rated within trial as leaving the study early outcome. | ||||||
| Outcome or subgroup title | No. of studies | No. of participants | Statistical method | Effect size |
| 1 Global state: 1. Not improved ‐ short term (CGI‐SI) Show forest plot | 1 | 60 | Risk Ratio (M‐H, Fixed, 95% CI) | 0.83 [0.28, 2.44] |
| 2 Global state: 2. Requiring additional medication (sedation with chloral hydrate or a barbiturate > 5 times) ‐ medium term Show forest plot | 1 | 50 | Risk Ratio (M‐H, Fixed, 95% CI) | 3.09 [0.40, 23.64] |
| 3 Leaving the study early Show forest plot | 2 | Risk Ratio (M‐H, Fixed, 95% CI) | Subtotals only | |
| 3.1 any reason | 2 | 70 | Risk Ratio (M‐H, Fixed, 95% CI) | 1.06 [0.32, 3.55] |
| 3.2 adverse effects | 1 | 48 | Risk Ratio (M‐H, Fixed, 95% CI) | 0.23 [0.02, 2.32] |
| 3.3 inefficacy of treatment | 1 | 48 | Risk Ratio (M‐H, Fixed, 95% CI) | 4.24 [0.24, 74.01] |
| 3.4 other reason | 2 | 70 | Risk Ratio (M‐H, Fixed, 95% CI) | 0.91 [0.09, 9.27] |
| 4 Mental state: 1a. Average endpoint score (BPRS total, high = poor) Show forest plot | 1 | Mean Difference (IV, Fixed, 95% CI) | Subtotals only | |
| 4.1 anxious depression | 1 | 22 | Mean Difference (IV, Fixed, 95% CI) | ‐0.60 [‐1.35, 0.15] |
| 4.2 thinking disturbance | 1 | 22 | Mean Difference (IV, Fixed, 95% CI) | 2.60 [‐0.24, 5.44] |
| 4.3 withdrawal retardation | 1 | 22 | Mean Difference (IV, Fixed, 95% CI) | ‐2.0 [‐3.76, ‐0.24] |
| 5 Mental state: 1b. Average endpoint score (PANSS total and subscores, high = poor) Show forest plot | 1 | Mean Difference (IV, Fixed, 95% CI) | Subtotals only | |
| 5.1 negative | 1 | 60 | Mean Difference (IV, Fixed, 95% CI) | ‐0.17 [‐2.34, 2.00] |
| 5.2 positive | 1 | 60 | Mean Difference (IV, Fixed, 95% CI) | ‐0.24 [‐1.98, 1.50] |
| 5.3 total | 1 | 60 | Mean Difference (IV, Fixed, 95% CI) | 0.36 [‐5.39, 6.11] |
| 6 Adverse effects: 1. Central nervous system ‐ extrapyramidal symptoms Show forest plot | 4 | Risk Ratio (M‐H, Fixed, 95% CI) | Subtotals only | |
| 6.1 akathisia ‐ short term | 2 | 70 | Risk Ratio (M‐H, Fixed, 95% CI) | 1.37 [0.28, 6.68] |
| 6.2 akinesia ‐ short term | 1 | 22 | Risk Ratio (M‐H, Fixed, 95% CI) | 0.5 [0.05, 4.75] |
| 6.3 dystonia ‐ short term | 2 | 70 | Risk Ratio (M‐H, Fixed, 95% CI) | 0.24 [0.05, 1.29] |
| 6.4 gait disturbance ‐ short term | 1 | 48 | Risk Ratio (M‐H, Fixed, 95% CI) | 0.36 [0.11, 1.17] |
| 6.5 muscle tension ‐ short term | 1 | 48 | Risk Ratio (M‐H, Fixed, 95% CI) | 0.15 [0.03, 0.67] |
| 6.6 rigidity ‐ elbow ‐ short term | 1 | 48 | Risk Ratio (M‐H, Fixed, 95% CI) | 0.53 [0.21, 1.31] |
| 6.7 rigidity ‐ unspecified ‐ short term | 1 | 22 | Risk Ratio (M‐H, Fixed, 95% CI) | 1.0 [0.07, 14.05] |
| 6.8 tremor ‐ short term | 2 | 70 | Risk Ratio (M‐H, Fixed, 95% CI) | 0.44 [0.17, 1.10] |
| 6.9 unspecified extrapyramidal symptoms ‐ short term | 2 | 108 | Risk Ratio (M‐H, Fixed, 95% CI) | 0.47 [0.30, 0.74] |
| 6.10 unspecified extrapyramidal symptoms ‐ medium term | 1 | 50 | Risk Ratio (M‐H, Fixed, 95% CI) | 0.26 [0.05, 1.27] |
| 7 Adverse effects: 2. Anticholinergic Show forest plot | 3 | Risk Ratio (M‐H, Fixed, 95% CI) | Subtotals only | |
| 7.1 blurred vision ‐ short term | 1 | 48 | Risk Ratio (M‐H, Fixed, 95% CI) | 0.30 [0.06, 1.63] |
| 7.2 ejaculation disturbance ‐ short term | 1 | 20 | Risk Ratio (M‐H, Fixed, 95% CI) | 0.0 [0.0, 0.0] |
| 7.3 erectile disturbance ‐ short term | 1 | 20 | Risk Ratio (M‐H, Fixed, 95% CI) | 0.0 [0.0, 0.0] |
| 7.4 constipation ‐ short term | 2 | 70 | Risk Ratio (M‐H, Fixed, 95% CI) | 1.82 [0.42, 7.99] |
| 7.5 constipation ‐ medium term | 1 | 50 | Risk Ratio (M‐H, Fixed, 95% CI) | 0.11 [0.01, 2.09] |
| 7.6 salivation ‐ dry mouth ‐ short term | 2 | 70 | Risk Ratio (M‐H, Fixed, 95% CI) | 1.16 [0.58, 2.34] |
| 7.7 salivation ‐ too much ‐ short term | 1 | 48 | Risk Ratio (M‐H, Fixed, 95% CI) | 0.09 [0.00, 1.85] |
| 7.8 tachycardia ‐ short term | 1 | 22 | Risk Ratio (M‐H, Fixed, 95% CI) | 0.5 [0.05, 4.75] |
| 7.9 urinary disturbance/trouble starting urination ‐ short term | 2 | 70 | Risk Ratio (M‐H, Fixed, 95% CI) | 3.0 [0.37, 24.58] |
| 8 Adverse effects: 3. Cardiovascular Show forest plot | 4 | Risk Ratio (M‐H, Fixed, 95% CI) | Subtotals only | |
| 8.1 electrocardiogram abnormal ‐ short term | 1 | 60 | Risk Ratio (M‐H, Fixed, 95% CI) | 0.22 [0.05, 0.94] |
| 8.2 orthostatic symptoms (faint, dizzy, weak) ‐ short term | 1 | 22 | Risk Ratio (M‐H, Fixed, 95% CI) | 2.0 [0.21, 18.98] |
| 8.3 orthostatic symptoms ‐ medium term | 1 | 50 | Risk Ratio (M‐H, Fixed, 95% CI) | 0.11 [0.01, 2.09] |
| 8.4 tachycardia ‐ short term | 1 | 22 | Risk Ratio (M‐H, Fixed, 95% CI) | 0.5 [0.05, 4.75] |
| 8.5 vertigo ‐ short term | 1 | 50 | Risk Ratio (M‐H, Fixed, 95% CI) | 1.03 [0.21, 5.07] |
| 9 Adverse effects: 4. Central nervous system ‐ other than extrapyramidal symptoms Show forest plot | 4 | Risk Ratio (M‐H, Fixed, 95% CI) | Subtotals only | |
| 9.1 depression ‐ medium term | 1 | 50 | Risk Ratio (M‐H, Fixed, 95% CI) | 0.0 [0.0, 0.0] |
| 9.2 drowsiness ‐ short term | 1 | 22 | Risk Ratio (M‐H, Fixed, 95% CI) | 1.0 [0.47, 2.14] |
| 9.3 EEG abnormal ‐ short term | 1 | 60 | Risk Ratio (M‐H, Fixed, 95% CI) | 0.78 [0.33, 1.82] |
| 9.4 head feels heavy ‐ short term | 1 | 48 | Risk Ratio (M‐H, Fixed, 95% CI) | 0.15 [0.02, 1.34] |
| 9.5 headache ‐ short term | 1 | 48 | Risk Ratio (M‐H, Fixed, 95% CI) | 2.35 [0.12, 46.22] |
| 9.6 sedation ‐ medium term | 1 | 50 | Risk Ratio (M‐H, Fixed, 95% CI) | 0.17 [0.05, 0.55] |
| 9.7 somnolence ‐ short term | 1 | 48 | Risk Ratio (M‐H, Fixed, 95% CI) | 1.10 [0.59, 2.08] |
| 9.8 vertigo ‐ short term | 1 | 48 | Risk Ratio (M‐H, Fixed, 95% CI) | 0.91 [0.19, 4.43] |
| 10 Adverse effects: 5. Dermatological Show forest plot | 2 | Risk Ratio (M‐H, Fixed, 95% CI) | Subtotals only | |
| 10.1 dermatitis ‐ medium term | 1 | 50 | Risk Ratio (M‐H, Fixed, 95% CI) | 1.59 [0.07, 37.03] |
| 10.2 rash ‐ short term | 1 | 22 | Risk Ratio (M‐H, Fixed, 95% CI) | 1.33 [0.39, 4.62] |
| 10.3 rash ‐ 'photosensitivity: erythema' ‐ medium term | 1 | 50 | Risk Ratio (M‐H, Fixed, 95% CI) | 0.52 [0.03, 7.74] |
| 11 Adverse effects: 6. Endocrine and metabolic Show forest plot | 2 | Risk Ratio (M‐H, Fixed, 95% CI) | Subtotals only | |
| 11.1 amenorrhoea ‐ short term | 1 | 28 | Risk Ratio (M‐H, Fixed, 95% CI) | 0.47 [0.03, 6.74] |
| 11.2 lactation ‐ short term | 1 | 28 | Risk Ratio (M‐H, Fixed, 95% CI) | 0.17 [0.01, 3.73] |
| 11.3 metrorrhagia ‐ medium term | 1 | 50 | Risk Ratio (M‐H, Fixed, 95% CI) | 0.18 [0.01, 4.11] |
| 12 Adverse effects: 7. Gastrointestinal Show forest plot | 3 | Risk Ratio (M‐H, Fixed, 95% CI) | Subtotals only | |
| 12.1 constipation ‐ short term | 2 | 70 | Risk Ratio (M‐H, Fixed, 95% CI) | 1.82 [0.42, 7.99] |
| 12.2 constipation ‐ medium term | 1 | 50 | Risk Ratio (M‐H, Fixed, 95% CI) | 0.11 [0.01, 2.09] |
| 12.3 unspecified ‐ short term | 1 | 22 | Risk Ratio (M‐H, Fixed, 95% CI) | 5.0 [0.27, 93.55] |
| 13 Adverse effects: 8. Genitourinary Show forest plot | 2 | Risk Ratio (M‐H, Fixed, 95% CI) | Subtotals only | |
| 13.1 urinary disturbance/trouble starting urination ‐ short term | 2 | 70 | Risk Ratio (M‐H, Fixed, 95% CI) | 3.0 [0.37, 24.58] |
| 14 Adverse effects: 9. Haematological Show forest plot | 1 | Risk Ratio (M‐H, Fixed, 95% CI) | Subtotals only | |
| 14.1 agranulocytosis ‐ medium term | 1 | 50 | Risk Ratio (M‐H, Fixed, 95% CI) | 1.59 [0.07, 37.03] |
| 14.2 anaemia ‐ medium term | 1 | 50 | Risk Ratio (M‐H, Fixed, 95% CI) | 1.59 [0.07, 37.03] |
| 15 Adverse effects: 10. Hepatological Show forest plot | 1 | Risk Ratio (M‐H, Fixed, 95% CI) | Subtotals only | |
| 15.1 abnormal liver function ‐ short term | 1 | 60 | Risk Ratio (M‐H, Fixed, 95% CI) | 1.33 [0.33, 5.45] |
| 16 Adverse effects: 11. Others Show forest plot | 2 | Risk Ratio (M‐H, Fixed, 95% CI) | Subtotals only | |
| 16.1 agitation and restlessness ‐ medium term | 1 | 50 | Risk Ratio (M‐H, Fixed, 95% CI) | 1.59 [0.07, 37.03] |
| 16.2 excitement ‐ short term | 1 | 22 | Risk Ratio (M‐H, Fixed, 95% CI) | 1.0 [0.07, 14.05] |
| 16.3 restlessness, insomnia ‐ short term | 1 | 22 | Risk Ratio (M‐H, Fixed, 95% CI) | 0.75 [0.22, 2.60] |
| Outcome or subgroup title | No. of studies | No. of participants | Statistical method | Effect size |
| 1 Global state: Not improved, severely ill, relapse (GAS) Show forest plot | 1 | Risk Ratio (M‐H, Fixed, 95% CI) | Subtotals only | |
| 1.1 no clinically important improvement | 1 | 416 | Risk Ratio (M‐H, Fixed, 95% CI) | 1.13 [1.01, 1.25] |
| 1.2 severely ill | 1 | 416 | Risk Ratio (M‐H, Fixed, 95% CI) | 1.09 [0.96, 1.24] |
| 1.3 relapse | 1 | 416 | Risk Ratio (M‐H, Fixed, 95% CI) | 2.25 [1.17, 4.32] |
| 2 Leaving the study early Show forest plot | 1 | Risk Ratio (M‐H, Fixed, 95% CI) | Subtotals only | |
| 2.1 any reason | 1 | 416 | Risk Ratio (M‐H, Fixed, 95% CI) | 0.60 [0.40, 0.89] |
| 2.2 adverse effects | 1 | 416 | Risk Ratio (M‐H, Fixed, 95% CI) | 0.10 [0.03, 0.26] |
| 2.3 death | 1 | 416 | Risk Ratio (M‐H, Fixed, 95% CI) | 0.33 [0.01, 8.14] |
| 2.4 deterioration of behaviour | 1 | 416 | Risk Ratio (M‐H, Fixed, 95% CI) | 2.7 [1.34, 5.44] |
| 3 Adverse effects: 1. Central nervous system ‐ extrapyramidal symptoms Show forest plot | 1 | Risk Ratio (M‐H, Fixed, 95% CI) | Subtotals only | |
| 3.1 akathisia | 1 | 416 | Risk Ratio (M‐H, Fixed, 95% CI) | 1.0 [0.55, 1.83] |
| 3.2 dystonia | 1 | 416 | Risk Ratio (M‐H, Fixed, 95% CI) | 0.11 [0.02, 0.45] |
| 3.3 parkinsonian reaction | 1 | 416 | Risk Ratio (M‐H, Fixed, 95% CI) | 0.52 [0.30, 0.90] |
| 3.4 required antiparkinsonian medication | 1 | 416 | Risk Ratio (M‐H, Fixed, 95% CI) | 0.39 [0.26, 0.59] |
| 3.5 unspecified | 1 | 416 | Risk Ratio (M‐H, Fixed, 95% CI) | 0.43 [0.32, 0.59] |
| 4 Adverse effects: 2. Anticholinergic symptoms Show forest plot | 1 | Risk Ratio (M‐H, Fixed, 95% CI) | Subtotals only | |
| 4.1 blurred vision | 1 | 416 | Risk Ratio (M‐H, Fixed, 95% CI) | 0.2 [0.01, 4.14] |
| 4.2 constipation | 1 | 416 | Risk Ratio (M‐H, Fixed, 95% CI) | 0.27 [0.09, 0.79] |
| 4.3 salivation ‐ too little (dry mouth) | 1 | 416 | Risk Ratio (M‐H, Fixed, 95% CI) | 0.21 [0.07, 0.61] |
| 4.4 salivation ‐ too much | 1 | 416 | Risk Ratio (M‐H, Fixed, 95% CI) | 0.2 [0.04, 0.90] |
| 4.5 urinary disturbance | 1 | 416 | Risk Ratio (M‐H, Fixed, 95% CI) | 0.5 [0.09, 2.70] |
| 5 Adverse effects: 3. Central nervous system ‐ other than extrapyramidal symptoms Show forest plot | 1 | Risk Ratio (M‐H, Fixed, 95% CI) | Subtotals only | |
| 5.1 drowsiness | 1 | 416 | Risk Ratio (M‐H, Fixed, 95% CI) | 0.39 [0.27, 0.57] |
| 5.2 seizures | 1 | 416 | Risk Ratio (M‐H, Fixed, 95% CI) | 0.17 [0.04, 0.74] |
| 6 Adverse effects: 4. Cardiovascular Show forest plot | 1 | Risk Ratio (M‐H, Fixed, 95% CI) | Subtotals only | |
| 6.1 dizziness, faintness | 1 | 416 | Risk Ratio (M‐H, Fixed, 95% CI) | 0.3 [0.16, 0.56] |
| 6.2 peripheral oedema | 1 | 416 | Risk Ratio (M‐H, Fixed, 95% CI) | 0.33 [0.07, 1.63] |
| 6.3 syncope | 1 | 416 | Risk Ratio (M‐H, Fixed, 95% CI) | 0.5 [0.09, 2.70] |
| 7 Adverse effects: 5. Dermatological Show forest plot | 1 | Risk Ratio (M‐H, Fixed, 95% CI) | Subtotals only | |
| 7.1 photosensitivity | 1 | 416 | Risk Ratio (M‐H, Fixed, 95% CI) | 0.09 [0.03, 0.24] |
| 7.2 rashes, itching | 1 | 416 | Risk Ratio (M‐H, Fixed, 95% CI) | 0.13 [0.03, 0.58] |
| 8 Adverse effects: 6. Gastrointestinal Show forest plot | 1 | Risk Ratio (M‐H, Fixed, 95% CI) | Subtotals only | |
| 8.1 constipation | 1 | 416 | Risk Ratio (M‐H, Fixed, 95% CI) | 0.27 [0.09, 0.79] |
| 8.2 diarrhoea | 1 | 416 | Risk Ratio (M‐H, Fixed, 95% CI) | 0.5 [0.09, 2.70] |
| 8.3 nausea, vomiting | 1 | 416 | Risk Ratio (M‐H, Fixed, 95% CI) | 0.67 [0.19, 2.33] |
| 9 Adverse effects: 7. Genitourinary Show forest plot | 1 | Risk Ratio (M‐H, Fixed, 95% CI) | Subtotals only | |
| 9.1 urinary disturbance | 1 | 416 | Risk Ratio (M‐H, Fixed, 95% CI) | 0.5 [0.09, 2.70] |
| 10 Adverse effects: 8. Others Show forest plot | 1 | Risk Ratio (M‐H, Fixed, 95% CI) | Subtotals only | |
| 10.1 occular ‐ any lens/corneal opacities | 1 | 416 | Risk Ratio (M‐H, Fixed, 95% CI) | 0.35 [0.23, 0.52] |
| 10.2 occular ‐ corneal changes only | 1 | 416 | Risk Ratio (M‐H, Fixed, 95% CI) | 0.07 [0.02, 0.30] |
| 10.3 occular ‐ lens changes only | 1 | 416 | Risk Ratio (M‐H, Fixed, 95% CI) | 1.75 [0.88, 3.46] |
| 10.4 occular ‐ lens and corneal changes | 1 | 416 | Risk Ratio (M‐H, Fixed, 95% CI) | 0.06 [0.02, 0.26] |
| 10.5 nasal congestion | 1 | 416 | Risk Ratio (M‐H, Fixed, 95% CI) | 1.0 [0.14, 7.03] |