Scolaris Content Display Scolaris Content Display

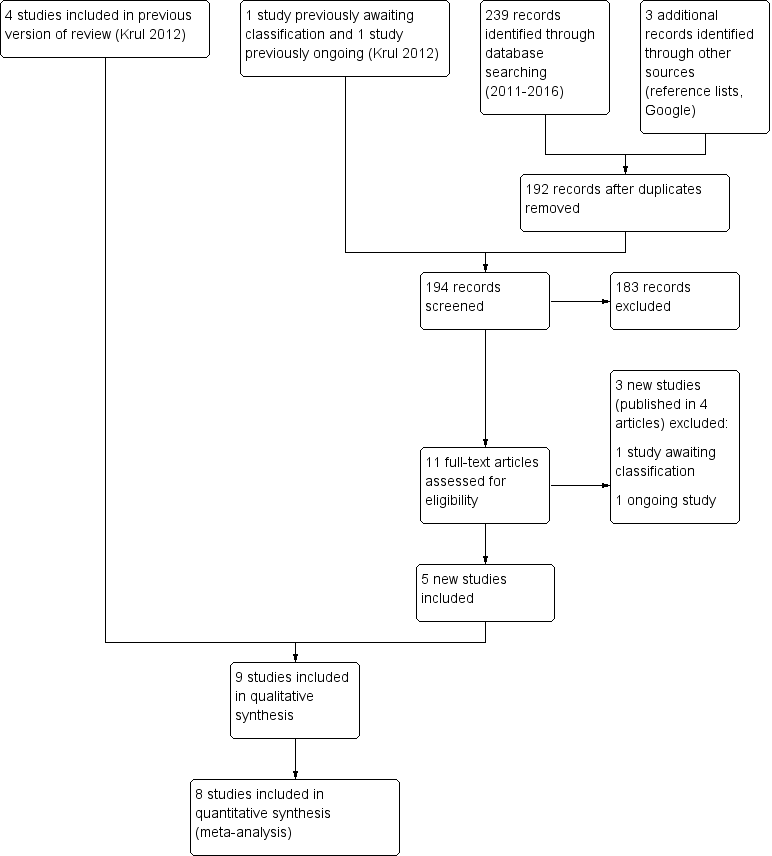
Study flow diagram
Figuras y tablas -
Figure 1

Study flow diagram

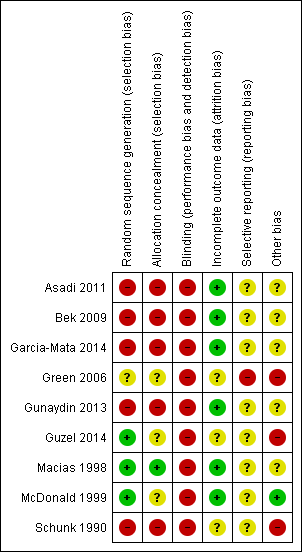
Methodological quality summary: review authors' judgements about each methodological quality item for each included study.
Figuras y tablas -
Figure 2

Methodological quality summary: review authors' judgements about each methodological quality item for each included study.

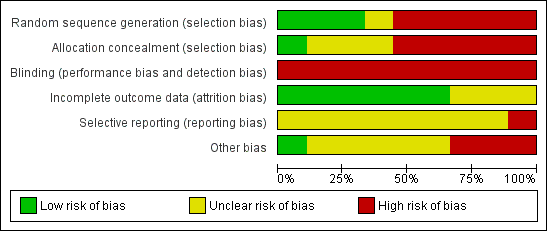
Methodological quality graph: review authors' judgements about each methodological quality item presented as percentages across all included studies.
Figuras y tablas -
Figure 3

Methodological quality graph: review authors' judgements about each methodological quality item presented as percentages across all included studies.

Forest plot of comparison: 1 Pronation versus supination, outcome: 1.1 Failure: second attempt required.
Figuras y tablas -
Figure 4

Forest plot of comparison: 1 Pronation versus supination, outcome: 1.1 Failure: second attempt required.

Comparison 1 Pronation versus supination, Outcome 1 Failure: second attempt required.
Figuras y tablas -
Analysis 1.1

Comparison 1 Pronation versus supination, Outcome 1 Failure: second attempt required.

Comparison 1 Pronation versus supination, Outcome 2 Failure: continued failure after second attempt with same procedure.
Figuras y tablas -
Analysis 1.2

Comparison 1 Pronation versus supination, Outcome 2 Failure: continued failure after second attempt with same procedure.

Comparison 2 Supination and extension versus supination then flexion, Outcome 1 Failure: second attempt required.
Figuras y tablas -
Analysis 2.1

Comparison 2 Supination and extension versus supination then flexion, Outcome 1 Failure: second attempt required.

Pronation compared with supination reduction techniques for pulled elbow in young children

Patient or population: Children with pulled elbow1

Settings: Emergency departments, ambulatory care centres or orthopaedic units

Intervention: Pronation (all were hyperpronation) for first manipulation

Comparison: Supination (all included flexion) for first manipulation

Outcomes

Illustrative comparative risks* (95% CI)

Relative effect
(95% CI)

No of Participants
(studies)

Quality of the evidence
(GRADE)

Comments

Assumed risk

Corresponding risk

Supination‐flexion

Hyperpronation

Failure: second attempt required

268 per 10002

94 per 1000

(67 to 134)

RR 0.35

(0.25 to 0.50)

811
(8 studies)

⊕⊕⊝⊝
low3

Pain (preferably during the procedure)

see Comments

see Comments

see Comments

⊕⊝⊝⊝
very low4

Data for this outcome are incomplete and were measured in very different ways in four studies.

Adverse effects (e.g. bruising)

see Comments

see Comments

None of the trials reported this outcome.

Failure: continued failure after second attempt using same procedure as before

147 per 10002

24 per 1000
(14 to 47)

RR 0.16 (0.09 to 0.32)

624
(6 studies)

⊕⊝⊝⊝
very low5

This outcome represented the cumulative effect of two manipulations using hyperpronation versus cumulative effect of two manipulations using supination‐flexion. Reassuringly, both procedures when used again resulted in further successful reductions; these were proportionally greater with hyperpronation (64% versus 28%). However, the second attempt should not be considered independently of the first attempt and the characteristics of the children requiring a second attempt may have differed in important ways between the two groups.

Ultimate failure

see Comments

see Comments

Although potentially influenced by the initial (allocated) method of manipulation, this outcome reflected various manipulation protocols that stipulated the choice of method used for subsequent attempts. Overall failure at the end of the protocol ranged from 0 to 6 (4.1% of 148 episodes).

Recurrence (within one month)

see Comments

see Comments

None of the trials reported this outcome.

*The basis for the assumed risk (e.g. the median control group risk across studies) is provided in footnotes. The corresponding risk (and its 95% confidence interval) is based on the assumed risk in the comparison group and the relative effect of the intervention (and its 95% CI).
CI: Confidence interval; RR: Risk Ratio

GRADE Working Group grades of evidence
High quality: Further research is very unlikely to change our confidence in the estimate of effect.
Moderate quality: Further research is likely to have an important impact on our confidence in the estimate of effect and may change the estimate.
Low quality: Further research is very likely to have an important impact on our confidence in the estimate of effect and is likely to change the estimate.
Very low quality: We are very uncertain about the estimate.

1. Young children: typically aged under 7 years; mean age around 2 years.

2. Median control group (supination‐flexion) risk across studies

3. Evidence downgraded two levels for very serious risk of bias (selection and detection biases).

4. Evidence downgraded two levels for very serious risk of bias (selection, detection and incomplete outcome biases) and one level for inconsistency (two of the studies reported in favour of pronation, whereas two studies reported no difference between the procedures)

5. Evidence downgraded two levels for very serious risk of bias (and one level for imprecision (there were just 9 events in the hyperpronation group)

Figuras y tablas -
Table 1. Synonyms for 'pulled elbow' found in the literature (adapted from Krul 2011)

Radial head subluxation

Partial dislocation of the radial head peculiar to children

Dislocation of the head of the radius by elongation

Annular ligament displacement

Partial epiphyseal separation of the radial head

Anterior isolated subluxation of the radial head

Internal derangement of the elbow

Slipped elbow of young children

Painful elongation of young children

Painful paralysis in young children

Rotation syndrome

Painful pronation

Tamper tantrum elbow

Elbow sprain

Goyrands’s injury

Malaigne’s luxation

Gromeyer’s injury

Pronatio dolorosa infantum (Chassaignac)

Curbstone fracture

Supermarket elbow

Sunday (afternoon) arm

Housemaid’s elbow

Nursemaid’s elbow

Babysitter’s elbow

Figuras y tablas -
Table 1. Synonyms for 'pulled elbow' found in the literature (adapted from Krul 2011)
Table 2. Sensitivity analyses: Pronation versus supination: treatment failure at first attempt

Sensitivity analysis

Results

NNT

Removal of quasi‐RCTs

Asadi 2011; Bek 2009; Garcia‐Mata 2014 ; Gunaydin 2013

RR 0.47, 95% CI 0.30 to 0.73; 370 participants; I2 = 13%

8, 95% CI 5 to 17

Removal of Green 2006

(baseline imbalance)

RR 0.34, 95% CI 0.24 to 0.49; 739 participants; I2 = 35%

6, 95% CI 5 to 8

Removal of 17 participants with prior

manipulation in Garcia‐Mata 2014)

RR 0.35, 95% CI 0.24 to 0.50; 794 participants; I2 = 28%

7, 95% CI 5 to 10

Figuras y tablas -
Table 2. Sensitivity analyses: Pronation versus supination: treatment failure at first attempt
Table 3. Pronation versus supination trials: ultimate failure

Study

Outcome definition

Overall no. of failures / no. episodes

Protocol

Asadi 2011

Failure after 4 attempts

Not reported

4 attempts,

cross‐over on 3rd attempt

Bek 2009

Failure after 3 attempts

0 / 66 (0%)

3 attempts,

cross‐over on 3rd attempt

Garcia‐Mata 2014

Failure after 3 attempts

3 / 115 (2.6%)

3 attempts,

cross‐over on 2rd attempt

original method for 3rd attempt

Green 2006

Failure after 2 attempts

2 / 75 (2.7%)

2 attempts,

cross‐over on 2nd attempt

Gunaydin 2013

Failure after 3 attempts

0 / 150 (0%)

3 attempts,

cross‐over on 3rd attempt

Guzel 2014

Failure after 3 attempts

Not reported

3 attempts,

cross‐over on 3rd attempt

Macias 1998

Failure after 4 attempts

1 / 90 (1.1%)

4 attempts,

cross‐over on 3rd attempt

order same for 4th attempt

McDonald 1999

Failure after 3 attempts

6 / 148 (4.1%)

3 attempts,

cross‐over on 3rd attempt

Figuras y tablas -
Table 3. Pronation versus supination trials: ultimate failure
Comparison 1. Pronation versus supination

Outcome or subgroup title

No. of studies

No. of participants

Statistical method

Effect size

1 Failure: second attempt required Show forest plot

8

811

Risk Ratio (M‐H, Fixed, 95% CI)

0.35 [0.25, 0.50]

2 Failure: continued failure after second attempt with same procedure Show forest plot

6

624

Risk Ratio (M‐H, Fixed, 95% CI)

0.16 [0.09, 0.32]

Figuras y tablas -
Comparison 1. Pronation versus supination
Comparison 2. Supination and extension versus supination then flexion

Outcome or subgroup title

No. of studies

No. of participants

Statistical method

Effect size

1 Failure: second attempt required Show forest plot

1

Risk Ratio (M‐H, Fixed, 95% CI)

Totals not selected

Figuras y tablas -
Comparison 2. Supination and extension versus supination then flexion