Alivio del dolor para la histeroscopia ambulatoria
Información
- DOI:
- https://doi.org/10.1002/14651858.CD007710.pub3Copiar DOI

- Base de datos:
-
- Cochrane Database of Systematic Reviews
- Versión publicada:
-
- 05 octubre 2017see what's new
- Tipo:
-
- Intervention
- Etapa:
-
- Review
- Grupo Editorial Cochrane:
-
Grupo Cochrane de Ginecología y fertilidad
- Copyright:
-
- Copyright © 2017 The Cochrane Collaboration. Published by John Wiley & Sons, Ltd.
Cifras del artículo
Altmetric:
Citado por:
Autores
Contributions of authors
Gaity Ahmad (GA): main review author, designed the protocol; performed the search, screened the search results, organised the retrieval of the RCTs, screened them against the inclusion criteria, extracted the data from the RCTs, managed the data, interpreted the results, wrote the review and supervised HO'F and SA throughout the process.
Sushant Saluja (SS): update contributor, organised the retrieval of the RCTs for the update, screened them against the inclusion criteria, extracted the data from newly identified RCTs, wrote to authors when required, managed the new data and amended the review text.
Helena O'Flynn (HO'F): co‐review author, organised the retrieval of the RCTs, screened them against the inclusion criteria, extracted the data from RCTs, wrote to study authors when required, managed the data.
Daniel Leach (DL); update contributor, organised the retrieval of the RCTs for the update, screened them against the inclusion criteria, extracted the data from newly identified RCTs, wrote to authors when required, managed the new data and amended the review text.
Andrew Watson (AW): helped design the review, supervised all the steps undertaken for the review, and settled differences of opinion between GA and HO'F regarding inclusion of studies, supervised and helped draft the discussion and conclusions.
Alessandra Sorrentino (AS): update contributor, managed the new data and amended the review text.
Sources of support
Internal sources
-
None, Other.
External sources
-
None, Other.
Declarations of interest
Gaity Ahmad (GA): none
Sushant Saluja (SS): none
Helena O'Flynn (HO'F): none
Daniel Leach (DL): none
Andrew Watson (AW): none
Alessandra Sorrentino (AS): none
Acknowledgements
Cochrane Gynaecology and Fertility for helping with the search and search strategy.
The authors wish to thank Dr James Duffy for his contribution to previous versions of this review.
Version history
| Published | Title | Stage | Authors | Version |
| 2017 Oct 05 | Pain relief for outpatient hysteroscopy | Review | Gaity Ahmad, Sushant Saluja, Helena O'Flynn, Alessandra Sorrentino, Daniel Leach, Andrew Watson | |
| 2010 Nov 10 | Pain relief for outpatient hysteroscopy | Review | Gaity Ahmad, Helena O'Flynn, Shatha Attarbashi, James MN Duffy, Andrew Watson | |
| 2009 Apr 15 | Pain relief for office gynaecological procedures | Protocol | Gaity Ahmad, Helena O'Flynn, James M N Duffy, Shatha Attarbashi, Andrew Pickersgill, Andrew Watson | |
Differences between protocol and review
Within types of interventions, analgesics (topical or oral) versus placebo or no treatment, to separate local anaesthesia from NSAIDs. Some of the wording also has slight changes.
We performed subgroup analyses of postmenopausal women and by route of intervention to see if this had an effect on pain relief during and after the procedure. We performed analyses for the following groups:
-
analgesia versus placebo or no treatment (during the procedure and within 30 minutes of the procedure) for both postmenopausal women and by route of intervention;
-
analgesia versus placebo or no treatment (more then 30 minutes after the procedure) ‐ performed only for routes of intervention.
In the protocol we planned to express results for each study as mean difference (MD) using a random‐effects model with 95% confidence intervals (CI) unless the included studies reported differing validated scales, in which case we would use a standard mean difference (SMD). In the review we have used the SMD for all continuous outcomes. We chose this measure as it allowed comparison of outcome data from studies that used different scales to quantify pain.
Keywords
MeSH
Medical Subject Headings (MeSH) Keywords
Medical Subject Headings Check Words
Female; Humans;
PICO

Methodological quality graph: review authors' judgements about each methodological quality item presented as percentages across all included studies

Methodological quality summary: review authors' judgements about each methodological quality item for each included study

Study flow diagram

Forest plot of comparison: 1 Local anaesthetic versus placebo or no treatment, outcome: 1.1 Pain score.

Funnel plot of comparison local anaesthetic versus placebo or no treatment, outcome: pain score

Comparison 1 Local anaesthetic versus placebo or no treatment, Outcome 1 Pain score.

Comparison 1 Local anaesthetic versus placebo or no treatment, Outcome 2 Failure to complete procedure.

Comparison 1 Local anaesthetic versus placebo or no treatment, Outcome 3 Adverse events.

Comparison 2 Oral NSAID versus placebo or no treatment, Outcome 1 Pain score.
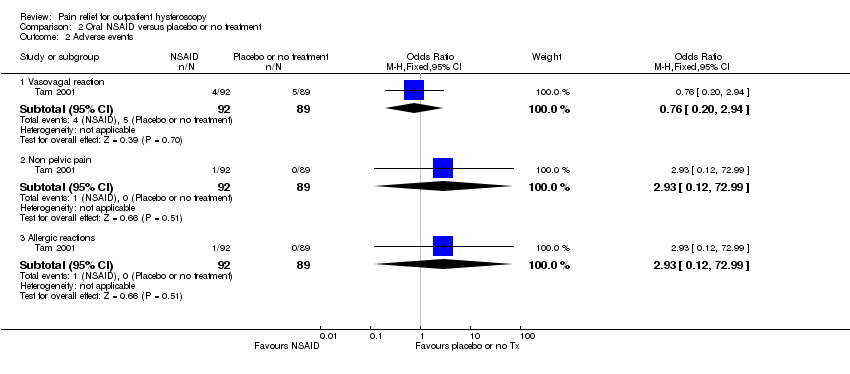
Comparison 2 Oral NSAID versus placebo or no treatment, Outcome 2 Adverse events.

Comparison 3 Opioid versus placebo or no treatment, Outcome 1 Pain score.

Comparison 3 Opioid versus placebo or no treatment, Outcome 2 Failure to complete procedure (due to pain).

Comparison 3 Opioid versus placebo or no treatment, Outcome 3 Adverse effects.

Comparison 4 Local intracervical anaesthesia versus combined intracervical and paracervical anaesthesia, Outcome 1 Pain score.

Comparison 4 Local intracervical anaesthesia versus combined intracervical and paracervical anaesthesia, Outcome 2 Failure to complete procedure.

Comparison 5 Local intracervical anaesthesia versus combined intracervical, paracervical and topical anaesthesia, Outcome 1 Pain score.

Comparison 6 Antispasmodic + NSAID versus local paracervical anaesthesia, Outcome 1 Pain score.

Comparison 7 Opioid versus NSAID, Outcome 1 Pain score.

Comparison 7 Opioid versus NSAID, Outcome 2 Adverse effects.
| Local anaesthetic compared to placebo or no treatment for outpatient hysteroscopy | ||||||
| Population: women undergoing outpatient hysteroscopy | ||||||
| Outcomes | Anticipated absolute effects* (95% CI) | Relative effect | № of participants | Quality of the evidence | Comments | |
| Risk with placebo or no treatment | Risk with local anaesthetic | |||||
| Pain score during procedure | The mean pain score ranged from 0.86 to 4.3 on a 0‐10 cm VAS | SMD 0.29 SD lower | ‐ | 1496 | ⊕⊕⊝⊝ | This suggests a marginally lower pain score in the intervention group, equating to up to 7 mm on a 0‐10 cm point VAS. This is unlikely to be clinically significant |
| Pain score within 30 min of procedure | The mean pain score ranged from 1.8 to 6.3 on a 0‐10 cm VAS | SMD 0.5 SD lower | ‐ | 545 | ⊕⊕⊝⊝ | This suggests a marginally lower pain score in the intervention group, equating to up to 13 mm on a 0‐10 cm point VAS. This is unlikely to be clinically significant |
| Pain score more than 30 min after procedure | The mean pain score ranged from 0.62 to 1.8 on a 0‐10 cm VAS | SMD 0.11 SD lower | ‐ | 450 | ⊕⊕⊝⊝ | There was no clear evidence of a difference between the groups. |
| Vasovagal reaction | 63 per 1000 | 45 per 1000 | OR 0.70 | 1309 | ⊕⊝⊝⊝ | There was no clear evidence of a difference between the groups |
| Non‐pelvic pain | 100 per 1000 | 164 per 1000 | OR 1.76 | 99 | ⊕⊝⊝⊝ | There was insufficient evidence to determine whether there is a difference between the groups |
| *The risk in the intervention group (and its 95% confidence interval) is based on the mean risk in the comparison group and the relative effect of the intervention (and its 95% CI). | ||||||
| GRADE Working Group grades of evidence | ||||||
| 1Downgraded two levels for serious risk of bias: none of the studies adequately described methods of allocation concealment and methods of blinding were unclear or inadequate in many studies. | ||||||
| Oral NSAID compared to placebo or no treatment for outpatient hysteroscopy | ||||||
| Population: women undergoing outpatient hysteroscopy | ||||||
| Outcomes | Anticipated absolute effects* (95% CI) | Relative effect | № of participants | Quality of the evidence | Comments | |
| Risk with placebo or no treatment | Risk with oral NSAID | |||||
| Pain score during procedure | The mean pain score ranged from 2.1 to 5.92 on a 0‐10 cm VAS | SMD 0.18 lower (0.35 lower to 0.00) | ‐ | 521 | ⊕⊕⊝⊝ | There was no clear evidence of a difference between the groups |
| Pain score within 30 min of procedure | The mean pain score ranged from 0.65 to 2.02 on a 0‐10 cm VAS | SMD 0.25 SD lower | ‐ | 340 participants | ⊕⊕⊝⊝ | The evidence suggests a benefit in the NSAID group, equivalent to up to 2 mm on a 0‐10 cm VAS. This is unlikely to be clinically significant |
| Pain score more than 30 min after procedure | The mean pain score ranged from 1.2 to 1.55 on a 0‐10 cm VAS | SMD 0.27 lower | ‐ | 321 | ⊕⊕⊝⊝ | The evidence suggests a benefit in the NSAID group, equivalent to up to 7mm on a 0‐10 cm VAS. This is unlikely to be clinically significant |
| Vasovagal reaction | 56 per 1,000 | 43 per 1,000 | OR 0.76 | 181 participants | ⊕⊕⊝⊝ | Only 9 events There was insufficient evidence to determine whether there is a difference between the groups |
| Non pelvic pain | Not calculable: no events in one group | OR 2.93 | 181 participants | ⊕⊕⊝⊝ | Only 1 event There was insufficient evidence to determine whether there is a difference between the groups | |
| Allergic reaction | Not calculable: no events in one group | OR 2.93 | 181 participants | ⊕⊕⊝⊝ | Only 1 event There was insufficient evidence to determine whether there is a difference between the groups | |
| *The risk in the intervention group (and its 95% confidence interval) is based on the mean risk in the comparison group and the relative effect of the intervention (and its 95% CI). | ||||||
| GRADE Working Group grades of evidence | ||||||
| 1Downgraded one level due to serious risk of bias: none of the studies adequately described methods of allocation concealment. | ||||||
| Opioid compared to placebo or no treatment for outpatient hysteroscopy | ||||||
| Population: women undergoing outpatient hysteroscopy | ||||||
| Outcomes | Anticipated absolute effects* (95% CI) | Relative effect | № of participants | Quality of the evidence | Comments | |
| Risk with placebo or no treatment | Risk with opioid | |||||
| Pain score during procedure: oral opioid | The mean pain score was 5.92 mm on a 0‐10 cm VAS | Oral opioid: SMD was 0.76 lower (95% CI 1.10 lower to 0.42 lower) | ‐ | 140 (1 study) | low1,2 | Data from the two studies were unsuitable for pooling due to extreme heterogeneity (I2 = 92%) with conflicting directions of effect. There is a suggestion of benefit from oral opioid, equating to a difference of up to 22 mm on a 0‐10 cm VAS. This may possibly be clinically significant |
| Pain score during procedure: sublingual opioid | The mean pain score was from 3.2 mm on a 0‐10 cm VAS | Sublingual opioid: SMD was 0.08 higher (95% CI 0.22 lower to 0.39 higher) | 164 (1 study) | low1,2 | ||
| Pain score within 30 min of procedure oral opioid | The mean pain score was 3.27 mm on a 0‐10 cm VAS | SMD ‐0.57 lower | ‐ | 140 | low1,2 | There is a suggestion of benefit from oral opioid, equating to a difference of up to 17 mm on a 0‐10 cm VAS. This may possibly be clinically significant |
| Pain score more than 30 min after procedure oral opioid | The mean pain score was 0.77 on a 0‐10 cm VAS | SMD 0.17 lower | ‐ | 140 | very low1,2,3 | |
| Nausea and vomiting sublingual opioid | Not calculable as all 31 events were in the opioid group and none in the placebo group | OR 107.55 (6.44 to 1796.46) | 164 | low1 | There were 4 events in the intervention group of the oral opioid study, but events in the placebo group were not reported | |
| *The risk in the intervention group (and its 95% confidence interval) is based on the mean risk in the comparison group and the relative effect of the intervention (and its 95% CI). | ||||||
| GRADE Working Group grades of evidence | ||||||
| 1Downgraded one level for serious risk of bias: method of allocation concealment or blinding, or both, not described. | ||||||
| Intracervical versus combined intracervical and paracervical anaesthesia | ||||||
| Population: women undergoing outpatient hysteroscopy | ||||||
| Outcomes | Anticipated absolute effects* (95% CI) | Relative effect | No of participants | Quality of the evidence | Comments | |
| Risk with combined intracervical and paracervical anaesthesia | Risk with local intracervical anaesthesia | |||||
| Pain score during procedure | The mean pain score was 2.1 (SD 0.2) on a 0‐10 cm VAS | SMD 4.27 SD higher (3.49 higher to 5.06 higher) | ‐ | 84 participants | ⊕⊝⊝⊝ | This suggests a significant benefit from combined anaesthesia, equating to up to 12 mm on a 0‐10 cm point VAS. This is unlikely to be be clinically significant |
| Pain score within 30 minutes of the procedure | The mean pain score was 1.5 (SD 0.3) on a 0‐10 cm VAS | (SMD 1.55, 95% CI 1.06 higher to 2.05 higher) | ‐ | 84 participants (1 study) | ⊕⊝⊝⊝ | This suggests a significant benefit from combined anaesthesia, equating to up to 5 mm on a 0‐10 cm point VAS. This is unlikely to be clinically significant |
| Pain score more than 30 minutes of the procedure | The mean pain score was 1 (SD 0.2) on a 0‐10 cm VAS | (SMD 3.47, 95% CI 2.78 higher to 4.15 higher) | ‐ | 84 participants (1 study) | ⊕⊝⊝⊝ | This suggests a significant benefit from combined anaesthesia, equating to up to 8 mm on a 0‐10 cm point VAS. This is unlikely to be clinically significant |
| Adverse effects | No data available | |||||
| *The risk in the intervention group (and its 95% confidence interval) is based on the mean risk in the comparison group and the relative effect of the intervention (and its 95% CI). CI: confidence interval; SMD: standardised mean difference; SD: standard deviation; VAS: visual analogue scale | ||||||
| GRADE Working Group grades of evidence | ||||||
| 1Downgraded two levels for very serious risk of bias: allocation concealment not described, participants not blinded. | ||||||
| Antispasmodic plus NSAID versus paracervical anaesthesia | ||||||
| Population: women undergoing outpatient hysteroscopy | ||||||
| Outcomes | Illustrative comparative risks* (95% CI) | Relative effect | No of participants | Quality of the evidence | Comments | |
| Paracervical anaesthesia | Antispasmodic plus NSAID | |||||
| Pain score during procedure | The mean pain score was 5.93 (SD ‐1.26) on a 0‐10 cm VAS | SMD 1.40 SD lower (1.90 lower to 0.91 lower) | ‐ | 80 | ⊕⊝⊝⊝ | This suggests a beneficial effect in the drotaverine hydrochloride and mefenamic acid group, equating to up to 23 mm on a 0‐10 cm point VAS. This may possibly be clinically significant |
| Pain score within 30 minutes of the procedure | This outcome was not reported | |||||
| Pain score more than 30 minutes after the procedure | The mean pain score was 2.53 (SD ‐0.81) on a 0‐10 cm VAS | SMD 0.87 SD lower | ‐ | 80 | ⊕⊝⊝⊝ | This suggests a beneficial effect in the drotaverine hydrochloride and mefenamic acid group, equating toup to11mm on a 0‐10 cm point VAS. This is unlikely to be clinically significant. |
| Adverse effects | This outcome was not reported | |||||
| *The risk in the intervention group (and its 95% confidence interval) is based on the mean risk in the comparison group and the relative effect of the intervention (and its 95% CI). CI: confidence interval; SMD: standardised mean difference; SD: standard deviation; VAS: visual analogue scale | ||||||
| GRADE Working Group grades of evidence | ||||||
| 1Downgraded two levels for very serious risk of bias: methods of allocation concealment not described, not blinded. | ||||||
| Study | Route | Dose |
| Intracervical versus intra and paracervical | Local intracervical anaesthesia compared to combined intracervical and paracervical anaesthesia. 0.5% bupivacaine hydrochloride into anterior wall of cervix compared to 0.5% bupivacaine hydrochloride into anterior wall of cervix plus bupivacaine into lateral vaginal fornix at 3 and 9 o’clock at 10 mm depth | |
| Endocervical topical cream | 3 mL of EMLA cream 5% or 3 mL ultrasound gel applied in the endocervical canal 10 min before surgery with 5 mL needleless syringe via speculum. A subsequent application of either gel was made with a swab at ectocervix level during vaginoscopic approach | |
| Intracervical | Intracervical injection of 10 mL of lignocaine 1% with 1:200 000 adrenaline or normal saline was injected into the cervix at 1, 5, 7, and 11 o’clock | |
| Transcervical | 2 mL of 2% mepivacaine or 2 mL of 0.9% saline injected trans cervically (inserted up the cervical canal to the internal os) | |
| Paracervical | 10 mL of 1.5% mepivacaine or saline injected into junction of cervix and vagina (4 and 8 o'clock positions) | |
| Topical spray | 10 mL of 2% lignocaine gel, placebo gel or no gel administered into cervical canal. Some women received intracervical lignocaine block if determined to need cervical dilatation | |
| Intrauterine | 5 mL of 2% lignocaine or 5 mL or 0.9% saline injected into cervical canal and uterine cavity via hysteroscope | |
| Intracervical | Intracervical application at 1, 5, 7 and 11 o'clock positions of 4 x 2 mL ampoules of 2% lidocaine hydrochloride ampoules or saline | |
| Paracervical versus uterosacral | 20 mL of 1% lignocaine paracervical block or 2 mL of 2% lignocaine uterosacral block | |
| Paracervical | 20 mL of 1% mepivacaine injected paracervically at 3, 5, 7 and 9 o'clock position of the junction of cervix and vagina at least 5 min before the procedure | |
| Intracervical versus intracervical and intrauterine | 2 mL of 1% lidocaine into anterior wall. Distension medium of either saline only or 18 mL of lidocaine in 250 mL of saline | |
| Intracervical | Intracervical local anaesthesia (10 mL of 1% prilocaine) was applied at the 4 and | |
| Paracervical | Paracervical block at 3, 5, 7 and 9 o'clock positions of 10 mL of 2% lignocaine or saline, 5 min prior to procedure | |
| Transcervical | Transcervical intrauterine instillation of 5 mL of 2% lignocaine or normal saline into the uterine cavity 5 min before procedure | |
| Para/intracervical versus intracervical only anaesthetic block | The para/intracervical group received a total of 37 cc of anaesthesia injected at 6 different sites. 2‐3 min prior to the injection, topical 1% lidocaine was applied to the cervix in this group. The intracervical group received a total of 22 cc of anaesthetic given at 3 different injection sites | |
| Intracervical | 1 mL to 3 mL (30 to 90 mg) of mepivacaine 3% or saline administered intracervically 3 min prior to procedure | |
| Intracervical versus NSAID | 5 mL mepivacaine 2% intracervically up to the level of the internal os or one tablet of dexketoprofen given 1 h before the procedure | |
| Transcervical intrauterine lidocaine instillation versus rectal diclofenac | 5 mL of 2% lidocaine or the same volume of saline was instilled through the endocervix into the uterine cavity with an 18‐gauge angiocatheter 3 min prior to the procedure | |
| Intracervical | The second group was administered with a 1000 mL distention medium containing 18 mL lidocaine per 250 mL (Jetokain ampoule 20 mg 2% Adeka, Samsun, Turkey) | |
| Topical spray | 30 mg (3 metered doses) of lignocaine or placebo sprayed onto surface of cervix and cervical canal through 360° 5 min prior to procedure | |
| Topical cream versus topical spray | 1 cm3 of 5% prilocaine cream onto esocervix and 2 cm3 inserted 3 cm into cervical canal 10 min before procedure or 20 mg of lidocaine spray directed onto esocervix and 20 mg 3 cm into cervical canal immediately before procedure or no intervention | |
| Intrauterine | Unspecified volume of Instillagel (contains 2% lidocaine) or Endosgel (does not contain local anaesthetic) warmed to 37°C and instilled via a 2 mm neonatal suction catheter as part of sonography procedure 30 min prior to hysteroscopy | |
| Paracervical | Paracervical block at 3, 5, 7 and 9 o'clock positions of 10 mL 1% mepivacaine 5 min before procedure or no intervention given | |
| Topical gel | 4 mL of 2% lignocaine or placebo gel applied onto cervix before procedure | |
| Intrauterine | 5 mL of 2% mepivacaine or 5 mL of saline intrauterine via 3 mm catheter | |
| NSAID: nonsteroidal anti‐inflammatory drug | ||
| Outcome or subgroup title | No. of studies | No. of participants | Statistical method | Effect size |
| 1 Pain score Show forest plot | 12 | Std. Mean Difference (IV, Fixed, 95% CI) | Subtotals only | |
| 1.1 Pain score during procedure | 10 | 1496 | Std. Mean Difference (IV, Fixed, 95% CI) | ‐0.29 [‐0.39, ‐0.19] |
| 1.2 Pain score within 30 min of procedure | 5 | 545 | Std. Mean Difference (IV, Fixed, 95% CI) | ‐0.50 [‐0.67, ‐0.33] |
| 1.3 Pain score more than 30 min after procedure | 4 | 450 | Std. Mean Difference (IV, Fixed, 95% CI) | ‐0.11 [‐0.30, 0.07] |
| 2 Failure to complete procedure Show forest plot | 7 | Odds Ratio (M‐H, Fixed, 95% CI) | Subtotals only | |
| 2.1 Cervical stenosis | 6 | 805 | Odds Ratio (M‐H, Fixed, 95% CI) | 1.23 [0.62, 2.43] |
| 2.2 Pain | 2 | 330 | Odds Ratio (M‐H, Fixed, 95% CI) | 0.29 [0.12, 0.69] |
| 3 Adverse events Show forest plot | 8 | Odds Ratio (M‐H, Fixed, 95% CI) | Subtotals only | |
| 3.1 Vasovagal reaction | 8 | 1309 | Odds Ratio (M‐H, Fixed, 95% CI) | 0.70 [0.43, 1.13] |
| 3.2 Non‐pelvic pain | 1 | 99 | Odds Ratio (M‐H, Fixed, 95% CI) | 1.76 [0.53, 5.80] |
| Outcome or subgroup title | No. of studies | No. of participants | Statistical method | Effect size |
| 1 Pain score Show forest plot | 3 | Std. Mean Difference (IV, Fixed, 95% CI) | Subtotals only | |
| 1.1 Pain score during procedure | 3 | 521 | Std. Mean Difference (IV, Fixed, 95% CI) | ‐0.18 [‐0.35, ‐0.00] |
| 1.2 Pain score within 30 min of procedure | 2 | 340 | Std. Mean Difference (IV, Fixed, 95% CI) | ‐0.25 [‐0.46, ‐0.04] |
| 1.3 Pain score more than 30 min after procedure | 2 | 321 | Std. Mean Difference (IV, Fixed, 95% CI) | ‐0.27 [‐0.49, ‐0.05] |
| 2 Adverse events Show forest plot | 1 | Odds Ratio (M‐H, Fixed, 95% CI) | Subtotals only | |
| 2.1 Vasovagal reaction | 1 | 181 | Odds Ratio (M‐H, Fixed, 95% CI) | 0.76 [0.20, 2.94] |
| 2.2 Non pelvic pain | 1 | 181 | Odds Ratio (M‐H, Fixed, 95% CI) | 2.93 [0.12, 72.99] |
| 2.3 Allergic reactions | 1 | 181 | Odds Ratio (M‐H, Fixed, 95% CI) | 2.93 [0.12, 72.99] |
| Outcome or subgroup title | No. of studies | No. of participants | Statistical method | Effect size |
| 1 Pain score Show forest plot | 2 | Std. Mean Difference (IV, Fixed, 95% CI) | Totals not selected | |
| 1.1 Pain score during procedure | 2 | Std. Mean Difference (IV, Fixed, 95% CI) | 0.0 [0.0, 0.0] | |
| 1.2 Pain score within 30 min of procedure | 1 | Std. Mean Difference (IV, Fixed, 95% CI) | 0.0 [0.0, 0.0] | |
| 1.3 Pain score more than 30 min after procedure | 1 | Std. Mean Difference (IV, Fixed, 95% CI) | 0.0 [0.0, 0.0] | |
| 2 Failure to complete procedure (due to pain) Show forest plot | 1 | 140 | Odds Ratio (M‐H, Fixed, 95% CI) | 0.33 [0.01, 8.21] |
| 3 Adverse effects Show forest plot | 1 | 164 | Odds Ratio (M‐H, Fixed, 95% CI) | 107.55 [6.44, 1796.46] |
| 3.1 Nausea and vomiting | 1 | 164 | Odds Ratio (M‐H, Fixed, 95% CI) | 107.55 [6.44, 1796.46] |
| Outcome or subgroup title | No. of studies | No. of participants | Statistical method | Effect size |
| 1 Pain score Show forest plot | 1 | Std. Mean Difference (IV, Fixed, 95% CI) | Subtotals only | |
| 1.1 Pain score during procedure | 1 | 84 | Std. Mean Difference (IV, Fixed, 95% CI) | 4.27 [3.49, 5.06] |
| 1.2 Pain score within 30 min of procedure | 1 | 84 | Std. Mean Difference (IV, Fixed, 95% CI) | 1.55 [1.06, 2.05] |
| 1.3 Pain score more than 30 min after procedure | 1 | 84 | Std. Mean Difference (IV, Fixed, 95% CI) | 3.47 [2.78, 4.15] |
| 2 Failure to complete procedure Show forest plot | 1 | Odds Ratio (M‐H, Fixed, 95% CI) | Subtotals only | |
| Outcome or subgroup title | No. of studies | No. of participants | Statistical method | Effect size |
| 1 Pain score Show forest plot | 1 | Std. Mean Difference (IV, Fixed, 95% CI) | Subtotals only | |
| 1.1 Pain score during procedure | 1 | 37 | Std. Mean Difference (IV, Fixed, 95% CI) | ‐0.54 [‐1.20, 0.12] |
| Outcome or subgroup title | No. of studies | No. of participants | Statistical method | Effect size |
| 1 Pain score Show forest plot | 1 | Std. Mean Difference (IV, Fixed, 95% CI) | Subtotals only | |
| 1.1 Pain score during procedure | 1 | 80 | Std. Mean Difference (IV, Fixed, 95% CI) | ‐1.40 [‐1.90, ‐0.91] |
| 1.2 Pain score more than 30 min after procedure | 1 | 80 | Std. Mean Difference (IV, Fixed, 95% CI) | ‐0.87 [‐1.33, ‐0.41] |
| Outcome or subgroup title | No. of studies | No. of participants | Statistical method | Effect size |
| 1 Pain score Show forest plot | 1 | Std. Mean Difference (IV, Fixed, 95% CI) | Subtotals only | |
| 1.1 Pain score during procedure | 1 | 140 | Std. Mean Difference (IV, Fixed, 95% CI) | ‐0.15 [‐0.48, 0.18] |
| 1.2 Pain score within 30 min of procedure | 1 | 140 | Std. Mean Difference (IV, Fixed, 95% CI) | ‐0.25 [‐0.58, 0.08] |
| 1.3 Pain score more than 30 min after procedure | 1 | 140 | Std. Mean Difference (IV, Fixed, 95% CI) | ‐0.17 [‐0.51, 0.16] |
| 2 Adverse effects Show forest plot | 1 | 140 | Odds Ratio (M‐H, Fixed, 95% CI) | 9.54 [0.50, 180.64] |
| 2.1 Nausea and vomiting | 1 | 140 | Odds Ratio (M‐H, Fixed, 95% CI) | 9.54 [0.50, 180.64] |