Alívio da dor na histeroscopia em ambulatório
Abstract
Background
Hysteroscopy is increasingly performed in an outpatient setting. Pain is the primary reason for abandonment of procedure or incomplete assessment. There is no consensus upon routine use of analgesia during hysteroscopy.
Objectives
To assess the effectiveness and safety of pharmacological interventions for pain relief in women undergoing outpatient hysteroscopy, compared with placebo, no treatment or other pharmacological therapies.
Search methods
In September 2016 we searched the Cochrane Gynaecology and Fertility (CGF) Trials Register, CENTRAL, MEDLINE, Embase, PsycINFO, CINAHL and two trials registers (ClinicalTrials.gov and WHO ICTRP), together with reference checking and contact with study authors and experts.
Selection criteria
We included randomised controlled trials (RCTs) comparing use of pharmacological interventions with other pharmacological interventions and pharmacological interventions versus placebo or no treatment.
Data collection and analysis
We used standard methodological procedures expected by Cochrane. Our primary outcome was mean pain score.
Main results
We included 32 RCTS (3304 participants), of which only 19 reported data suitable for analysis. Most studies were at unclear or high risk of bias in most of the domains assessed. The evidence was low or very low quality, mainly due to risk of bias and imprecision. Baseline pain scores were relatively low in all groups.
Analgesic versus placebo or no treatment
Local anaesthetics
Local anaesthetics reduced mean pain scores during the procedure [(SMD) ‐0.29, 95% CI ‐0.39 to ‐0.19, 10 RCTs, 1496 women, I2 = 80%, low‐quality evidence)] and within 30 minutes (SMD 0.50, 95% CI ‐0.67 to ‐0.33, 5 RCTs, 545 women, I2 = 43%, low‐quality evidence). This translates to a difference of up to 7 mm on a 0‐10 cm visual analogue scale (VAS) during the procedure and up to 13 mm within 30 minutes, which is unlikely to be clinically meaningful. There was no clear evidence of a difference between the groups in mean pain scores after > 30 minutes (SMD ‐0.11, 95% CI ‐0.30 to 0.07, 4 RCTs, 450 women, I2 = 0%, low‐quality evidence), or in rates of vasovagal reactions (OR 0.70, 95% CI 0.43 to 1.13, 8 RCTs, 1309 women, I2 = 66%, very low‐quality evidence). There was insufficient evidence to determine whether there was a difference in rates of non‐pelvic pain (OR 1.76, 95% CI 0.53 to 5.80, 1 RCT, 99 women, very low‐quality evidence).
Nonsteroidal anti‐inflammatory drugs (NSAIDs)
There was insufficient evidence to determine whether there was a difference between the groups in mean pain scores during the procedure (SMD ‐0.18, 95% CI ‐0.35 to 0.00, 3 RCTs, 521 women, I2 = 81%, low‐quality evidence). Pain scores were lower in the NSAIDs group within 30 minutes (SMD ‐0.25, 95% CI ‐0.46 to ‐0.04, 2 RCTs, 340 women, I2=29%, low‐quality evidence) and at over 30 minutes (SMD ‐0.27, 95% CI ‐0.49 to ‐0.05, 2 RCTs, 321 women, I2 = 78%, low‐quality evidence). This equates to maximum differences of under 7.5 mm on a 0‐10 cm scale, which are unlikely to be clinically significant. One RCT (181 women) reported adverse events: there was insufficient evidence to determine whether there was a difference between the groups in vasovagal reactions (OR 0.76, 95% CI 0.20 to 2.94, very low‐quality evidence). For other reported adverse events (non pelvic pain and allergic reactions) evidence was lacking.
Opioids
One RCT utilised sublingual buprenorphine and one utilised oral tramadol. Data on pain scores during the procedure were unsuitable for pooling due to inconsistency. Tramadol was associated with a benefit of up to 22 mm on a 0‐10 cm scale (SMD ‐0.76, 95% CI ‐1.10 to ‐0.42, 1 RCT, 140 women). However, the effect estimate for this outcome for sublingual opioids did not support a benefit from the intervention (SMD 0.08, 95% CI ‐0.22 to 0.39, 164 women). Compared with placebo, the pain score within 30 minutes of the procedure was reduced in the tramadol group, with a difference of up to 17mm on a 0‐10cm scale (SMD ‐0.57, 95% CI ‐0.91 to ‐0.23 , 1 RCT, 140 women, low‐quality evidence. There was no clear evidence of a difference between the tramadol and placebo groups at over 30 minutes (SMD ‐0.17, 95% CI ‐0.51 to 0.16, 1 RCT, 140 women, low‐quality evidence). Nausea and vomiting occurred in 39% of the buprenorphine group, and in none of the placebo group (OR 107.55, 95% CI 6.44 to 1796.46)
Analgesic versus any other analgesic
Some comparisons did not report pain scores at all time frames of interest, and none reported data on adverse events.
One RCT (84 women) compared local intracervical anaesthesia versus combined intracervical and paracervical anaesthesia. Pain scores were higher in the group with local intracervical anaesthesia during the procedure (SMD 4.27, 95% CI 3.49 to 5.06, very low‐quality evidence), within 30 minutes (SMD 1.55, 95% CI 1.06 to 2.05, very low‐quality evidence) and at more than 30 minutes (SMD 3.47, 95% CI 2.78 to 4.15, very low‐quality evidence). This translates to a possible benefit in the combined group of up to 12 mm on a 0‐10 cm scale during the procedure. Benefits at longer follow‐up were smaller.
One RCT compared antispasmodic + NSAID versus local paracervical anaesthesia. Pain scores were lower in the NSAID group than in the local anaesthesia group (during procedure: SMD ‐1.40, 95% CI ‐1.90 to ‐0.91; >30 minutes after procedure: SMD ‐0.87, 95% CI ‐1.33 to ‐0.41; 80 women, very low‐quality evidence). This suggests a possible benefit of during the procedure of up to 23 mm on a 0‐10 VAS scale and up to 11 mm >30 minutes after the procedure.
Other comparisons included local intracervical anaesthesia versus combined intracervical, paracervical and topical anaesthesia, and opioid versus NSAIDs. Findings were inconclusive.
Authors' conclusions
There was no consistent good‐quality evidence of a clinically meaningful difference in safety or effectiveness between different types of pain relief compared with each other or with placebo or no treatment in women undergoing outpatient hysteroscopy.
PICO
Resumo para leigos
Alívio da dor na histeroscopia em ambulatório
Pergunta de revisão
O objetivo desta revisão foi determinar quais os analgésicos eficazes na redução do desconforto associado à realização de uma histeroscopia em ambulatório.
Contexto
A histeroscopia é um exame complementar de diagnóstico realizado no contexto do estudo de hemorragias uterinas anómalas. O procedimento envolve a introdução de fluido ou gás através do colo do útero, o que leva à distensão uterina e permite a visualização do canal cervical e da cavidade uterina com um histeroscópio, o que pode ser doloroso. Não existe concordância sobre qual a melhor forma de alívio da dor associada à realização deste procedimento.
Características dos estudos
Nesta revisão foram incluídos 32 ensaios clínicos aleatorizados, controlados por placebo (ECAs), com um total de 3304 participantes, dos quais apenas 19 reportaram dados adequados para análise.
Todos os estudos foram realizados em ambiente clínico. A idade dos participantes variou entre os 33 e os 61 anos de idade. Os ensaios clínicos realizaram‐se na Austrália, Bélgica, Brasil, Canadá, China, França, Grécia, Índia, Itália, Espanha, Taiwan, Reino Unido e Estados Unidos da América. As pontuações basais em escalas de avaliação de dor foram relativamente baixas em todos os grupos. A evidência científica desta revisão sistemática está actualizada até novembro de 2016.
Resultados principais
Não foi encontrada evidência científica consistente e de boa qualidade, que revelasse uma diferença clinicamente significativa na segurança ou eficácia dos diferentes métodos utilizados no alívio da dor, quando comparados entre si, com placebo ou com nenhum tratamento, em mulheres submetidas a uma histeroscopia em ambulatório.
Qualidade da evidência
A maioria dos estudos apresentava um risco de viés avaliado como alto ou indeterminado para a maioria dos critérios avaliados. A evidência científica encontrada foi avaliada como de baixa ou muito baixa qualidade, principalmente devido ao risco de viés e de imprecisão dos estudos.
Authors' conclusions
Summary of findings
| Local anaesthetic compared to placebo or no treatment for outpatient hysteroscopy | ||||||
| Population: women undergoing outpatient hysteroscopy | ||||||
| Outcomes | Anticipated absolute effects* (95% CI) | Relative effect | № of participants | Quality of the evidence | Comments | |
| Risk with placebo or no treatment | Risk with local anaesthetic | |||||
| Pain score during procedure | The mean pain score ranged from 0.86 to 4.3 on a 0‐10 cm VAS | SMD 0.29 SD lower | ‐ | 1496 | ⊕⊕⊝⊝ | This suggests a marginally lower pain score in the intervention group, equating to up to 7 mm on a 0‐10 cm point VAS. This is unlikely to be clinically significant |
| Pain score within 30 min of procedure | The mean pain score ranged from 1.8 to 6.3 on a 0‐10 cm VAS | SMD 0.5 SD lower | ‐ | 545 | ⊕⊕⊝⊝ | This suggests a marginally lower pain score in the intervention group, equating to up to 13 mm on a 0‐10 cm point VAS. This is unlikely to be clinically significant |
| Pain score more than 30 min after procedure | The mean pain score ranged from 0.62 to 1.8 on a 0‐10 cm VAS | SMD 0.11 SD lower | ‐ | 450 | ⊕⊕⊝⊝ | There was no clear evidence of a difference between the groups. |
| Vasovagal reaction | 63 per 1000 | 45 per 1000 | OR 0.70 | 1309 | ⊕⊝⊝⊝ | There was no clear evidence of a difference between the groups |
| Non‐pelvic pain | 100 per 1000 | 164 per 1000 | OR 1.76 | 99 | ⊕⊝⊝⊝ | There was insufficient evidence to determine whether there is a difference between the groups |
| *The risk in the intervention group (and its 95% confidence interval) is based on the mean risk in the comparison group and the relative effect of the intervention (and its 95% CI). | ||||||
| GRADE Working Group grades of evidence | ||||||
| 1Downgraded two levels for serious risk of bias: none of the studies adequately described methods of allocation concealment and methods of blinding were unclear or inadequate in many studies. | ||||||
| Oral NSAID compared to placebo or no treatment for outpatient hysteroscopy | ||||||
| Population: women undergoing outpatient hysteroscopy | ||||||
| Outcomes | Anticipated absolute effects* (95% CI) | Relative effect | № of participants | Quality of the evidence | Comments | |
| Risk with placebo or no treatment | Risk with oral NSAID | |||||
| Pain score during procedure | The mean pain score ranged from 2.1 to 5.92 on a 0‐10 cm VAS | SMD 0.18 lower (0.35 lower to 0.00) | ‐ | 521 | ⊕⊕⊝⊝ | There was no clear evidence of a difference between the groups |
| Pain score within 30 min of procedure | The mean pain score ranged from 0.65 to 2.02 on a 0‐10 cm VAS | SMD 0.25 SD lower | ‐ | 340 participants | ⊕⊕⊝⊝ | The evidence suggests a benefit in the NSAID group, equivalent to up to 2 mm on a 0‐10 cm VAS. This is unlikely to be clinically significant |
| Pain score more than 30 min after procedure | The mean pain score ranged from 1.2 to 1.55 on a 0‐10 cm VAS | SMD 0.27 lower | ‐ | 321 | ⊕⊕⊝⊝ | The evidence suggests a benefit in the NSAID group, equivalent to up to 7mm on a 0‐10 cm VAS. This is unlikely to be clinically significant |
| Vasovagal reaction | 56 per 1,000 | 43 per 1,000 | OR 0.76 | 181 participants | ⊕⊕⊝⊝ | Only 9 events There was insufficient evidence to determine whether there is a difference between the groups |
| Non pelvic pain | Not calculable: no events in one group | OR 2.93 | 181 participants | ⊕⊕⊝⊝ | Only 1 event There was insufficient evidence to determine whether there is a difference between the groups | |
| Allergic reaction | Not calculable: no events in one group | OR 2.93 | 181 participants | ⊕⊕⊝⊝ | Only 1 event There was insufficient evidence to determine whether there is a difference between the groups | |
| *The risk in the intervention group (and its 95% confidence interval) is based on the mean risk in the comparison group and the relative effect of the intervention (and its 95% CI). | ||||||
| GRADE Working Group grades of evidence | ||||||
| 1Downgraded one level due to serious risk of bias: none of the studies adequately described methods of allocation concealment. | ||||||
| Opioid compared to placebo or no treatment for outpatient hysteroscopy | ||||||
| Population: women undergoing outpatient hysteroscopy | ||||||
| Outcomes | Anticipated absolute effects* (95% CI) | Relative effect | № of participants | Quality of the evidence | Comments | |
| Risk with placebo or no treatment | Risk with opioid | |||||
| Pain score during procedure: oral opioid | The mean pain score was 5.92 mm on a 0‐10 cm VAS | Oral opioid: SMD was 0.76 lower (95% CI 1.10 lower to 0.42 lower) | ‐ | 140 (1 study) | low1,2 | Data from the two studies were unsuitable for pooling due to extreme heterogeneity (I2 = 92%) with conflicting directions of effect. There is a suggestion of benefit from oral opioid, equating to a difference of up to 22 mm on a 0‐10 cm VAS. This may possibly be clinically significant |
| Pain score during procedure: sublingual opioid | The mean pain score was from 3.2 mm on a 0‐10 cm VAS | Sublingual opioid: SMD was 0.08 higher (95% CI 0.22 lower to 0.39 higher) | 164 (1 study) | low1,2 | ||
| Pain score within 30 min of procedure oral opioid | The mean pain score was 3.27 mm on a 0‐10 cm VAS | SMD ‐0.57 lower | ‐ | 140 | low1,2 | There is a suggestion of benefit from oral opioid, equating to a difference of up to 17 mm on a 0‐10 cm VAS. This may possibly be clinically significant |
| Pain score more than 30 min after procedure oral opioid | The mean pain score was 0.77 on a 0‐10 cm VAS | SMD 0.17 lower | ‐ | 140 | very low1,2,3 | |
| Nausea and vomiting sublingual opioid | Not calculable as all 31 events were in the opioid group and none in the placebo group | OR 107.55 (6.44 to 1796.46) | 164 | low1 | There were 4 events in the intervention group of the oral opioid study, but events in the placebo group were not reported | |
| *The risk in the intervention group (and its 95% confidence interval) is based on the mean risk in the comparison group and the relative effect of the intervention (and its 95% CI). | ||||||
| GRADE Working Group grades of evidence | ||||||
| 1Downgraded one level for serious risk of bias: method of allocation concealment or blinding, or both, not described. | ||||||
| Intracervical versus combined intracervical and paracervical anaesthesia | ||||||
| Population: women undergoing outpatient hysteroscopy | ||||||
| Outcomes | Anticipated absolute effects* (95% CI) | Relative effect | No of participants | Quality of the evidence | Comments | |
| Risk with combined intracervical and paracervical anaesthesia | Risk with local intracervical anaesthesia | |||||
| Pain score during procedure | The mean pain score was 2.1 (SD 0.2) on a 0‐10 cm VAS | SMD 4.27 SD higher (3.49 higher to 5.06 higher) | ‐ | 84 participants | ⊕⊝⊝⊝ | This suggests a significant benefit from combined anaesthesia, equating to up to 12 mm on a 0‐10 cm point VAS. This is unlikely to be be clinically significant |
| Pain score within 30 minutes of the procedure | The mean pain score was 1.5 (SD 0.3) on a 0‐10 cm VAS | (SMD 1.55, 95% CI 1.06 higher to 2.05 higher) | ‐ | 84 participants (1 study) | ⊕⊝⊝⊝ | This suggests a significant benefit from combined anaesthesia, equating to up to 5 mm on a 0‐10 cm point VAS. This is unlikely to be clinically significant |
| Pain score more than 30 minutes of the procedure | The mean pain score was 1 (SD 0.2) on a 0‐10 cm VAS | (SMD 3.47, 95% CI 2.78 higher to 4.15 higher) | ‐ | 84 participants (1 study) | ⊕⊝⊝⊝ | This suggests a significant benefit from combined anaesthesia, equating to up to 8 mm on a 0‐10 cm point VAS. This is unlikely to be clinically significant |
| Adverse effects | No data available | |||||
| *The risk in the intervention group (and its 95% confidence interval) is based on the mean risk in the comparison group and the relative effect of the intervention (and its 95% CI). CI: confidence interval; SMD: standardised mean difference; SD: standard deviation; VAS: visual analogue scale | ||||||
| GRADE Working Group grades of evidence | ||||||
| 1Downgraded two levels for very serious risk of bias: allocation concealment not described, participants not blinded. | ||||||
| Antispasmodic plus NSAID versus paracervical anaesthesia | ||||||
| Population: women undergoing outpatient hysteroscopy | ||||||
| Outcomes | Illustrative comparative risks* (95% CI) | Relative effect | No of participants | Quality of the evidence | Comments | |
| Paracervical anaesthesia | Antispasmodic plus NSAID | |||||
| Pain score during procedure | The mean pain score was 5.93 (SD ‐1.26) on a 0‐10 cm VAS | SMD 1.40 SD lower (1.90 lower to 0.91 lower) | ‐ | 80 | ⊕⊝⊝⊝ | This suggests a beneficial effect in the drotaverine hydrochloride and mefenamic acid group, equating to up to 23 mm on a 0‐10 cm point VAS. This may possibly be clinically significant |
| Pain score within 30 minutes of the procedure | This outcome was not reported | |||||
| Pain score more than 30 minutes after the procedure | The mean pain score was 2.53 (SD ‐0.81) on a 0‐10 cm VAS | SMD 0.87 SD lower | ‐ | 80 | ⊕⊝⊝⊝ | This suggests a beneficial effect in the drotaverine hydrochloride and mefenamic acid group, equating toup to11mm on a 0‐10 cm point VAS. This is unlikely to be clinically significant. |
| Adverse effects | This outcome was not reported | |||||
| *The risk in the intervention group (and its 95% confidence interval) is based on the mean risk in the comparison group and the relative effect of the intervention (and its 95% CI). CI: confidence interval; SMD: standardised mean difference; SD: standard deviation; VAS: visual analogue scale | ||||||
| GRADE Working Group grades of evidence | ||||||
| 1Downgraded two levels for very serious risk of bias: methods of allocation concealment not described, not blinded. | ||||||
Background
Description of the condition
Outpatient hysteroscopy is an established diagnostic gynaecological procedure that enables a clinician to visualise the uterine cavity and take endometrial biopsies or perform small intracavitary procedures as required. Hysteroscopy involves the use of miniaturised endoscopic equipment to examine the uterine cavity. As one of the principal investigations of abnormal uterine bleeding, hysteroscopy has an integral role in the identification of structural abnormalities of the endometrium (NICE guidelines 2007). Outpatient hysteroscopy can also be employed for procedures such as removal of lost intrauterine devices, endometrial polypectomy and work‐up of reproductive problems (Robinson 2013; Sinha 2007).
The procedure is performed without the need for theatre facilities and regional or general anaesthesia. Advantages to both the healthcare providers and women, include decreased complication rates, shorter recovery time, decreased costs and the scope for a 'see and treat' service (Ma 2016; Saridogan 2010). Although safe, studies of the acceptability of outpatient hysteroscopy have displayed various completion rates, ranging between 77% to 97.2% (Agostini 2003; Critchley 2004; De Iaco 2000; De Jong 1990), with pain cited as the most common cause for failure to complete the investigation (Critchley 2004; Jivraj 2004; Nagele 1997; Paschopoulos 1997). During hysterosalpingography (HSG), pain peaks from the time of instillation of the contrast media until five minutes after the procedure; the pain starts to decrease rapidly between five and 10 minutes after the procedure so that at 30 minutes most women classify it as a 'discomfort' (Owens 1985).
The pain experienced is due to several factors including cervical instrumentation, uterine distension and peritoneal irritation from spill of dilatation media. Pain stimuli from the cervix and vagina are conducted by the pelvic splanchnic nerves whereas pain sensation from intraperitoneal structures, such as the uterine body, is conducted by the hypogastric nerves (Moore 2006). Destruction of the endometrium and endometrial biopsy can cause further pain as they may induce uterine contraction (Zupi 1995). Additional delayed pain is also caused by the release of prostaglandins from the cervical manipulation as well as distension of the uterus. Furthermore, blind cervical dilatation, cervical stenosis or tortuosity may increase chances of uterine lacerations (Jansen 2000; Pasini 2001).
Other factors that may impact on pain experienced include the type and size of hysteroscope used, choice of distension media and technique employed. It is recommended that miniature hysteroscopes (2.7 mm, with a 3 mm to 3.5 mm sheath) should be used for diagnostic outpatient hysteroscopy to reduce discomfort (Green‐top Guidelines No. 59; Paulo 2015). Use of a vaginoscopic approach has also been advocated to reduce pain experienced (Cooper 2010b). Systematic reviews have demonstrated varied results for difference in pain experienced based upon distension media used although fewer vasovagal episodes are reported with the use of saline when compared to carbon dioxide (Cooper 2011; Craciunas 2013).
Description of the intervention
There are numerous studies that have reported varied outcomes in terms of the effectiveness of different pharmacological interventions for pain relief during hysteroscopy. We have investigated the effect of any one type of pharmacological intervention (opioids, local anaesthetic, non‐steroidal anti‐inflammatory drugs (NSAIDs) or paracetamol) for pain relief during hysteroscopy compared with another type, or with placebo.
How the intervention might work
De Iaco 2000 observed that 34.8% of women who undergo anaesthesia‐free diagnostic hysteroscopy reported severe pain. Pain is mainly produced when the speculum or tenaculum are placed, with cervical dilation, passage of the hysteroscope through the cervical canal, and distension of the uterus with fluid. Operative procedures that damage the endometrial wall are also painful. The pain experienced can have a negative impact on the woman's ability to fully co‐operate with the procedure. Through successful anaesthesia (including paracervical and intracervical anaesthesia) and application of topical agents in the cervical canal and endometrial cavity, we hope to target more than one site. This will result in pain relief and better tolerance of the procedure.
Why it is important to do this review
A study reported a wide variation in clinical practice in the UK in terms of the use of analgesia for outpatient hysteroscopy (O'Flynn 2011). Generally, while pain relief is common in clinical practice the evidence is uncertain on its effect. The review aims to assess the effectiveness of the various pain relief methods available.
The Royal College of Obstetricians and Gynaecologists recommend that women with no contraindications should consider taking a standard dose of a NSAID at least an hour before their appointment (Green‐top Guidelines No. 59). These guidelines also recommended consideration of the use of topical local cervical anaesthesia during cervical tenaculum use.
With the vast potential for its use in the primary care setting, a consensus upon the safest and most efficacious method of pain relief for outpatient hysteroscopy would be advantageous.
The purpose of the meta‐analysis was therefore to compare the effectiveness and safety of different types of pharmacological interventions for pain relief in women undergoing outpatient hysteroscopy.
Objectives
To assess the effectiveness and safety of pharmacological interventions for pain relief in women undergoing outpatient hysteroscopy, compared with placebo, no treatment or other pharmacological therapies.
Methods
Criteria for considering studies for this review
Types of studies
Randomised controlled trials (RCTs) comparing any one type of pharmacological intervention for pain relief during outpatient hysteroscopy with another type, placebo, or no treatment. We excluded non‐randomised studies (e.g. studies with inadequate sequence generation, patient numbers) as they are associated with a high risk of bias. We also excluded cross‐over trials, as the design is not valid in this context.
Types of participants
Adult (aged over 18 years) women attending for an outpatient hysteroscopy.
Types of interventions
We analysed the following interventions.
-
Analgesics (topical or oral) versus placebo or no treatment
-
Opioids versus placebo or no treatment
-
Local anaesthetics versus placebo or no treatment
-
NSAIDs versus placebo or no treatment
-
Paracetamol or similar versus placebo or no treatment.
-
-
Analgesics (topical or oral or inhaled) versus other analgesics
-
Opioids versus paracetamol
-
Opioids versus local anaesthetics
-
Opioids versus NSAIDS
-
Local anaesthetics versus NSAIDs
-
NSAIDs versus paracetamol
-
Paracetamol versus local anaesthetics (LA)
-
Any analgesic versus any other analgesic
-
We performed subgroup analysis by route of administration. Dosages and routes used in the studies are displayed in Table 1.
| Study | Route | Dose |
| Intracervical versus intra and paracervical | Local intracervical anaesthesia compared to combined intracervical and paracervical anaesthesia. 0.5% bupivacaine hydrochloride into anterior wall of cervix compared to 0.5% bupivacaine hydrochloride into anterior wall of cervix plus bupivacaine into lateral vaginal fornix at 3 and 9 o’clock at 10 mm depth | |
| Endocervical topical cream | 3 mL of EMLA cream 5% or 3 mL ultrasound gel applied in the endocervical canal 10 min before surgery with 5 mL needleless syringe via speculum. A subsequent application of either gel was made with a swab at ectocervix level during vaginoscopic approach | |
| Intracervical | Intracervical injection of 10 mL of lignocaine 1% with 1:200 000 adrenaline or normal saline was injected into the cervix at 1, 5, 7, and 11 o’clock | |
| Transcervical | 2 mL of 2% mepivacaine or 2 mL of 0.9% saline injected trans cervically (inserted up the cervical canal to the internal os) | |
| Paracervical | 10 mL of 1.5% mepivacaine or saline injected into junction of cervix and vagina (4 and 8 o'clock positions) | |
| Topical spray | 10 mL of 2% lignocaine gel, placebo gel or no gel administered into cervical canal. Some women received intracervical lignocaine block if determined to need cervical dilatation | |
| Intrauterine | 5 mL of 2% lignocaine or 5 mL or 0.9% saline injected into cervical canal and uterine cavity via hysteroscope | |
| Intracervical | Intracervical application at 1, 5, 7 and 11 o'clock positions of 4 x 2 mL ampoules of 2% lidocaine hydrochloride ampoules or saline | |
| Paracervical versus uterosacral | 20 mL of 1% lignocaine paracervical block or 2 mL of 2% lignocaine uterosacral block | |
| Paracervical | 20 mL of 1% mepivacaine injected paracervically at 3, 5, 7 and 9 o'clock position of the junction of cervix and vagina at least 5 min before the procedure | |
| Intracervical versus intracervical and intrauterine | 2 mL of 1% lidocaine into anterior wall. Distension medium of either saline only or 18 mL of lidocaine in 250 mL of saline | |
| Intracervical | Intracervical local anaesthesia (10 mL of 1% prilocaine) was applied at the 4 and | |
| Paracervical | Paracervical block at 3, 5, 7 and 9 o'clock positions of 10 mL of 2% lignocaine or saline, 5 min prior to procedure | |
| Transcervical | Transcervical intrauterine instillation of 5 mL of 2% lignocaine or normal saline into the uterine cavity 5 min before procedure | |
| Para/intracervical versus intracervical only anaesthetic block | The para/intracervical group received a total of 37 cc of anaesthesia injected at 6 different sites. 2‐3 min prior to the injection, topical 1% lidocaine was applied to the cervix in this group. The intracervical group received a total of 22 cc of anaesthetic given at 3 different injection sites | |
| Intracervical | 1 mL to 3 mL (30 to 90 mg) of mepivacaine 3% or saline administered intracervically 3 min prior to procedure | |
| Intracervical versus NSAID | 5 mL mepivacaine 2% intracervically up to the level of the internal os or one tablet of dexketoprofen given 1 h before the procedure | |
| Transcervical intrauterine lidocaine instillation versus rectal diclofenac | 5 mL of 2% lidocaine or the same volume of saline was instilled through the endocervix into the uterine cavity with an 18‐gauge angiocatheter 3 min prior to the procedure | |
| Intracervical | The second group was administered with a 1000 mL distention medium containing 18 mL lidocaine per 250 mL (Jetokain ampoule 20 mg 2% Adeka, Samsun, Turkey) | |
| Topical spray | 30 mg (3 metered doses) of lignocaine or placebo sprayed onto surface of cervix and cervical canal through 360° 5 min prior to procedure | |
| Topical cream versus topical spray | 1 cm3 of 5% prilocaine cream onto esocervix and 2 cm3 inserted 3 cm into cervical canal 10 min before procedure or 20 mg of lidocaine spray directed onto esocervix and 20 mg 3 cm into cervical canal immediately before procedure or no intervention | |
| Intrauterine | Unspecified volume of Instillagel (contains 2% lidocaine) or Endosgel (does not contain local anaesthetic) warmed to 37°C and instilled via a 2 mm neonatal suction catheter as part of sonography procedure 30 min prior to hysteroscopy | |
| Paracervical | Paracervical block at 3, 5, 7 and 9 o'clock positions of 10 mL 1% mepivacaine 5 min before procedure or no intervention given | |
| Topical gel | 4 mL of 2% lignocaine or placebo gel applied onto cervix before procedure | |
| Intrauterine | 5 mL of 2% mepivacaine or 5 mL of saline intrauterine via 3 mm catheter |
NSAID: nonsteroidal anti‐inflammatory drug
Types of outcome measures
Primary outcomes
-
Pain score
-
Pain score during the procedure (validated pain scale)
-
Pain score after the procedure (validated pain scale): a) within the first 30 minutes of the procedure b) more than 30 minutes after the procedure
-
We used the earliest mean pain score if a study reported a mean pain score on two different occasions, within the same group.
In the meta‐analysis, where it was reported we used a VAS score, as this was the one validated score consistently reported across the studies.
Jensen 2002 performed an analysis of two RCTs to assess the amount of change on a VAS, corresponding to differing levels of pain relief. The findings suggested that a 33% decrease in pain represents a reasonable standard for determining that a change in pain is meaningful from the patient's perspective.
Secondary outcomes
-
Failure to complete the procedure
-
Adverse effects and complications: nausea, vomiting, constipation, drowsiness, respiratory depression, hypotension, allergic reaction, and infection
Search methods for identification of studies
Electronic searches
We searched the Cochrane Gynaecology and Fertility (formerly MDSG) Specialised Register of controlled trials for any trials, with key words and title, from inception until 15 September 2016 (Appendix 1). We searched the Cochrane Central Register of Controlled Trials (CENTRAL; 2016, issue 9) via the Cochrane Register of Studies Online (CRSO) (Appendix 2), Ovid MEDLINE from inception to 15 September 2016 (Appendix 3), Ovid Embase from inception to 15 September 2016 (Appendix 4), Ovid PsycINFO from inception to 15 September 2016 (Appendix 5), and EBSCO CINAHL from inception to 15 September 2016 (Appendix 6). Additional keywords and Mesh terms were added to the search strategies for this update.
Searching other resources
We searched references from reviewed articles to identify any eligible trials not found in the primary search, however we did not identify any additional eligible trials. We also searched registers of ongoing trials including US National Institutes of Health (ClinicalTrials.gov), The World Health Organization International Trials Registry Platform search portal (WHO ICTRP) and LILACS.
Data collection and analysis
Selection of studies
Two review authors (GA and HO’F, initial review; HO'F, DL and SS, 2017 update) independently assessed the trials for eligibility to be included in accordance with the eligibility criteria. AW resolved disagreements.
Data extraction and management
We examined titles and abstracts in order to include trials that matched the inclusion criteria. We sought full‐text reports to confirm eligibility and contacted study authors where necessary. Review authors (GA, SA, HO'F, initial review; GA, DL, SS and HO'F for 2017 update) independently extracted data. GA resolved disagreements (AW, initial review). We examined trials for the following: source, eligibility, methodological details, interventions (routes of delivery, doses, timing), descriptive data of participants (age, co‐morbidities), outcomes, and funding sources. Data were entered into a data collection form and managed within a Microsoft Access database before input into Review Manager 5 (RevMan 5) (RevMan 2014).
Assessment of risk of bias in included studies
We used the Cochrane 'Risk of bias' tool for assessing risk of bias in each study (Higgins 2011). The domains that we considered were: sequence generation and allocation concealment (selection bias); blinding of personnel, participants and outcome assessors (performance and detection bias); incomplete outcome data (attrition bias); selective reporting (reporting bias); and other bias. We managed information within 'Risk of bias' tables (see Characteristics of included studies; Figure 1; Figure 2). Three review authors (SS, HO’F and GA,) independently performed all assessments of the risk of bias of trials and extracted data (2017 update). All discrepancies were resolved by GA (2017 update; AW, initial review). We sought additional information on trial methodology and trial data from the authors of trials that appeared to meet the eligibility criteria but had aspects of methodology that were unclear, or where the data were in a form that was unsuitable for meta‐analysis.
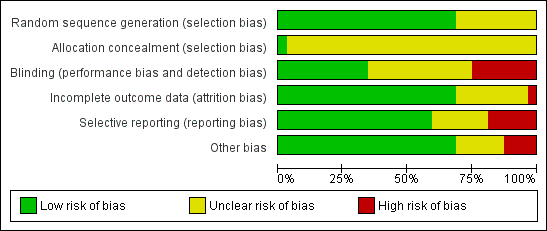
Methodological quality graph: review authors' judgements about each methodological quality item presented as percentages across all included studies
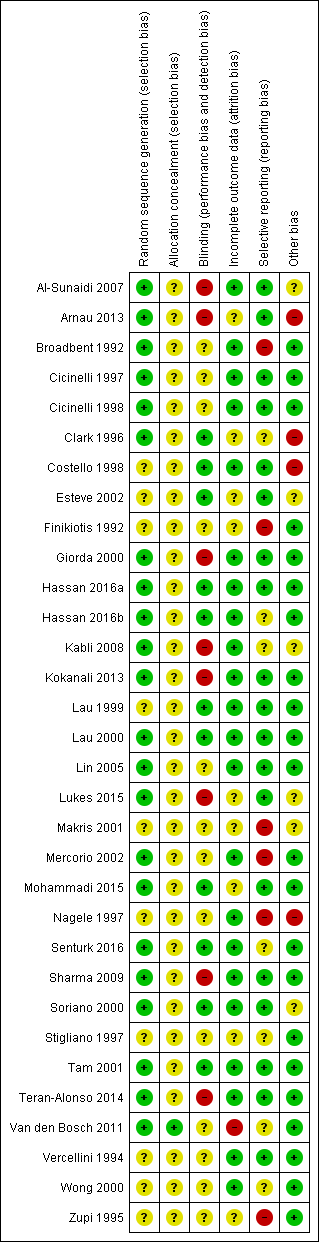
Methodological quality summary: review authors' judgements about each methodological quality item for each included study
Measures of treatment effect
Any validated pain scale was acceptable for inclusion of a trial into the review. We have translated our main results into a difference on a commonly used scale (visual analogue scale (VAS)) to demonstrate clinical importance. We used this instead of the peak mean pain score, as pain peaks from the time of distension until five minutes after the procedure, so that at 30 minutes most women classify the pain as a discomfort (Owens 1985). For significant results we used the smallest standard deviations and for results of no significance we used the largest standard deviations. We analysed the data and compared them according to the timing of the pain. We divided the groups as follows: pain during the procedure; pain within the first 30 minutes of the procedure; and pain more than 30 minutes following the procedure. For dichotomous data (e.g. adverse events), we used the numbers of events in the control and intervention groups of each study to calculate Mantel‐Haenszel odds ratios (ORs). For continuous data, we calculated the standardised mean difference (SMD).
Unit of analysis issues
Primary analysis for this review was per woman randomised.
We addressed the following:
-
groups of individuals randomised together to the same intervention;
-
individuals undergoing more than one intervention.
Dealing with missing data
We analysed data on an intention‐to‐treat basis as far as possible and attempted to obtain missing data from the original trialists. We did not undertake imputation and only analysed available data.
Assessment of heterogeneity
We used four methods to assess heterogeneity.
-
We performed a Chi² test. If significant, we judged that there would be a strong possibility of high heterogeneity.
-
We calculated the I² statistic to help determine heterogeneity (Higgins 2003). As a guide, we used the following thresholds (Deeks 2011):
-
0% to 40%: might not be important;
-
30% to 60%: may represent moderate heterogeneity;
-
50% to 90%: may represent substantial heterogeneity;
-
75% to 100%: considerable heterogeneity.
-
-
Overlap of the confidence interval of individual trials
-
Variations in the point estimate of individual trials
After considering these four methods we made a judgement on whether there was significant heterogeneity in the meta‐analysis, and detailed our reasons in the text.
Assessment of reporting biases
We aimed to minimise the potential impact of reporting bias by ensuring a comprehensive search for eligible studies and by being alert for duplication of data. We planned to use a funnel plot to assess publication bias, if there were more than 10 studies in the same analysis (Sterne 2011).
Data synthesis
We performed statistical analysis in accordance with the guidelines for statistical analysis developed by Cochrane (Deeks 2011). When interpreting the results of the comparison of an intervention to a placebo, a negative SMD indicates that an intervention is superior to a placebo in terms of ability to reduce levels of pain and a positive SMD indicates that a placebo is superior to an intervention. We reported adverse effects as odds ratios (OR), with a fixed‐effect model.
Subgroup analysis and investigation of heterogeneity
Where data were available, we planned to conduct subgroup analyses for the primary outcome, to determine the separate evidence within the following subgroups:
-
Postmenopausal women
-
Different routes of delivery
If there was substantial heterogeneity (I2 greater than 50%), we planned to explore differences between the studies that might account for the heterogeneity.
Sensitivity analysis
We conducted sensitivity analyses for the primary outcomes to determine whether the conclusions were robust to arbitrary decisions made regarding eligibility of studies and analysis. These analyses included consideration of whether review conclusions differed if:
-
eligibility was restricted to studies without high risk of bias;
-
a random‐effects model had been adopted; or
-
risk ratio had been used as the summary effects measure.
Overall quality of the body of evidence: 'Summary of findings' table
We assessed the quality of the evidence using GRADE criteria: risk of bias (with regard to internal validity), consistency of effect, imprecision, indirectness and publication bias). Two review authors working independently made judgements about evidence quality (high, moderate, low or very low), resolving any disagreements by discussion. We prepared 'Summary of findings' tables for the review outcomes pain score during and post procedure and adverse events for the main review comparison (local anaesthetic versus placebo). We also prepared additional 'Summary of findings' tables for the main review outcomes for other important comparisons (NSAIDS versus placebo or no treatment, opioids versus placebo or no treatment, selected head‐to‐head comparisons as space allowed). We justified and documented our judgements, and incorporated them into reporting of results for each outcome.
Results
Description of studies
Results of the search
We identified a total of 47 potentially eligible studies using the search strategy and included 32 (3304 participants) studies within our review; however, we included only 19 studies (2801 participants) in the analyses as we could not accurately interpret the data from the other 13 studies and our attempts to obtain the missing data were unsuccessful. Three studies are ongoing. See Figure 3 for details of the screening and selection process. See also Characteristics of included studies and Characteristics of excluded studies.
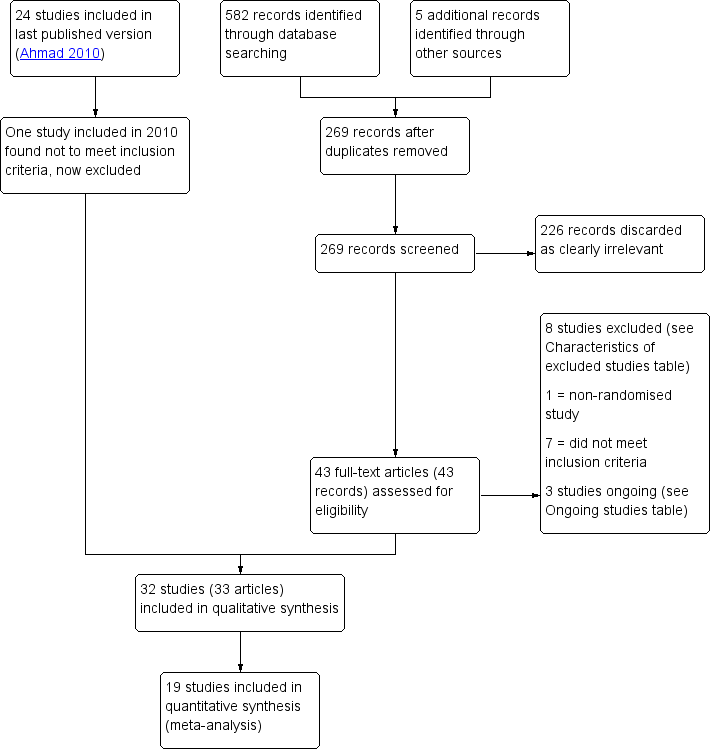
Study flow diagram
Included studies
We included 32 RCTs (3304 participants), of which only 19 (Figure 3) reported data relevant to our review outcomes that were suitable for analysis (Al‐Sunaidi 2007; Arnau 2013; Cicinelli 1997; Cicinelli 1998; Costello 1998; Esteve 2002; Giorda 2000; Hassan 2016a, Kokanali 2013; Lau 1999; Lau 2000; Lin 2005; Lukes 2015; Sharma 2009; Soriano 2000; Tam 2001; Teran‐Alonso 2014; Vercellini 1994; Wong 2000).
Studies took place in Australia, Belgium, Brazil, Canada, China, France, Greece, India, Italy, Spain, Taiwan, UK and USA.
Interventions
Three studies compared analgesic methods versus no treatment: Kokanali 2013; Teran‐Alonso 2014; and Vercellini 1994.
Twenty‐one studies compared analgesic methods versus placebo: Al‐Sunaidi 2007; Arnau 2013; Broadbent 1992; Cicinelli 1997; Cicinelli 1998; Clark 1996; Costello 1998; Esteve 2002; Giorda 2000; Hassan 2016a; Hassan 2016b; Lau 1999; Lau 2000; Lin 2005; Makris 2001; Nagele 1997; Senturk 2016; Soriano 2000; Tam 2001; Van den Bosch 2011; Wong 2000; and Zupi 1995.
Eight studies compared different types of analgesia: Finikiotis 1992; Hassan 2016a; Kabli 2008; Lukes 2015; Mercorio 2002; Mohammadi 2015; Sharma 2009; and Stigliano 1997.
Some studies included more than one type of comparison.
The studies with data suitable for analysis made the following comparisons:
-
local anaesthetic versus placebo (Arnau 2013; Cicinelli 1997; Cicinelli 1998; Costello 1998; Esteve 2002; Kokanali 2013; Lau 1999; Lau 2000; Soriano 2000; Wong 2000);
-
local anaesthetic versus no intervention (Giorda 2000; Vercellini 1994);
-
NSAID (with or without paracetamol) versus no medication (Hassan 2016a; Tam 2001; Teran‐Alonso 2014);
-
oral or sublingual opioid versus placebo (Hassan 2016a; Lin 2005);
-
intracervical anaesthesia versus combined intracervical and paracervical anaesthesia (Al‐Sunaidi 2007);
-
intracervical anaesthesia versus combined intracervical, paracervical and topical anaesthesia (Lukes 2015);
-
antispasmodic plus NSAID (mefenamic acid and oral drotaverine) versus local paracervical anaesthesia (Sharma 2009);
-
oral opioid (tramadol) versus oral NSAID (celecoxib) (Hassan 2016a).
Local anaesthetics used in these studies included mepivacaine paracervical block (Giorda 2000; Vercellini 1994), lignocaine paracervical block (Lau 1999), 1% lidocaine applied for a set time to the cervix before injection of local anaesthetic (Lukes 2015), lidocaine intracervical block (Esteve 2002; Kokanali 2013), lignocaine transcervical intrauterine local anaesthetic (Costello 1998; Lau 2000), mepivacaine transcervical intrauterine local anaesthetic (Cicinelli 1997; Cicinelli 1998), lignocaine spray (Soriano 2000), lignocaine gel (Wong 2000) and endocervical and exocervical lidocaine/prilocaine cream (Arnau 2013). See Table 1 for details.
We did not identify any studies that investigated the use of paracetamol alone.
The studies that did not report data suitable for analysis for our review outcomes made the following comparisons:
-
local anaesthesia versus placebo or no treatment (Broadbent 1992; Clark 1996; Makris 2001; Van den Bosch 2011; Zupi 1995). Interventions used in these studies included intracervical block (Broadbent 1992; Makris 2001), lidocaine gel (Clark 1996; Van den Bosch 2011) and mepivacaine (Zupi 1995);
-
oral mefenamic acid versus placebo (Nagele 1997);
-
oral opioid (tramadol) versus placebo (Hassan 2016b);
-
paracervical block versus uterosacral block (Finikiotis 1992);
-
oral dexketoprofen versus intracervical block (Mercorio 2002);
-
lidocaine and prilocaine cream versus lidocaine spray (Stigliano 1997);
-
rectal diclofenac versus intrauterine lidocaine (Mohammadi 2015);
-
local cervical versus combined cervical and intrauterine anaesthesia (Kabli 2008);
-
intrauterine lidocaine versus rectal indomethacin and placebo (Senturk 2016).
Participants
The mean age of participants in the review ranged from 29 to 61 years. Both pre‐ and postmenopausal women were included in the majority of selected trials. Three studies investigated the use of analgesia in outpatient hysteroscopy amongst women who were postmenopausal (Cicinelli 1997; Cicinelli 1998; Giorda 2000).
Outcomes
Among studies with data suitable for analysis, 18 studies investigated the use of analgesia upon pain relief during hysteroscopy; eight studies investigated the use of analgesia upon pain relief within 30 minutes after hysteroscopy; and nine studies investigated the use of analgesia upon pain relief more than 30 minutes after hysteroscopy. Most of these studies used a standardised 0‐10 cm‐point VAS (Al‐Sunaidi 2007; Arnau 2013; Costello 1998; Esteve 2002; Hassan 2016a; Kokanali 2013; Lau 1999; Lau 2000; Sharma 2009; Soriano 2000; Tam 2001; Teran‐Alonso 2014; Vercellini 1994). Two studies used a 5‐point 20 cm VAS (Cicinelli 1997; Cicinelli 1998). One study (Lukes 2015) used the 0‐10 cm Wong‐Baker face‐rating scale, which provides a scale ranging from 0 to 10, with 0 indicating no pain and 10 indicating maximum pain (Lukes 2015). Two studies also presented data as percentages (Giorda 2000; Lin 2005) and another presented data with area under the curve statistics (Wong 2000).
Among studies not included in analysis, 10 assessed the effect of analgesia on pain relief during hysteroscopy; four studies investigated the use of analgesia upon pain relief within 30 minutes after hysteroscopy; and three studies investigated the use of analgesia upon pain relief more than 30 minutes after hysteroscopy.
Eleven RCTs reported adverse effects.
Excluded studies
We excluded eight studies from the review (Canovas 2006; De Angelis 2003; Goldenberg 2001; Guida 2003; Kaya 2005; Mizrak 2010; Pace 2008; Wallage 2003). We excluded six studies as they used either general anaesthetic or an intravenous analgesic as an intervention (Goldenberg 2001; Guida 2003; Kaya 2005; Mizrak 2010; Pace 2008; Wallage 2003). One study was excluded as it was not randomised (Canovas 2006) and one study was excluded as the intervention investigated was non‐pharmacological (De Angelis 2003).
Risk of bias in included studies
See (Characteristics of included studies, Figure 1, Figure 2).
Allocation
Sequence generation
The method of sequence generation was unclear for 10 studies (Costello 1998; Esteve 2002; Finikiotis 1992; Lau 1999; Makris 2001; Nagele 1997; Stigliano 1997; Vercellini 1994; Wong 2000; Zupi 1995). The remaining studies described the use of random computer‐generated block randomisation, random table, random number or random codes and we therefore classified them as being at low risk of bias in this domain.
Allocation concealment
Only one of the included studies (Van den Bosch 2011) clearly described the method of allocation concealment and we classified it as being at low risk of bias in this domain. We rated the other studies as unclear risk of bias.
Blinding
Eleven studies were double‐blinded, defined as blinding of both the participant and healthcare provider (Clark 1996; Costello 1998; Esteve 2002; Hassan 2016a; Hassan 2016b; Lau 1999; Lau 2000; Mohammadi 2015; Senturk 2016; Soriano 2000; Tam 2001). Eight studies were not double‐blinded, and we rated them at high risk of bias (Al‐Sunaidi 2007; Arnau 2013; Giorda 2000; Kabli 2008; Kokanali 2013; Lukes 2015; Sharma 2009; Teran‐Alonso 2014). We rated the rest of the studies as unclear in this domain, as there was insufficient information to determine whether they were effectively double‐blinded.
Incomplete outcome data
Twenty two studies reported no attrition or relatively low levels of attrition and we rated them as being at low risk of bias in this domain (Al‐Sunaidi 2007; Broadbent 1992; Cicinelli 1997; Cicinelli 1998; Costello 1998; Giorda 2000; Hassan 2016a; Hassan 2016b; Kabli 2008; Kokanali 2013; Lau 1999; Lau 2000; Lin 2005; Mercorio 2002; Nagele 1997; Senturk 2016; Sharma 2009; Soriano 2000; Tam 2001; Teran‐Alonso 2014; Vercellini 1994; Wong 2000). One study had a high level of dropouts before hysteroscopy and we rated it as at high risk (Van den Bosch 2011). The rest of the studies did not clearly state whether any participants were excluded from analysis or did not state the reason for exclusions from analysis, or both; we rated these studies as being at unclear risk of bias in this domain.
Selective reporting
We rated 19 studies as being at low risk of bias due to selective reporting (Al‐Sunaidi 2007; Arnau 2013; Cicinelli 1997; Cicinelli 1998; Costello 1998; Esteve 2002; Giorda 2000; Hassan 2016a; Kokanali 2013; Lau 1999; Lau 2000; Lin 2005; Lukes 2015; Mohammadi 2015; Sharma 2009; Soriano 2000; Tam 2001; Teran‐Alonso 2014; Vercellini 1994). They reported data in a standard manner, provided data for all time points stated to have data collected and did not utilise change from baseline scores or convert to dichotomous outcomes.
We rated six studies as being at high risk of selective reporting bias. In two of these studies continuous data recording meant that pain scores were converted into dichotomous data without providing an opportunity to interpret data as mean pain scores (Broadbent 1992; Finikiotis 1992). Four studies presented data in graphical form, which we could not accurately interpret as mean pain scores (Makris 2001; Mercorio 2002; Nagele 1997; Zupi 1995).
We rated seven studies as being at unclear risk of selective reporting bias: Clark 1996 used a 4‐point descriptive scale and converted data into two outcomes; Stigliano 1997 used a 4‐point descriptive scale; Van den Bosch 2011 did not report standard deviations; Wong 2000 presented data as area under the curve statistics; and three studies (Hassan 2016b; Kabli 2008; Senturk 2016) presented results as median pain scores, which could not be converted into mean pain scores.
We considered that failure to report standard deviations and graphical representation of data without numerical values may be considered as a form of under reporting.
Other potential sources of bias
We rated four studies as being at high risk of other bias, due to co‐interventions that did not apply to all participants (Arnau 2013; Clark 1996; Nagele 1997), or assessment of procedural pain when the scope had already been introduced (Costello 1998). Six studies were rated as at unclear risk of other bias, due to variation in the doses used (Makris 2001), unequal numbers of participants in the two groups (Esteve 2002; Soriano 2000), use of additional sedation or analgesia in both groups (Al‐Sunaidi 2007; Kabli 2008; Lukes 2015). We did not identify any risk of other potential bias in the remaining 23 studies, which we rated as being at low risk of bias in this domain.
Effects of interventions
See: Summary of findings for the main comparison Local anaesthetic compared to placebo or no treatment for outpatient hysteroscopy; Summary of findings 2 Oral NSAID compared to placebo or no treatment for outpatient hysteroscopy; Summary of findings 3 Opioid compared to placebo or no treatment for outpatient hysteroscopy; Summary of findings 4 Intracervical versus combined intracervical and paracervical anaesthesia; Summary of findings 5 Antispasmodic plus NSAID versus paracervical anaesthesia
We have translated our main results into a difference on a commonly used scale (visual analogue scale (VAS)) to demonstrate clinical importance.
1. Analgesic versus placebo or no treatment
1.1 Local anaesthetic versus placebo or no treatment
1.1.1. Primary outcome: pain score
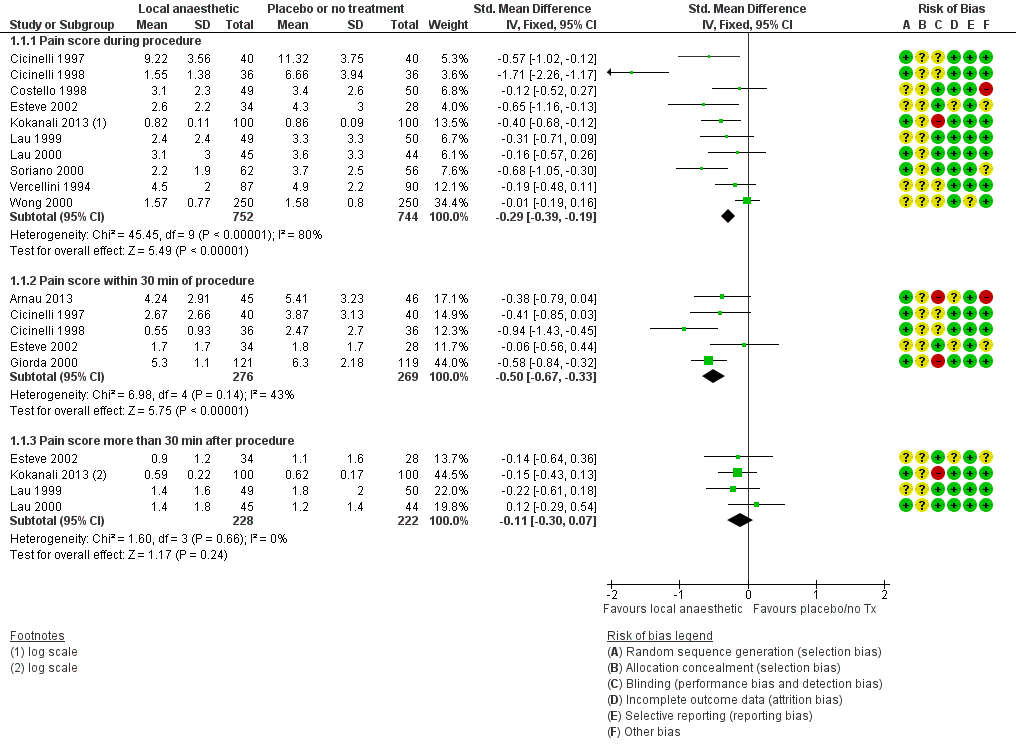
Forest plot of comparison: 1 Local anaesthetic versus placebo or no treatment, outcome: 1.1 Pain score.
Pain score during the procedure
Meta‐analysis of ten RCTs including 1496 women (Cicinelli 1997; Cicinelli 1998; Costello 1998; Esteve 2002; Kokanali 2013; Lau 1999; Lau 2000; Soriano 2000; Vercellini 1994; Wong 2000) demonstrated a significant reduction in the mean pain score during hysteroscopy with the use of local anaesthetic (SMD ‐0.29, 95% CI ‐0.39 to ‐0.19, I2 = 80%, low‐quality evidence). This translates to a difference of between 0.2 mm (lower) and 0.7 mm (lower) on a 10 cm VAS. This is unlikely to be clinically significant.
Pain score within 30 minutes of the procedure
Meta‐analysis of five RCTs (Arnau 2013; Cicinelli 1997; Cicinelli 1998; Esteve 2002; Giorda 2000) including 545 women revealed a significant reduction in the mean pain score within 30 minutes after the procedure with the use of local anaesthetics (SMD ‐0.50, 95% CI ‐0.67 to ‐0.33, I2 = 43%, low‐quality evidence). This translates to a difference of between 7 mm (lower) and 13 mm (lower) on a 10 cm VAS. This is unlikely to be clinically significant.
Pain score more than 30 minutes after the procedure
Meta‐analysis of four RCTs (Esteve 2002; Kokanali 2013; Lau 1999; Lau 2000) including 450 women did not demonstrate clear evidence of a difference between the groups (SMD ‐0.11, 95% CI ‐0.30 to 0.07, I2 = 0%, low‐quality evidence).
1.1.2. Secondary outcome: failure to complete the procedure
These studies considered two different outcome measures as reasons for failure to complete the procedure. These were cervical stenosis and pain, respectively.
Failure to complete the procedure due to cervical stenosis
Six RCTs including 805 women reported failure to complete the procedure due to cervical stenosis (Costello 1998; Esteve 2002; Giorda 2000; Lau 1999; Soriano 2000; Vercellini 1994). There was insufficient evidence to determine whether there was a difference between the groups (OR 1.23, 95% CI 0.62 to 2.43, I2 = 0%).
Failure to complete the procedure due to pain
Two RCTs including 330 women reported failure to complete the procedure due to pain (Giorda 2000; Lau 2000). Thre were fewer incidents of failure to complete the procedure in the intervention group than in the control group (OR 0.29, 95% CI 0.12 to 0.69, I2 = 0%).
1.1.3. Secondary outcome: adverse effects
Eight RCTs reported adverse effects for this comparison (Arnau 2013; Cicinelli 1997; Cicinelli 1998; Giorda 2000; Lau 1999; Lau 2000; Soriano 2000; Wong 2000). There was no clear evidence of difference between the groups in the rate of vasovagal reactions (OR 0.70, 95% CI 0.43 to 1.13, 8 RCTs, 1309 women, I2 = 66%, very low‐quality evidence) and insufficient evidence to determine whether there was a difference between the groups in rates of non‐pelvic pain (OR 1.76, 95% CI 0.53 to 5.80, 1 RCT, 99 women, very low‐quality evidence).
Subgroup analyses
Subgroup analysis of postmenopausal women
In subgroup analysis of studies investigating the use of local anaesthetic exclusively in postmenopausal women, two studies (Cicinelli 1997; Cicinelli 1998) demonstrated a significant benefit for pain relief during hysteroscopy. There was very high heterogeneity, though the direction of effect was consistent (SMD ‐1.13, 95% CI ‐2.25 to ‐0.01, I2 = 90%). Three studies (Cicinelli 1997; Cicinelli 1998; Giorda 2000) demonstrated a significant reduction in the mean pain score within 30 minutes after hysteroscopy (SMD ‐0.61, 95% CI ‐0.86 to ‐0.37, I2 = 23%). The clinical significance of these findings is unclear, given the very low quality of the evidence.
Subgroup analysis by route of intervention
Paracervical block
Pooling of three studies (Cicinelli 1998; Lau 1999; Vercellini 1994) investigating the use of paracervical block compared to placebo or a control group did not demonstrate clear evidence of reduction of the mean pain score during hysteroscopy (SMD ‐0.71, 95% CI ‐1.51 to 0.10, I2 = 92%).
One study (Lau 1999) reported pain scores at more than 30 minutes after hysteroscopy but there was insufficient evidence to determine whether there was a difference between the groups (SMD ‐0.22, 95% CI ‐0.61 to 0.18).
Intracervical block
Two studies (Esteve 2002; Kokanali 2013) investigating the use of intracervical block compared to placebo or a control group demonstrated a significant reduction in the mean pain score during hysteroscopy (SMD ‐0.45, 95% CI ‐0.70 to ‐0.21). There was no clear evidence of a difference between the groups at up to 30 minutes' follow‐up (SMD ‐0.06, 95% CI ‐0.56 to 0.44) nor at follow‐up of more than 30 minutes after hysteroscopy (SMD ‐0.15, 95% CI ‐0.39 to 0.09).
Transcervical or intrauterine block
Three studies (Cicinelli 1997; Costello 1998; Lau 2000) investigating the use of intrauterine or transcervical block compared to placebo or a control group did not demonstrate clear evidence of a difference between the groups during hysteroscopy (SMD ‐0.27, 95% CI ‐0.54 to 0.00, I2 = 21%) nor at follow‐up of up to 30 minutes after hysteroscopy (SMD ‐0.41, 95% CI ‐0.85 to 0.03 (Cicinelli 1997)), or at more than 30 minutes (SMD 0.12, 95% CI ‐0.29 to 0.54 (Lau 2000)).
Topical sprays, gels, and creams
Two studies (Soriano 2000; Wong 2000) investigating the use of topical sprays, gels, and creams compared to placebo or a control group did not demonstrate clear evidence a difference between the groups in the mean pain score during hysteroscopy (SMD ‐0.32, 95% CI ‐0.97 to 0.33, I2 = 90%).
Local anaesthetic versus placebo or no treatment: findings in studies without data suitable for analysis
-
Broadbent 1992 compared the use of 10 mL of 1% lignocaine intracervically to saline, in 100 women. The study authors reported no evidence of a difference between the groups, either during or after hysteroscopy.
-
Clark 1996 compared the use of 10 mL of 2% lignocaine gel to placebo gel or no treatment in 123 women. The study authors reported no evidence of a difference between the groups during hysteroscopy. Postoperative pain levels were not reported.
-
Makris 2001 compared the use of 1 mL to 3 mL (30 to 90 mg) of 3% mepivacaine to saline when administered 3 minutes prior to hysteroscopy in 200 women. The study authors reported no evidence of difference between the groups, either during or after hysteroscopy.
-
Senturk 2016 compared intrauterine lidocaine versus placebo in 138 women. The authors reported that the NSAID was more effective than placebo, with lower median pain scores both during the procedure and during follow‐up.
-
Stigliano 1997 compared the use of 1 cm3 of 5% prilocaine cream and 10 mg of lidocaine spray versus no treatment in 345 women. Data were presented as percentages. The study authors reported significant evidence of benefit in pain levels in the cream group (compared to the no‐treatment group) during placement of the tenaculum and a benefit in both active intervention groups (compared to the no‐treatment group) during progression through the cervical canal and evaluation of the uterine cavity.
-
Van den Bosch 2011 compared lignocaine gel versus placebo gel in 142 women, and reported no evidence of a difference in procedure‐related pain
-
Zupi 1995 compared 5 mL of 2% mepivacaine to saline transcervically and the authors reported no significant evidence of a difference between the groups during the procedure, however a significant benefit was found in the mepivacaine groups 30 minutes after the procedure.
1.2 NSAID versus placebo or no treatment
We identified three RCTs for this comparison (Hassan 2016a; Tam 2001; Teran‐Alonso 2014). Tam 2001 included 181 women, Teran‐Alonso 2014 included 200 women and Hassan 2016a included 140 women. Teran‐Alonso 2014 used 1 g of paracetamol in conjunction with the NSAID.
1.2.1. Primary outcome: pain score
Pain score during the procedure
There was no clear evidence of a difference between the groups (SMD ‐0.18, 95% CI ‐0.35 to ‐0.00, 3 RCTs, 521 women, I2 = 81%, low‐quality evidence).
Pain score within 30 minutes of the procedure
Teran‐Alonso 2014 and Hassan 2016a reported this outcome. Pain scores were lower in the intervention group (SMD ‐0.25, 95% CI ‐0.46 to ‐0.04, 2 RCTs, 340 women, I2 = 29%, low‐quality evidence). This equates to a difference of up to 2 mm on a 0‐10 cm VAS, which is unlikely to be clinically significant.
Pain score more than 30 minutes after the procedure
Pain scores were significantly lower in the intervention group (SMD ‐0.27, 95% CI ‐0.49 to ‐0.05, 2 RCTs, 321 women, I2 = 78%, low‐quality evidence). This equates to a difference of up to 7 mm on a 0‐10 cm VAS, which is unlikely to be clinically significant.
1.2.2. Secondary outcome: failure to complete the procedure
This outcome was not reported.
1.2.3 Secondary outcome: adverse effects
There was insufficient evidence to determine whether there was a difference between the groups in the rate of vasovagal reactions (OR 0.76, 95% CI 0.20 to 2.94, 1 RCT, 181 women, very low‐quality evidence), non‐pelvic pain (OR 2.93, 95% CI 0.12 to 72.99, 1 RCT, 181 women, very low‐quality evidence) or allergic reactions (OR 2.93, 95% CI 0.12 to 72.99, 1 RCT, 181 women, very low‐quality evidence).
NSAID versus placebo: findings in studies without data suitable for analysis
-
Nagele 1997 compared the use of 500 mg mefenamic acid versus placebo in 95 women. The study authors reported that there was no clear evidence of a difference between the groups during hysteroscopy, but pain was significantly less in the intervention group at 60 minutes after the procedure.
-
Senturk 2016 compared rectal indomethacin versus placebo in 130 women. The authors reported that the NSAID was more effective than placebo, with lower median pain scores both during the procedure and during follow‐up.
1.3 Opioid versus placebo or no treatment
1.3.1. Primary outcome: pain score
Pain score during the procedure
We identified two RCTs (Hassan 2016a; Lin 2005) for this comparison. One RCT utilised oral tramadol and one utilised sublingual buprenorphine. Data on pain scores during the procedure were unsuitable for pooling due to inconsistency. Tramadol was associated with a benefit of up to 22 mm on a 0‐10 cm scale, which may possibly be clinically significant (SMD ‐0.76, 95% CI ‐1.10 to ‐0.42, 1 RCT, 140 women). However the effect estimate for this outcome for sublingual opioids did not support a benefit from the intervention (SMD 0.08, 95% CI ‐0.22 to 0.39, 164 women).
Pain score within 30 minutes of the procedure
Compared with placebo, the pain score during within 30 minutes of the procedure was lower in the tramadol group (SMD ‐0.57, 95% CI ‐0.91 to ‐0.23, 1 RCT, 140 women, low‐quality evidence), suggesting a difference of up to 17 mm on a 0‐10 cm scale, which may possibly be clinically significant.
Pain score more than 30 minutes after the procedure
There was no clear evidence of a difference between the tramadol and placebo groups at over 30 minutes (‐0.17, 95% CI ‐0.51 to 0.16, 1 RCT, 140 women, low‐quality evidence). Nausea and vomiting occurred in 39% of the buprenorphine group, and in none of the placebo group
1.3.2. Secondary outcome: failure to complete the procedure
Hassan 2016a reported this outcome. There were no events in the intervention group, but one woman in the placebo group failed to complete treatment due to pain (OR 0.33, 95% CI0.01 to 8.21, 1 RCT, 140 women)
1.3.3. Secondary outcome: adverse effects
Lin 2005 reported that 31/80 women in the intervention group experienced nausea and vomiting, while none of the placebo group did so (OR 107.55, 95% CI 6.44 to 1796.46, 1 RCT, 164 women).
Opioid versus placebo: findings in studies without data suitable for analysis
Hassan 2016b compared the use of oral tramadol versus placebo in 140 women. The authors reported lower levels of pain in the intervention group during the procedure, immediately afterwards and at follow‐up at 30 minutes. Data were reported as medians.
2. Analgesic versus any other analgesic
2.1 Local intracervical anaesthesia compared to combined intracervical and paracervical anaesthesia
2.1.1. Primary outcome: pain score
Pain score during the procedure
One RCT (Al‐Sunaidi 2007), including 84 women, demonstrated a significant benefit in the combined anaesthesia group, with higher pain scores in the group receiving intracervical anaesthesia only (SMD 4.27, 95% CI 3.49 to 5.06, very low‐quality evidence). This translates to a difference of up to 12 mm on a 10 cm VAS. This is unlikely to be clinically significant.
Pain score within 30 minutes of the procedure
There was evidence of beneficial effect of combined anaesthesia within the 30 minutes after the procedure, with higher pain scores in the group receiving intracervical anaesthesia only (SMD 1.55, 95% CI 1.06 to 2.05, 1 RCT, 84 women, very low‐quality evidence). This translates to a difference of up to 5 mm on a 10 cm VAS. This is unlikely to be clinically significant.
Pain score more than 30 minutes after the procedure
There was evidence of beneficial effect of combined anaesthesia over 30 minutes after the procedure with higher pain scores in the group receiving intracervical anaesthesia only (SMD 3.47, 95% CI 2.78 to 4.15, 1 RCT, 84 women, very low‐quality evidence). This translates to a difference of up to 8 mm on a 10 cm VAS. This is unlikely to be clinically significant.
2.1.2. Secondary outcome: failure to complete the procedure
Al‐Sunaidi 2007 reported failure to complete the procedure due to pain. There was insufficient evidence to determine whether there was a difference between the groups (OR 3.00, 95% CI 0.12 to 75.74, 85 women).
2.1.3. Secondary outcome: adverse effects
This outcome was not reported.
2.2 Local intracervical anaesthesia compared to combined intracervical, paracervical anaesthesia and local topical anaesthesia
2.2.1. Primary outcome: pain score
Pain score during the procedure
One RCT (Lukes 2015) including 37 women demonstrated no clear evidence of a difference between the groups in mean pain score during the procedure (SMD ‐0.54, 95% CI ‐1.20 to 0.12, very low‐quality evidence).
Pain score within 30 minutes of the procedure
This outcome was not reported.
Pain score more than 30 minutes after the procedure
This outcome was not reported.
2.2.2. Secondary outcome: failure to complete the procedure
This outcome was not reported.
2.2.3. Secondary outcome: adverse effects
This outcome was not reported.
2.3 Antispasmodic plus NSAID versus local paracervical anaesthesia
2.3.1. Primary outcome: pain score
Pain score during the procedure
One RCT (Sharma 2009) demonstrated a significantly higher mean pain score during the procedure with the use of drotaverine hydrochloride and mefenamic acid in comparison to paracervical block (SMD ‐1.40, 95% CI ‐1.90 to ‐0.91, 80 women, very low‐quality evidence). This translates to a difference of up to 23 mm on a 10 cm VAS, which may be be clinically significant.
Pain score within 30 minutes of the procedure
This outcome was not reported.
Pain score more than 30 minutes after the procedure
There was a significant reduction in the mean pain score more than 30 minutes after the procedure with the use of drotaverine hydrochloride and mefenamic acid in comparison to paracervical block (SMD ‐0.87, 95% CI ‐1.33 to ‐0.41). This translates to a difference of up to 11 mm on a 10 cm VAS. This may not be clinically significant.
Secondary outcomes
2.3.2. Secondary outcome: failure to complete the procedure
This outcome was not reported.
2.3.3. Secondary outcome: adverse effects
This outcome was not reported.
2.4 Opioid versus NSAID
Hassan 2016a compared 100 mg of oral tramadol versus 200 mg of oral celecoxib Analysis 7.1.
2.4.1. Primary outcome: pain score
Pain score during the procedure
There was no clear evidence of a difference between the groups (SMD ‐0.15, 95% CI ‐0.48 to 0.18, 1 RCT, 140 women).
Pain score within 30 minutes of the procedure
There was no clear evidence of a difference between the groups (SMD ‐0.25, 95% CI ‐0.58 to 0.08, 1 RCT, 140 women).
Pain score more than 30 minutes after the procedure
There was no clear evidence of a difference between the groups (SMD ‐0.17, 95% CI ‐0.51 to 0.16, 1 RCT, 140 women).
2.4.2. Secondary outcomes: failure to complete the procedure
This outcome was not reported.
2.4.3. Secondary outcomes: adverse effects
There was insufficient evidence to determine whether there was a difference between the groups in rates of nausea and vomiting. There were only four events, all in the opioid group (OR 9.54, 95% CI 0.50, to180.64, 1 RCT, 140 women) Analysis 7.2.
Analgesic versus any other analgesic: findings in studies without data suitable for analysis
Six studies made comparisons between different types of analgesics and reported data unsuitable for analysis, as follows.
-
Finikiotis 1992 compared paracervical block versus uterosacral block. The study authors reported no clear evidence of a difference in pain during the procedure between the use of 20 mL of 1% lignocaine for paracervical block and 2 mL of 2% lignocaine for a uterosacral block, in 120 women. The study grouped results into three categories depending on severity of pain so we could not obtain the mean pain scores; therefore we could not include this study in the meta‐analysis.
-
Kabli 2008 compared local cervical anaesthesia (2 mL of 1% lignocaine) versus combined cervical and intrauterine anaesthesia (8 mL of lidocaine in 250 mL of saline) in 78 women. The study authors reported that there was no clear evidence of a difference between the groups in median pain scores either during the procedure or within 30 or 60 minutes after. We could not calculate the results as mean pain score.
-
Mercorio 2002 compared NSAID versus intracervical anaesthetic (oral dexketoprofen versus intracervical block) in 298 women. The study authors reported no clear evidence of a difference between the groups in mean pain scores during hysteroscopy.
-
Mohammadi 2015 compared rectal diclofenac versus intrauterine lidocaine (100 mg of rectal diclofenac versus 5 mL of 2% intrauterine lidocaine). The study authors reported no clear evidence of a difference between the groups in pain score measured during visualisation of uterine cavity (P = 0.500). The mean pain score was significantly lower during insertion and extrusion of the hysteroscope in the diclofenac group (P = 0.001 and P = 0.030, respectively).
-
Senturk 2016 compared a rectal NSAID (indomethacin) versus intrauterine lidocaine in 138 women. The study authors reported that median pain scores were lower in the lidocaine group, both during the procedure and 10 minutes afterwards.
-
Stigliano 1997 compared the use of 1 cm3 of 5% prilocaine cream and 10 mg of lidocaine spray in 180 women. They presented data as percentages. The study authors reported significant evidence of benefit in pain levels in the cream group (compared to the spray group) during placement of the tenaculum. There was no clear evidence of a difference between the intervention groups in pain levels during progression through the cervical canal and evaluation of the uterine cavity.
Other analyses
Sensitivity analyses
Our main findings were not substantially changed when we used a random‐effects model, or when we calculated risk ratios for dichotomous outcomes.
We were unable to conduct our planned sensitivity analysis by risk of bias, as none of the included studies were deemed to be at low risk of bias overall.
Funnel plot
We constructed a funnel plot for analysis 1.1. It did not show any strong suggestion of publication bias (Figure 5).
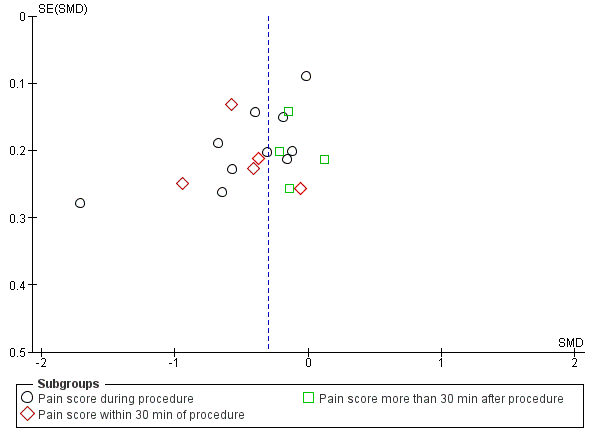
Funnel plot of comparison local anaesthetic versus placebo or no treatment, outcome: pain score
Discussion
Summary of main results
Our review has shown a beneficial effect of using local anaesthetic compared to placebo during hysteroscopy, within 30 minutes of the procedure and more than 30 minutes after the procedure. However, while this effect is statistically significant, it is too minimal to be clinically significant. There was some evidence of benefit for the use of oral analgesics, both opioids and NSAIDs, but findings were inconsistent and evidence was poor quality. The study of sublingual opioid reported a high rate of nausea and vomiting in the intervention group. Data on other adverse events were scanty and inconclusive.
Local anaesthetics were associated with a lower rate of failure to complete the procedure due to pain, but data on failure to proceed due to cervical stenosis did not clearly show a difference.
Overall completeness and applicability of evidence
Measurement of pain
Measurement of pain is predominantly subjective and dependent on independent variables such as prior experience of the procedure and level of anxiety, the majority of which are not reported in studies (De Iaco 2000).
The studies included in the review used several validated scales for the measurement of pain, which may influence the accuracy of the outcome, as complexity of the rating task for the measure influences the sensitivity and specificity (Jensen 2002).
Baseline pain scores were relatively low in all groups and pain experienced during hysteroscopy was mild to moderate across all the studies included within the review. Thus the clinical importance of an intervention is difficult to interpret. However, we have translated results to a commonly used visual analogue scale.
Essentially there are many factors that contribute towards pain during outpatient hysteroscopy. Factors such as indication for hysteroscopy, menopausal status of the woman, diameter of the scope, use of distension media and use of a speculum will all have an impact on perception of pain in women undergoing this procedure. This may explain the heterogeneity between the studies too. Furthermore, seven out of 19 studies gave additional pain medications (as mentioned under 'other potential sources of bias'). This may have introduced further heterogeneity.
There were too few studies to combine participants according to menopausal status, indication for hysteroscopy or whether women were nulliparous or multiparous. However, we ensured that any confounding caused by procedural factors would have been eradicated because all studies were RCTs.
Effective pain relief from local anaesthesia is dependent on various factors, including route of administration, concentration and classification of drug, and sufficient time interval between the administration of the analgesic and start of the procedure. The studies investigated various methods of administration of local anaesthesia, including paracervical block, intracervical anaesthesia, intrauterine anaesthesia, and topical anaesthesia in gel and spray forms. This review was unable to establish the most effective method of administration of local anaesthetic, as demonstrated by the subgroup analysis. These factors differed between the studies. With regards to current practice there is no unanimous decision as to what pain relief should be used for an outpatient hysteroscopy procedure. Therefore, we cannot comment on whether our review supports current practice.
Time interval between administration and start of the procedure
The five RCTs using paracervical block as an intervention for pain relief during hysteroscopy reported different time intervals between the administration of anaesthesia and the start of the procedure. In the only RCT showing significant beneficial effect the authors allowed 10 minutes between the administration of the drug and start of the procedure. While using a higher concentration of the drug (mepivacaine), this was in contrast to the other four studies, which failed to show any benefit using lower concentrations and shorter time intervals. The studies that supported the use of paracervical anaesthesia were restricted to postmenopausal women. This group tends to have a higher incidence of cervical atrophy and stenosis, and may experience more pain during the procedure thereby demonstrating a greater contrast between the placebo and anaesthetised subgroups.
Deep nerve endings in the myometrium, cervical stroma, and visceral peritoneum may be insufficiently blocked at five minutes after administration; this may explain the beneficial effect found in studies allowing a longer time interval between administration of anaesthetic and start of the procedure (Owens 1985). Two studies included in the meta‐analysis suggested that paracervical block may well decrease the pain caused by cervical manipulation but is unable to affect the pain due to uterine distension.
Route of administration
Subgroup analysis failed to demonstrate an optimal route of administration of local anaesthetics for pain relief during and after hysteroscopy.
Different dosages used between studies investigating the use of local anaesthetics are outlined in Table 1.
Dilatation of the cervix and uterine distension account for the pain during hysteroscopy. The sensory nerve supply to the uterus is derived from two pathways; the Frankenhauser’s plexus (parasympathetic S2 to S4) supplies the cervix and the lower portion of the uterus, while the uterine fundus receives sympathetic nerve supply via the infundibulo‐pelvic ligament from the ovarian plexus. Lau 2000 argued that paracervical anaesthesia blocks the pain arising from the cervix and fails to block the pain arising from uterine distension. Anatomically, sensory innervation of the pelvic organs is from the superior hypogastric plexus or pre‐sacral nerve, pelvic nerves, and ovarian plexus. Sensory fibres from the upper part of the vagina, uterus, proximal portion of the tubes, bladder, urethra, and rectum run through the paracervical tissue and within the uterosacral folds and meet in the hypogastric and pelvic nerves. Thus, on the basis of the above anatomical observations, paracervical block should block not only cervical but uterine pain (Bonica 1990; Rapkin 1990). This confirms the positive results observed by Cicinelli 1998.
The failure of four RCTs to demonstrate a beneficial effect of the use of intrauterine local anaesthetic may be attributed to bypassing the sensory fibres located in the paracervical tissues and uterosacral ligaments and thus being unable to inhibit cervical pain. However, this hypothesis fails to explain the results of one RCT that found a beneficial effect with the use of intrauterine anaesthetic (Costello 1998).
Mohammadi 2015 demonstrated that while there was insufficient evidence of differences between the study group of women with regard to the mean pain score during visualisation of uterine cavity (P = 0.500), the mean pain score was significantly lower during insertion and extrusion of the hysteroscope in the diclofenac group (P = 0.001 and P = 0.030, respectively) compared to intrauterine lidocaine. This correlates with another study (Sharma 2009), which showed that in women undergoing hysteroscopy with or without biopsy there was significant reduction in mean pain score with the use of oral NSAID (mefenamic acid) compared to paracervical block and intravenous sedation.
Lignocaine sprays, gels, and creams provide anaesthesia to superficial pain receptors, advantages being painless application and a decreased rate of infection in comparison to anaesthetic blocks (Soriano 2000). Lignocaine spray was found to beneficial in comparison with lignocaine gel. However, hysteroscopy was performed immediately after application of the gel (Wong 2000). This may not have allowed sufficient time for the effect of the anaesthesia. The use of spray may allow more consistent application under a pressurised environment in comparison to a gel applied with gauze. Stigliano 1997 demonstrated significant pain relief compared to lignocaine spray and placebo, however, the cream was applied 10 minutes prior to the start of the procedure and the spray was administered immediately prior to the start of the procedure.
Use of oral analgesics
Delayed pain may be attributed to the release of prostaglandins from cervical manipulation and uterine distension; therefore, the use of a prostaglandin‐synthetase inhibitor would seem a logical intervention for pain relief after rather than during the procedure. Mean peak plasma concentrations of 3.8 µmol/L are attained after 20 minutes to 60 minutes from ingestion of one tablet of 50 mg of diclofenac (New Zealand Medicines Safety Authority 2007). An NSAID administered two hours prior to hysteroscopy will have its peak analgesic effect before the completion of the procedure, thus having a suboptimal effect on delayed pain. Differences in the time interval between administration (one to two hours) and start of the procedures in the studies of NSAIDs may account for the inconsistency in their results.
Although buprenorphine is an opioid 35 times more potent than morphine, no benefit was noted when compared with placebo. This was in contrast to the relative effectiveness of the other opioid used, oral tramadol. It is possible that the lack of effectiveness of buprenorphine relates to the opioid being given 40 minutes before the procedure, as the peak pain relief due to this drug appears to occur between one and two hours after sublingual administration of buprenorphine (Dobkin 1977). A high incidence of nausea and drowsiness limits its use in the outpatient setting.
There was a significant reduction in pain during and after the procedure with the use of drotaverine hydrochloride and mefenamic acid in comparison with paracervical block. Mefenamic acid is a NSAID that acts as a potent inhibitor of prostaglandin synthesis, and has a peak plasma concentration between two and four hours following administration (Foye 2007). Drotaverine hydrochloride is an anti‐spasmodic agent and selective phosphodiesterase inhibitor, with a peak plasma concentration at one hour (Blasko 1998); which may account for the combined analgesic effect both during and after hysteroscopy. However, a wide variation in the bioavailability of drotaverine hydrochloride has been demonstrated following oral administration and individual response may therefore be variable (Bolaji 1996).
Quality of the evidence
Most studies were at unclear or high risk of bias in most of the domains assessed. The evidence was low or very low quality, mainly due to risk of bias and imprecision. (See Figure 1 , Figure 2 and summary of findings Table for the main comparison, summary of findings Table 2; summary of findings Table 3; summary of findings Table 4; summary of findings Table 5).
A major limitation in our review is the failure of many of the included studies to report data suitable for analysis. Thirteen studies included in the review could not be included within the meta‐analysis due to limitations in presentation and conversion of data. Most of those studies reported no improvement in the mean pain scores with the use of analgesics, and we acknowledge that their inclusion in our meta‐analysis could influence the results. We converted continuous data that recorded mean pain scores into dichotomous data in two studies without opportunity to interpret data as mean pain scores (Broadbent 1992; Finikiotis 1992). Clark 1996 used a 4‐point descriptive scale and converted data into two outcomes. Stigliano 1997 used a 4‐point descriptive scale, and also measured the pain experienced during hysteroscopy, as well as shoulder pain, 10 minutes after the procedure using a 4‐point scale. The data were presented in graphical form in four studies and could not be converted into mean pain scores. All studies included within the review reported data collected at all stated time points. Correspondence with the study authors did not produce any additional data.
An element of under reporting has been demonstrated, especially where specific P values and standard deviations were not stated, and this must be considered when interpreting the results.
There was no significant difference in any of the studies for the use of co‐interventions between the placebo and control groups. However, we made no adjustment for potential differences between groups.
Potential biases in the review process
We did not identify any potential biases in the review process, apart from the limitation that we were unable to obtain additional data from study authors.
Agreements and disagreements with other studies or reviews
A recent systematic review (Del Valle 2016) analyzed 33 studies, 17 of which were RCTs. This review claimed the effectiveness of the different methods used to decrease pain perception during office hysteroscopy shows that injectable local anaesthetics, particularly paracervical infiltration, is the most effective form of analgesia. Other local anaesthetics via topical or intrauterine route seem to be ineffective. This review indicates that further studies are required to investigate the effect of NSAIDs, misoprostol, topical anaesthesia and nitrous oxide. However, this review is greatly limited due to the heterogeneity of studies included.
A systematic review in 2010 analysing the use of local anaesthesia in outpatient hysteroscopy concluded that paracervical local anaesthetic injection is superior to other methods of local anaesthesia. However, this review did not include studies analysing oral analgesia as a method of pain relief and did not include studies providing data in forms other than mean pain scores. Data were not translated into a commonly used scale (Cooper 2010).
Meta‐analysis revealed a beneficial effect of the use of local anaesthetics for hysteroscopy but not for hysterosalpingography (HSG) in another review (Ahmad 2011). This effect may be due to the fact that more RCTs were identified investigating the role of local anaesthetics in hysteroscopy. Moreover, there is evidence to suggest that higher intrauterine pressure is required in HSG, resulting in the procedure being more painful than hysteroscopy. The median intrauterine perfusion pressure that will produce spill from the fallopian tubes into the peritoneal cavity is 100 mm Hg, with no spill occurring at pressures less than 70 mm Hg. This is in comparison to hysteroscopy where pressures of up to 40 mm Hg are considered adequate to distend the uterus (Baker 1995; Baker 1998).

Methodological quality graph: review authors' judgements about each methodological quality item presented as percentages across all included studies

Methodological quality summary: review authors' judgements about each methodological quality item for each included study

Study flow diagram

Forest plot of comparison: 1 Local anaesthetic versus placebo or no treatment, outcome: 1.1 Pain score.

Funnel plot of comparison local anaesthetic versus placebo or no treatment, outcome: pain score

Comparison 1 Local anaesthetic versus placebo or no treatment, Outcome 1 Pain score.

Comparison 1 Local anaesthetic versus placebo or no treatment, Outcome 2 Failure to complete procedure.

Comparison 1 Local anaesthetic versus placebo or no treatment, Outcome 3 Adverse events.

Comparison 2 Oral NSAID versus placebo or no treatment, Outcome 1 Pain score.
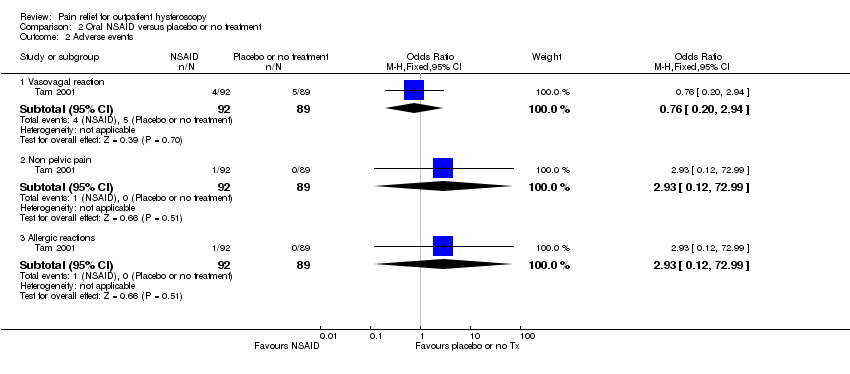
Comparison 2 Oral NSAID versus placebo or no treatment, Outcome 2 Adverse events.

Comparison 3 Opioid versus placebo or no treatment, Outcome 1 Pain score.

Comparison 3 Opioid versus placebo or no treatment, Outcome 2 Failure to complete procedure (due to pain).

Comparison 3 Opioid versus placebo or no treatment, Outcome 3 Adverse effects.

Comparison 4 Local intracervical anaesthesia versus combined intracervical and paracervical anaesthesia, Outcome 1 Pain score.

Comparison 4 Local intracervical anaesthesia versus combined intracervical and paracervical anaesthesia, Outcome 2 Failure to complete procedure.

Comparison 5 Local intracervical anaesthesia versus combined intracervical, paracervical and topical anaesthesia, Outcome 1 Pain score.

Comparison 6 Antispasmodic + NSAID versus local paracervical anaesthesia, Outcome 1 Pain score.

Comparison 7 Opioid versus NSAID, Outcome 1 Pain score.

Comparison 7 Opioid versus NSAID, Outcome 2 Adverse effects.
| Local anaesthetic compared to placebo or no treatment for outpatient hysteroscopy | ||||||
| Population: women undergoing outpatient hysteroscopy | ||||||
| Outcomes | Anticipated absolute effects* (95% CI) | Relative effect | № of participants | Quality of the evidence | Comments | |
| Risk with placebo or no treatment | Risk with local anaesthetic | |||||
| Pain score during procedure | The mean pain score ranged from 0.86 to 4.3 on a 0‐10 cm VAS | SMD 0.29 SD lower | ‐ | 1496 | ⊕⊕⊝⊝ | This suggests a marginally lower pain score in the intervention group, equating to up to 7 mm on a 0‐10 cm point VAS. This is unlikely to be clinically significant |
| Pain score within 30 min of procedure | The mean pain score ranged from 1.8 to 6.3 on a 0‐10 cm VAS | SMD 0.5 SD lower | ‐ | 545 | ⊕⊕⊝⊝ | This suggests a marginally lower pain score in the intervention group, equating to up to 13 mm on a 0‐10 cm point VAS. This is unlikely to be clinically significant |
| Pain score more than 30 min after procedure | The mean pain score ranged from 0.62 to 1.8 on a 0‐10 cm VAS | SMD 0.11 SD lower | ‐ | 450 | ⊕⊕⊝⊝ | There was no clear evidence of a difference between the groups. |
| Vasovagal reaction | 63 per 1000 | 45 per 1000 | OR 0.70 | 1309 | ⊕⊝⊝⊝ | There was no clear evidence of a difference between the groups |
| Non‐pelvic pain | 100 per 1000 | 164 per 1000 | OR 1.76 | 99 | ⊕⊝⊝⊝ | There was insufficient evidence to determine whether there is a difference between the groups |
| *The risk in the intervention group (and its 95% confidence interval) is based on the mean risk in the comparison group and the relative effect of the intervention (and its 95% CI). | ||||||
| GRADE Working Group grades of evidence | ||||||
| 1Downgraded two levels for serious risk of bias: none of the studies adequately described methods of allocation concealment and methods of blinding were unclear or inadequate in many studies. | ||||||
| Oral NSAID compared to placebo or no treatment for outpatient hysteroscopy | ||||||
| Population: women undergoing outpatient hysteroscopy | ||||||
| Outcomes | Anticipated absolute effects* (95% CI) | Relative effect | № of participants | Quality of the evidence | Comments | |
| Risk with placebo or no treatment | Risk with oral NSAID | |||||
| Pain score during procedure | The mean pain score ranged from 2.1 to 5.92 on a 0‐10 cm VAS | SMD 0.18 lower (0.35 lower to 0.00) | ‐ | 521 | ⊕⊕⊝⊝ | There was no clear evidence of a difference between the groups |
| Pain score within 30 min of procedure | The mean pain score ranged from 0.65 to 2.02 on a 0‐10 cm VAS | SMD 0.25 SD lower | ‐ | 340 participants | ⊕⊕⊝⊝ | The evidence suggests a benefit in the NSAID group, equivalent to up to 2 mm on a 0‐10 cm VAS. This is unlikely to be clinically significant |
| Pain score more than 30 min after procedure | The mean pain score ranged from 1.2 to 1.55 on a 0‐10 cm VAS | SMD 0.27 lower | ‐ | 321 | ⊕⊕⊝⊝ | The evidence suggests a benefit in the NSAID group, equivalent to up to 7mm on a 0‐10 cm VAS. This is unlikely to be clinically significant |
| Vasovagal reaction | 56 per 1,000 | 43 per 1,000 | OR 0.76 | 181 participants | ⊕⊕⊝⊝ | Only 9 events There was insufficient evidence to determine whether there is a difference between the groups |
| Non pelvic pain | Not calculable: no events in one group | OR 2.93 | 181 participants | ⊕⊕⊝⊝ | Only 1 event There was insufficient evidence to determine whether there is a difference between the groups | |
| Allergic reaction | Not calculable: no events in one group | OR 2.93 | 181 participants | ⊕⊕⊝⊝ | Only 1 event There was insufficient evidence to determine whether there is a difference between the groups | |
| *The risk in the intervention group (and its 95% confidence interval) is based on the mean risk in the comparison group and the relative effect of the intervention (and its 95% CI). | ||||||
| GRADE Working Group grades of evidence | ||||||
| 1Downgraded one level due to serious risk of bias: none of the studies adequately described methods of allocation concealment. | ||||||
| Opioid compared to placebo or no treatment for outpatient hysteroscopy | ||||||
| Population: women undergoing outpatient hysteroscopy | ||||||
| Outcomes | Anticipated absolute effects* (95% CI) | Relative effect | № of participants | Quality of the evidence | Comments | |
| Risk with placebo or no treatment | Risk with opioid | |||||
| Pain score during procedure: oral opioid | The mean pain score was 5.92 mm on a 0‐10 cm VAS | Oral opioid: SMD was 0.76 lower (95% CI 1.10 lower to 0.42 lower) | ‐ | 140 (1 study) | low1,2 | Data from the two studies were unsuitable for pooling due to extreme heterogeneity (I2 = 92%) with conflicting directions of effect. There is a suggestion of benefit from oral opioid, equating to a difference of up to 22 mm on a 0‐10 cm VAS. This may possibly be clinically significant |
| Pain score during procedure: sublingual opioid | The mean pain score was from 3.2 mm on a 0‐10 cm VAS | Sublingual opioid: SMD was 0.08 higher (95% CI 0.22 lower to 0.39 higher) | 164 (1 study) | low1,2 | ||
| Pain score within 30 min of procedure oral opioid | The mean pain score was 3.27 mm on a 0‐10 cm VAS | SMD ‐0.57 lower | ‐ | 140 | low1,2 | There is a suggestion of benefit from oral opioid, equating to a difference of up to 17 mm on a 0‐10 cm VAS. This may possibly be clinically significant |
| Pain score more than 30 min after procedure oral opioid | The mean pain score was 0.77 on a 0‐10 cm VAS | SMD 0.17 lower | ‐ | 140 | very low1,2,3 | |
| Nausea and vomiting sublingual opioid | Not calculable as all 31 events were in the opioid group and none in the placebo group | OR 107.55 (6.44 to 1796.46) | 164 | low1 | There were 4 events in the intervention group of the oral opioid study, but events in the placebo group were not reported | |
| *The risk in the intervention group (and its 95% confidence interval) is based on the mean risk in the comparison group and the relative effect of the intervention (and its 95% CI). | ||||||
| GRADE Working Group grades of evidence | ||||||
| 1Downgraded one level for serious risk of bias: method of allocation concealment or blinding, or both, not described. | ||||||
| Intracervical versus combined intracervical and paracervical anaesthesia | ||||||
| Population: women undergoing outpatient hysteroscopy | ||||||
| Outcomes | Anticipated absolute effects* (95% CI) | Relative effect | No of participants | Quality of the evidence | Comments | |
| Risk with combined intracervical and paracervical anaesthesia | Risk with local intracervical anaesthesia | |||||
| Pain score during procedure | The mean pain score was 2.1 (SD 0.2) on a 0‐10 cm VAS | SMD 4.27 SD higher (3.49 higher to 5.06 higher) | ‐ | 84 participants | ⊕⊝⊝⊝ | This suggests a significant benefit from combined anaesthesia, equating to up to 12 mm on a 0‐10 cm point VAS. This is unlikely to be be clinically significant |
| Pain score within 30 minutes of the procedure | The mean pain score was 1.5 (SD 0.3) on a 0‐10 cm VAS | (SMD 1.55, 95% CI 1.06 higher to 2.05 higher) | ‐ | 84 participants (1 study) | ⊕⊝⊝⊝ | This suggests a significant benefit from combined anaesthesia, equating to up to 5 mm on a 0‐10 cm point VAS. This is unlikely to be clinically significant |
| Pain score more than 30 minutes of the procedure | The mean pain score was 1 (SD 0.2) on a 0‐10 cm VAS | (SMD 3.47, 95% CI 2.78 higher to 4.15 higher) | ‐ | 84 participants (1 study) | ⊕⊝⊝⊝ | This suggests a significant benefit from combined anaesthesia, equating to up to 8 mm on a 0‐10 cm point VAS. This is unlikely to be clinically significant |
| Adverse effects | No data available | |||||
| *The risk in the intervention group (and its 95% confidence interval) is based on the mean risk in the comparison group and the relative effect of the intervention (and its 95% CI). CI: confidence interval; SMD: standardised mean difference; SD: standard deviation; VAS: visual analogue scale | ||||||
| GRADE Working Group grades of evidence | ||||||
| 1Downgraded two levels for very serious risk of bias: allocation concealment not described, participants not blinded. | ||||||
| Antispasmodic plus NSAID versus paracervical anaesthesia | ||||||
| Population: women undergoing outpatient hysteroscopy | ||||||
| Outcomes | Illustrative comparative risks* (95% CI) | Relative effect | No of participants | Quality of the evidence | Comments | |
| Paracervical anaesthesia | Antispasmodic plus NSAID | |||||
| Pain score during procedure | The mean pain score was 5.93 (SD ‐1.26) on a 0‐10 cm VAS | SMD 1.40 SD lower (1.90 lower to 0.91 lower) | ‐ | 80 | ⊕⊝⊝⊝ | This suggests a beneficial effect in the drotaverine hydrochloride and mefenamic acid group, equating to up to 23 mm on a 0‐10 cm point VAS. This may possibly be clinically significant |
| Pain score within 30 minutes of the procedure | This outcome was not reported | |||||
| Pain score more than 30 minutes after the procedure | The mean pain score was 2.53 (SD ‐0.81) on a 0‐10 cm VAS | SMD 0.87 SD lower | ‐ | 80 | ⊕⊝⊝⊝ | This suggests a beneficial effect in the drotaverine hydrochloride and mefenamic acid group, equating toup to11mm on a 0‐10 cm point VAS. This is unlikely to be clinically significant. |
| Adverse effects | This outcome was not reported | |||||
| *The risk in the intervention group (and its 95% confidence interval) is based on the mean risk in the comparison group and the relative effect of the intervention (and its 95% CI). CI: confidence interval; SMD: standardised mean difference; SD: standard deviation; VAS: visual analogue scale | ||||||
| GRADE Working Group grades of evidence | ||||||
| 1Downgraded two levels for very serious risk of bias: methods of allocation concealment not described, not blinded. | ||||||
| Study | Route | Dose |
| Intracervical versus intra and paracervical | Local intracervical anaesthesia compared to combined intracervical and paracervical anaesthesia. 0.5% bupivacaine hydrochloride into anterior wall of cervix compared to 0.5% bupivacaine hydrochloride into anterior wall of cervix plus bupivacaine into lateral vaginal fornix at 3 and 9 o’clock at 10 mm depth | |
| Endocervical topical cream | 3 mL of EMLA cream 5% or 3 mL ultrasound gel applied in the endocervical canal 10 min before surgery with 5 mL needleless syringe via speculum. A subsequent application of either gel was made with a swab at ectocervix level during vaginoscopic approach | |
| Intracervical | Intracervical injection of 10 mL of lignocaine 1% with 1:200 000 adrenaline or normal saline was injected into the cervix at 1, 5, 7, and 11 o’clock | |
| Transcervical | 2 mL of 2% mepivacaine or 2 mL of 0.9% saline injected trans cervically (inserted up the cervical canal to the internal os) | |
| Paracervical | 10 mL of 1.5% mepivacaine or saline injected into junction of cervix and vagina (4 and 8 o'clock positions) | |
| Topical spray | 10 mL of 2% lignocaine gel, placebo gel or no gel administered into cervical canal. Some women received intracervical lignocaine block if determined to need cervical dilatation | |
| Intrauterine | 5 mL of 2% lignocaine or 5 mL or 0.9% saline injected into cervical canal and uterine cavity via hysteroscope | |
| Intracervical | Intracervical application at 1, 5, 7 and 11 o'clock positions of 4 x 2 mL ampoules of 2% lidocaine hydrochloride ampoules or saline | |
| Paracervical versus uterosacral | 20 mL of 1% lignocaine paracervical block or 2 mL of 2% lignocaine uterosacral block | |
| Paracervical | 20 mL of 1% mepivacaine injected paracervically at 3, 5, 7 and 9 o'clock position of the junction of cervix and vagina at least 5 min before the procedure | |
| Intracervical versus intracervical and intrauterine | 2 mL of 1% lidocaine into anterior wall. Distension medium of either saline only or 18 mL of lidocaine in 250 mL of saline | |
| Intracervical | Intracervical local anaesthesia (10 mL of 1% prilocaine) was applied at the 4 and | |
| Paracervical | Paracervical block at 3, 5, 7 and 9 o'clock positions of 10 mL of 2% lignocaine or saline, 5 min prior to procedure | |
| Transcervical | Transcervical intrauterine instillation of 5 mL of 2% lignocaine or normal saline into the uterine cavity 5 min before procedure | |
| Para/intracervical versus intracervical only anaesthetic block | The para/intracervical group received a total of 37 cc of anaesthesia injected at 6 different sites. 2‐3 min prior to the injection, topical 1% lidocaine was applied to the cervix in this group. The intracervical group received a total of 22 cc of anaesthetic given at 3 different injection sites | |
| Intracervical | 1 mL to 3 mL (30 to 90 mg) of mepivacaine 3% or saline administered intracervically 3 min prior to procedure | |
| Intracervical versus NSAID | 5 mL mepivacaine 2% intracervically up to the level of the internal os or one tablet of dexketoprofen given 1 h before the procedure | |
| Transcervical intrauterine lidocaine instillation versus rectal diclofenac | 5 mL of 2% lidocaine or the same volume of saline was instilled through the endocervix into the uterine cavity with an 18‐gauge angiocatheter 3 min prior to the procedure | |
| Intracervical | The second group was administered with a 1000 mL distention medium containing 18 mL lidocaine per 250 mL (Jetokain ampoule 20 mg 2% Adeka, Samsun, Turkey) | |
| Topical spray | 30 mg (3 metered doses) of lignocaine or placebo sprayed onto surface of cervix and cervical canal through 360° 5 min prior to procedure | |
| Topical cream versus topical spray | 1 cm3 of 5% prilocaine cream onto esocervix and 2 cm3 inserted 3 cm into cervical canal 10 min before procedure or 20 mg of lidocaine spray directed onto esocervix and 20 mg 3 cm into cervical canal immediately before procedure or no intervention | |
| Intrauterine | Unspecified volume of Instillagel (contains 2% lidocaine) or Endosgel (does not contain local anaesthetic) warmed to 37°C and instilled via a 2 mm neonatal suction catheter as part of sonography procedure 30 min prior to hysteroscopy | |
| Paracervical | Paracervical block at 3, 5, 7 and 9 o'clock positions of 10 mL 1% mepivacaine 5 min before procedure or no intervention given | |
| Topical gel | 4 mL of 2% lignocaine or placebo gel applied onto cervix before procedure | |
| Intrauterine | 5 mL of 2% mepivacaine or 5 mL of saline intrauterine via 3 mm catheter | |
| NSAID: nonsteroidal anti‐inflammatory drug | ||
| Outcome or subgroup title | No. of studies | No. of participants | Statistical method | Effect size |
| 1 Pain score Show forest plot | 12 | Std. Mean Difference (IV, Fixed, 95% CI) | Subtotals only | |
| 1.1 Pain score during procedure | 10 | 1496 | Std. Mean Difference (IV, Fixed, 95% CI) | ‐0.29 [‐0.39, ‐0.19] |
| 1.2 Pain score within 30 min of procedure | 5 | 545 | Std. Mean Difference (IV, Fixed, 95% CI) | ‐0.50 [‐0.67, ‐0.33] |
| 1.3 Pain score more than 30 min after procedure | 4 | 450 | Std. Mean Difference (IV, Fixed, 95% CI) | ‐0.11 [‐0.30, 0.07] |
| 2 Failure to complete procedure Show forest plot | 7 | Odds Ratio (M‐H, Fixed, 95% CI) | Subtotals only | |
| 2.1 Cervical stenosis | 6 | 805 | Odds Ratio (M‐H, Fixed, 95% CI) | 1.23 [0.62, 2.43] |
| 2.2 Pain | 2 | 330 | Odds Ratio (M‐H, Fixed, 95% CI) | 0.29 [0.12, 0.69] |
| 3 Adverse events Show forest plot | 8 | Odds Ratio (M‐H, Fixed, 95% CI) | Subtotals only | |
| 3.1 Vasovagal reaction | 8 | 1309 | Odds Ratio (M‐H, Fixed, 95% CI) | 0.70 [0.43, 1.13] |
| 3.2 Non‐pelvic pain | 1 | 99 | Odds Ratio (M‐H, Fixed, 95% CI) | 1.76 [0.53, 5.80] |
| Outcome or subgroup title | No. of studies | No. of participants | Statistical method | Effect size |
| 1 Pain score Show forest plot | 3 | Std. Mean Difference (IV, Fixed, 95% CI) | Subtotals only | |
| 1.1 Pain score during procedure | 3 | 521 | Std. Mean Difference (IV, Fixed, 95% CI) | ‐0.18 [‐0.35, ‐0.00] |
| 1.2 Pain score within 30 min of procedure | 2 | 340 | Std. Mean Difference (IV, Fixed, 95% CI) | ‐0.25 [‐0.46, ‐0.04] |
| 1.3 Pain score more than 30 min after procedure | 2 | 321 | Std. Mean Difference (IV, Fixed, 95% CI) | ‐0.27 [‐0.49, ‐0.05] |
| 2 Adverse events Show forest plot | 1 | Odds Ratio (M‐H, Fixed, 95% CI) | Subtotals only | |
| 2.1 Vasovagal reaction | 1 | 181 | Odds Ratio (M‐H, Fixed, 95% CI) | 0.76 [0.20, 2.94] |
| 2.2 Non pelvic pain | 1 | 181 | Odds Ratio (M‐H, Fixed, 95% CI) | 2.93 [0.12, 72.99] |
| 2.3 Allergic reactions | 1 | 181 | Odds Ratio (M‐H, Fixed, 95% CI) | 2.93 [0.12, 72.99] |
| Outcome or subgroup title | No. of studies | No. of participants | Statistical method | Effect size |
| 1 Pain score Show forest plot | 2 | Std. Mean Difference (IV, Fixed, 95% CI) | Totals not selected | |
| 1.1 Pain score during procedure | 2 | Std. Mean Difference (IV, Fixed, 95% CI) | 0.0 [0.0, 0.0] | |
| 1.2 Pain score within 30 min of procedure | 1 | Std. Mean Difference (IV, Fixed, 95% CI) | 0.0 [0.0, 0.0] | |
| 1.3 Pain score more than 30 min after procedure | 1 | Std. Mean Difference (IV, Fixed, 95% CI) | 0.0 [0.0, 0.0] | |
| 2 Failure to complete procedure (due to pain) Show forest plot | 1 | 140 | Odds Ratio (M‐H, Fixed, 95% CI) | 0.33 [0.01, 8.21] |
| 3 Adverse effects Show forest plot | 1 | 164 | Odds Ratio (M‐H, Fixed, 95% CI) | 107.55 [6.44, 1796.46] |
| 3.1 Nausea and vomiting | 1 | 164 | Odds Ratio (M‐H, Fixed, 95% CI) | 107.55 [6.44, 1796.46] |
| Outcome or subgroup title | No. of studies | No. of participants | Statistical method | Effect size |
| 1 Pain score Show forest plot | 1 | Std. Mean Difference (IV, Fixed, 95% CI) | Subtotals only | |
| 1.1 Pain score during procedure | 1 | 84 | Std. Mean Difference (IV, Fixed, 95% CI) | 4.27 [3.49, 5.06] |
| 1.2 Pain score within 30 min of procedure | 1 | 84 | Std. Mean Difference (IV, Fixed, 95% CI) | 1.55 [1.06, 2.05] |
| 1.3 Pain score more than 30 min after procedure | 1 | 84 | Std. Mean Difference (IV, Fixed, 95% CI) | 3.47 [2.78, 4.15] |
| 2 Failure to complete procedure Show forest plot | 1 | Odds Ratio (M‐H, Fixed, 95% CI) | Subtotals only | |
| Outcome or subgroup title | No. of studies | No. of participants | Statistical method | Effect size |
| 1 Pain score Show forest plot | 1 | Std. Mean Difference (IV, Fixed, 95% CI) | Subtotals only | |
| 1.1 Pain score during procedure | 1 | 37 | Std. Mean Difference (IV, Fixed, 95% CI) | ‐0.54 [‐1.20, 0.12] |
| Outcome or subgroup title | No. of studies | No. of participants | Statistical method | Effect size |
| 1 Pain score Show forest plot | 1 | Std. Mean Difference (IV, Fixed, 95% CI) | Subtotals only | |
| 1.1 Pain score during procedure | 1 | 80 | Std. Mean Difference (IV, Fixed, 95% CI) | ‐1.40 [‐1.90, ‐0.91] |
| 1.2 Pain score more than 30 min after procedure | 1 | 80 | Std. Mean Difference (IV, Fixed, 95% CI) | ‐0.87 [‐1.33, ‐0.41] |
| Outcome or subgroup title | No. of studies | No. of participants | Statistical method | Effect size |
| 1 Pain score Show forest plot | 1 | Std. Mean Difference (IV, Fixed, 95% CI) | Subtotals only | |
| 1.1 Pain score during procedure | 1 | 140 | Std. Mean Difference (IV, Fixed, 95% CI) | ‐0.15 [‐0.48, 0.18] |
| 1.2 Pain score within 30 min of procedure | 1 | 140 | Std. Mean Difference (IV, Fixed, 95% CI) | ‐0.25 [‐0.58, 0.08] |
| 1.3 Pain score more than 30 min after procedure | 1 | 140 | Std. Mean Difference (IV, Fixed, 95% CI) | ‐0.17 [‐0.51, 0.16] |
| 2 Adverse effects Show forest plot | 1 | 140 | Odds Ratio (M‐H, Fixed, 95% CI) | 9.54 [0.50, 180.64] |
| 2.1 Nausea and vomiting | 1 | 140 | Odds Ratio (M‐H, Fixed, 95% CI) | 9.54 [0.50, 180.64] |