| 1 Morphine requirement, mean (mg) Show forest plot | 5 | | Mean Difference (IV, Random, 95% CI) | Subtotals only |
|
| 1.1 at 2 hours (TAP v no TAP) | 1 | 42 | Mean Difference (IV, Random, 95% CI) | ‐1.4 [‐1.92, ‐0.88] |
| 1.2 at 2 hours (TAP v TAP placebo) | 1 | 65 | Mean Difference (IV, Random, 95% CI) | 3.90 [‐0.47, 8.27] |
| 1.3 at 24 hours (all) | 5 | 236 | Mean Difference (IV, Random, 95% CI) | ‐21.94 [‐37.91, ‐5.96] |
| 1.4 at 24 hours (TAP v no TAP) | 3 | 121 | Mean Difference (IV, Random, 95% CI) | ‐30.68 [‐57.88, ‐3.47] |
| 1.5 at 24 hours (TAP v TAP placebo) | 2 | 115 | Mean Difference (IV, Random, 95% CI) | ‐8.99 [‐29.03, 11.05] |
| 1.6 at 48 hours (TAP v TAP placebo) | 1 | 50 | Mean Difference (IV, Random, 95% CI) | ‐28.50 [‐38.92, ‐18.08] |
| 2 Time to first morphine request (mins), mean Show forest plot | 1 | 32 | Mean Difference (IV, Random, 95% CI) | 133.1 [76.77, 189.43] |
|
| 3 Time to first morphine request (mins), median, IQR Show forest plot | | | Other data | No numeric data |
|
| 4 Incidence of sedation Show forest plot | 1 | 50 | Risk Ratio (M‐H, Random, 95% CI) | 0.61 [0.33, 1.11] |
|
| 5 Sedation scores (median, IQR or range) Show forest plot | | | Other data | No numeric data |
|
| 5.1 TAP v no TAP | | | Other data | No numeric data |
| 5.2 TAP v TAP placebo | | | Other data | No numeric data |
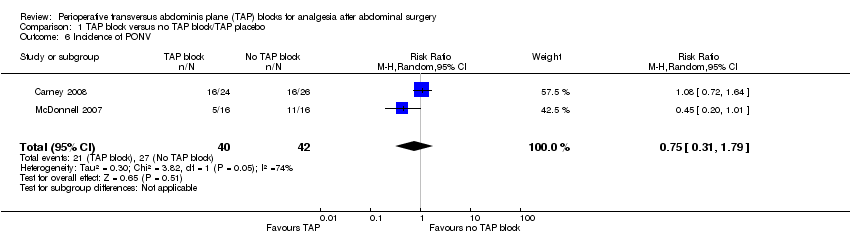
| 6 Incidence of PONV Show forest plot | 2 | 82 | Risk Ratio (M‐H, Random, 95% CI) | 0.75 [0.31, 1.79] |
|
| 7 PONV scores (median, IQR) Show forest plot | | | Other data | No numeric data |
|
| 8 Nausea (median, range) Show forest plot | | | Other data | No numeric data |
|
| 9 Vomiting (median, range) Show forest plot | | | Other data | No numeric data |
|
| 10 Pruritus (median, range) Show forest plot | | | Other data | No numeric data |
|
| 11 Pain severity (median, IQR) Show forest plot | | | Other data | No numeric data |
|
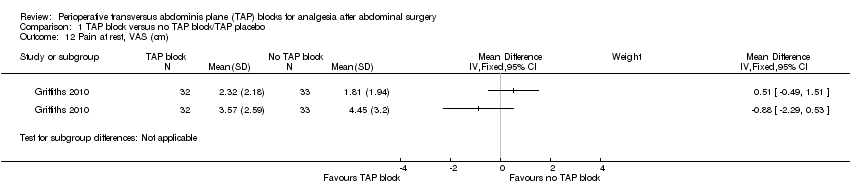
| 12 Pain at rest, VAS (cm) Show forest plot | 1 | | Mean Difference (IV, Fixed, 95% CI) | Subtotals only |
|
| 13 Pain at rest VAS, (median, IQR) Show forest plot | | | Other data | No numeric data |
|
| 14 Pain on coughing, VAS (cm) Show forest plot | 1 | | Mean Difference (IV, Fixed, 95% CI) | Subtotals only |
|
| 15 Pain on coughing VAS, (median, IQR) Show forest plot | | | Other data | No numeric data |
|
| 16 Need for additional intraoperative opioid Show forest plot | 1 | 42 | Risk Ratio (M‐H, Random, 95% CI) | 0.26 [0.12, 0.53] |
|
| 17 Intraoperative analgesia requirement Show forest plot | 1 | | Mean Difference (IV, Fixed, 95% CI) | Subtotals only |
|
| 18 Satisfaction, VAS (cm) Show forest plot | 1 | | Mean Difference (IV, Fixed, 95% CI) | Subtotals only |
|