Les interventions pharmacologiques et mécaniques pour le déclenchement du travail en contexte ambulatoire
Referencias
References to studies included in this review
References to studies excluded from this review
References to studies awaiting assessment
Additional references
References to other published versions of this review
Characteristics of studies
Characteristics of included studies [ordered by study ID]
| Methods | Parallel randomised, single‐blind, placebo‐controlled trial. | |
| Participants | Setting: Safdarjung Hospital, New Delhi, India. 200 women randomised. Inclusion criteria: singleton pregnancy, > 40 completed weeks, unfavourable cervix (Bishop score < 6), absence of uterine contractions, intact membranes. Exclusion criteria: fetal malpresentation, pre‐partum haemorrhage, previous uterine incision, ruptured membranes, high‐risk factors such as pre‐eclampsia, oligohydramnios, intrauterine growth restriction, diabetes mellitus, heart disease, and hypertension, or any contraindication to receive IMN or prostaglandins such as a known allergy to the drugs, bronchial asthma, hypotension, and palpitations. | |
| Interventions | Intervention group: 2 x 40 mg tablets of IMN self‐administered at home, vaginally, 1 of the tablets at 9 AM and the other at 9 PM the same day and to report to the hospital the next day at 9 AM for admission. Control group: 2 x 40 mg tablets of pyridoxine as placebo IMN self‐administered at home, vaginally, 1 of the tablets at 9 AM and the other at 9 PM the same day and to report to the hospital the next day at 9 AM for admission. Both arms received labour induction protocol on return to hospital. | |
| Outcomes | Primary outcomes
Secondary outcomes
| |
| Notes | Added for 2017 update. | |
| Risk of bias | ||
| Bias | Authors' judgement | Support for judgement |
| Random sequence generation (selection bias) | Low risk | Paper states the randomisation codes were generated using a random allocation sequence, and that the random number table was generated by the statistician using a computerised random number table. |
| Allocation concealment (selection bias) | Unclear risk | The participants were enrolled by the first author and assignment to the study or control group was done in accordance with the list of codes, which was generated by the second author. However, did not state whether random sequence was concealed or not. |
| Blinding (performance bias and detection bias) | Low risk | It was a single‐blind trial as the participants did not know whether they were given IMN. However, it seems that personnel were unblinded. |
| Blinding (performance bias and detection bias) | High risk | It was a single‐blind trial as the participants did not know whether they were given IMN. However, it seems that personnel were unblinded. |
| Blinding (performance bias and detection bias) | Unclear risk | Not specifically stated, however based on above it is possible outcome assessors were unblinded. |
| Incomplete outcome data (attrition bias) | Low risk | Outcome data complete for all participants. |
| Selective reporting (reporting bias) | Low risk | No evidence of selective outcome reporting. |
| Other bias | Low risk | None identified. |
| Methods | Double blind RCT. | |
| Participants | Setting: Academic Obstetric Unit of the Teaching Hospital Mahamodara, Galle, Sri Lanka. Inclusion criteria: uncomplicated pregnancy at 39 weeks' gestational age (GA) with a singleton fetus having a cephalic presentation and a modified Bishop score < 5 out of 10, and consenting to self‐administer the vaginal tablets every other day for 5 days. Exclusion criteria: any pregnancy complications, e.g. hypertension or hyperglycaemia in pregnancy, multiple pregnancies, planned caesarean birth, fetal growth restriction and history of hypersensitivity or idiosyncratic reaction to nitrates. | |
| Interventions | Intervention: self‐administer vaginally at home every other day, 5 doses of 60 mg of the sustained release form of isosorbide mononitrate (ISMN) from 273 days to 282 days. Control: pyroxidine 10 mg, using same regimen. In both arms, participants were instructed to self‐administer the tablets vaginally at home at GAs of 39 weeks, 39 weeks + 2 days, 39 weeks + 4 days, 39 weeks + 6 days and 40 weeks + 1 day, unless spontaneous onset of labour (SOL) was established and she needed admission to hospital. If SOL was not established by 40 weeks + 2 days, all participants were admitted to hospital, the MBS was re‐assessed and artificial separation of membranes was carried out if feasible, and if not feasible, a cervical massage were carried out. Thereafter the routine management guideline for cervical ripening and IOL of the unit were followed using artificial separation of membranes, prostaglandin (PGE₂ 3 mg tablets) vaginally or intra cervical Foley catheter, followed by amniotomy and intravenous oxytocin infusion, if SOL was not established by 41 weeks. On admission to hospital either with SOL or at 40 weeks + 2 days, compliance to the interventions was assessed by checking the cards which the participants had been requested to maintain, indicating when they self administered the study medication. | |
| Outcomes | Outcomes stratified:
Satisfaction and acceptability For pregnancies reaching 41 weeks:
| |
| Notes | This study was reported in a brief abstract. We attempted to contact authors for further information (1 September 2016), who provided an unpublished version of the manuscript (accepted for publication). | |
| Risk of bias | ||
| Bias | Authors' judgement | Support for judgement |
| Random sequence generation (selection bias) | Low risk | Article states "Using computer generated random numbers participants were allocated into the study and control groups by stratified (Primips / Multips) block randomization". |
| Allocation concealment (selection bias) | Low risk | Article states "Two sets of sequentially numbered opaque envelopes (one for Primips and one for Multips) were packed with five tablets of either ISMN–SR 60mgs (Angifree – SR, Microlabs, Bangalore, India) or five tablets of Pyridoxine 10mgs (HealthAid Vitamins, Harrow, Middlesex, United Kingdom ) according to the random allocation sequence in blocks of four, by the second author". |
| Blinding (performance bias and detection bias) | Unclear risk | Study title describes as double blind, no further detail provided. |
| Blinding (performance bias and detection bias) | Unclear risk | Study title describes as double blind, no further detail provided. |
| Blinding (performance bias and detection bias) | Unclear risk | Study title describes as double blind, no further detail provided. |
| Incomplete outcome data (attrition bias) | Low risk | Outcome data reported for all participants, except for 1 drop out from intervention arm (ISMN group) who discontinued due to anxiety. |
| Selective reporting (reporting bias) | Low risk | No evidence of selective reporting. |
| Other bias | Low risk | No other forms of bias identified. |
| Methods | RCT. | |
| Participants | Setting: large teaching hospital in Glasgow, Scotland, UK. 350 women randomised. Inclusion criteria: primiparous women at term (gestational age > 37 weeks) with singleton pregnancy and Bishop score < 7. Women were scheduled for induction (97% for prolonged pregnancy: 40 weeks + 10 days gestation). Women recruited were willing to self‐administer vaginal tablets. Exclusion criteria: women with ruptured membranes, aged < 16 years age, who needed birth within the next 48 h, or with fetal compromise requiring daily fetal monitoring. | |
| Interventions | Intervention group: self‐administered vaginal IMN 40 mg every 16 h to maximum of 3 doses (48 h, 32 h and 16 h prescheduled admission for induction). Comparison group: self‐administered placebo, same regimen as intervention group. | |
| Outcomes | Time from hospital admission to birth, women's views on induction process, pain, mode of birth, cost to NHS, neonatal outcomes. | |
| Notes | A review author, Jane Norman (JN), was an investigator on this trial. JN was not involved in assessing the eligibility of the study for inclusion, data extraction or assessment of risk of bias. See Eddama 2009 for associated paper on cost outcomes. | |
| Risk of bias | ||
| Bias | Authors' judgement | Support for judgement |
| Random sequence generation (selection bias) | Low risk | Computer generated sequence. |
| Allocation concealment (selection bias) | Low risk | Central randomisation with automated telephone service. Women were given information and consented after the decision to induce labour had been made. Randomisation in the antenatal clinic up to 9 days before treatment commenced. |
| Blinding (performance bias and detection bias) | Low risk | Treatment packs for intervention and control groups were described as identical, prepared by pharmacy. |
| Blinding (performance bias and detection bias) | Low risk | Treatment packs for intervention and control groups were described as identical, prepared by pharmacy. |
| Blinding (performance bias and detection bias) | Unclear risk | Blinding of outcomes assessors not explicitly stated. |
| Incomplete outcome data (attrition bias) | High risk | 350 randomised. 80 women did not initiate treatment as they went in to labour before the scheduled time for taking medication, a further 11 women withdrew (including 2 with breech presentation). All women randomised were included in an ITT analysis for primary outcomes (but not in secondary analysis). |
| Selective reporting (reporting bias) | Low risk | We examined the protocol for this study and there is no evidence of reporting bias. |
| Other bias | Low risk | No baseline imbalance apparent. |
| Methods | RCT. | |
| Participants | Setting: 2 hospitals in Gothenburg, Sweden. 200 women randomised. Inclusion criteria: women with uncomplicated pregnancies, singleton, cephalic presentation, intact membranes, > 42 weeks' gestation (confirmed by ultrasound before 20 weeks) normal AFI, reactive NST. Exclusion criteria: serious medical or obstetric complication (daily use of medication), history of headache, regular contractions, alcohol abuse, intolerance of IMN. | |
| Interventions | Intervention group: 40 mg IMN intravaginal. Comparison: placebo. Review arranged for the next day, if labour had not started then IOL was carried out according to local protocol. | |
| Outcomes | Additional induction agents required, maternal satisfaction, CS PPH. | |
| Notes | ||
| Risk of bias | ||
| Bias | Authors' judgement | Support for judgement |
| Random sequence generation (selection bias) | Low risk | Random number tables. |
| Allocation concealment (selection bias) | Low risk | Sealed sequentially numbered envelopes. |
| Blinding (performance bias and detection bias) | Low risk | Described as double blind. Women unaware of assignment. |
| Blinding (performance bias and detection bias) | Low risk | Staff unaware of treatment assignment; placebo and treatment identical. |
| Blinding (performance bias and detection bias) | Unclear risk | Blnding of outcome assessors not described. |
| Incomplete outcome data (attrition bias) | Low risk | Report that all women completed the study. |
| Selective reporting (reporting bias) | Low risk | Stated outcomes are reported. |
| Other bias | Low risk | Baseline characteristics comparable. |
| Methods | RCT, 2 arm trial. | |
| Participants | Setting: 43 women attending antenatal clinics in California, USA. Inclusion criteria: women with "post‐dates" pregnancies (gestational age > 41 weeks and 6 days based on reliable menstrual history and early ultrasound confirmation) with reactive NST. Exclusion criteria: contraindications to prostaglandins. | |
| Interventions | Intervention group: intracervical PGE₂ 0.5 mg. Comparison group: visually identical placebo gel. Women in both groups were observed for 1 h with external fetal monitoring and then discharged home. | |
| Outcomes | Bishop score on admission, mode of birth, interval to birth, length of labour, infant birthweight and Apgar score. | |
| Notes | ||
| Risk of bias | ||
| Bias | Authors' judgement | Support for judgement |
| Random sequence generation (selection bias) | Low risk | External sequence generation by hospital pharmacy. |
| Allocation concealment (selection bias) | Low risk | Coded syringes of identical appearance were dispensed from pharmacy. |
| Blinding (performance bias and detection bias) | Low risk | Placebo controlled trial. Women and physicians unaware of group assignment. Identical treatment and placebo. |
| Blinding (performance bias and detection bias) | Low risk | Placebo controlled trial. Women and physicians unaware of group assignment. Identical treatment and placebo. |
| Blinding (performance bias and detection bias) | Unclear risk | Not clear when code was revealed, but investigators were not involved in the inpatient care of women. |
| Incomplete outcome data (attrition bias) | Low risk | All women randomised appeared to be included in the analyses. |
| Selective reporting (reporting bias) | Low risk | Stated outcomes are reported. |
| Other bias | Low risk | No other bias apparent. |
| Methods | RCT. 4 arm trial. | |
| Participants | Setting: Edinburgh, UK. 80 women recruited with IOL scheduled 72 h after recruitment. Inclusion criteria: primiparous women aged 18 to 40 years, normal viable fetus, 37 to 41 weeks (confirmed by first trimester ultrasound scan), cephalic presentation, Bishop score < 5. Exclusion criteria: women who showed signs of labour onset, placental insufficiency or contraindication to mifepristone, | |
| Interventions | Intervention: group 1: (25 women) oral mifepristone 50 mg. Group 2: (25 women) oral mifepristone 200 mg. (In this review we combined both groups in the analysis although it was not clear how randomisation was achieved in the higher dose study.) Comparison groups: placebo (2 groups of women 25 compared with the lower dose and 5 with the higher dose. We have combined placebo groups in the analysis in this review as data were reported together in the results in the study reports; group size was very unbalanced for the second part of the study). | |
| Outcomes | Additional induction agents required, labour within 72 h, CS, oxytocin augmentation. NICU admission. | |
| Notes | It was not clear why the placebo group for the higher dose comparison was so small (5 women) or how randomisation was performed to achieve the unbalanced intervention and control groups. | |
| Risk of bias | ||
| Bias | Authors' judgement | Support for judgement |
| Random sequence generation (selection bias) | Unclear risk | "Pre‐determined randomisation code." |
| Allocation concealment (selection bias) | Unclear risk | "Treatment in predetermined numeric order." It was not clear why the group allocation in the placebo arms of the trial were very unbalanced. |
| Blinding (performance bias and detection bias) | Low risk | "Neither the patient nor the physician had knowledge of whether a simple oral dose of mifepristone or placebo was given." |
| Blinding (performance bias and detection bias) | Low risk | "Neither the patient nor the physician had knowledge of whether a simple oral dose of mifepristone or placebo was given." |
| Blinding (performance bias and detection bias) | Unclear risk | Blinding of outcome assessors not described. |
| Incomplete outcome data (attrition bias) | Unclear risk | All women randomised seemed to be accounted for in the analysis, although there was serious imbalance in group size. |
| Selective reporting (reporting bias) | Low risk | Stated outcomes are reported. |
| Other bias | Unclear risk | In the second part of the study (higher dose) the treatment to placebo ratio was 1:5. It was not clear how randomisation was performed, or why the control group was so small. |
| Methods | RCT 2 arm parallel group design. | |
| Participants | 120 women attending an antenatal clinic in a hospital in France, 1990 to 1991. Inclusion criteria: term pregnancy scheduled for induction (range of indications), Bishop score < 4. Exclusion criteria: malpresentation, ruptured membranes, multiple pregnancy, > 1 previous CS or known medical condition. | |
| Interventions | Intervention group: active tablets mifepristone 200 mg. All women received a box with 2 tablets, the first to be taken on the morning of day 1 and the second on the morning of day 2. Comparison group: placebo tablets. Same regimen as intervention group. IOL scheduled for 4 days after intervention, women reported to the hospital each day over the 4 day study period and were asked to report drug reactions, pain, bleeding or contractions. | |
| Outcomes | Labour within 4‐day study period, other induction agents required, duration of labour, mode of birth, Apgar score < 7 at 5 min. | |
| Notes | ||
| Risk of bias | ||
| Bias | Authors' judgement | Support for judgement |
| Random sequence generation (selection bias) | Unclear risk | Tablets were supplied by pharmacy according to a "balanced randomisation list". Block size 4. |
| Allocation concealment (selection bias) | Low risk | Small block size might mean that allocation order could potentially be anticipated in advance but the drug packs were described as being of similar appearance. |
| Blinding (performance bias and detection bias) | Low risk | Described as a double‐blind study. |
| Blinding (performance bias and detection bias) | Low risk | Placebo described as being of similar appearance. |
| Blinding (performance bias and detection bias) | Unclear risk | Blinding of outcome assessors not described. |
| Incomplete outcome data (attrition bias) | Unclear risk | 120 women were randomised but 8 were excluded from the results because of a deterioration in their condition within 12 h of the first pill (3 in the mifepristone group and 5 in the placebo group). |
| Selective reporting (reporting bias) | Unclear risk | Efficacy and safety outcomes not specified in methods text but many labour and infant outcomes reported. |
| Other bias | Unclear risk | Additional induction agents were used for some women so labour and other outcomes may be affected by co‐interventions. |
| Methods | Double‐blind, placebo‐controlled RCT (pilot study). | |
| Participants | Setting: Women’s Pavilion at Miller Children’s Hospital, Long Beach Memorial Medical Center, Long Beach, California. Inclusion criteria: at hospital for prolonged pregnancy surveillance, women at gestational age of 40 to 42 weeks, singleton gestation, Bishop score < 6/ unfavourable cervix, vertex presentation, intact membranes, reactive NST, AFI of more than or equal to 5, willing to forgo induction for 72 h. Exclusion criteria: none specified. | |
| Interventions | Intervention: cervical ripening regimen (N = 43) Subjects were treated daily for up to 3 days with oral capsule containing 100 mg of misoprostol. Electronic fetal monitoring for 2 h after administration. Women were asked to return in 24 h to be evaluated for a repeat dosage. During the 3 days of study observation, labour induction was not allowed. If adequate cervical ripening was achieved on days 1 or 2, the next doses of study drug were withheld. If the Bishop score was 6 or greater or if the patient went into active labour, she was removed from the study protocol and managed according to standard hospital protocol. After 3 days, all women removed and management was according to routine care. In hospital, maternal FHR monitoring for 2 h. Control: placebo (unspecified content) daily for 3 days, according to same regimen for women in the intervention arm (N = 44). | |
| Outcomes | Primary outcome: time from study drug administration to birth Secondary outcome
Adverse events:
| |
| Notes | ||
| Risk of bias | ||
| Bias | Authors' judgement | Support for judgement |
| Random sequence generation (selection bias) | Low risk | Article states "Randomization of subjects was completed using a computerized random number generator (True Epistat). Randomization was coordinated by the Labor and Delivery pharmacist, who was apprised of each candidate’s eligibility and assigned the treatments in sequence based on the computer‐generated randomization scheme". |
| Allocation concealment (selection bias) | Low risk | Article states "All study drugs were prepared by the research pharmacy staff and packaged to maintain the blinded assignment". |
| Blinding (performance bias and detection bias) | Low risk | Article states "All study drugs were prepared by the research pharmacy staff and packaged to maintain the blinded assignment". |
| Blinding (performance bias and detection bias) | Low risk | Article states "All study drugs were prepared by the research pharmacy staff and packaged to maintain the blinded assignment". |
| Blinding (performance bias and detection bias) | Unclear risk | Not specifically stated. |
| Incomplete outcome data (attrition bias) | High risk | 9 women were excluded from analysis post‐randomisation:
Data on these 9 women not reported. |
| Selective reporting (reporting bias) | Low risk | Pre‐specified outcome of being undelivered by 72 h not reported, but results imply all women still undelivered at that time. All other outcomes reported. |
| Other bias | Low risk | None identified. |
| Methods | A double‐blind, placebo‐controlled RCT. | |
| Participants | Setting: Alzahra educational hospital in Rasht city, Iran. Inclusion criteria
Exclusion criteria
| |
| Interventions | Intervention (N = 36): 20 mg isosorbide‐5‐mononitrate tablets vaginally twice each 12 h prior to admission for IOL. Women asked to come back urgently to the hospital in case they had leakage, contractions or bleeding. If they had no symptoms they should come back after 12 h. In the next visit, women were asked about the side effects of the tablets including headache and palpitations. If the contraction had not started, another 20 mg of IMN was administered and the patients were asked to come back after 12 h. Immediately after hospitalisation, the Bishop score was assessed and induction with oxytocin was commenced. Control (N = 36): 2 placebo tablets of similar design inserted vaginally twice each 12 h, prior to admission for IOL (according to regimen described above). | |
| Outcomes | Change in Bishop score Mean time to active phase of labour Admission to birth interval Type of birth CS indications (meconium, failure to progress, fetal distress) Min Apgar Headache Palpitation Need for NICU Fetal complications Need for blood transfusion | |
| Notes | Article abstract in English, full article in Iranian. An Iranian‐speaking colleague (E Shakibazadeh) kindly completed data extraction for risk of bias assessment and additional data. | |
| Risk of bias | ||
| Bias | Authors' judgement | Support for judgement |
| Random sequence generation (selection bias) | Low risk | Participants were randomly allocated to 2 intervention and control groups using random blocks. |
| Allocation concealment (selection bias) | Unclear risk | Not described. |
| Blinding (performance bias and detection bias) | Unclear risk | The authors have suggested that their study is a double blind study. However, there is no further information provided. |
| Blinding (performance bias and detection bias) | Unclear risk | The authors have suggested that their study is a double blind study. However, there is no further information provided. |
| Blinding (performance bias and detection bias) | Unclear risk | The authors have suggested that their study is a double blind study. However, there is no further information provided. |
| Incomplete outcome data (attrition bias) | Unclear risk | Full translation required. |
| Selective reporting (reporting bias) | Unclear risk | all specified outcomes were reported. |
| Other bias | Unclear risk | Full translation required. |
| Methods | RCT, 2 arm trial. | |
| Participants | Setting: study carried out in 2 hospitals in France, 1991 to 1992. 84 women randomised. Inclusion criteria: women with gestational age 41 weeks and 3 days or more and scheduled for induction for "post‐dates" pregnancy, Bishop score < 6, induction could be postponed for 48 h. Exclusion criteria: women with multiple pregnancies, ruptured membranes, contraindication to vaginal birth, no uterine scarring, parity < 4, no FHR abnormalities, serious medical disease or obstetric complication. | |
| Interventions | Intervention group: mifepristone 400 mg, single oral dose. Comparison group: placebo tablets of identical appearance. Women in both groups returned after 1 day for review. If Bishop score > 6 then women had labour induction or returned the next day for labour induction. | |
| Outcomes | Change in Bishop score after 48 h, treatment to birth interval, mode of birth, oxytocin augmentation, neonatal condition at birth. | |
| Notes | ||
| Risk of bias | ||
| Bias | Authors' judgement | Support for judgement |
| Random sequence generation (selection bias) | Low risk | Balanced randomisation list in permuted blocks (block size not stated). |
| Allocation concealment (selection bias) | Low risk | Coded drug bottles. The "code for each subject was to be kept sealed in an opaque envelope to be opened in case of an emergency". |
| Blinding (performance bias and detection bias) | Low risk | Described as double blind study. Placebo described as being of identical appearance. |
| Blinding (performance bias and detection bias) | Low risk | Obstetricians were blinded to group assignment. |
| Blinding (performance bias and detection bias) | Low risk | Outcome assessors were blinded. |
| Incomplete outcome data (attrition bias) | Low risk | 84 women were recruited, 1 woman (from the mifepristone group) was lost to follow up. |
| Selective reporting (reporting bias) | Low risk | Specified outcomes are reported. |
| Other bias | Low risk | Baselind characteristics of groups are comparable. |
| Methods | RCT (little information on study methods). | |
| Participants | 32 women. Setting: New Jersey, USA Inclusion criteria: women with previous CS, gestational age 39 weeks with Bishop score < 6. | |
| Interventions | Intervention group: intracervical PGE₂ repeated weekly. Comparison group: expectant management. | |
| Outcomes | CS. | |
| Notes | Brief abstract, little information provided. | |
| Risk of bias | ||
| Bias | Authors' judgement | Support for judgement |
| Random sequence generation (selection bias) | Unclear risk | No information. |
| Allocation concealment (selection bias) | Unclear risk | "prospectively randomised." |
| Blinding (performance bias and detection bias) | High risk | Not feasible. |
| Blinding (performance bias and detection bias) | High risk | No information. |
| Blinding (performance bias and detection bias) | Unclear risk | No information. |
| Incomplete outcome data (attrition bias) | Unclear risk | Trial reported as abstract only; numbers unclear. |
| Selective reporting (reporting bias) | Unclear risk | Not enough information to assess. |
| Other bias | Unclear risk | Not enough information to assess. |
| Methods | RCT. | |
| Participants | Setting: 102 women in a Cairo hospital, Egypt. Inclusion criteria: women at term (> 37 weeks' gestation) scheduled for induction, singleton viable fetus, intact membranes, no uterine contractions. Exclusion criteria: malpresentation, placenta previa, previous uterine surgery, contraindications to induction. | |
| Interventions | Intervention group: self‐administered IMN, 40 mg, 3 doses 12 h apart (scheduled for 36 h, 24 h and 12 h before induction. Comparison group: placebo same regiment as intervention group. | |
| Outcomes | CS, further induction agents required, PPH, Apgar score > 7 at 5 minutes, NICU admission, side effects. | |
| Notes | ||
| Risk of bias | ||
| Bias | Authors' judgement | Support for judgement |
| Random sequence generation (selection bias) | Low risk | Computer generated sequence. |
| Allocation concealment (selection bias) | Low risk | Coded treatment packs prepared by pharmacy. |
| Blinding (performance bias and detection bias) | Low risk | Placebo controlled trial. |
| Blinding (performance bias and detection bias) | Low risk | Tablets for intervention and placebo not described as though physicians would not know the difference between them. Staff and women would be unaware of assignment. |
| Blinding (performance bias and detection bias) | Unclear risk | Blinding of outcome assessors not described specifically, though obstetric staff were blinded. |
| Incomplete outcome data (attrition bias) | Low risk | All women randomised appear to be accounted for in the analysis. |
| Selective reporting (reporting bias) | Low risk | Stated outcomes are reported. |
| Other bias | Low risk | Demographic characteristics similar. No other bias noted. |
| Methods | RCT, placebo controlled trial. | |
| Participants | Setting: not clear but probably USA. 36 women. Inclusion criteria: healthy, nulliparous women, 41 weeks' gestation and Bishop score < 9. | |
| Interventions | Intervention group: 2.5 mg intravaginal PGE₂, with second dose if labour not established 24 h later. Comparison group: placebo gel, with second dose after 24 h if labour was not established. | |
| Outcomes | Change in cervix after 48 h. | |
| Notes | Information from brief abstract. | |
| Risk of bias | ||
| Bias | Authors' judgement | Support for judgement |
| Random sequence generation (selection bias) | Unclear risk | Described as "randomized". |
| Allocation concealment (selection bias) | Unclear risk | No information. |
| Blinding (performance bias and detection bias) | Low risk | Described as double‐blind trial with placebo gel. |
| Blinding (performance bias and detection bias) | Unclear risk | Not described specifically but treatment and placebo both described as gel. |
| Blinding (performance bias and detection bias) | Unclear risk | No information. |
| Incomplete outcome data (attrition bias) | Unclear risk | Little information on methods. It appeared that all women were available at follow up. |
| Selective reporting (reporting bias) | Unclear risk | Abstract only with limited outcome data available. |
| Other bias | Unclear risk | Trial reported as abstract only so not able to assess for other bias. |
| Methods | RCT with block randomisation. | |
| Participants | Setting: outpatient clinic in North Carolina, USA. 56 women randomised. Inclusion criteria: primiparous women at term (39 weeks and 4 days to 41 weeks) with singleton, cephalic, pregnancy and Bishop score < 7. Exclusion criteria: cannot tolerate acupuncture, uncertain dates, breech presentation, placenta praevia, contra‐indication to vaginal birth. | |
| Interventions | Cervical examination and ultrasound at recruitment. Intervention group: acupuncture + routine care on 3 of 4 consecutive days, visits also included fetal monitoring, treatment by trained acupuncturist to hands, legs and lower back and low voltage stimulation. Comparison group: routine care with follow up after 3 or 4 days. | |
| Outcomes | Vaginal birth not achieved in 24 h, additional induction agents required. CS, mean time to birth. | |
| Notes | ||
| Risk of bias | ||
| Bias | Authors' judgement | Support for judgement |
| Random sequence generation (selection bias) | Low risk | Computer generated sequence in balanced blocks of 2 or 4. |
| Allocation concealment (selection bias) | Low risk | Sealed, opaque, sequentially numbered envelopes. |
| Blinding (performance bias and detection bias) | High risk | Blinding not feasible. |
| Blinding (performance bias and detection bias) | High risk | Women and staff would have been aware of treatment. |
| Blinding (performance bias and detection bias) | Unclear risk | Not described. Birth outcomes would have been assessed separately from the intervention and control (outpatient acupuncture or no treatment), but report states that staff were not blinded. |
| Incomplete outcome data (attrition bias) | Unclear risk | Data were available for all women randomised but denominators were not clear for some outcomes. |
| Selective reporting (reporting bias) | Low risk | Stated primary and secondary outcomes are reported with neonatal outcomes. |
| Other bias | Unclear risk | Women receiving acupuncture attended for 3 additional visits where other interventions occurred as well as acupuncture that may have affected outcomes. |
| Methods | RCT, 2 arm trial. | |
| Participants | Setting: Los Angeles hospital, USA, 1996 to 2000. 120 women with diabetes. Inclusion criteria: women with insulin dependent or other diabetes, gestational age 38 weeks (confirmed by ultrasound), not in labour, normal AFI (> 5 cm), normal FHR. Women compliant with hospital appointments and home glucose monitoring. Exclusion criteria: women with multiple pregnancies, ruptured membranes, vaginal bleeding, prior uterine surgery, active genital herpes, glaucoma, serious medical disease, parity > 5, fetal weight > 4500 g or < 2000 g. | |
| Interventions | Study over 7 days. Intervention group: single dose of vaginal misoprostol 25 µg. Comparison group: placebo of similar appearance. Both groups were observed for 4 h and if there were no signs of fetal distress of painful contractions women were sent home. Reviewed after 3 to 4 days. If labour had not started then intervention/placebo was repeated. At 7 days women not in labour were induced. | |
| Outcomes | Additional induction agents required (oxytocin), mode of birth, uterine hyperstimulation, neonatal condition at birth. | |
| Notes | ||
| Risk of bias | ||
| Bias | Authors' judgement | Support for judgement |
| Random sequence generation (selection bias) | Low risk | Computer generated sequence. |
| Allocation concealment (selection bias) | Low risk | Coded drug boxes. Pharmacy prepared and distributed medication according to the randomisation schedule. |
| Blinding (performance bias and detection bias) | Low risk | Placebo controlled trial. |
| Blinding (performance bias and detection bias) | Low risk | Placebo and intervention tablets were similar in appearance. |
| Blinding (performance bias and detection bias) | Unclear risk | Not clear when code revealed. |
| Incomplete outcome data (attrition bias) | Unclear risk | 120 women randomised and no loss to follow up was apparent but denominators in the data tables were not always clear. |
| Selective reporting (reporting bias) | Unclear risk | Apart from outcome used for sample size, outcomes not specified in the methods text. |
| Other bias | Low risk | Baseline characteristics comparable. |
| Methods | RCT 2‐arm parallel group design (dose comparison study). | |
| Participants | 52 women attending a large teaching hospital and scheduled for IOL. Inclusion criteria: singleton, cephalic presentation, not in active labour, gestational age > 40 weeks (confirmed by menstrual dates and ultrasound before 20 weeks). Exclusion criteria: previous CS, FHR abnormalities, contraindication to prostaglandin or vaginal birth. | |
| Interventions | Intervention group: 50 µg oral misoprostol. Comparison group: 25 µg misoprostol. Prior to randomisation women received an ultrasound to assess fetal growth and AFV and a fetal NST was carried out. In both groups medication was administered by a nurse and in the absence of labour or contraindications the dose was repeated after 3 days to a maximum of 3 doses over 9 days. Women returned to hospital every 3 days unless labour started or there was any reduction in fetal kicks. | |
| Outcomes | Days to birth, uterine hyperstimulation, further induction agents required, CS, Apgar score < 6 at 5 min, NICU admission, meconium staining, perinatal death. | |
| Notes | ||
| Risk of bias | ||
| Bias | Authors' judgement | Support for judgement |
| Random sequence generation (selection bias) | Low risk | Computer generated sequence. |
| Allocation concealment (selection bias) | Low risk | Coded drug boxes. |
| Blinding (performance bias and detection bias) | Unclear risk | Intervention and placebo tablets were cut from larger tablets (1/4 or 1/8) and described as appearing the same. |
| Blinding (performance bias and detection bias) | Unclear risk | Staff were said to be blinded because placebo and intervention tablets indistinguishable. We were unsure if they were indistinguishable to knowledgeable staff because they were cut from larger tablets (1/4 or 1/8). |
| Blinding (performance bias and detection bias) | Low risk | Described as blind. |
| Incomplete outcome data (attrition bias) | Unclear risk | There were some inconsistencies in the figures; while 49 women seem to have been randomised there were 52 in the results tables. |
| Selective reporting (reporting bias) | Unclear risk | This was a pilot study and secondary measures for women and infants not specified in the methods text. |
| Other bias | Unclear risk | This was a pilot study with limited sample size. Authors state secondary outcomes analysed without stratification, but not what characteristic on which the sample would be stratified. The authors state the possibility of type II error due to inadequate sample size to evaluate neonatal outcomes. |
| Methods | RCT, 3 arm trial. | |
| Participants | Setting: Mississippi, USA (outpatient setting). 136 women randomised. Inclusion criteria: women at term (37 weeks' gestation), Bishop score < 6, candidates for vaginal birth with uncomplicated pregnancy. Exclusion criteria: women with diabetes or serious pregnancy complications including hypertension, or chronic medical conditions. | |
| Interventions | Intervention group (1): PGE₂ 0.5 mg intracervical. Intervention group (2): vaginal oestrogen cream (estradiol) 4 mg. Comparison group: inert lubricant vaginal jelly. Women were assessed weekly until an indication for birth arose. Medication was repeated weekly. | |
| Outcomes | Mode of birth, use of oxytocin, condition of newborn. | |
| Notes | ||
| Risk of bias | ||
| Bias | Authors' judgement | Support for judgement |
| Random sequence generation (selection bias) | Low risk | Random number tables. |
| Allocation concealment (selection bias) | Low risk | Opaque, sequentially numbered envelopes. |
| Blinding (performance bias and detection bias) | Low risk | Placebo controlled. |
| Blinding (performance bias and detection bias) | Unclear risk | Interventions not identical; placebo jelly distinguishable from estradiol cream for staff. |
| Blinding (performance bias and detection bias) | Unclear risk | Assessment of outcomes remote from intervention and placebo administration, but unclear if staff would have been aware of group assignment. |
| Incomplete outcome data (attrition bias) | Low risk | 136 women were randomised, 8 were excluded after randomisation. |
| Selective reporting (reporting bias) | Unclear risk | Specific outcomes not stated in methods text, apart from sample size calculation. |
| Other bias | Unclear risk | Baseline group characteristics are similar. |
| Methods | RCT. | |
| Participants | Setting: not clear. 32 women. Inclusion criteria: women who had a previous CS with gestational age > 38 and < 42 weeks confirmed by ultrasound. All women were scheduled for induction (21 for "post‐dates", 7 for hypertension and 4 for FGR); Bishop score < 4. | |
| Interventions | The study was carried out over a 4 day observation period, induction was planned for the fourth day (PGE₂ and amniotomy or oxytocin induction if Bishop score > 3). Women attended the outpatient's department for NST daily. Intervention group: 200 mg oral mifepristone on days 1 and 2. Comparison group: placebo, same regime as intervention group. | |
| Outcomes | CS, assisted birth, uterine scar separation, fetal distress. | |
| Notes | ||
| Risk of bias | ||
| Bias | Authors' judgement | Support for judgement |
| Random sequence generation (selection bias) | Unclear risk | Described as "randomisation list" using block design (block size 4). |
| Allocation concealment (selection bias) | Low risk | Coded drug boxes. |
| Blinding (performance bias and detection bias) | Low risk | Described as double‐blind placebo controlled study. "External appearance of the tablets was similar." |
| Blinding (performance bias and detection bias) | Low risk | Intervention and placebo tablet described as similar. |
| Blinding (performance bias and detection bias) | Unclear risk | Blinding of outcome assessors not described. |
| Incomplete outcome data (attrition bias) | Low risk | All women appeared to be accounted for in the analysis. |
| Selective reporting (reporting bias) | Unclear risk | Outcomes not stated in methods text |
| Other bias | Unclear risk | Baseline characteristics similar but no formal test (P value) reported. |
| Methods | RCT 2 arm parallel group design. | |
| Participants | 90 women attending 4 USA hospitals. Inclusion criteria: women with post‐dates pregnancy (gestational age > 40 weeks + 3 days) attending for FHR testing. Gestation confirmed by ultrasound before 24 weeks, AFI > 5 cm, reactive NST. Exclusion criteria: malpresentation, multiple pregnancy, previous CS, evidence of hyperstimulation or suspicious FHR patterns, grand multiparity (> 4 previous deliveries), placenta praevia or other contraindications to vaginal birth. | |
| Interventions | Intervention group: intracervical PGE₂ gel (Prepidil) 0.5 mg. Comparison group: placebo gel. Gel was inserted by doctor or midwife in an antenatal testing centre or in the labour unit within rapid transport distance of birth facilities. After insertion there was 40 min of continuous monitoring. Women returned to hospital after 3 to 4 days for fetal testing and further gel up to a maximum of 4 doses. | |
| Outcomes | Further induction agents required, CS rates, uterine hyperstimulation, FHR changes and side effects. | |
| Notes | ||
| Risk of bias | ||
| Bias | Authors' judgement | Support for judgement |
| Random sequence generation (selection bias) | Low risk | Computer generated sequence (permuted block design, but block size not stated). |
| Allocation concealment (selection bias) | Low risk | Central randomisation with coded drug boxes. |
| Blinding (performance bias and detection bias) | Low risk | Treatment and placebo gels were identical and produced by manufacturer. |
| Blinding (performance bias and detection bias) | Low risk | Treatment and placebo gels were identical and produced by manufacturer. |
| Blinding (performance bias and detection bias) | Low risk | Unblinding was reported to occur only after completion of all the data collection. |
| Incomplete outcome data (attrition bias) | Low risk | 2 women that were randomised were not included in the analysis as they did not meet the inclusion criteria (the study was described as ITT). |
| Selective reporting (reporting bias) | Unclear risk | Specific outcomes not mentioned in results section apart from sample size calculation. |
| Other bias | Unclear risk | This is a pilot study. Women in the prostaglandin group were further over due than women in the control group, but other baseline characteristics similar. |
| Methods | RCT, 2 arm trial. | |
| Participants | Setting: 40 women, setting not clear. Inclusion criteria: women with gestational age 40 to 42 weeks, singleton, cephalic presentation, intact membranes, Bishop score < 6, reassuring FHR and < 3 contractions in 10 minutes. | |
| Interventions | Intervention group: 100 mg oral misoprostol, dose repeated every 24 h with maximum of 3 doses. 2 h continual fetal monitoring after each dose. Comparison group: placebo, with same regime and monitoring as the intervention group. | |
| Outcomes | Chorioamnionitis, meconium aspiration, uterine hyperstimulation, mean time to active labour. | |
| Notes | Study reported in brief abstract. | |
| Risk of bias | ||
| Bias | Authors' judgement | Support for judgement |
| Random sequence generation (selection bias) | Unclear risk | Described as "randomized". |
| Allocation concealment (selection bias) | Unclear risk | Placebo controlled, no information on randomisation procedure. |
| Blinding (performance bias and detection bias) | Low risk | Described as double‐blind, placebo controlled study. |
| Blinding (performance bias and detection bias) | Low risk | Described as double‐blind, placebo controlled study. |
| Blinding (performance bias and detection bias) | Unclear risk | Not described. |
| Incomplete outcome data (attrition bias) | Unclear risk | All women appeared to have been followed up, but little information. |
| Selective reporting (reporting bias) | Unclear risk | Study reported in brief abstract; unable to assess this bias domain. |
| Other bias | Unclear risk | Study reported in brief abstract; unable to assess this bias domain. |
| Methods | RCT. 3 arm trial. | |
| Participants | Setting: California, USA, women attending a naval medical centre. 70 women included in the analysis (2 of 3 treatment arms included, total recruited 105 women). Inclusion criteria: women with "post dates" pregnancy ‐ gestational age 41 weeks confirmed by menstrual dates and pre‐20 weeks ultrasound. Uncomplicated pregnancy. Bishop score < 5. Exclusion criteria: women with any contraindication to vaginal birth. | |
| Interventions | (1 intervention group had daily membrane stripping; this group has not been included in the analysis in this review.) Intervention group: intracervical PGE₂ 0.5 mg, daily for 3 days. Comparison group: gentle cervical examination, daily for 3 days. Women were instructed to return to hospital is they had bleeding, membrane rupture, regular contractions of reduction in fetal movements. Once Bishop score = 8 or women reached 42 weeks they were admitted to hospital for induction. | |
| Outcomes | Induced at 42 weeks, CS, instrumental birth. Apgar score < 7 at 5 min, admission to NICU. | |
| Notes | ||
| Risk of bias | ||
| Bias | Authors' judgement | Support for judgement |
| Random sequence generation (selection bias) | Low risk | Random number tables. |
| Allocation concealment (selection bias) | Low risk | Sealed, opaque, sequentially numbered envelopes. |
| Blinding (performance bias and detection bias) | High risk | Not feasible. |
| Blinding (performance bias and detection bias) | High risk | Not feasible. |
| Blinding (performance bias and detection bias) | Unclear risk | Outcome assessment of cervical changes were reported to be blind; blinding not described for other outcomes. |
| Incomplete outcome data (attrition bias) | Low risk | No apparent loss to follow up. |
| Selective reporting (reporting bias) | Unclear risk | Outcomes not stated in methods text. |
| Other bias | Low risk | Baseline demographics similar. |
| Methods | RCT. | |
| Participants | Setting: Ohio hospital USA (65 women). Inclusion criteria: women at term (gestational age > 37 weeks), age > 17 years, Bishop score < 7. "Well dated pregnancy" with no indication for immediate induction. Exclusion criteria: multiple pregnancy, insulin dependent diabetes, ruptured membranes, non‐reassuring NST, contraindications to a trial of labour, chronic hypertension. | |
| Interventions | Intervention group: intracervical PGE₂ 0.5 mg. Comparison group: placebo. Both groups had continuous monitoring for 1 h, if labour started women were admitted to hospital, otherwise they were discharged home. | |
| Outcomes | Uterine hyperstimulation, further induction agents required,uterine hyperstimulation, CS. | |
| Notes | ||
| Risk of bias | ||
| Bias | Authors' judgement | Support for judgement |
| Random sequence generation (selection bias) | Low risk | Random number tables. |
| Allocation concealment (selection bias) | Low risk | Placebo controlled trial. |
| Blinding (performance bias and detection bias) | Low risk | Placebo was described as identical to active PGE₂. |
| Blinding (performance bias and detection bias) | Unclear risk | Investigators who administered the gel were blinded; however, prenatal care sometimes delivered by other staff who were aware of study participation but not treatment. |
| Blinding (performance bias and detection bias) | Unclear risk | Unclear if obstetric care staff were aware of study participation and/or group assignment. |
| Incomplete outcome data (attrition bias) | Low risk | 65 women were randomised, there were 4 post randomisation exclusions. |
| Selective reporting (reporting bias) | Unclear risk | Trial outcomes not specified in methods text. |
| Other bias | Low risk | No baseline imbalance apparent. |
| Methods | RCT, 2 arm trial. | |
| Participants | Setting: not clear. 68 women included. Inclusion criteria: women with "well‐dated" pregnancies with gestational age > 40 weeks and Bishop score < 9. Exclusion criteria: current indication for IOL, malpresentation, multiple pregnancy, previous CS, oligohydramnios (AFI < 5 cm). any contraindication to a trial of labour, current regular contractions. | |
| Interventions | All women were assessed prior to randomisation. Intervention group: vaginal misoprostol 25 µg. Comparison group: placebo gel. Fetal and uterine monitoring for 1 h after treatment then women were discharged home. Labour was induced if BIshop score > 8 after 41 weeks or all women after 42 weeks. | |
| Outcomes | Uterine hyperstimulation, mode of birth, epidural, Apgar score, NICU admission. (Women with PROM were given oxytocin to "stimulate labour" but were not included as inductions in the analyses.) | |
| Notes | ||
| Risk of bias | ||
| Bias | Authors' judgement | Support for judgement |
| Random sequence generation (selection bias) | Low risk | Computer generated sequence performed in hospital pharmacy. |
| Allocation concealment (selection bias) | Low risk | Placebo controlled trial. |
| Blinding (performance bias and detection bias) | Low risk | Placebo of similar appearance. |
| Blinding (performance bias and detection bias) | Unclear risk | Investigators blinded but other prenatal care providers aware of study participation. |
| Blinding (performance bias and detection bias) | Unclear risk | Blinding of outcomes assessors not described. Obstetric staff aware of study participation. Birth and obstetric data taken from computerised records. |
| Incomplete outcome data (attrition bias) | Low risk | 68 women were randomised, 4 were excluded after randomisation and did not receive the study medication, but were included in an ITT analysis. |
| Selective reporting (reporting bias) | Unclear risk | Outcomes (apart from sample size calculation) not mentioned in methods text. |
| Other bias | Unclear risk | No baseline imbalance apparent. |
| Methods | RCT 2‐arm parallel group design. | |
| Participants | 84 women attending a USA hospital between 1999 to 2001. Inclusion criteria: singleton, cephalic presentation, intact membranes, Bishop score of 6 or less, reactive NST. Exclusion criteria: ruptured membranes, Bishop score > 6, contraindication to induction, > 3 contractions in 10 min, uterine scar. | |
| Interventions | Intervention group: vaginal misoprostol 25 µg. Comparison group: intracervical PGE₂ gel (dinoprostone) 0.5 mg. Women in both groups were randomised after a reactive NST. After drug administration women had continuous FHR monitoring for 3 h with discharge home if clinically stable. Women were asked to return the next day (after 18 h) for oxytocin induction if labour was not established. | |
| Outcomes | Vaginal birth within 24 or 48 h, uterine hyperstimulation, CS, oxytocin required, Apgar score < 7 at 5 min, NICU admission. | |
| Notes | ||
| Risk of bias | ||
| Bias | Authors' judgement | Support for judgement |
| Random sequence generation (selection bias) | Low risk | Random number table. |
| Allocation concealment (selection bias) | Low risk | Opaque sequentially numbered envelopes (not stated whether sealed). |
| Blinding (performance bias and detection bias) | High risk | Blinding women would be feasible but the study was not blinded. |
| Blinding (performance bias and detection bias) | High risk | Study not blinded. |
| Blinding (performance bias and detection bias) | High risk | Study not blinded. |
| Incomplete outcome data (attrition bias) | Low risk | 84 women were randomised (42 in each group), 2 women were lost to follow up in the misoprostol group but were included in the denominators. |
| Selective reporting (reporting bias) | Low risk | Primary and secondary outcomes stated in methods text and reported. |
| Other bias | Low risk | None apparent. |
| Methods | RCT, 2 arm trial. | |
| Participants | 58 women. South Carolina, USA. Inclusion criteria: women with diabetes at term or women with prolonged pregnancy (> 42 weeks) requiring induction, Bishop score < 7. | |
| Interventions | Intervention group: 2 mg intravaginal PGE₂ after reassuring NST, then continuous fetal monitoring for 3 h. Women were admitted if labour started or cervix favourable. Treatment repeated after 24 h and 48 h and admitted after third dose. Comparison group: expectant management with weekly assessment of AFI and NST. Admission in labour or if signs of fetal distress. IOL at 44 weeks. | |
| Outcomes | Spontaneous labour within 48 h, uterine hyperstimulation, CS. | |
| Notes | Results reported in brief abstract. | |
| Risk of bias | ||
| Bias | Authors' judgement | Support for judgement |
| Random sequence generation (selection bias) | Unclear risk | Described as "prospectively randomised". |
| Allocation concealment (selection bias) | Unclear risk | Not described. |
| Blinding (performance bias and detection bias) | High risk | Not feasible. |
| Blinding (performance bias and detection bias) | High risk | Not feasible. |
| Blinding (performance bias and detection bias) | Unclear risk | Outcomes assessors not mentioned in brief abstract. |
| Incomplete outcome data (attrition bias) | Unclear risk | Little information. No loss to follow up apparent. |
| Selective reporting (reporting bias) | Unclear risk | Trial reported only in brief abstract so unable to assess this bias domain. |
| Other bias | Unclear risk | Trial reported only in brief abstract so unable to assess this bias domain. |
| Methods | Placebo controlled RCT. | |
| Participants | Setting: outpatient clinic in Memphis, USA. 100 women recruited. Inclusion criteria: gestation 38 to 40 weeks with Bishop score < 7. Exclusion criteria: non‐reactive NST, oligohydramnios (AFI < 5.0 cm) macrosomia (> 4000 g or 10th centile), medical indication for birth, > 1 previous CS. | |
| Interventions | All women underwent NST, AFV and ultrasound assessment. Intervention group: 2 mg intravaginal PGE₂ for 5 consecutive days. Comparison group: identical placebo for 5 consecutive days. After each dose women were monitored for 30 min to rule out labour or fetal distress. Women were reviewed twice weekly (NST and AFV). | |
| Outcomes | Other induction agents required, uterine hyperstimulation, CS, epidural, chorioamnionitis, Apgar score, NICU admission, gestational age at birth. | |
| Notes | ||
| Risk of bias | ||
| Bias | Authors' judgement | Support for judgement |
| Random sequence generation (selection bias) | Low risk | Random number table. Permuted blocks with variable block size. The randomisation schedule was kept in pharmacy. |
| Allocation concealment (selection bias) | Low risk | Coded drug boxes prepared by pharmacy. |
| Blinding (performance bias and detection bias) | Low risk | Placebo controlled trial. |
| Blinding (performance bias and detection bias) | Low risk | Investigators blind. |
| Blinding (performance bias and detection bias) | Unclear risk | Unclear if obstetric staff other than investigators blind to study participation. Outcome assessment not mentioned. |
| Incomplete outcome data (attrition bias) | Low risk | State that "no post randomisation exclusions were allowed". All women included in the analysis. |
| Selective reporting (reporting bias) | Unclear risk | Specific outcomes not specified in methods text, though categories were such as 'neonatal outcomes'. |
| Other bias | Low risk | No baseline imbalance apparent. |
| Methods | RCT, 2 arm trial. | |
| Participants | Setting: district hospital in southern Nigeria, 2000 to 2001. 77 women randomised. Inclusion criteria: women with gestational age > 40 weeks, Bishop score < 9, uncomplicated pregnancy, candidates for vaginal birth (lack of current indication for induction), singleton gestation in cephalic presentation. Exclusion criteria: women with previous CS, vaginal bleeding, ruptured membranes of indication for immediate IOL, uncertain dates, non reactive stress test or estimated fetal weight > 4500 g. | |
| Interventions | Intervention group: vaginal misoprostol 25 µg (quarter of 100 µg tablet). Comparison group: expectant management with gentle vaginal examinations only. Women were monitored for 1 h after treatment. If regular contractions started women were admitted otherwise they were discharged home. | |
| Outcomes | Time to birth, GA at birth, proportion of women requiring induction for post‐term birth, length of labour, incidence and severity of side effects, perinatal mortality, Apgar score, NICU admission. | |
| Notes | Unbalanced randomisation 24 in intervention group versus 12 in control group. | |
| Risk of bias | ||
| Bias | Authors' judgement | Support for judgement |
| Random sequence generation (selection bias) | Low risk | Computer generated. |
| Allocation concealment (selection bias) | Low risk | Sealed, sequentially numbered envelopes (not stated that envelopes opaque). |
| Blinding (performance bias and detection bias) | High risk | Described as an "open" RCT. |
| Blinding (performance bias and detection bias) | High risk | Blinding not mentioned; trial described as open. |
| Blinding (performance bias and detection bias) | High risk | Blinding not mentioned; trial described as open. |
| Incomplete outcome data (attrition bias) | Low risk | Outcome data were available for all women randomised. |
| Selective reporting (reporting bias) | Unclear risk | Outcomes mentioned in the methods text are reported, but so are many other outcomes. Side effects are mentioned in the methods text and abstract but not defined specifically, so unable to say if these are reported. |
| Other bias | High risk | Nulliparous women was different in either arm (58% in misoprostol arm versus 49% in control arm). Groups otherwise similar at baseline. |
| Methods | RCT, 2 arm trial. | |
| Participants | Setting: USA. FHR tracings and uterine activity monitored for 20 minutes before randomisation. Inclusion criteria: 294 women who had 1 previous CS and were candidates for vaginal birth with accurate gestational age dating (39 to 41 weeks) by ultrasound before 20 weeks, with no signs of labour, no fetal growth abnormalities and reassuring FHR tracing. Bishop score < 6. Exclusion criteria: malpresentation, multiple pregnancies, diabetes, hypertension, vaginal bleeding, ruptured membranes, cephalopelvic disproportion, contraindication to oxytocic drugs or hypersensitivity to PGE₂, > 1 previous CS. | |
| Interventions | Intervention group: intracervical PGE₂ 0.5 mg. Women were monitored for 2 h after insertion. Comparison group: expectant management. Women in both groups were reviewed at 40 and 41 weeks for routine assessments. | |
| Outcomes | Further induction agents required, uterine hyperstimulation, CS, instrumental vaginal birth, maternal infection, Apgar score at 5 min, side effects, birthweight. | |
| Notes | ||
| Risk of bias | ||
| Bias | Authors' judgement | Support for judgement |
| Random sequence generation (selection bias) | Low risk | Computer generated sequence provided by pharmaceutical company. |
| Allocation concealment (selection bias) | Unclear risk | "Blocks of the list were sent with the drugs to the study centres where new subjects were assigned to the next number on the list to determine treatment group." |
| Blinding (performance bias and detection bias) | High risk | Study described as "open‐label"; women in the intervention group would have been aware of having to go for additional appointments to receive a gel. |
| Blinding (performance bias and detection bias) | High risk | Not feasible. Study says investigators masked to assignment but unclear if study investigators were in charge of prenatal and obstetric care of all participant women. |
| Blinding (performance bias and detection bias) | Unclear risk | Outcome assessors not mentioned. |
| Incomplete outcome data (attrition bias) | Low risk | 300 were enrolled but 6 were not included in analysis "because of improper entry or non compliance with clinic visits". |
| Selective reporting (reporting bias) | Unclear risk | Several categories of possible outcomes mentioned in methods text. |
| Other bias | Unclear risk | Groups appeared similar at baseline. Research was supported by the manufacturers of the study intervention (Prepidil). |
| Methods | Unblinded, pragmatic, parallel multicenter RCT. | |
| Participants | Setting: multicentre, midwifery practices in Netherlands. The study began in 4 midwifery practices, but by the end of the study period recruitment had been rolled out to 46 midwifery practices in the Netherlands. Inclusion criteria
Exclusion criteria
| |
| Interventions | Intervention group (N = 270): amniotomy in an outpatient setting (at home) for induction between 292 and 294 days gestation. Control group (N = 251): routine care following the Dutch guideline for management of post term pregnancy. The Guideline prescribed referral to an obstetrician for fetal assessment on the morning of day 294. | |
| Outcomes | Primary outcomes
Secondary outcomes
Intervention group only
| |
| Notes | PhD thesis. | |
| Risk of bias | ||
| Bias | Authors' judgement | Support for judgement |
| Random sequence generation (selection bias) | Low risk | A computerised randomisation service was carried out by an independent Medical Call Centre available for telephone contact 24 h per day, 7 days a week. While random sequence generation was adequate, there were 2 problems:
Above issues do not appear to have affected the random sequence itself. Hence, low risk of bias. |
| Allocation concealment (selection bias) | Low risk | Telephone assignment. |
| Blinding (performance bias and detection bias) | High risk | It was not possible to blind participants. |
| Blinding (performance bias and detection bias) | High risk | It was not possible to blind participants, midwives, or other caregivers. |
| Blinding (performance bias and detection bias) | High risk | Outcome assessors stated as not blind. |
| Incomplete outcome data (attrition bias) | High risk | Intervention
Control
Responses to the satisfaction survey were not balanced (221 and 183), the response rate was likely affected by the intervention (women in intervention arm were in the home, so response rate was higher). |
| Selective reporting (reporting bias) | Low risk | Stated outcomes are reported. |
| Other bias | Low risk | Baseline demographics similar. |
| Methods | RCT. | |
| Participants | Setting: post‐dates clinic in Florida hospital USA. 50 women with prolonged pregnancy (> 41 weeks, 287 days). Inclusion criteria: reactive NST and normal ultrasound, EDD confirmed by menstrual dates, clinical exam and early ultrasound. Bishop score < 9. Exclusion criteria: malpresentations, multiple pregnancy, diabetes, hypertension, vaginal bleeding, abnormal FHR, established contractions, macrosomia (> 4500 g), FGR, fetal abnormalities or oligohydramnios. | |
| Interventions | Intervention group: Intravaginal PGE₂ gel 2 mg. Repeated twice weekly. Comparison group: placebo gel. Repeated twice weekly. Uterine activity and FHR was monitored for 1 to 2 h after gel insertion, if no regular contractions or side effects, women were discharged home returning for weekly sonograms and AFV assessment, and returning twice weekly for NST and repeat interventions. | |
| Outcomes | Further induction agents required, uterine hyperstimulation, CS, NICU admission. | |
| Notes | ||
| Risk of bias | ||
| Bias | Authors' judgement | Support for judgement |
| Random sequence generation (selection bias) | Unclear risk | "randomly generated assignments." |
| Allocation concealment (selection bias) | Unclear risk | "drawing of envelopes." |
| Blinding (performance bias and detection bias) | Low risk | Placebo controlled study. |
| Blinding (performance bias and detection bias) | Low risk | Placebo controlled study. |
| Blinding (performance bias and detection bias) | Unclear risk | Not reported. |
| Incomplete outcome data (attrition bias) | Low risk | All women randomised accounted for in the analysis. |
| Selective reporting (reporting bias) | Low risk | Stated outcomes are reported. |
| Other bias | Low risk | Baseline demographics similar between groups. |
| Methods | RCT. | |
| Participants | Setting: 91 women with prolonged pregnancy (gestational age > 41 weeks) attending a Florida, USA hospital. Inclusion criteria: uncomplicated pregnancy, reliable dating, Bishop score < 9, reactive NST and ultrasound. Exclusion criteria: vaginal bleeding, ruptured membranes, macrosomia (estimated fetal weight > 4500 g) previous uterine surgery or stillbirth, abnormal FHR or ultrasound, regular contractions. | |
| Interventions | Intervention group: daily self‐administered vaginal PGE₂ 2 mg before bed (women were given instructions re placement and storage of suppositories). Comparison group: self‐administered placebo. Telephone contact available 24 h for both groups. Twice weekly clinic attendance for post‐dates surveillance (NST and AFV); induction if indicated or at 44 weeks. | |
| Outcomes | CS rates, chorioamnionitis, Apgar score at 5 min, NICU admission. | |
| Notes | Costs data reported. | |
| Risk of bias | ||
| Bias | Authors' judgement | Support for judgement |
| Random sequence generation (selection bias) | Low risk | Computer generated. |
| Allocation concealment (selection bias) | Low risk | Coded drug boxes. |
| Blinding (performance bias and detection bias) | Low risk | Described as "double blind" placebo controlled. |
| Blinding (performance bias and detection bias) | Low risk | Described as "double blind" placebo controlled. |
| Blinding (performance bias and detection bias) | Unclear risk | Outcomes assessors not mentioned. |
| Incomplete outcome data (attrition bias) | High risk | 91 were enrolled but 11 were lost to follow up (3 were excluded as they were non compliant). |
| Selective reporting (reporting bias) | Low risk | Outcomes stated in methods text are reported. |
| Other bias | Low risk | baseline demographics similar between groups. |
| Methods | Randomised, multicentre, double‐blind, placebo‐controlled RCT. | |
| Participants | Setting: 11 French university hospital referral maternity units that collaborate in the “Groupe de Recherche en Obstétrique et Gynécologie” (Obstetrics and Gynecology Research Group). Inclusion criteria
Exclusion criteria
Contra‐indications to IMN treatment (known hypersensitivity to it, cardiovascular collapse, aortic stenosis, mitral stenosis, obstructive myocardial hypertrophy, systolic blood pressure < 95 mm Hg). | |
| Interventions | Experimental intervention (N = 684) Cervical ripening: 2 tablets of 20 mg isosorbide‐5‐mononitrate were taken from identical blister packs and inserted by midwives into the posterior vaginal fornix Intervention protocol: administered at 41 + 0, 41 + 2 and 41 + 4 weeks, or until cervix favourable, or fetal status abnormal, where labour was induced If 41 + 5 weeks was reached, labour was induced (in hospital) Control (N = 689) 2 placebo tablets of similar design were taken from identical blister packs and inserted by midwives into the posterior vaginal fornix | |
| Outcomes | Primary outcome
Secondary outcomes
| |
| Notes | Schmitz 2014 is a brief abstract published on the same trial. | |
| Risk of bias | ||
| Bias | Authors' judgement | Support for judgement |
| Random sequence generation (selection bias) | Low risk | Eligible women were randomly assigned by obstetricians or midwives using a web‐based application in a 1‐to‐1 ratio to the IMN or placebo groups; the application was based on a computer‐generated list with permuted blocks of 4 stratified by maternity units. |
| Allocation concealment (selection bias) | Low risk | The allocation sequence was not available to any member of the research team until the database was completed and locked. Patients, study staff, and data analysts were masked to assignment. |
| Blinding (performance bias and detection bias) | Low risk | Article states “Patients, study staff, and data analysts were masked to assignment". |
| Blinding (performance bias and detection bias) | Low risk | Article states “Patients, study staff, and data analysts were masked to assignment". |
| Blinding (performance bias and detection bias) | Low risk | Trained research nurses recorded outcomes from hospital notes and entered data into a web‐based data‐capture system. Article states “Patients, study staff, and data analysts were masked to assignment". |
| Incomplete outcome data (attrition bias) | High risk | Only 1 woman lost to follow up. Missing values accounted for < 1% of all results, except for arterial cord blood pH (18%) and maternal satisfaction criteria (23%). Article states a post‐randomisation exclusion, that were not included in analysis: “Ten women (0.7%), five in each group, were secondarily excluded from the analysis because they did not meet the inclusion criteria”. While balanced, this exclusion may cause bias. |
| Selective reporting (reporting bias) | High risk | Maternal and neonatal ICU admission rates not reported, although were pre‐specified outcomes. |
| Other bias | Low risk | Baseline characteristics similar apart from maternal age; women were slightly older in the treatment group. |
| Methods | RCT, 2 arm trial. | |
| Participants | Setting: 36 women attending hospital in Stockholm, Sweden. Inclusion criteria: maternal or fetal indications for labour induction, women in whom labour induction could be deferred for 48 h, Bishop score < 6, single pregnancy, head presentation and intact membranes. All women were 14 days post‐term and scheduled for induction, but where IOL could be postponed for 48 h. Exclusion criteria: parity > 4, contra‐indications to vaginal birth, oligohydramnios, prior uterine surgery, obstetric or medical complications. | |
| Interventions | Intervention group: 400 mg mifepristone. Comparison group: placebo. Women returned for review after 24 h and 48 h if labour did not start. If Bishop score > 6 then ARM and oxytocin induction, if < 6 then PGE₂ 0.5 mg intracervical up to 2 treatments. | |
| Outcomes | Labour within 48 h, Mode of onset of labour, ripe cervix within 48 h, birth within 48 h, need for PGE₂ for cervical ripening, change in Bishop score, duration of labour, interval from treatment to admission in labour, Apgar score, umbilical pH, maternal and neonatal serum concentrations of mifepristone at birth. | |
| Notes | ||
| Risk of bias | ||
| Bias | Authors' judgement | Support for judgement |
| Random sequence generation (selection bias) | Low risk | Random number tables. |
| Allocation concealment (selection bias) | Low risk | Coded drug boxes, "sealed pre‐numbered boxes containing either mifepristone or placebo tablets". |
| Blinding (performance bias and detection bias) | Low risk | "...the type of treatment the women were given was not known until the entire study was finished". |
| Blinding (performance bias and detection bias) | Low risk | Study described as blinded. |
| Blinding (performance bias and detection bias) | Low risk | Study described as blinded. |
| Incomplete outcome data (attrition bias) | Low risk | No losses to follow up apparent. |
| Selective reporting (reporting bias) | Unclear risk | Many more outcomes reported than mentioned in methods text. FHR and uterine contractility not mentioned specifically in results text. |
| Other bias | Unclear risk | Some baseline imbalance, intervention group 79% primiparous versus 58% in the control group. |
| Methods | RCT. | |
| Participants | Setting: USA, naval medical centre. 50 women. Inclusion criteria: women with prolonged pregnancy (41 to 42 weeks' gestation) confirmed by ultrasound, clinical examination and menstrual dates. Singleton, cephalic presentation, intact membranes, Bishop score < 5, < 8 contractions per h, AFI > 5 cm, reactive NST, maternal age > 18, < 50 years. Exclusion criteria: malpresentations, multiple pregnancy, previous CS, vaginal bleeding, ruptured membranes, non reactive NST, estimated fetal weight > 4500 g or < 2000 g, placenta previa, active herpes, hypersensitivity to prostaglandin, signs of infection, asthma or serious disease. | |
| Interventions | Intervention group: vaginal misoprostol 25 µg (with second dose after 24 h). Comparison group: placebo, packaged and labelled to appear indistinguishable. Both groups were observed for 4 h with FHR and uterine activity monitoring. If women showed no sign of labour of fetal distress they were discharged and asked to return after 24 h for a second dose, then review after a further 24 h for inpatient management. | |
| Outcomes | Uterine hyperstimulation, CS, Apgar score < 7 at 5 min, meconium staining. | |
| Notes | ||
| Risk of bias | ||
| Bias | Authors' judgement | Support for judgement |
| Random sequence generation (selection bias) | Low risk | Computer generated sequence by pharmacy (permuted block design). |
| Allocation concealment (selection bias) | Low risk | The list was maintained by inpatient pharmacy and drugs were dispensed to appear identical. |
| Blinding (performance bias and detection bias) | Low risk | Women would not have been aware of assignment; treatment and placebo identical. |
| Blinding (performance bias and detection bias) | Low risk | Investigators and other obstetric staff blind to group assignment. |
| Blinding (performance bias and detection bias) | Low risk | Outcome assessors not described, but all staff described as blind until analysis completed. |
| Incomplete outcome data (attrition bias) | Low risk | No apparent loss to follow up. |
| Selective reporting (reporting bias) | Unclear risk | Only primary outcome stated in methods text; fetal outcomes not specified. |
| Other bias | Low risk | Baseline demographics comparable. |
AFI: amniotic fluid index
AFV: amniotic fluid volume
ARM: artificial rupture of membranes
CPD: cephalo‐pelvic disproportion
CS: caesarean section
EDD: expected date of delivery
EFW: estimated fetal weight
FGR: fetal growth retardation
FHR: fetal heart rate
GA: gestational age
h: hour/s
IMN: isosorbide mononitrate
ISMN:isosorbide mononitrate
IOL: induction of labour
ITT: intention‐to‐treat
NHS: National Health Service (UK)
NICU: neonatal intensive care unit
NST: non‐stress test
PGE: progesterone
PPH: postpartum haemorrhage
PROM: premature rupture of the membranes
RCT: randomised controlled trial
SOL: spontaneous onset of labour
Characteristics of excluded studies [ordered by study ID]
| Study | Reason for exclusion |
| This study examined breast stimulation and used a cross‐over design. Women were allocated to either breast stimulation versus no stimulation; after 3 days, if labour had not started women crossed over into the other study group. | |
| Very little information was provided on study methods. It was not clear this was a RCT. | |
| In this study breast stimulation was compared with an oxytocin infusion. It was not clear that women in the oxytocin group were discharged home. | |
| This study used a cross‐over design. | |
| In this study intravaginal PGE₂ with or without membrane sweeping was compared with placebo with or without membrane sweeping. Complex interventions or interventions involving membrane sweeping are not included in this review. | |
| In this study women received a range of homeopathic herbal preparations versus placebo. The intervention was to prepare women for childbirth generally rather than to induce labour. | |
| This study focused on breast stimulation and used a cross‐over design. | |
| It was not clear that this was a RCT: "the assignment [of medication] to patients was by consecutive entry into either of the studies". The paper described findings for 2 separate studies both examining the use of intracervical porcine ovarian relaxin. The first study appeared to be conducted in hospital and women receiving medication were compared with a control group. In the "outpatient study" there was no control group; women received either 2 mg or 4 mg of relaxin 5 to 7 days before scheduled induction; no outcomes were reported relevant for inclusion in the review. | |
| This study compared castor oil with no treatment, women were alternately allocated to groups; otherwise there was little information on methods. | |
| This study was reported in a brief abstract and insufficient information was available on methods and results to include the study. We contacted the study author and further data are not available. | |
| This study examined intracervical prostaglandin. Little information was provided on study methods. Women "randomized" to the intervention group received intracervical PGE₂ and then monitored for 4 h to 6 h, some had a repeat dose after 6 h, some had a repeat dose the next day and if labour did not start on the third day these women were admitted to hospital for amniotomy and oxytocin infusion. It was not clear what happened to women in the control group other than that they had weekly fetal monitoring; these women were not admitted unless there were signs of abnormality or until they reached 44 weeks' gestation. The management of women in the 2 groups was so different that results are difficult to interpret. | |
| This study focused on nipple stimulation. Group allocation was by a quasi‐randomised method; there were serious protocol violations and analysis was not by randomisation group making results very difficult to interpret. | |
| This study focused on membrane sweeping. This intervention is not included in this review. | |
| This study was reported in a very brief abstract. No original data were presented in the results. | |
| This study compared PGE₂ and membrane sweeping. Membrane sweeping is not included in this review. | |
| This study was reported in a brief abstract. It was not clear that it was a RCT. We were unable to find contact details for the author to obtain further information. | |
| This study focused on extra‐amniotic saline infusion, an intervention rarely used nowadays. It was not clear that this intervention was carried out in an outpatient setting. | |
| This quasi randomised trial compared women receiving vaginal PGE₂ with expectant management. Analysis was not by randomisation group. Of 96 cases randomised to PGE₂ 26 preferred expectant management and were therefore omitted from the analysis. As there was no intention‐to‐treat analysis results of this study were very difficult to interpret. | |
| In this study some of the women included in the study were admitted to hospital rather that being treated as outpatients. No separate results were available for women in the outpatient group. | |
| This RCT was not conducted in outpatient setting. | |
| In this study membrane sweeping was compared with oxytocin for labour induction. It was not clear that women were discharged home after interventions and membrane sweeping is not included in this review. | |
| This study focused on breast stimulation and used a cross‐over design. Women were allocated to either breast stimulation versus no stimulation; after 3 days, if labour had not started women crossed over into the other study group. | |
| The intervention in this trial was an intracervical injection of hyaluronidase. This intervention is no longer used in clinical practice. | |
| It was not clear that this intervention was carried out in an outpatient setting or that women were discharged home after treatment. | |
| This study compared dexamethasone with oxytocin. it was not clear that the intervention was carried out in an outpatient setting. |
h: hour/s
RCT: randomised controlled trial
Characteristics of studies awaiting assessment [ordered by study ID]
| Methods | Double blind RCT. |
| Participants | 30 women at term (40 to 41 weeks) with a Bishop score < 7. |
| Interventions | Intervention: (2 groups) 200 µg or 100 µg of oral misoprostol. Comparison group: placebo. FHR and uterine monitoring for 2 h after medication. Procedure was repeated after 3 days if labour did not start until 42 weeks. |
| Outcomes | Interval to birth, CS, Induction at 42 weeks, hyperstimulation, Apgar scores. |
| Notes | This study was reported in a brief abstract and the data were described as "preliminary". We attempted to contact authors for further information (8 September 2009). A repeat attempt was made to contact authors as part of the update of this review (1 September 2016). |
| Methods | Open RCT. |
| Participants | Setting: Mahdieh hospital, Tehran, Iran. Eligibility criteria not specified. |
| Interventions | Randomised at 40 weeks' gestation to receive 25 µg vaginal misoprostol (N = 22) or placebo (N = 22) on an outpatient basis. Women allowed to go into spontaneous labour, unless an indication for induction developed. |
| Outcomes | Incidence of post term birth, misoprostol side‐effects and neonatal outcomes. |
| Notes | This study was reported in a brief abstract, and available data did not align with primary outcomes of the review. We attempted to contact authors for further information (1 September 2016). |
| Methods | Double blind RCT. |
| Participants | 50 primiparous women with unfavourable cervix with gestational age > 41 weeks. |
| Interventions | Intervention group: 2 tablets (400 mg) mifepristone 48 h before scheduled induction of labour. Comparison group: 2 tablets placebo. |
| Outcomes | Interval to birth, CS, onset of spontaneous labour. |
| Notes | This study was reported in a brief abstract. The setting was not clear. We attempted to contact the authors for further information (11 September 2009). A repeat attempt was made to contact authors as part of the update of this review (1 September 2016). |
CS: caesarean section
FHR: fetal heart rate
h: hour/s
RCT: randomised controlled trial
Data and analyses
| Outcome or subgroup title | No. of studies | No. of participants | Statistical method | Effect size |
| 1 Additional induction agents required Show forest plot | 2 | 150 | Risk Ratio (M‐H, Fixed, 95% CI) | 0.52 [0.27, 0.99] |
| Analysis 1.1  Comparison 1 Intravaginal PGE₂ gel versus placebo or expectant management, Outcome 1 Additional induction agents required. | ||||
| 2 Epidural Show forest plot | 1 | 100 | Risk Ratio (M‐H, Fixed, 95% CI) | 0.83 [0.62, 1.12] |
| Analysis 1.2 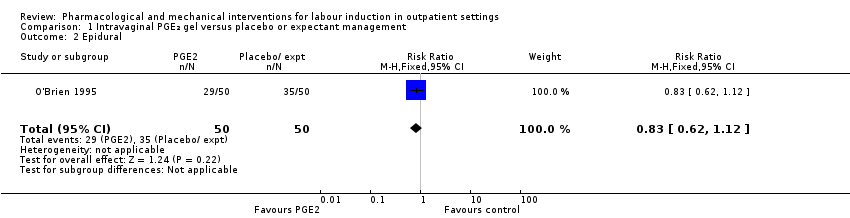 Comparison 1 Intravaginal PGE₂ gel versus placebo or expectant management, Outcome 2 Epidural. | ||||
| 3 Uterine hyperstimulation (FHR changes unclear) Show forest plot | 4 | 244 | Risk Ratio (M‐H, Fixed, 95% CI) | 3.76 [0.64, 22.24] |
| Analysis 1.3 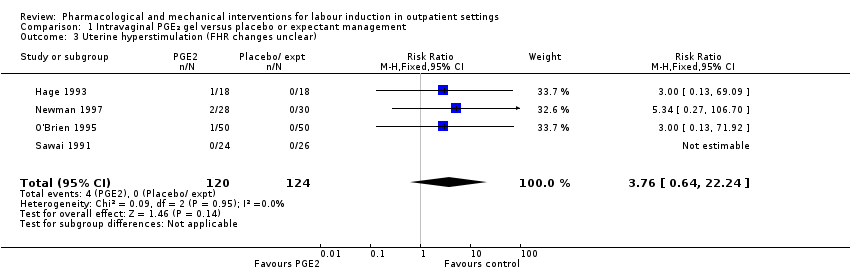 Comparison 1 Intravaginal PGE₂ gel versus placebo or expectant management, Outcome 3 Uterine hyperstimulation (FHR changes unclear). | ||||
| 4 Caesarean section Show forest plot | 4 | 288 | Risk Ratio (M‐H, Fixed, 95% CI) | 0.80 [0.49, 1.31] |
| Analysis 1.4  Comparison 1 Intravaginal PGE₂ gel versus placebo or expectant management, Outcome 4 Caesarean section. | ||||
| 5 Apgar score < 7 at 5 minutes Show forest plot | 2 | 180 | Risk Ratio (M‐H, Fixed, 95% CI) | 0.45 [0.07, 2.93] |
| Analysis 1.5  Comparison 1 Intravaginal PGE₂ gel versus placebo or expectant management, Outcome 5 Apgar score < 7 at 5 minutes. | ||||
| 6 NICU admission Show forest plot | 3 | 230 | Risk Ratio (M‐H, Fixed, 95% CI) | 0.32 [0.10, 1.03] |
| Analysis 1.6 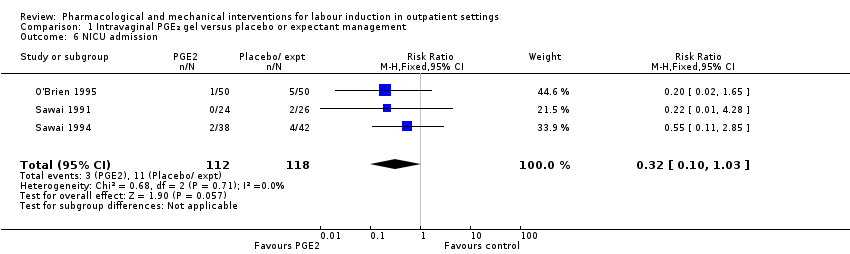 Comparison 1 Intravaginal PGE₂ gel versus placebo or expectant management, Outcome 6 NICU admission. | ||||
| 7 Chorioamnionitis Show forest plot | 2 | 180 | Risk Ratio (M‐H, Fixed, 95% CI) | 0.37 [0.15, 0.90] |
| Analysis 1.7 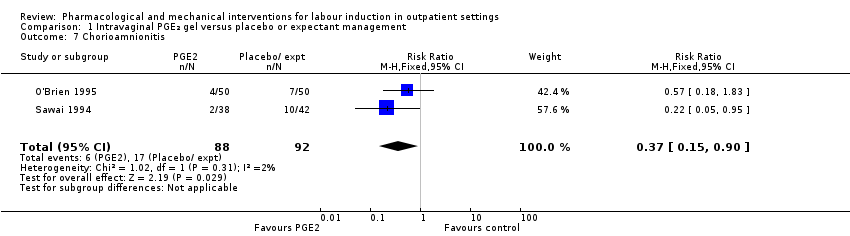 Comparison 1 Intravaginal PGE₂ gel versus placebo or expectant management, Outcome 7 Chorioamnionitis. | ||||
| 8 Indicator of 'progress' in labour ‐ Cervix unchanged at follow up (not pre‐specified) Show forest plot | 1 | 36 | Risk Ratio (M‐H, Fixed, 95% CI) | 0.13 [0.03, 0.47] |
| Analysis 1.8  Comparison 1 Intravaginal PGE₂ gel versus placebo or expectant management, Outcome 8 Indicator of 'progress' in labour ‐ Cervix unchanged at follow up (not pre‐specified). | ||||
| 9 'Spontaneous labour' within 48 hours Show forest plot | 1 | 58 | Risk Ratio (M‐H, Fixed, 95% CI) | 6.43 [2.12, 19.48] |
| Analysis 1.9  Comparison 1 Intravaginal PGE₂ gel versus placebo or expectant management, Outcome 9 'Spontaneous labour' within 48 hours. | ||||
| 10 Indicator of 'progress' in labour ‐ Admitted to hospital for labour Show forest plot | 1 | 100 | Risk Ratio (M‐H, Fixed, 95% CI) | 2.7 [1.47, 4.97] |
| Analysis 1.10 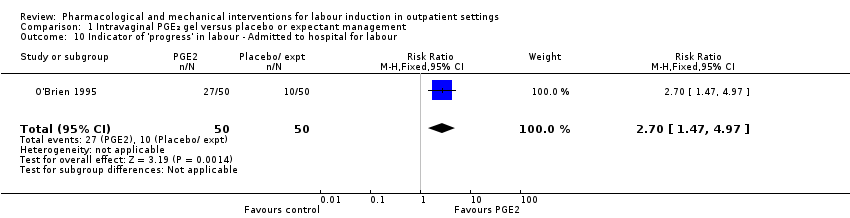 Comparison 1 Intravaginal PGE₂ gel versus placebo or expectant management, Outcome 10 Indicator of 'progress' in labour ‐ Admitted to hospital for labour. | ||||
| 11 Time to birth ‐ Gestational age at birth (weeks) Show forest plot | 1 | 100 | Mean Difference (IV, Fixed, 95% CI) | ‐0.60 [‐0.99, ‐0.21] |
| Analysis 1.11  Comparison 1 Intravaginal PGE₂ gel versus placebo or expectant management, Outcome 11 Time to birth ‐ Gestational age at birth (weeks). | ||||
| 12 Time to birth ‐ Gestational age on admission (days) Show forest plot | 1 | 80 | Mean Difference (IV, Fixed, 95% CI) | ‐2.0 [‐4.17, 0.17] |
| Analysis 1.12  Comparison 1 Intravaginal PGE₂ gel versus placebo or expectant management, Outcome 12 Time to birth ‐ Gestational age on admission (days). | ||||
| Outcome or subgroup title | No. of studies | No. of participants | Statistical method | Effect size |
| 1 Additional induction agent required (induction with oxytocin or other means) Show forest plot | 3 | 445 | Risk Ratio (M‐H, Fixed, 95% CI) | 0.98 [0.74, 1.32] |
| Analysis 2.1  Comparison 2 Intracervical PGE₂ versus placebo, Outcome 1 Additional induction agent required (induction with oxytocin or other means). | ||||
| 2 Additional induction agents required (further prostaglandin required) Show forest plot | 1 | 90 | Risk Ratio (M‐H, Fixed, 95% CI) | 0.61 [0.22, 1.67] |
| Analysis 2.2  Comparison 2 Intracervical PGE₂ versus placebo, Outcome 2 Additional induction agents required (further prostaglandin required). | ||||
| 3 Uterine rupture Show forest plot | 1 | 294 | Risk Ratio (M‐H, Fixed, 95% CI) | 0.0 [0.0, 0.0] |
| Analysis 2.3  Comparison 2 Intracervical PGE₂ versus placebo, Outcome 3 Uterine rupture. | ||||
| 4 Birth not achieved in 48 to 72 hours Show forest plot | 1 | 43 | Risk Ratio (M‐H, Fixed, 95% CI) | 0.83 [0.68, 1.02] |
| Analysis 2.4  Comparison 2 Intracervical PGE₂ versus placebo, Outcome 4 Birth not achieved in 48 to 72 hours. | ||||
| 5 Oxytocin augmentation Show forest plot | 1 | 84 | Risk Ratio (M‐H, Fixed, 95% CI) | 0.67 [0.40, 1.12] |
| Analysis 2.5  Comparison 2 Intracervical PGE₂ versus placebo, Outcome 5 Oxytocin augmentation. | ||||
| 6 Uterine hyperstimulation (with FHR changes) Show forest plot | 4 | 488 | Risk Ratio (M‐H, Fixed, 95% CI) | 2.66 [0.63, 11.25] |
| Analysis 2.6  Comparison 2 Intracervical PGE₂ versus placebo, Outcome 6 Uterine hyperstimulation (with FHR changes). | ||||
| 7 Assisted (instrumental) vaginal birth Show forest plot | 4 | 538 | Risk Ratio (M‐H, Fixed, 95% CI) | 1.29 [0.85, 1.96] |
| Analysis 2.7  Comparison 2 Intracervical PGE₂ versus placebo, Outcome 7 Assisted (instrumental) vaginal birth. | ||||
| 8 Caesarean section Show forest plot | 7 | 674 | Risk Ratio (M‐H, Fixed, 95% CI) | 0.90 [0.72, 1.12] |
| Analysis 2.8  Comparison 2 Intracervical PGE₂ versus placebo, Outcome 8 Caesarean section. | ||||
| 9 Apgar score < 7 at 5 minutes Show forest plot | 4 | 515 | Risk Ratio (M‐H, Fixed, 95% CI) | 0.82 [0.42, 1.60] |
| Analysis 2.9  Comparison 2 Intracervical PGE₂ versus placebo, Outcome 9 Apgar score < 7 at 5 minutes. | ||||
| 10 NICU admission Show forest plot | 3 | 215 | Risk Ratio (M‐H, Fixed, 95% CI) | 1.61 [0.43, 6.05] |
| Analysis 2.10 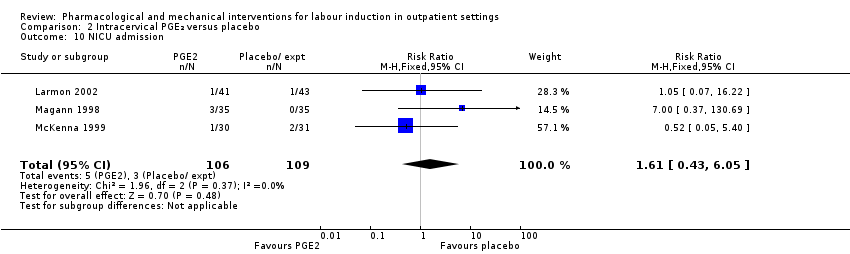 Comparison 2 Intracervical PGE₂ versus placebo, Outcome 10 NICU admission. | ||||
| 11 Postpartum haemorrhage (> 500 mL) Show forest plot | 1 | 61 | Risk Ratio (M‐H, Fixed, 95% CI) | 3.10 [0.13, 73.16] |
| Analysis 2.11 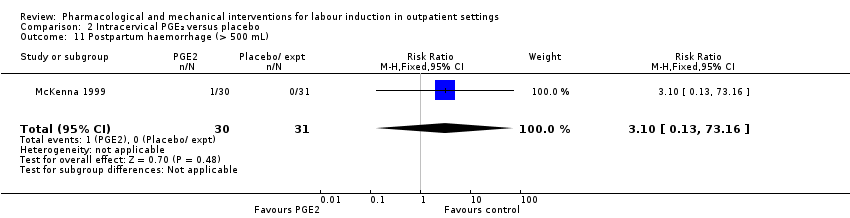 Comparison 2 Intracervical PGE₂ versus placebo, Outcome 11 Postpartum haemorrhage (> 500 mL). | ||||
| 12 Chorioamnionitis Show forest plot | 3 | 468 | Risk Ratio (M‐H, Fixed, 95% CI) | 2.03 [0.66, 6.18] |
| Analysis 2.12  Comparison 2 Intracervical PGE₂ versus placebo, Outcome 12 Chorioamnionitis. | ||||
| 13 Endometritis Show forest plot | 2 | 174 | Risk Ratio (M‐H, Fixed, 95% CI) | 1.60 [0.27, 9.37] |
| Analysis 2.13  Comparison 2 Intracervical PGE₂ versus placebo, Outcome 13 Endometritis. | ||||
| 14 Side effects ‐ Maternal side effects Show forest plot | 2 | 384 | Risk Ratio (M‐H, Fixed, 95% CI) | 0.59 [0.13, 2.77] |
| Analysis 2.14  Comparison 2 Intracervical PGE₂ versus placebo, Outcome 14 Side effects ‐ Maternal side effects. | ||||
| 15 Time to birth ‐ Interval from intervention to birth (days) Show forest plot | 2 | 133 | Std. Mean Difference (IV, Fixed, 95% CI) | ‐0.20 [‐0.55, 0.14] |
| Analysis 2.15  Comparison 2 Intracervical PGE₂ versus placebo, Outcome 15 Time to birth ‐ Interval from intervention to birth (days). | ||||
| 16 Time to birth ‐ Gestational age at birth (weeks) Show forest plot | 2 | 156 | Mean Difference (IV, Random, 95% CI) | ‐0.06 [‐0.35, 0.23] |
| Analysis 2.16  Comparison 2 Intracervical PGE₂ versus placebo, Outcome 16 Time to birth ‐ Gestational age at birth (weeks). | ||||
| 17 Indicator of 'progress' in labour ‐ Induction for gestational age > 42 weeks Show forest plot | 2 | Risk Ratio (M‐H, Fixed, 95% CI) | Totals not selected | |
| Analysis 2.17 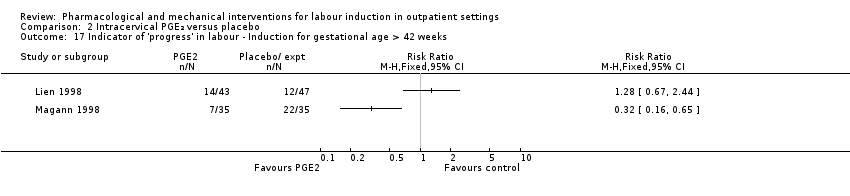 Comparison 2 Intracervical PGE₂ versus placebo, Outcome 17 Indicator of 'progress' in labour ‐ Induction for gestational age > 42 weeks. | ||||
| 18 Time to birth ‐ Birth within 48 hours of treatment (all births) Show forest plot | 1 | 61 | Risk Ratio (M‐H, Fixed, 95% CI) | 3.1 [1.29, 7.47] |
| Analysis 2.18  Comparison 2 Intracervical PGE₂ versus placebo, Outcome 18 Time to birth ‐ Birth within 48 hours of treatment (all births). | ||||
| Outcome or subgroup title | No. of studies | No. of participants | Statistical method | Effect size |
| 1 Serious neonatal morbidity or death Show forest plot | 1 | 77 | Risk Ratio (M‐H, Fixed, 95% CI) | 0.34 [0.01, 8.14] |
| Analysis 3.1  Comparison 3 Vaginal misoprostol versus placebo, Outcome 1 Serious neonatal morbidity or death. | ||||
| 2 Epidural Show forest plot | 1 | 50 | Risk Ratio (M‐H, Fixed, 95% CI) | 0.98 [0.77, 1.26] |
| Analysis 3.2  Comparison 3 Vaginal misoprostol versus placebo, Outcome 2 Epidural. | ||||
| 3 Uterine hyperstimulation (with FHR changes) Show forest plot | 3 | 265 | Risk Ratio (M‐H, Fixed, 95% CI) | 1.97 [0.43, 9.00] |
| Analysis 3.3 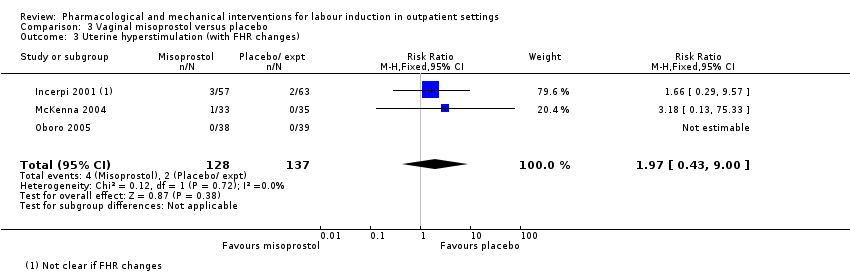 Comparison 3 Vaginal misoprostol versus placebo, Outcome 3 Uterine hyperstimulation (with FHR changes). | ||||
| 4 Uterine hyperstimulation (without FHR changes) Show forest plot | 2 | 137 | Risk Ratio (M‐H, Fixed, 95% CI) | 3.64 [0.15, 85.97] |
| Analysis 3.4  Comparison 3 Vaginal misoprostol versus placebo, Outcome 4 Uterine hyperstimulation (without FHR changes). | ||||
| 5 Assisted (instrumental) vaginal birth Show forest plot | 2 | 145 | Risk Ratio (M‐H, Fixed, 95% CI) | 0.91 [0.50, 1.67] |
| Analysis 3.5 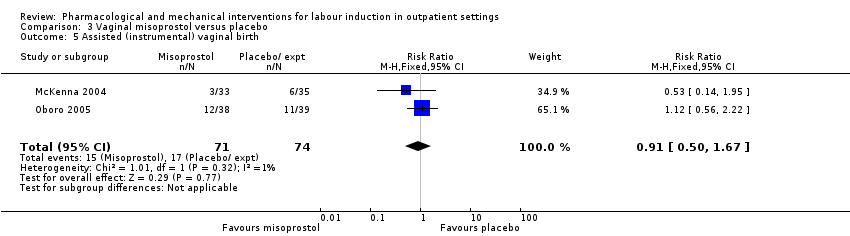 Comparison 3 Vaginal misoprostol versus placebo, Outcome 5 Assisted (instrumental) vaginal birth. | ||||
| 6 Caesarean section Show forest plot | 4 | 325 | Risk Ratio (M‐H, Fixed, 95% CI) | 0.94 [0.61, 1.46] |
| Analysis 3.6  Comparison 3 Vaginal misoprostol versus placebo, Outcome 6 Caesarean section. | ||||
| 7 Apgar score < 7 at 5 minutes Show forest plot | 3 | 248 | Risk Ratio (M‐H, Fixed, 95% CI) | 0.21 [0.01, 4.25] |
| Analysis 3.7 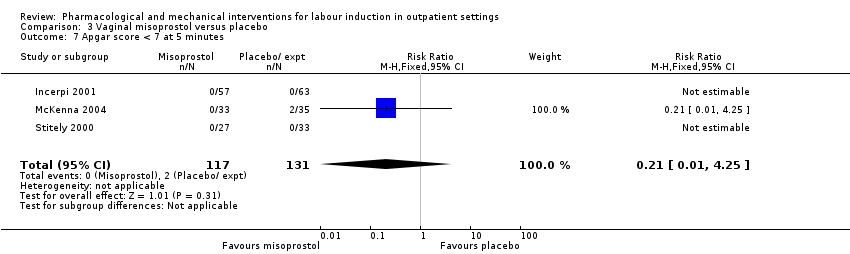 Comparison 3 Vaginal misoprostol versus placebo, Outcome 7 Apgar score < 7 at 5 minutes. | ||||
| 8 NICU admission Show forest plot | 4 | 325 | Risk Ratio (M‐H, Fixed, 95% CI) | 0.89 [0.54, 1.47] |
| Analysis 3.8  Comparison 3 Vaginal misoprostol versus placebo, Outcome 8 NICU admission. | ||||
| 9 Perinatal death Show forest plot | 1 | 77 | Risk Ratio (M‐H, Fixed, 95% CI) | 0.34 [0.01, 8.14] |
| Analysis 3.9  Comparison 3 Vaginal misoprostol versus placebo, Outcome 9 Perinatal death. | ||||
| 10 Neonatal infection Show forest plot | 1 | 68 | Risk Ratio (M‐H, Fixed, 95% CI) | 0.30 [0.07, 1.36] |
| Analysis 3.10  Comparison 3 Vaginal misoprostol versus placebo, Outcome 10 Neonatal infection. | ||||
| 11 Indicator of 'progress' in labour ‐ Oxytocin dose used (mU) Show forest plot | 1 | 72 | Mean Difference (IV, Fixed, 95% CI) | 1508.70 [‐2357.55, 5374.95] |
| Analysis 3.11  Comparison 3 Vaginal misoprostol versus placebo, Outcome 11 Indicator of 'progress' in labour ‐ Oxytocin dose used (mU). | ||||
| 12 Indicator of 'progress' in labour ‐ Number of medication dose Show forest plot | 1 | 60 | Mean Difference (IV, Fixed, 95% CI) | ‐0.44 [‐0.49, ‐0.39] |
| Analysis 3.12 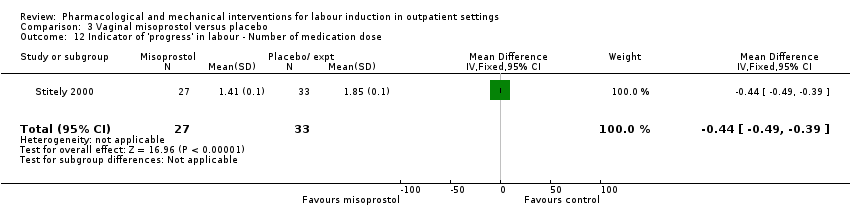 Comparison 3 Vaginal misoprostol versus placebo, Outcome 12 Indicator of 'progress' in labour ‐ Number of medication dose. | ||||
| 13 Indicator of 'progress' in labour ‐ Number of women requiring dosing on day 2 Show forest plot | 1 | 60 | Risk Ratio (M‐H, Fixed, 95% CI) | 0.61 [0.43, 0.87] |
| Analysis 3.13 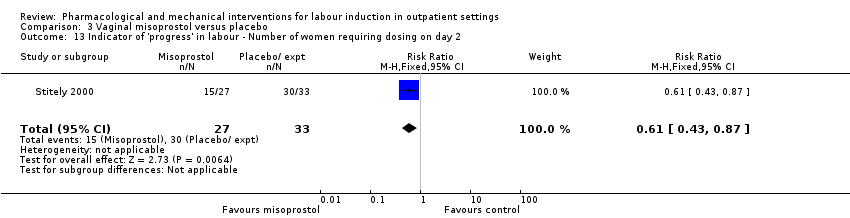 Comparison 3 Vaginal misoprostol versus placebo, Outcome 13 Indicator of 'progress' in labour ‐ Number of women requiring dosing on day 2. | ||||
| 14 Indicator of 'progress' in labour ‐ Number of women requiring induction on day 3 Show forest plot | 1 | 60 | Risk Ratio (M‐H, Fixed, 95% CI) | 0.13 [0.04, 0.38] |
| Analysis 3.14 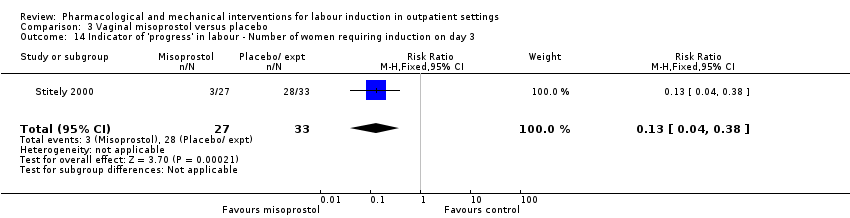 Comparison 3 Vaginal misoprostol versus placebo, Outcome 14 Indicator of 'progress' in labour ‐ Number of women requiring induction on day 3. | ||||
| 15 Indicator of 'progress' in labour ‐ Days to admission (all) (days) Show forest plot | 1 | 77 | Mean Difference (IV, Fixed, 95% CI) | ‐2.90 [‐4.99, ‐0.81] |
| Analysis 3.15  Comparison 3 Vaginal misoprostol versus placebo, Outcome 15 Indicator of 'progress' in labour ‐ Days to admission (all) (days). | ||||
| 16 Indicator of 'progress' in labour ‐ Days to admission (subgroups by parity) (days) Show forest plot | 1 | 77 | Mean Difference (IV, Fixed, 95% CI) | ‐3.15 [‐5.40, ‐0.89] |
| Analysis 3.16  Comparison 3 Vaginal misoprostol versus placebo, Outcome 16 Indicator of 'progress' in labour ‐ Days to admission (subgroups by parity) (days). | ||||
| 16.1 Nulliparous women | 1 | 41 | Mean Difference (IV, Fixed, 95% CI) | ‐3.20 [‐6.44, 0.04] |
| 16.2 Parous women | 1 | 36 | Mean Difference (IV, Fixed, 95% CI) | ‐3.10 [‐6.24, 0.04] |
| 17 Indicator of 'progress' in labour ‐ Gestational age at labour (weeks) Show forest plot | 1 | 77 | Mean Difference (IV, Fixed, 95% CI) | ‐0.80 [‐1.05, ‐0.55] |
| Analysis 3.17  Comparison 3 Vaginal misoprostol versus placebo, Outcome 17 Indicator of 'progress' in labour ‐ Gestational age at labour (weeks). | ||||
| 18 Indicator of 'progress' in labour ‐ Days to admission (parous) (weeks) Show forest plot | 1 | 36 | Mean Difference (IV, Fixed, 95% CI) | ‐3.10 [‐6.24, 0.04] |
| Analysis 3.18  Comparison 3 Vaginal misoprostol versus placebo, Outcome 18 Indicator of 'progress' in labour ‐ Days to admission (parous) (weeks). | ||||
| 19 Indicator of 'progress' in labour ‐ Days to PROM (days) Show forest plot | 1 | 77 | Mean Difference (IV, Fixed, 95% CI) | ‐2.5 [‐4.14, ‐0.86] |
| Analysis 3.19 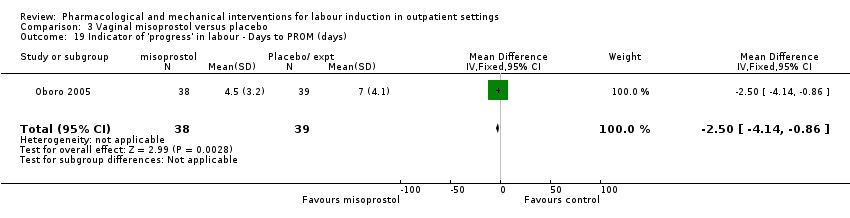 Comparison 3 Vaginal misoprostol versus placebo, Outcome 19 Indicator of 'progress' in labour ‐ Days to PROM (days). | ||||
| 20 Time to birth ‐ Interval from intervention to vaginal birth (days) Show forest plot | 1 | 50 | Mean Difference (IV, Fixed, 95% CI) | ‐1.4 [‐3.51, 0.71] |
| Analysis 3.20 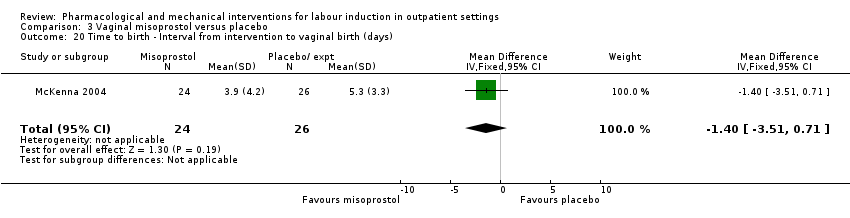 Comparison 3 Vaginal misoprostol versus placebo, Outcome 20 Time to birth ‐ Interval from intervention to vaginal birth (days). | ||||
| 21 Time to birth ‐ Days to birth (all) (days) Show forest plot | 1 | 68 | Mean Difference (IV, Fixed, 95% CI) | ‐1.90 [‐3.74, ‐0.06] |
| Analysis 3.21  Comparison 3 Vaginal misoprostol versus placebo, Outcome 21 Time to birth ‐ Days to birth (all) (days). | ||||
| 22 Time to birth ‐ Days to birth (subgroups by parity) (days) Show forest plot | 1 | Mean Difference (IV, Fixed, 95% CI) | Subtotals only | |
| Analysis 3.22  Comparison 3 Vaginal misoprostol versus placebo, Outcome 22 Time to birth ‐ Days to birth (subgroups by parity) (days). | ||||
| 22.1 Nulliparous women | 1 | 39 | Mean Difference (IV, Fixed, 95% CI) | ‐3.0 [‐5.42, ‐0.58] |
| 22.2 Parous women | 1 | 29 | Mean Difference (IV, Fixed, 95% CI) | ‐0.60 [‐3.51, 2.31] |
| Outcome or subgroup title | No. of studies | No. of participants | Statistical method | Effect size |
| 1 Additional induction agents required (oxytocin) Show forest plot | 1 | 49 | Risk Ratio (M‐H, Fixed, 95% CI) | 2.26 [0.22, 23.33] |
| Analysis 4.1  Comparison 4 Vaginal misoprostol 25 µg versus 50 µg, Outcome 1 Additional induction agents required (oxytocin). | ||||
| 2 Uterine hyperstimulation Show forest plot | 1 | 49 | Risk Ratio (M‐H, Fixed, 95% CI) | 0.0 [0.0, 0.0] |
| Analysis 4.2 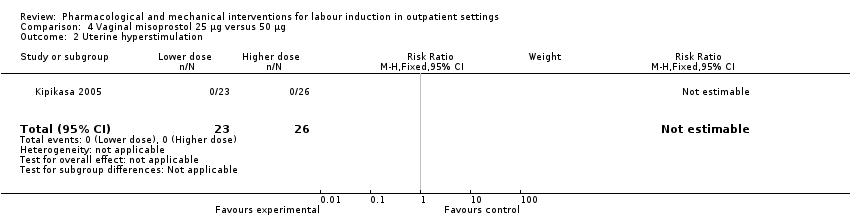 Comparison 4 Vaginal misoprostol 25 µg versus 50 µg, Outcome 2 Uterine hyperstimulation. | ||||
| 3 Caesarean section Show forest plot | 1 | 49 | Risk Ratio (M‐H, Fixed, 95% CI) | 0.94 [0.33, 2.68] |
| Analysis 4.3 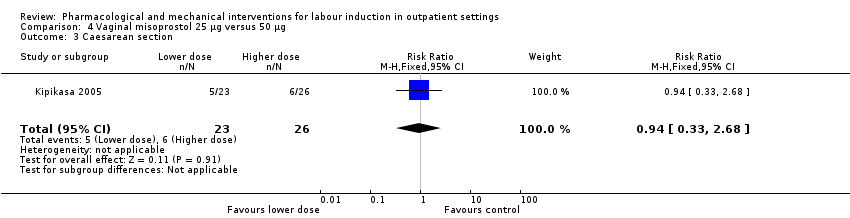 Comparison 4 Vaginal misoprostol 25 µg versus 50 µg, Outcome 3 Caesarean section. | ||||
| 4 NICU admission Show forest plot | 1 | 49 | Risk Ratio (M‐H, Fixed, 95% CI) | 0.57 [0.05, 5.83] |
| Analysis 4.4  Comparison 4 Vaginal misoprostol 25 µg versus 50 µg, Outcome 4 NICU admission. | ||||
| 5 Interval from treatment to birth (in days, all births) Show forest plot | 1 | 49 | Mean Difference (IV, Fixed, 95% CI) | 1.5 [1.19, 1.81] |
| Analysis 4.5  Comparison 4 Vaginal misoprostol 25 µg versus 50 µg, Outcome 5 Interval from treatment to birth (in days, all births). | ||||
| Outcome or subgroup title | No. of studies | No. of participants | Statistical method | Effect size |
| 1 Uterine hyperstimulation (with or without FHR changes) Show forest plot | 1 | 64 | Risk Ratio (M‐H, Fixed, 95% CI) | 0.26 [0.03, 2.73] |
| Analysis 5.1  Comparison 5 Intracervical PGE₂ versus vaginal misoprostol, Outcome 1 Uterine hyperstimulation (with or without FHR changes). | ||||
| 2 Caesarean section Show forest plot | 1 | 84 | Risk Ratio (M‐H, Fixed, 95% CI) | 0.89 [0.38, 2.08] |
| Analysis 5.2  Comparison 5 Intracervical PGE₂ versus vaginal misoprostol, Outcome 2 Caesarean section. | ||||
| 3 Apgar score < 7 after 5 minutes Show forest plot | 1 | 84 | Risk Ratio (M‐H, Fixed, 95% CI) | 0.33 [0.01, 7.96] |
| Analysis 5.3  Comparison 5 Intracervical PGE₂ versus vaginal misoprostol, Outcome 3 Apgar score < 7 after 5 minutes. | ||||
| 4 Admission to NICU Show forest plot | 1 | 84 | Risk Ratio (M‐H, Fixed, 95% CI) | 1.25 [0.36, 4.33] |
| Analysis 5.4  Comparison 5 Intracervical PGE₂ versus vaginal misoprostol, Outcome 4 Admission to NICU. | ||||
| 5 Indicator of 'progress' in labour ‐ Interval from administration to admission (hours) Show forest plot | 1 | 75 | Mean Difference (IV, Fixed, 95% CI) | 2.5 [2.22, 2.78] |
| Analysis 5.5  Comparison 5 Intracervical PGE₂ versus vaginal misoprostol, Outcome 5 Indicator of 'progress' in labour ‐ Interval from administration to admission (hours). | ||||
| 6 Indicator of 'progress' in labour ‐ Labour or SROM during ripening Show forest plot | 1 | 83 | Risk Ratio (M‐H, Fixed, 95% CI) | 0.31 [0.14, 0.69] |
| Analysis 5.6  Comparison 5 Intracervical PGE₂ versus vaginal misoprostol, Outcome 6 Indicator of 'progress' in labour ‐ Labour or SROM during ripening. | ||||
| 7 Time to birth ‐ Birth within 24 hours Show forest plot | 1 | 83 | Risk Ratio (M‐H, Fixed, 95% CI) | 0.90 [0.75, 1.07] |
| Analysis 5.7  Comparison 5 Intracervical PGE₂ versus vaginal misoprostol, Outcome 7 Time to birth ‐ Birth within 24 hours. | ||||
| 8 Time to birth ‐ Birth within 48 hours (cumulative) Show forest plot | 1 | 83 | Risk Ratio (M‐H, Fixed, 95% CI) | 0.93 [0.81, 1.06] |
| Analysis 5.8  Comparison 5 Intracervical PGE₂ versus vaginal misoprostol, Outcome 8 Time to birth ‐ Birth within 48 hours (cumulative). | ||||
| Outcome or subgroup title | No. of studies | No. of participants | Statistical method | Effect size |
| 1 Vaginal delivery not achieved within 24 hours Show forest plot | 1 | 87 | Risk Ratio (M‐H, Fixed, 95% CI) | 0.65 [0.48, 0.86] |
| Analysis 6.1  Comparison 6 Oral misoprostol versus placebo, Outcome 1 Vaginal delivery not achieved within 24 hours. | ||||
| 2 Additional induction agents required Show forest plot | 2 | 127 | Risk Ratio (M‐H, Fixed, 95% CI) | 0.60 [0.37, 0.97] |
| Analysis 6.2  Comparison 6 Oral misoprostol versus placebo, Outcome 2 Additional induction agents required. | ||||
| 3 Oxytocin augmentation Show forest plot | 1 | 87 | Risk Ratio (M‐H, Fixed, 95% CI) | 0.81 [0.61, 1.08] |
| Analysis 6.3  Comparison 6 Oral misoprostol versus placebo, Outcome 3 Oxytocin augmentation. | ||||
| 4 Uterine hyperstimulation (with FHR changes) Show forest plot | 1 | 87 | Risk Ratio (M‐H, Fixed, 95% CI) | 1.53 [0.47, 5.06] |
| Analysis 6.4  Comparison 6 Oral misoprostol versus placebo, Outcome 4 Uterine hyperstimulation (with FHR changes). | ||||
| 5 Uterine hyperstimulation (FHR changes unclear) Show forest plot | 1 | 40 | Risk Ratio (M‐H, Fixed, 95% CI) | 0.61 [0.06, 6.21] |
| Analysis 6.5  Comparison 6 Oral misoprostol versus placebo, Outcome 5 Uterine hyperstimulation (FHR changes unclear). | ||||
| 6 Instrumental vaginal birth Show forest plot | 1 | 87 | Risk Ratio (M‐H, Fixed, 95% CI) | 0.51 [0.17, 1.57] |
| Analysis 6.6  Comparison 6 Oral misoprostol versus placebo, Outcome 6 Instrumental vaginal birth. | ||||
| 7 Caesarean section Show forest plot | 1 | 86 | Risk Ratio (M‐H, Fixed, 95% CI) | 0.62 [0.28, 1.33] |
| Analysis 6.7  Comparison 6 Oral misoprostol versus placebo, Outcome 7 Caesarean section. | ||||
| 8 Apgar score < 7 at 5 minutes Show forest plot | 1 | 87 | Risk Ratio (M‐H, Fixed, 95% CI) | 0.0 [0.0, 0.0] |
| Analysis 6.8 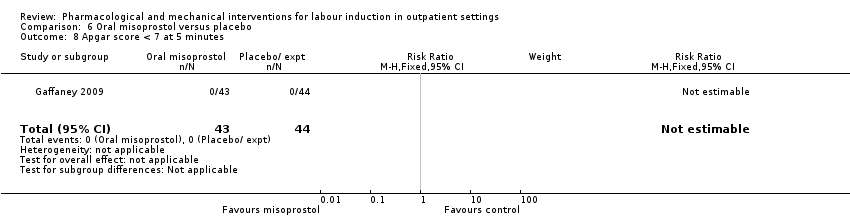 Comparison 6 Oral misoprostol versus placebo, Outcome 8 Apgar score < 7 at 5 minutes. | ||||
| 9 Neonatal intensive care unit admission Show forest plot | 1 | 87 | Risk Ratio (M‐H, Fixed, 95% CI) | 1.02 [0.07, 15.84] |
| Analysis 6.9  Comparison 6 Oral misoprostol versus placebo, Outcome 9 Neonatal intensive care unit admission. | ||||
| 10 Postpartum haemorrhage Show forest plot | 1 | 87 | Risk Ratio (M‐H, Fixed, 95% CI) | 5.11 [0.25, 103.51] |
| Analysis 6.10 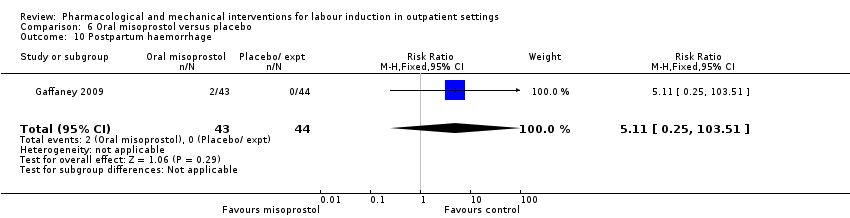 Comparison 6 Oral misoprostol versus placebo, Outcome 10 Postpartum haemorrhage. | ||||
| 11 Chorioamnionitis Show forest plot | 2 | 124 | Risk Ratio (M‐H, Fixed, 95% CI) | 1.06 [0.52, 2.17] |
| Analysis 6.11 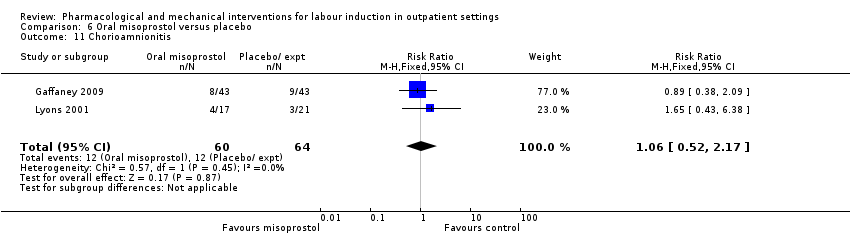 Comparison 6 Oral misoprostol versus placebo, Outcome 11 Chorioamnionitis. | ||||
| 12 Endometritis Show forest plot | 1 | 87 | Risk Ratio (M‐H, Fixed, 95% CI) | 0.51 [0.05, 5.44] |
| Analysis 6.12  Comparison 6 Oral misoprostol versus placebo, Outcome 12 Endometritis. | ||||
| 13 Indicator of 'progress' in labour ‐ Time from first dose to active labor (hours) Show forest plot | 2 | 127 | Mean Difference (IV, Fixed, 95% CI) | ‐37.08 [‐52.44, ‐21.72] |
| Analysis 6.13  Comparison 6 Oral misoprostol versus placebo, Outcome 13 Indicator of 'progress' in labour ‐ Time from first dose to active labor (hours). | ||||
| 14 Time to birth ‐ First dose to birth (hours) Show forest plot | 1 | 87 | Mean Difference (IV, Fixed, 95% CI) | ‐37.94 [‐57.97, ‐17.91] |
| Analysis 6.14  Comparison 6 Oral misoprostol versus placebo, Outcome 14 Time to birth ‐ First dose to birth (hours). | ||||
| 15 Indicator of 'progress' in labour ‐ Total doses of medication Show forest plot | 1 | 40 | Mean Difference (IV, Fixed, 95% CI) | ‐0.51 [‐0.92, ‐0.10] |
| Analysis 6.15 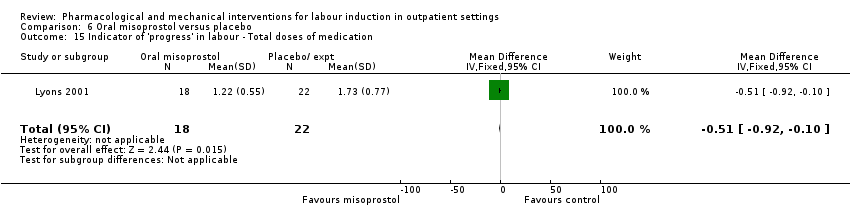 Comparison 6 Oral misoprostol versus placebo, Outcome 15 Indicator of 'progress' in labour ‐ Total doses of medication. | ||||
| Outcome or subgroup title | No. of studies | No. of participants | Statistical method | Effect size |
| 1 Additional induction agents required Show forest plot | 4 | 311 | Risk Ratio (M‐H, Random, 95% CI) | 0.59 [0.37, 0.95] |
| Analysis 7.1 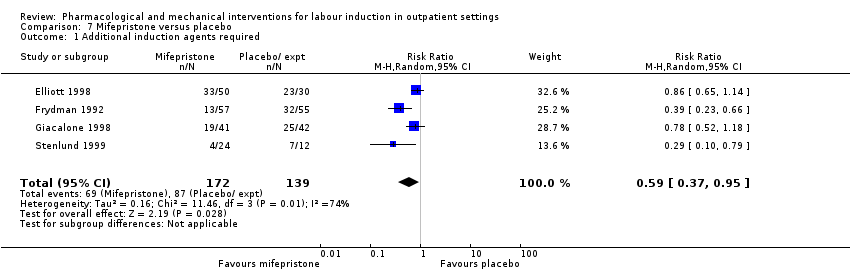 Comparison 7 Mifepristone versus placebo, Outcome 1 Additional induction agents required. | ||||
| 2 Serious neonatal morbidity or death Show forest plot | 1 | 36 | Risk Ratio (M‐H, Fixed, 95% CI) | 1.56 [0.07, 35.67] |
| Analysis 7.2  Comparison 7 Mifepristone versus placebo, Outcome 2 Serious neonatal morbidity or death. | ||||
| 3 Oxytocin augmentation Show forest plot | 2 | 116 | Risk Ratio (M‐H, Fixed, 95% CI) | 0.89 [0.63, 1.26] |
| Analysis 7.3  Comparison 7 Mifepristone versus placebo, Outcome 3 Oxytocin augmentation. | ||||
| 4 Epidural Show forest plot | 1 | 112 | Risk Ratio (M‐H, Fixed, 95% CI) | 0.87 [0.73, 1.03] |
| Analysis 7.4  Comparison 7 Mifepristone versus placebo, Outcome 4 Epidural. | ||||
| 5 Assisted (instrumental) vaginal birth Show forest plot | 5 | 343 | Risk Ratio (M‐H, Fixed, 95% CI) | 1.35 [0.93, 1.97] |
| Analysis 7.5  Comparison 7 Mifepristone versus placebo, Outcome 5 Assisted (instrumental) vaginal birth. | ||||
| 6 Caesarean section Show forest plot | 5 | 343 | Risk Ratio (M‐H, Fixed, 95% CI) | 0.88 [0.62, 1.25] |
| Analysis 7.6 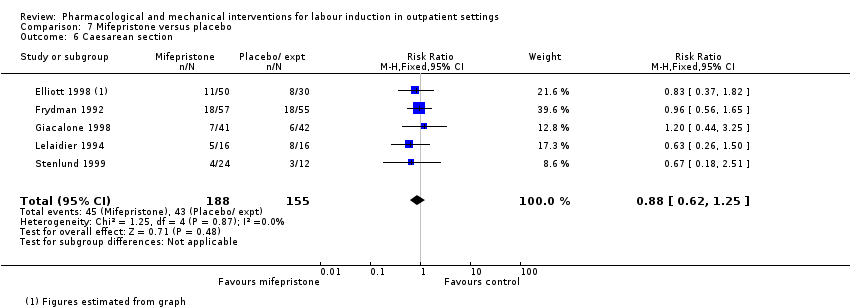 Comparison 7 Mifepristone versus placebo, Outcome 6 Caesarean section. | ||||
| 7 Apgar score < 7 at 5 minutes Show forest plot | 2 | 119 | Risk Ratio (M‐H, Fixed, 95% CI) | 1.56 [0.07, 35.67] |
| Analysis 7.7  Comparison 7 Mifepristone versus placebo, Outcome 7 Apgar score < 7 at 5 minutes. | ||||
| 8 NICU admission Show forest plot | 2 | 163 | Risk Ratio (M‐H, Fixed, 95% CI) | 0.93 [0.31, 2.79] |
| Analysis 7.8 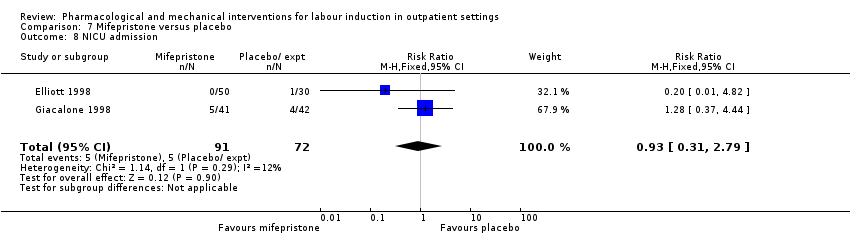 Comparison 7 Mifepristone versus placebo, Outcome 8 NICU admission. | ||||
| 9 Perinatal death Show forest plot | 1 | 32 | Risk Ratio (M‐H, Fixed, 95% CI) | 0.0 [0.0, 0.0] |
| Analysis 7.9  Comparison 7 Mifepristone versus placebo, Outcome 9 Perinatal death. | ||||
| 10 Uterine scar separation Show forest plot | 1 | 32 | Risk Ratio (M‐H, Fixed, 95% CI) | 1.0 [0.07, 14.64] |
| Analysis 7.10 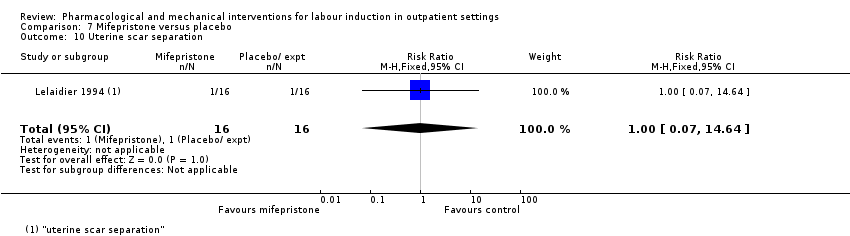 Comparison 7 Mifepristone versus placebo, Outcome 10 Uterine scar separation. | ||||
| 11 Chorioamnionitis Show forest plot | 1 | 32 | Risk Ratio (M‐H, Fixed, 95% CI) | 2.0 [0.20, 19.91] |
| Analysis 7.11 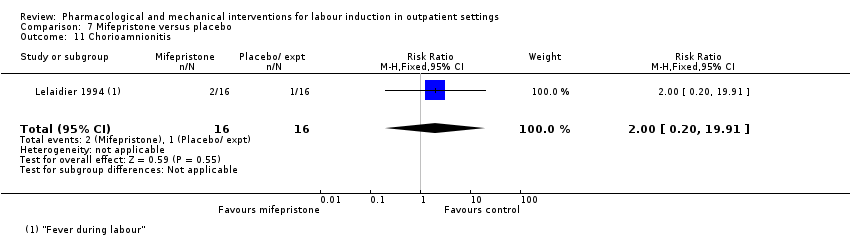 Comparison 7 Mifepristone versus placebo, Outcome 11 Chorioamnionitis. | ||||
| 12 Indicator of 'progress' in labour ‐ Labour or ripe cervix in 48 hours Show forest plot | 1 | 36 | Risk Ratio (M‐H, Fixed, 95% CI) | 2.0 [1.00, 4.00] |
| Analysis 7.12  Comparison 7 Mifepristone versus placebo, Outcome 12 Indicator of 'progress' in labour ‐ Labour or ripe cervix in 48 hours. | ||||
| 13 Indicator of 'progress' in labour ‐ Cervix unchanged after 24/48 hours Show forest plot | 2 | 119 | Risk Ratio (M‐H, Fixed, 95% CI) | 0.36 [0.20, 0.63] |
| Analysis 7.13  Comparison 7 Mifepristone versus placebo, Outcome 13 Indicator of 'progress' in labour ‐ Cervix unchanged after 24/48 hours. | ||||
| 14 Indicator of 'progress' in labour ‐ Spontaneous labour within 72 hours Show forest plot | 1 | 80 | Risk Ratio (M‐H, Fixed, 95% CI) | 1.46 [0.68, 3.10] |
| Analysis 7.14 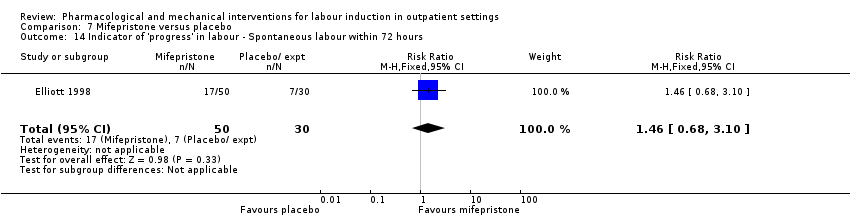 Comparison 7 Mifepristone versus placebo, Outcome 14 Indicator of 'progress' in labour ‐ Spontaneous labour within 72 hours. | ||||
| 15 Indicator of 'progress' in labour ‐ Spontaneous labour within 48 hours Show forest plot | 1 | 83 | Risk Ratio (M‐H, Fixed, 95% CI) | 2.05 [1.27, 3.30] |
| Analysis 7.15 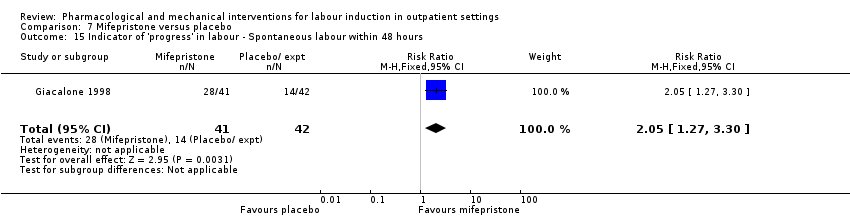 Comparison 7 Mifepristone versus placebo, Outcome 15 Indicator of 'progress' in labour ‐ Spontaneous labour within 48 hours. | ||||
| 16 Indicator of 'progress' in labour ‐ Oxytocin requirements (IU) Show forest plot | 1 | 32 | Mean Difference (IV, Fixed, 95% CI) | ‐2.56 [‐4.01, ‐1.11] |
| Analysis 7.16  Comparison 7 Mifepristone versus placebo, Outcome 16 Indicator of 'progress' in labour ‐ Oxytocin requirements (IU). | ||||
| 17 Indicator of 'progress' in labour ‐ Interval between day 1 and start of labour (hours) Show forest plot | 1 | 32 | Mean Difference (IV, Fixed, 95% CI) | ‐22.15 [‐35.96, ‐8.34] |
| Analysis 7.17  Comparison 7 Mifepristone versus placebo, Outcome 17 Indicator of 'progress' in labour ‐ Interval between day 1 and start of labour (hours). | ||||
| Outcome or subgroup title | No. of studies | No. of participants | Statistical method | Effect size |
| 1 Oxytocin augmentation Show forest plot | 1 | 87 | Risk Ratio (M‐H, Fixed, 95% CI) | 0.93 [0.61, 1.43] |
| Analysis 8.1  Comparison 8 Oestrogens versus placebo, Outcome 1 Oxytocin augmentation. | ||||
| 2 Assisted (instrumental) vaginal birth Show forest plot | 1 | 87 | Risk Ratio (M‐H, Fixed, 95% CI) | 0.84 [0.44, 1.60] |
| Analysis 8.2  Comparison 8 Oestrogens versus placebo, Outcome 2 Assisted (instrumental) vaginal birth. | ||||
| 3 Caesarean section Show forest plot | 1 | 87 | Risk Ratio (M‐H, Fixed, 95% CI) | 1.27 [0.63, 2.58] |
| Analysis 8.3  Comparison 8 Oestrogens versus placebo, Outcome 3 Caesarean section. | ||||
| 4 NICU admission Show forest plot | 1 | 87 | Risk Ratio (M‐H, Fixed, 95% CI) | 0.98 [0.06, 15.13] |
| Analysis 8.4  Comparison 8 Oestrogens versus placebo, Outcome 4 NICU admission. | ||||
| 5 Chorioamnionitis Show forest plot | 1 | 87 | Risk Ratio (M‐H, Fixed, 95% CI) | 1.95 [0.38, 10.12] |
| Analysis 8.5  Comparison 8 Oestrogens versus placebo, Outcome 5 Chorioamnionitis. | ||||
| 6 Endometritis Show forest plot | 1 | 87 | Risk Ratio (M‐H, Fixed, 95% CI) | 2.93 [0.32, 27.10] |
| Analysis 8.6  Comparison 8 Oestrogens versus placebo, Outcome 6 Endometritis. | ||||
| Outcome or subgroup title | No. of studies | No. of participants | Statistical method | Effect size |
| 1 Vaginal birth not achieved in 24/48 hours Show forest plot | 1 | 238 | Risk Ratio (M‐H, Fixed, 95% CI) | 0.97 [0.83, 1.15] |
| Analysis 9.1  Comparison 9 Vaginal isosorbide mononitrate (IMN) versus placebo, Outcome 1 Vaginal birth not achieved in 24/48 hours. | ||||
| 2 Additional induction agents required Show forest plot | 4 | 1921 | Risk Ratio (M‐H, Random, 95% CI) | 0.87 [0.75, 1.00] |
| Analysis 9.2  Comparison 9 Vaginal isosorbide mononitrate (IMN) versus placebo, Outcome 2 Additional induction agents required. | ||||
| 3 Maternal satisfaction Show forest plot | 1 | Mean Difference (IV, Fixed, 95% CI) | Subtotals only | |
| Analysis 9.3  Comparison 9 Vaginal isosorbide mononitrate (IMN) versus placebo, Outcome 3 Maternal satisfaction. | ||||
| 3.1 How do you think your labour went? (easy/very difficult) | 1 | 227 | Mean Difference (IV, Fixed, 95% CI) | ‐0.34 [‐0.94, 0.26] |
| 3.2 What do you think about home treatment? (extremely good/not at all good) | 1 | 227 | Mean Difference (IV, Fixed, 95% CI) | 0.61 [0.03, 1.19] |
| 3.3 How painful was the treatment at home? (not at all/very) | 1 | 227 | Mean Difference (IV, Fixed, 95% CI) | 0.58 [‐0.00, 1.16] |
| 3.4 How anxious were you being at home taking the treatment? (not at all/very) | 1 | 227 | Mean Difference (IV, Fixed, 95% CI) | 0.11 [‐0.39, 0.61] |
| 3.5 Would you have the same treatment at home again? (definitely/definitely not) | 1 | 227 | Mean Difference (IV, Fixed, 95% CI) | 0.62 [‐0.02, 1.26] |
| 3.6 Would you advise a friend to have the same treatment at home? (definitely/definitely not) | 1 | 227 | Mean Difference (IV, Fixed, 95% CI) | 0.41 [‐0.17, 0.99] |
| 4 Maternal satisfaction Show forest plot | 2 | Risk Ratio (M‐H, Fixed, 95% CI) | Subtotals only | |
| Analysis 9.4 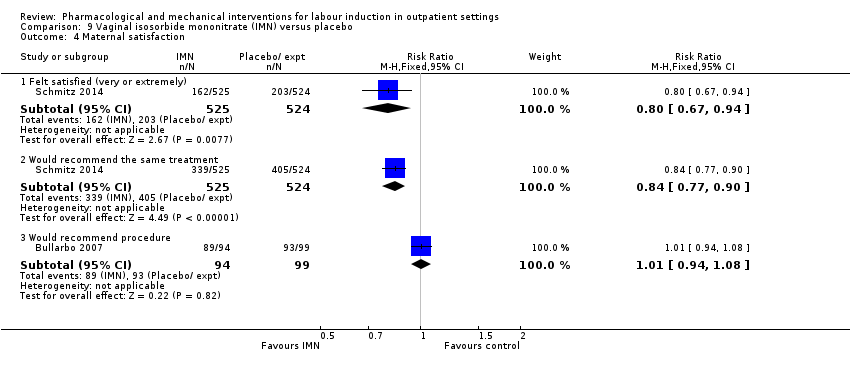 Comparison 9 Vaginal isosorbide mononitrate (IMN) versus placebo, Outcome 4 Maternal satisfaction. | ||||
| 4.1 Felt satisfied (very or extremely) | 1 | 1049 | Risk Ratio (M‐H, Fixed, 95% CI) | 0.80 [0.67, 0.94] |
| 4.2 Would recommend the same treatment | 1 | 1049 | Risk Ratio (M‐H, Fixed, 95% CI) | 0.84 [0.77, 0.90] |
| 4.3 Would recommend procedure | 1 | 193 | Risk Ratio (M‐H, Fixed, 95% CI) | 1.01 [0.94, 1.08] |
| 5 Perinatal death Show forest plot | 2 | 1712 | Risk Ratio (M‐H, Random, 95% CI) | 1.61 [0.08, 33.26] |
| Analysis 9.5 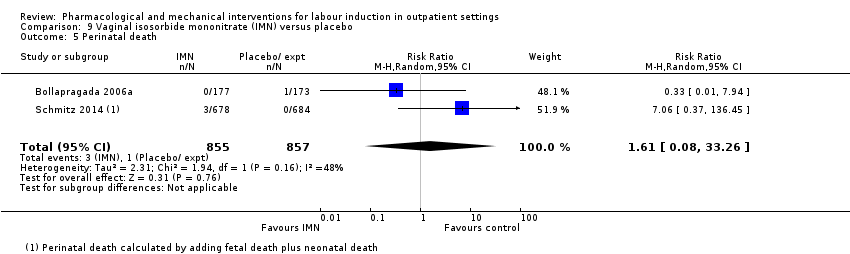 Comparison 9 Vaginal isosorbide mononitrate (IMN) versus placebo, Outcome 5 Perinatal death. | ||||
| 6 Neonatal trauma (long bone fracture, collarbone fracture, basal skull fracture, brachial plexus palsy, facial nerve palsy, phrenic nerve palsy, or subdural haemorrhage) Show forest plot | 1 | 1362 | Risk Ratio (M‐H, Fixed, 95% CI) | 0.67 [0.19, 2.37] |
| Analysis 9.6 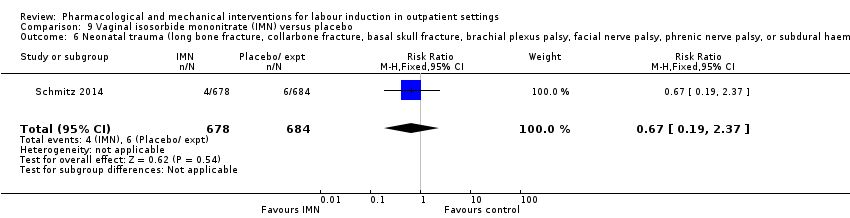 Comparison 9 Vaginal isosorbide mononitrate (IMN) versus placebo, Outcome 6 Neonatal trauma (long bone fracture, collarbone fracture, basal skull fracture, brachial plexus palsy, facial nerve palsy, phrenic nerve palsy, or subdural haemorrhage). | ||||
| 7 Neonatal convulsions in the first 24 hours Show forest plot | 1 | 1362 | Risk Ratio (M‐H, Fixed, 95% CI) | 0.0 [0.0, 0.0] |
| Analysis 9.7 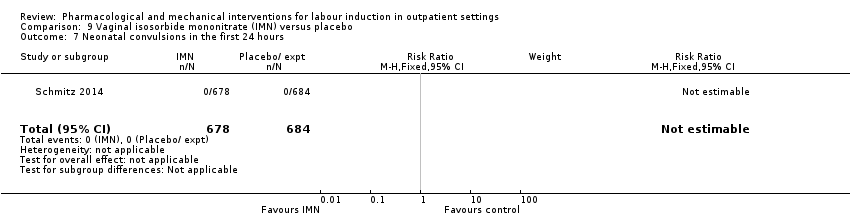 Comparison 9 Vaginal isosorbide mononitrate (IMN) versus placebo, Outcome 7 Neonatal convulsions in the first 24 hours. | ||||
| 8 Tracheal ventilation > 24 hours Show forest plot | 1 | 1362 | Risk Ratio (M‐H, Fixed, 95% CI) | 1.01 [0.14, 7.14] |
| Analysis 9.8  Comparison 9 Vaginal isosorbide mononitrate (IMN) versus placebo, Outcome 8 Tracheal ventilation > 24 hours. | ||||
| 9 Neonatal ICU admission for 5 or more days Show forest plot | 1 | 1362 | Risk Ratio (M‐H, Fixed, 95% CI) | 0.67 [0.19, 2.37] |
| Analysis 9.9 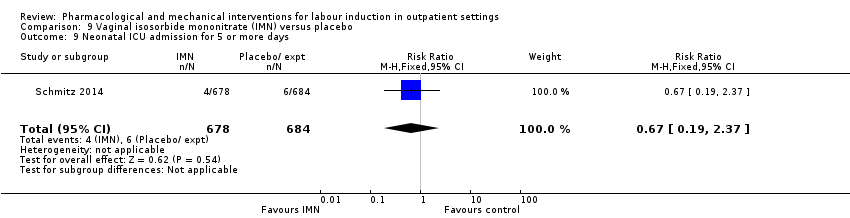 Comparison 9 Vaginal isosorbide mononitrate (IMN) versus placebo, Outcome 9 Neonatal ICU admission for 5 or more days. | ||||
| 10 Neonatal transfer Show forest plot | 1 | 1362 | Risk Ratio (M‐H, Fixed, 95% CI) | 1.07 [0.67, 1.70] |
| Analysis 9.10  Comparison 9 Vaginal isosorbide mononitrate (IMN) versus placebo, Outcome 10 Neonatal transfer. | ||||
| 11 Maternal death Show forest plot | 1 | 1362 | Risk Ratio (M‐H, Fixed, 95% CI) | 0.0 [0.0, 0.0] |
| Analysis 9.11  Comparison 9 Vaginal isosorbide mononitrate (IMN) versus placebo, Outcome 11 Maternal death. | ||||
| 12 Severe postpartum haemorrhage Show forest plot | 1 | 1362 | Risk Ratio (M‐H, Fixed, 95% CI) | 1.55 [0.78, 3.09] |
| Analysis 9.12  Comparison 9 Vaginal isosorbide mononitrate (IMN) versus placebo, Outcome 12 Severe postpartum haemorrhage. | ||||
| 13 Deep vein thrombosis Show forest plot | 1 | 1362 | Risk Ratio (M‐H, Fixed, 95% CI) | 3.03 [0.12, 74.16] |
| Analysis 9.13  Comparison 9 Vaginal isosorbide mononitrate (IMN) versus placebo, Outcome 13 Deep vein thrombosis. | ||||
| 14 Oxytocin augmentation Show forest plot | 3 | 1816 | Risk Ratio (M‐H, Random, 95% CI) | 0.95 [0.78, 1.14] |
| Analysis 9.14  Comparison 9 Vaginal isosorbide mononitrate (IMN) versus placebo, Outcome 14 Oxytocin augmentation. | ||||
| 15 Epidural Show forest plot | 1 | 350 | Risk Ratio (M‐H, Fixed, 95% CI) | 0.94 [0.82, 1.09] |
| Analysis 9.15  Comparison 9 Vaginal isosorbide mononitrate (IMN) versus placebo, Outcome 15 Epidural. | ||||
| 16 Uterine hyperstimulation (with FHR changes) Show forest plot | 1 | 102 | Risk Ratio (M‐H, Fixed, 95% CI) | 0.2 [0.01, 4.07] |
| Analysis 9.16  Comparison 9 Vaginal isosorbide mononitrate (IMN) versus placebo, Outcome 16 Uterine hyperstimulation (with FHR changes). | ||||
| 17 Uterine hyperstimulation (FHR changes unclear) Show forest plot | 1 | 200 | Risk Ratio (M‐H, Fixed, 95% CI) | 0.09 [0.01, 1.62] |
| Analysis 9.17  Comparison 9 Vaginal isosorbide mononitrate (IMN) versus placebo, Outcome 17 Uterine hyperstimulation (FHR changes unclear). | ||||
| 18 Assisted (instrumental) vaginal birth Show forest plot | 2 | 1712 | Risk Ratio (M‐H, Fixed, 95% CI) | 0.81 [0.61, 1.07] |
| Analysis 9.18  Comparison 9 Vaginal isosorbide mononitrate (IMN) versus placebo, Outcome 18 Assisted (instrumental) vaginal birth. | ||||
| 19 Caesarean section Show forest plot | 6 | 2286 | Risk Ratio (M‐H, Fixed, 95% CI) | 0.99 [0.87, 1.14] |
| Analysis 9.19 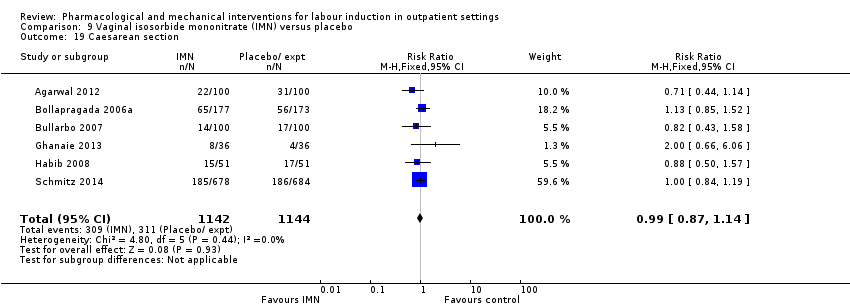 Comparison 9 Vaginal isosorbide mononitrate (IMN) versus placebo, Outcome 19 Caesarean section. | ||||
| 20 Apgar score < 7 at 5 minutes Show forest plot | 5 | 2214 | Risk Ratio (M‐H, Fixed, 95% CI) | 0.88 [0.44, 1.76] |
| Analysis 9.20  Comparison 9 Vaginal isosorbide mononitrate (IMN) versus placebo, Outcome 20 Apgar score < 7 at 5 minutes. | ||||
| 21 NICU (or SCBU) admission Show forest plot | 6 | 1068 | Risk Ratio (M‐H, Fixed, 95% CI) | 0.89 [0.59, 1.36] |
| Analysis 9.21  Comparison 9 Vaginal isosorbide mononitrate (IMN) versus placebo, Outcome 21 NICU (or SCBU) admission. | ||||
| 22 Postpartum haemorrhage (> 500 mL) Show forest plot | 5 | 2214 | Risk Ratio (M‐H, Fixed, 95% CI) | 1.13 [0.95, 1.36] |
| Analysis 9.22  Comparison 9 Vaginal isosorbide mononitrate (IMN) versus placebo, Outcome 22 Postpartum haemorrhage (> 500 mL). | ||||
| 23 Neonatal infection Show forest plot | 1 | 200 | Risk Ratio (M‐H, Fixed, 95% CI) | 1.0 [0.26, 3.89] |
| Analysis 9.23  Comparison 9 Vaginal isosorbide mononitrate (IMN) versus placebo, Outcome 23 Neonatal infection. | ||||
| 24 Side effects ‐ Maternal side effect ‐ nausea Show forest plot | 4 | 1926 | Risk Ratio (M‐H, Random, 95% CI) | 2.39 [1.54, 3.70] |
| Analysis 9.24  Comparison 9 Vaginal isosorbide mononitrate (IMN) versus placebo, Outcome 24 Side effects ‐ Maternal side effect ‐ nausea. | ||||
| 25 Side effects ‐ Maternal side effect ‐ headache Show forest plot | 7 | 2300 | Risk Ratio (M‐H, Random, 95% CI) | 5.45 [3.38, 8.81] |
| Analysis 9.25  Comparison 9 Vaginal isosorbide mononitrate (IMN) versus placebo, Outcome 25 Side effects ‐ Maternal side effect ‐ headache. | ||||
| 26 Side effects ‐ Maternal side effects ‐ severe headache Show forest plot | 1 | 220 | Risk Ratio (M‐H, Fixed, 95% CI) | 21.21 [2.91, 154.65] |
| Analysis 9.26  Comparison 9 Vaginal isosorbide mononitrate (IMN) versus placebo, Outcome 26 Side effects ‐ Maternal side effects ‐ severe headache. | ||||
| 27 Indicator of 'progress' in labour ‐ Admitted in established labour within 24 hours Show forest plot | 1 | 200 | Risk Ratio (M‐H, Fixed, 95% CI) | 2.75 [1.29, 5.88] |
| Analysis 9.27 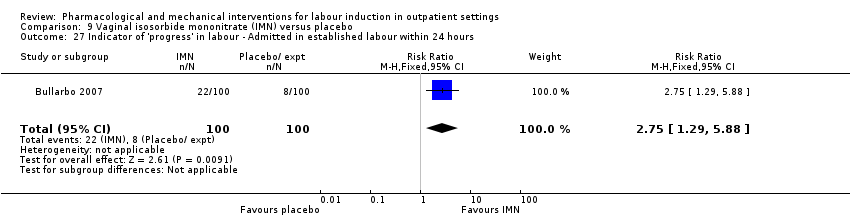 Comparison 9 Vaginal isosorbide mononitrate (IMN) versus placebo, Outcome 27 Indicator of 'progress' in labour ‐ Admitted in established labour within 24 hours. | ||||
| 28 Indicator of 'progress' in labour ‐ Bishop score > 6 or active labour at 36 hours Show forest plot | 1 | 102 | Risk Ratio (M‐H, Fixed, 95% CI) | 3.8 [1.54, 9.40] |
| Analysis 9.28 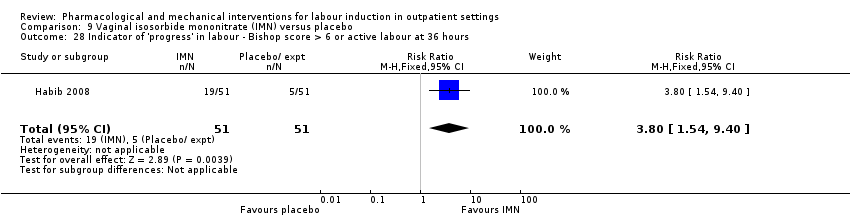 Comparison 9 Vaginal isosorbide mononitrate (IMN) versus placebo, Outcome 28 Indicator of 'progress' in labour ‐ Bishop score > 6 or active labour at 36 hours. | ||||
| 29 Time to birth ‐ Time in hours from admission to birth (all women) Show forest plot | 3 | 374 | Mean Difference (IV, Random, 95% CI) | ‐4.70 [‐6.08, ‐3.31] |
| Analysis 9.29  Comparison 9 Vaginal isosorbide mononitrate (IMN) versus placebo, Outcome 29 Time to birth ‐ Time in hours from admission to birth (all women). | ||||
| 30 Indicator of 'progress' in labour ‐ Bishop score on admission after treatment Show forest plot | 1 | 200 | Mean Difference (IV, Fixed, 95% CI) | 2.73 [2.17, 3.29] |
| Analysis 9.30  Comparison 9 Vaginal isosorbide mononitrate (IMN) versus placebo, Outcome 30 Indicator of 'progress' in labour ‐ Bishop score on admission after treatment. | ||||
| 31 Indicator of 'progress' in labour ‐ Change in Bishop score Show forest plot | 2 | 272 | Mean Difference (IV, Fixed, 95% CI) | 2.76 [2.48, 3.03] |
| Analysis 9.31 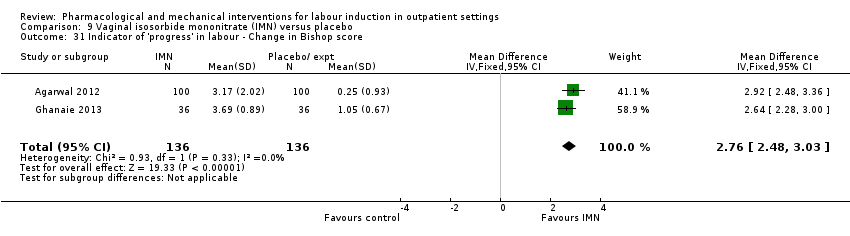 Comparison 9 Vaginal isosorbide mononitrate (IMN) versus placebo, Outcome 31 Indicator of 'progress' in labour ‐ Change in Bishop score. | ||||
| 32 Time to birth ‐ Interval from onset of labour to birth (hours) Show forest plot | 1 | 200 | Mean Difference (IV, Fixed, 95% CI) | ‐1.24 [‐1.82, ‐0.66] |
| Analysis 9.32  Comparison 9 Vaginal isosorbide mononitrate (IMN) versus placebo, Outcome 32 Time to birth ‐ Interval from onset of labour to birth (hours). | ||||
| 33 Indicator of 'progress' in labour ‐ Cervix unchanged after 48 hours Show forest plot | 1 | 257 | Risk Ratio (M‐H, Fixed, 95% CI) | 0.83 [0.70, 0.97] |
| Analysis 9.33 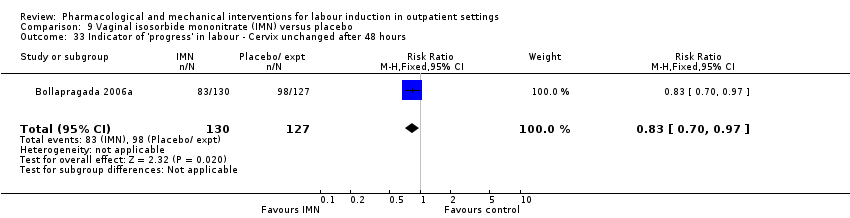 Comparison 9 Vaginal isosorbide mononitrate (IMN) versus placebo, Outcome 33 Indicator of 'progress' in labour ‐ Cervix unchanged after 48 hours. | ||||
| 34 Time to birth ‐ Interval from admission to vaginal birth (hours) Show forest plot | 1 | 128 | Mean Difference (IV, Fixed, 95% CI) | ‐0.70 [‐6.11, 4.71] |
| Analysis 9.34  Comparison 9 Vaginal isosorbide mononitrate (IMN) versus placebo, Outcome 34 Time to birth ‐ Interval from admission to vaginal birth (hours). | ||||
| 35 Total cost of care package (GBP) Show forest plot | 1 | 350 | Mean Difference (IV, Fixed, 95% CI) | 11.98 [‐105.34, 129.30] |
| Analysis 9.35  Comparison 9 Vaginal isosorbide mononitrate (IMN) versus placebo, Outcome 35 Total cost of care package (GBP). | ||||
| Outcome or subgroup title | No. of studies | No. of participants | Statistical method | Effect size |
| 1 Additional induction agents required Show forest plot | 1 | 56 | Risk Ratio (M‐H, Fixed, 95% CI) | 0.6 [0.31, 1.17] |
| Analysis 10.1  Comparison 10 Acupuncture versus routine care, Outcome 1 Additional induction agents required. | ||||
| 2 Caesarean section Show forest plot | 1 | 56 | Risk Ratio (M‐H, Fixed, 95% CI) | 0.43 [0.17, 1.11] |
| Analysis 10.2  Comparison 10 Acupuncture versus routine care, Outcome 2 Caesarean section. | ||||
| Outcome or subgroup title | No. of studies | No. of participants | Statistical method | Effect size |
| 1 Maternal satisfaction ‐ I look back positively on the treatment I received Show forest plot | 1 | 404 | Risk Ratio (M‐H, Fixed, 95% CI) | 1.04 [0.97, 1.10] |
| Analysis 11.1  Comparison 11 Outpatient amniotomy for induction versus routine care, Outcome 1 Maternal satisfaction ‐ I look back positively on the treatment I received. | ||||
| 2 Maternal satisfaction ‐ In retrospect, I would have preferred another treatment than received Show forest plot | 1 | 472 | Risk Ratio (M‐H, Fixed, 95% CI) | 0.51 [0.36, 0.72] |
| Analysis 11.2 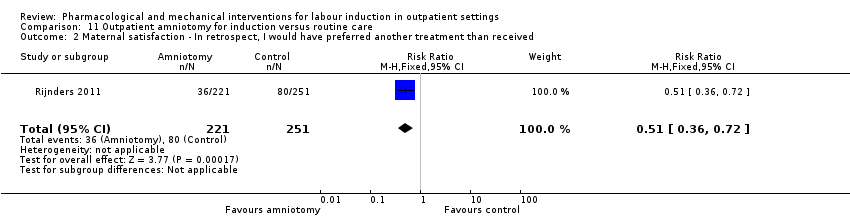 Comparison 11 Outpatient amniotomy for induction versus routine care, Outcome 2 Maternal satisfaction ‐ In retrospect, I would have preferred another treatment than received. | ||||
| 3 Augmentation, induction or both Show forest plot | 1 | 521 | Risk Ratio (M‐H, Fixed, 95% CI) | 0.83 [0.71, 0.97] |
| Analysis 11.3  Comparison 11 Outpatient amniotomy for induction versus routine care, Outcome 3 Augmentation, induction or both. | ||||
| 4 Epidural, opioids or both for pain relief Show forest plot | 1 | 521 | Risk Ratio (M‐H, Fixed, 95% CI) | 0.99 [0.76, 1.30] |
| Analysis 11.4  Comparison 11 Outpatient amniotomy for induction versus routine care, Outcome 4 Epidural, opioids or both for pain relief. | ||||
| 5 Instrumental vaginal birth Show forest plot | 1 | 521 | Risk Ratio (M‐H, Fixed, 95% CI) | 0.70 [0.46, 1.08] |
| Analysis 11.5  Comparison 11 Outpatient amniotomy for induction versus routine care, Outcome 5 Instrumental vaginal birth. | ||||
| 6 Caesarean section Show forest plot | 1 | 521 | Risk Ratio (M‐H, Fixed, 95% CI) | 1.20 [0.78, 1.86] |
| Analysis 11.6 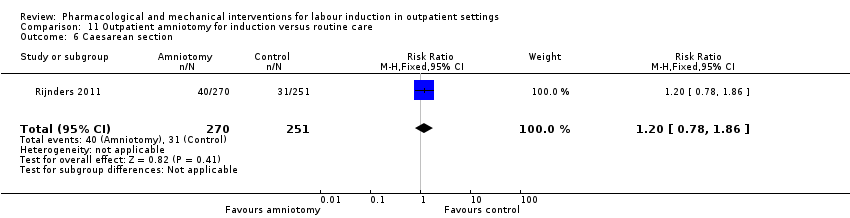 Comparison 11 Outpatient amniotomy for induction versus routine care, Outcome 6 Caesarean section. | ||||
| 7 Apgar < 7 at 5 minutes Show forest plot | 1 | 521 | Risk Ratio (M‐H, Fixed, 95% CI) | 1.86 [0.34, 10.06] |
| Analysis 11.7  Comparison 11 Outpatient amniotomy for induction versus routine care, Outcome 7 Apgar < 7 at 5 minutes. | ||||
| 8 Neonatal intensive care unit admission Show forest plot | 1 | 521 | Risk Ratio (M‐H, Fixed, 95% CI) | 1.09 [0.64, 1.85] |
| Analysis 11.8 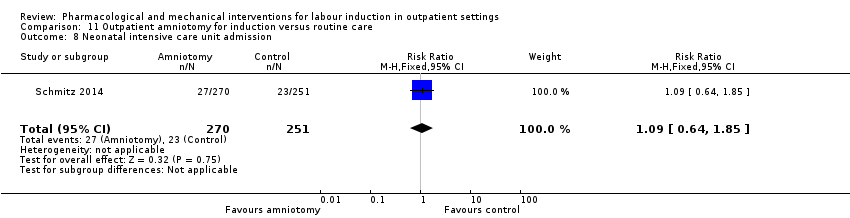 Comparison 11 Outpatient amniotomy for induction versus routine care, Outcome 8 Neonatal intensive care unit admission. | ||||
| 9 Duration of birth (hours) Show forest plot | 1 | 521 | Mean Difference (IV, Fixed, 95% CI) | 0.40 [‐0.72, 1.52] |
| Analysis 11.9 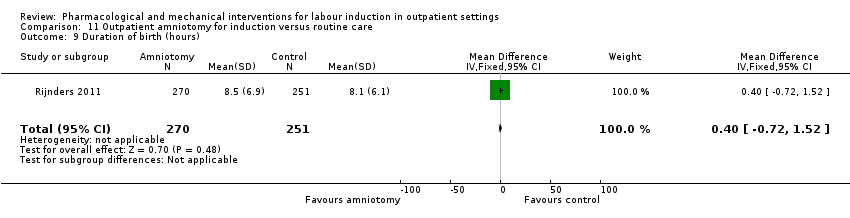 Comparison 11 Outpatient amniotomy for induction versus routine care, Outcome 9 Duration of birth (hours). | ||||

Study flow diagram.
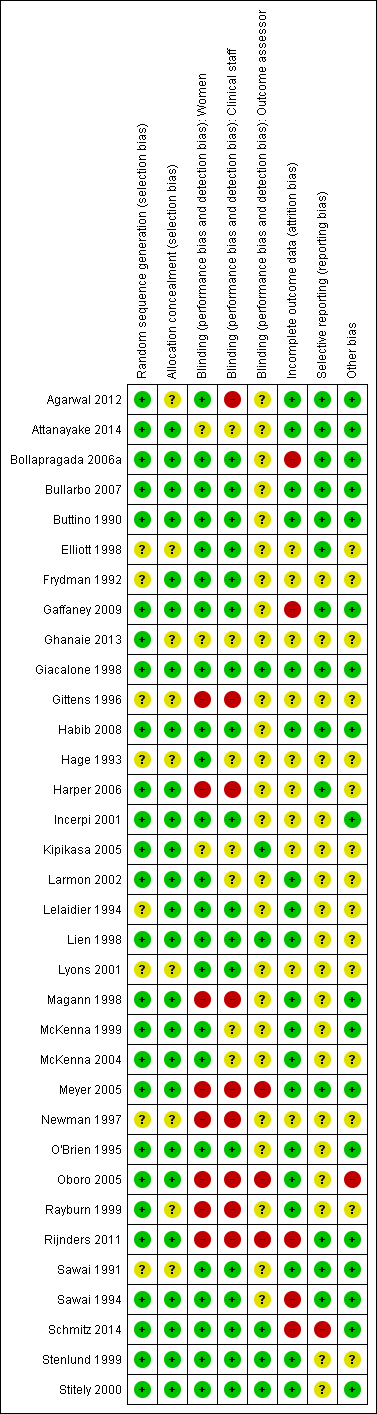
Risk of bias summary: review authors' judgements about each risk of bias item for each included study.

Risk of bias graph: review authors' judgements about each risk of bias item presented as percentages across all included studies.

Comparison 1 Intravaginal PGE₂ gel versus placebo or expectant management, Outcome 1 Additional induction agents required.

Comparison 1 Intravaginal PGE₂ gel versus placebo or expectant management, Outcome 2 Epidural.

Comparison 1 Intravaginal PGE₂ gel versus placebo or expectant management, Outcome 3 Uterine hyperstimulation (FHR changes unclear).
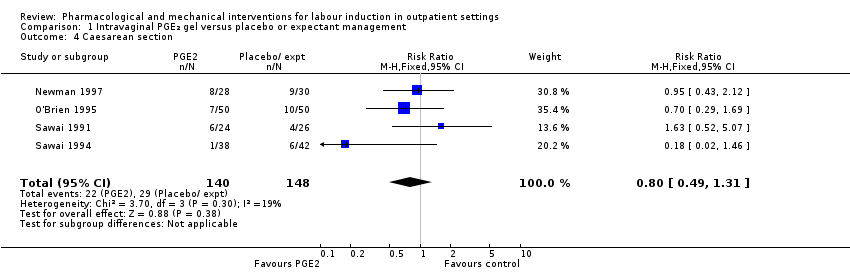
Comparison 1 Intravaginal PGE₂ gel versus placebo or expectant management, Outcome 4 Caesarean section.
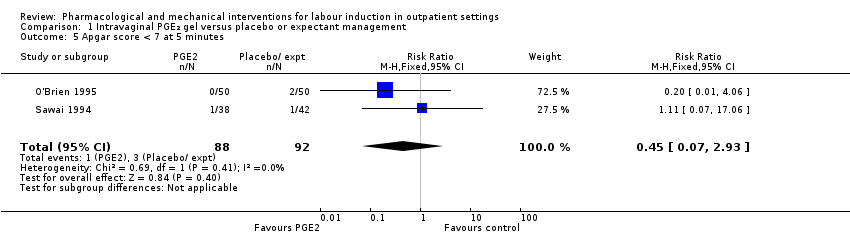
Comparison 1 Intravaginal PGE₂ gel versus placebo or expectant management, Outcome 5 Apgar score < 7 at 5 minutes.

Comparison 1 Intravaginal PGE₂ gel versus placebo or expectant management, Outcome 6 NICU admission.

Comparison 1 Intravaginal PGE₂ gel versus placebo or expectant management, Outcome 7 Chorioamnionitis.
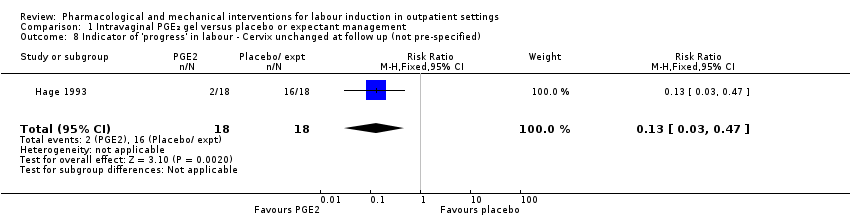
Comparison 1 Intravaginal PGE₂ gel versus placebo or expectant management, Outcome 8 Indicator of 'progress' in labour ‐ Cervix unchanged at follow up (not pre‐specified).

Comparison 1 Intravaginal PGE₂ gel versus placebo or expectant management, Outcome 9 'Spontaneous labour' within 48 hours.

Comparison 1 Intravaginal PGE₂ gel versus placebo or expectant management, Outcome 10 Indicator of 'progress' in labour ‐ Admitted to hospital for labour.

Comparison 1 Intravaginal PGE₂ gel versus placebo or expectant management, Outcome 11 Time to birth ‐ Gestational age at birth (weeks).

Comparison 1 Intravaginal PGE₂ gel versus placebo or expectant management, Outcome 12 Time to birth ‐ Gestational age on admission (days).
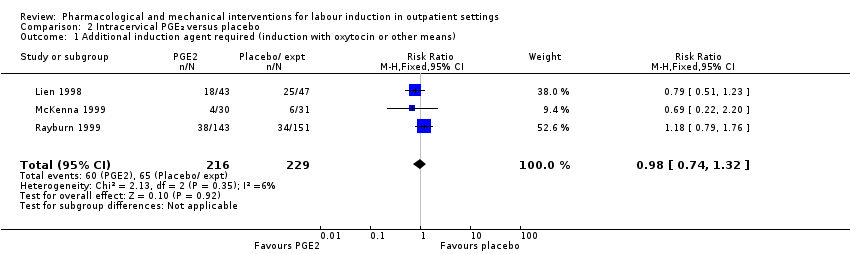
Comparison 2 Intracervical PGE₂ versus placebo, Outcome 1 Additional induction agent required (induction with oxytocin or other means).
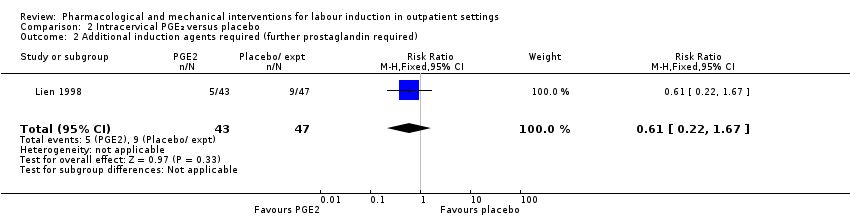
Comparison 2 Intracervical PGE₂ versus placebo, Outcome 2 Additional induction agents required (further prostaglandin required).
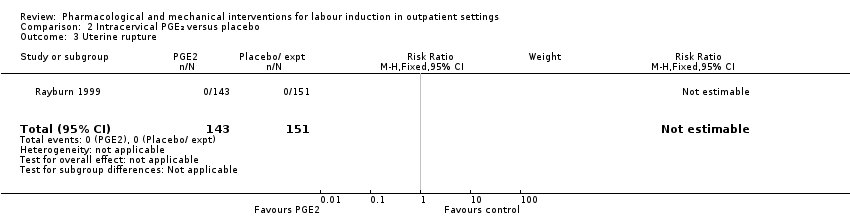
Comparison 2 Intracervical PGE₂ versus placebo, Outcome 3 Uterine rupture.

Comparison 2 Intracervical PGE₂ versus placebo, Outcome 4 Birth not achieved in 48 to 72 hours.

Comparison 2 Intracervical PGE₂ versus placebo, Outcome 5 Oxytocin augmentation.
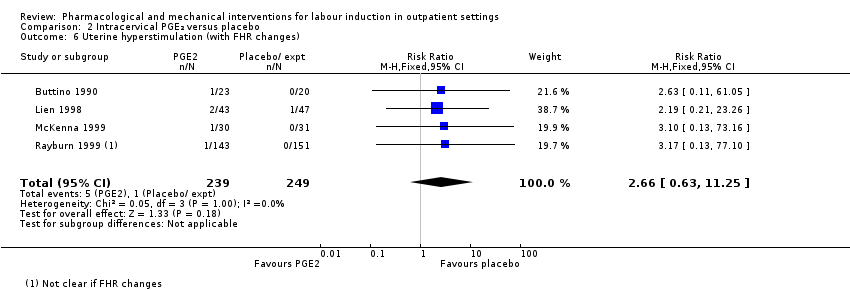
Comparison 2 Intracervical PGE₂ versus placebo, Outcome 6 Uterine hyperstimulation (with FHR changes).

Comparison 2 Intracervical PGE₂ versus placebo, Outcome 7 Assisted (instrumental) vaginal birth.
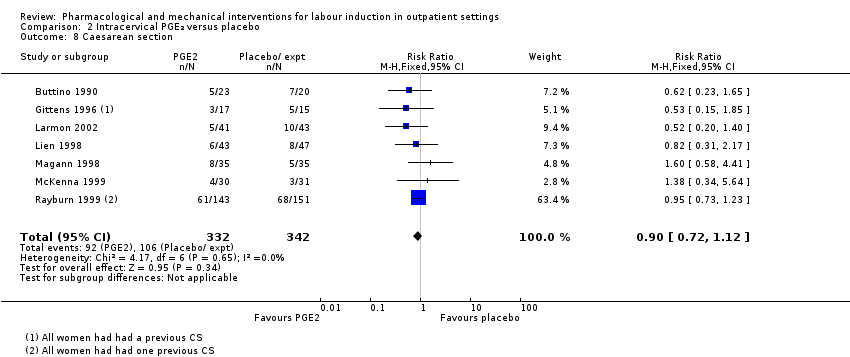
Comparison 2 Intracervical PGE₂ versus placebo, Outcome 8 Caesarean section.
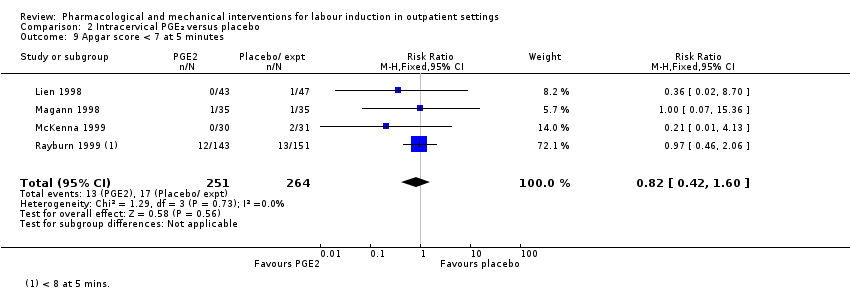
Comparison 2 Intracervical PGE₂ versus placebo, Outcome 9 Apgar score < 7 at 5 minutes.

Comparison 2 Intracervical PGE₂ versus placebo, Outcome 10 NICU admission.

Comparison 2 Intracervical PGE₂ versus placebo, Outcome 11 Postpartum haemorrhage (> 500 mL).
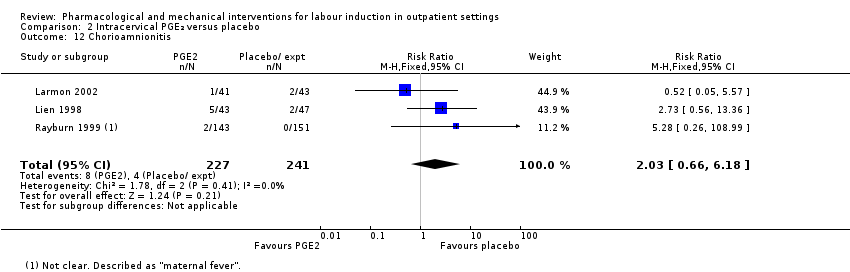
Comparison 2 Intracervical PGE₂ versus placebo, Outcome 12 Chorioamnionitis.

Comparison 2 Intracervical PGE₂ versus placebo, Outcome 13 Endometritis.

Comparison 2 Intracervical PGE₂ versus placebo, Outcome 14 Side effects ‐ Maternal side effects.

Comparison 2 Intracervical PGE₂ versus placebo, Outcome 15 Time to birth ‐ Interval from intervention to birth (days).

Comparison 2 Intracervical PGE₂ versus placebo, Outcome 16 Time to birth ‐ Gestational age at birth (weeks).

Comparison 2 Intracervical PGE₂ versus placebo, Outcome 17 Indicator of 'progress' in labour ‐ Induction for gestational age > 42 weeks.

Comparison 2 Intracervical PGE₂ versus placebo, Outcome 18 Time to birth ‐ Birth within 48 hours of treatment (all births).

Comparison 3 Vaginal misoprostol versus placebo, Outcome 1 Serious neonatal morbidity or death.
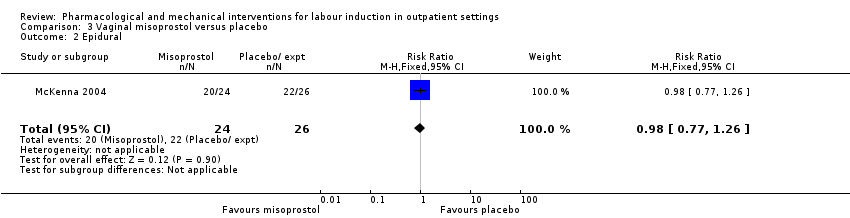
Comparison 3 Vaginal misoprostol versus placebo, Outcome 2 Epidural.

Comparison 3 Vaginal misoprostol versus placebo, Outcome 3 Uterine hyperstimulation (with FHR changes).
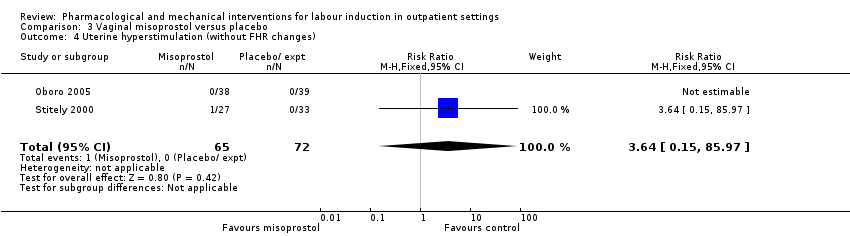
Comparison 3 Vaginal misoprostol versus placebo, Outcome 4 Uterine hyperstimulation (without FHR changes).

Comparison 3 Vaginal misoprostol versus placebo, Outcome 5 Assisted (instrumental) vaginal birth.

Comparison 3 Vaginal misoprostol versus placebo, Outcome 6 Caesarean section.

Comparison 3 Vaginal misoprostol versus placebo, Outcome 7 Apgar score < 7 at 5 minutes.
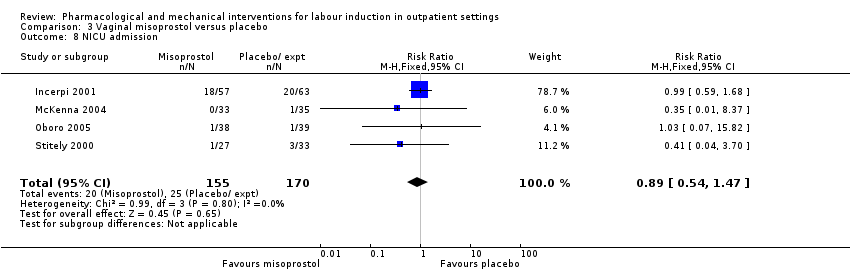
Comparison 3 Vaginal misoprostol versus placebo, Outcome 8 NICU admission.
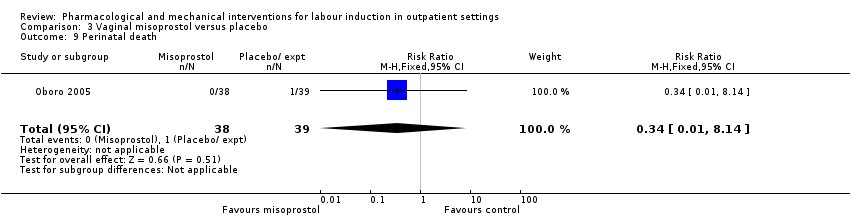
Comparison 3 Vaginal misoprostol versus placebo, Outcome 9 Perinatal death.

Comparison 3 Vaginal misoprostol versus placebo, Outcome 10 Neonatal infection.

Comparison 3 Vaginal misoprostol versus placebo, Outcome 11 Indicator of 'progress' in labour ‐ Oxytocin dose used (mU).

Comparison 3 Vaginal misoprostol versus placebo, Outcome 12 Indicator of 'progress' in labour ‐ Number of medication dose.

Comparison 3 Vaginal misoprostol versus placebo, Outcome 13 Indicator of 'progress' in labour ‐ Number of women requiring dosing on day 2.

Comparison 3 Vaginal misoprostol versus placebo, Outcome 14 Indicator of 'progress' in labour ‐ Number of women requiring induction on day 3.

Comparison 3 Vaginal misoprostol versus placebo, Outcome 15 Indicator of 'progress' in labour ‐ Days to admission (all) (days).
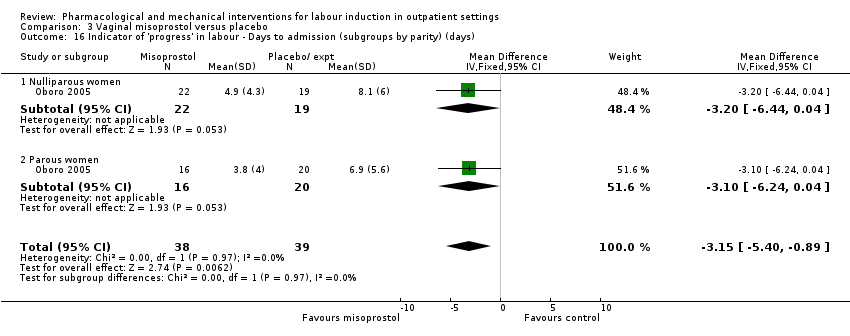
Comparison 3 Vaginal misoprostol versus placebo, Outcome 16 Indicator of 'progress' in labour ‐ Days to admission (subgroups by parity) (days).

Comparison 3 Vaginal misoprostol versus placebo, Outcome 17 Indicator of 'progress' in labour ‐ Gestational age at labour (weeks).

Comparison 3 Vaginal misoprostol versus placebo, Outcome 18 Indicator of 'progress' in labour ‐ Days to admission (parous) (weeks).

Comparison 3 Vaginal misoprostol versus placebo, Outcome 19 Indicator of 'progress' in labour ‐ Days to PROM (days).

Comparison 3 Vaginal misoprostol versus placebo, Outcome 20 Time to birth ‐ Interval from intervention to vaginal birth (days).

Comparison 3 Vaginal misoprostol versus placebo, Outcome 21 Time to birth ‐ Days to birth (all) (days).

Comparison 3 Vaginal misoprostol versus placebo, Outcome 22 Time to birth ‐ Days to birth (subgroups by parity) (days).
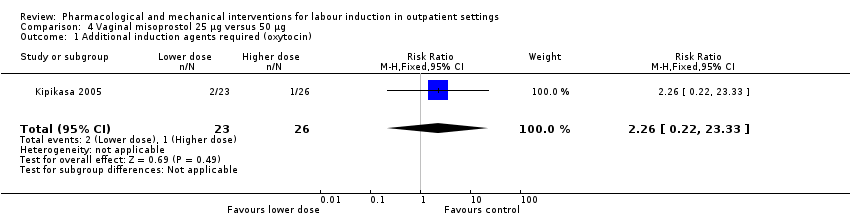
Comparison 4 Vaginal misoprostol 25 µg versus 50 µg, Outcome 1 Additional induction agents required (oxytocin).

Comparison 4 Vaginal misoprostol 25 µg versus 50 µg, Outcome 2 Uterine hyperstimulation.

Comparison 4 Vaginal misoprostol 25 µg versus 50 µg, Outcome 3 Caesarean section.
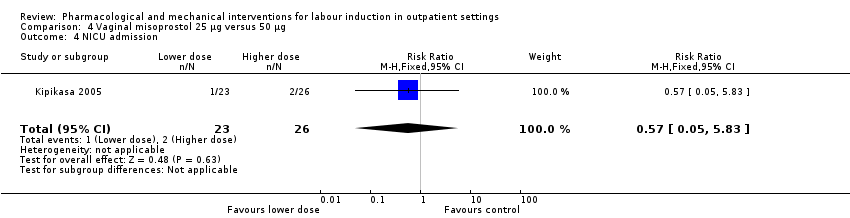
Comparison 4 Vaginal misoprostol 25 µg versus 50 µg, Outcome 4 NICU admission.

Comparison 4 Vaginal misoprostol 25 µg versus 50 µg, Outcome 5 Interval from treatment to birth (in days, all births).
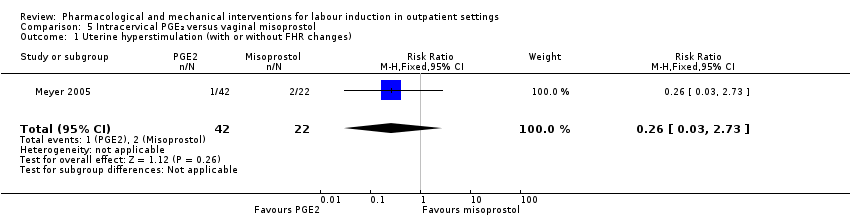
Comparison 5 Intracervical PGE₂ versus vaginal misoprostol, Outcome 1 Uterine hyperstimulation (with or without FHR changes).

Comparison 5 Intracervical PGE₂ versus vaginal misoprostol, Outcome 2 Caesarean section.

Comparison 5 Intracervical PGE₂ versus vaginal misoprostol, Outcome 3 Apgar score < 7 after 5 minutes.
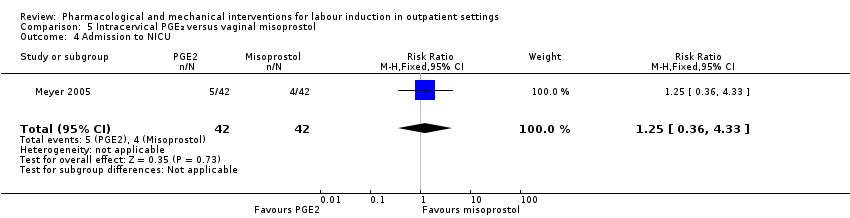
Comparison 5 Intracervical PGE₂ versus vaginal misoprostol, Outcome 4 Admission to NICU.
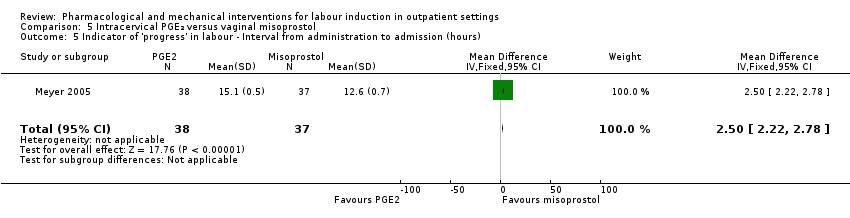
Comparison 5 Intracervical PGE₂ versus vaginal misoprostol, Outcome 5 Indicator of 'progress' in labour ‐ Interval from administration to admission (hours).

Comparison 5 Intracervical PGE₂ versus vaginal misoprostol, Outcome 6 Indicator of 'progress' in labour ‐ Labour or SROM during ripening.

Comparison 5 Intracervical PGE₂ versus vaginal misoprostol, Outcome 7 Time to birth ‐ Birth within 24 hours.
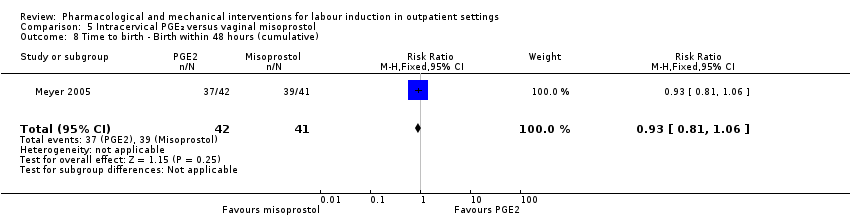
Comparison 5 Intracervical PGE₂ versus vaginal misoprostol, Outcome 8 Time to birth ‐ Birth within 48 hours (cumulative).
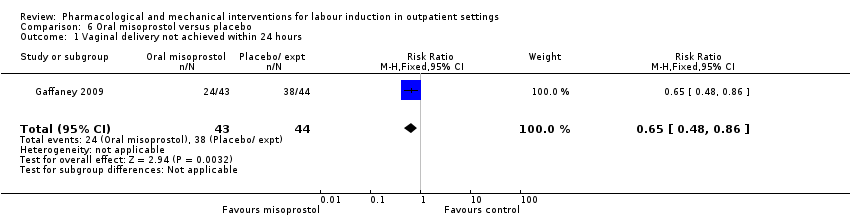
Comparison 6 Oral misoprostol versus placebo, Outcome 1 Vaginal delivery not achieved within 24 hours.
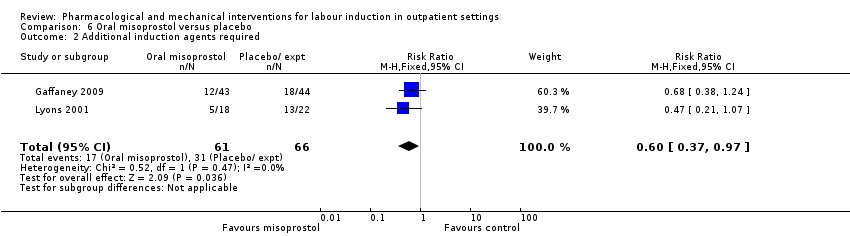
Comparison 6 Oral misoprostol versus placebo, Outcome 2 Additional induction agents required.

Comparison 6 Oral misoprostol versus placebo, Outcome 3 Oxytocin augmentation.
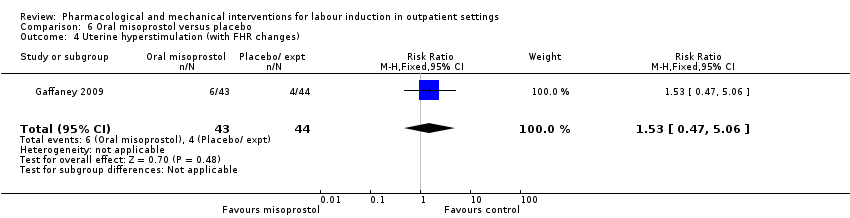
Comparison 6 Oral misoprostol versus placebo, Outcome 4 Uterine hyperstimulation (with FHR changes).
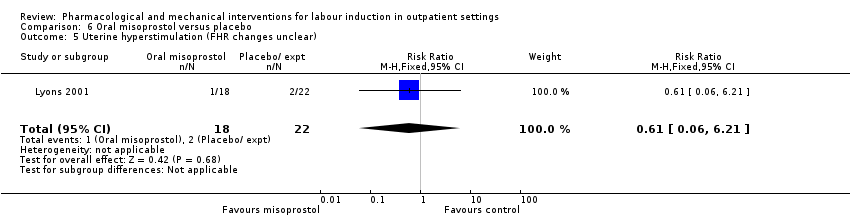
Comparison 6 Oral misoprostol versus placebo, Outcome 5 Uterine hyperstimulation (FHR changes unclear).
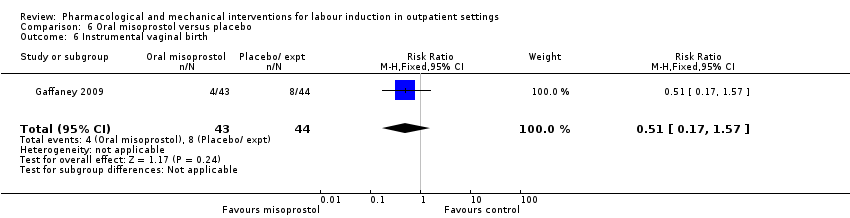
Comparison 6 Oral misoprostol versus placebo, Outcome 6 Instrumental vaginal birth.

Comparison 6 Oral misoprostol versus placebo, Outcome 7 Caesarean section.

Comparison 6 Oral misoprostol versus placebo, Outcome 8 Apgar score < 7 at 5 minutes.
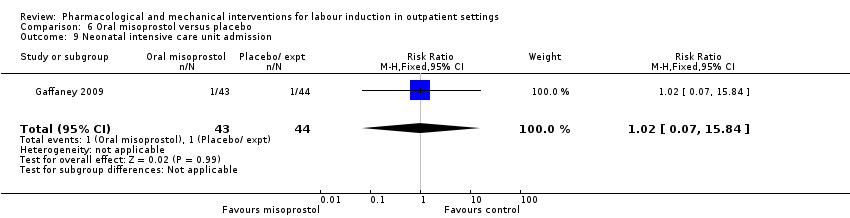
Comparison 6 Oral misoprostol versus placebo, Outcome 9 Neonatal intensive care unit admission.

Comparison 6 Oral misoprostol versus placebo, Outcome 10 Postpartum haemorrhage.

Comparison 6 Oral misoprostol versus placebo, Outcome 11 Chorioamnionitis.
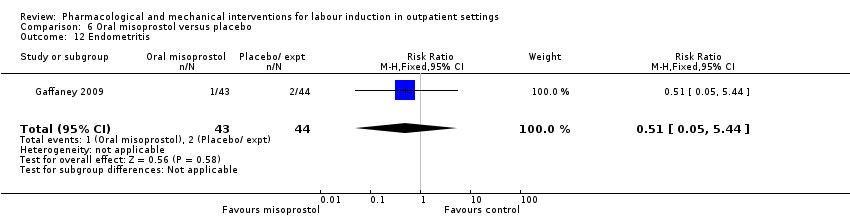
Comparison 6 Oral misoprostol versus placebo, Outcome 12 Endometritis.

Comparison 6 Oral misoprostol versus placebo, Outcome 13 Indicator of 'progress' in labour ‐ Time from first dose to active labor (hours).
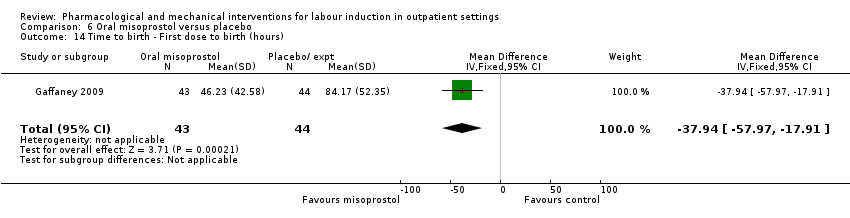
Comparison 6 Oral misoprostol versus placebo, Outcome 14 Time to birth ‐ First dose to birth (hours).

Comparison 6 Oral misoprostol versus placebo, Outcome 15 Indicator of 'progress' in labour ‐ Total doses of medication.

Comparison 7 Mifepristone versus placebo, Outcome 1 Additional induction agents required.
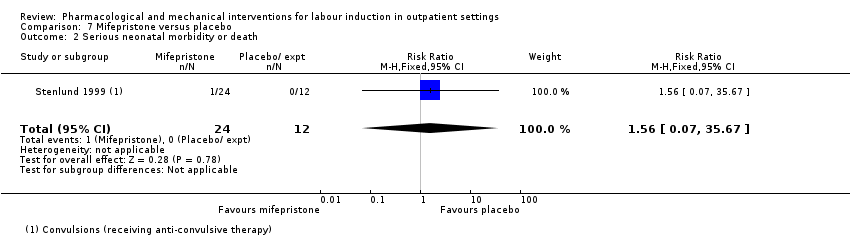
Comparison 7 Mifepristone versus placebo, Outcome 2 Serious neonatal morbidity or death.
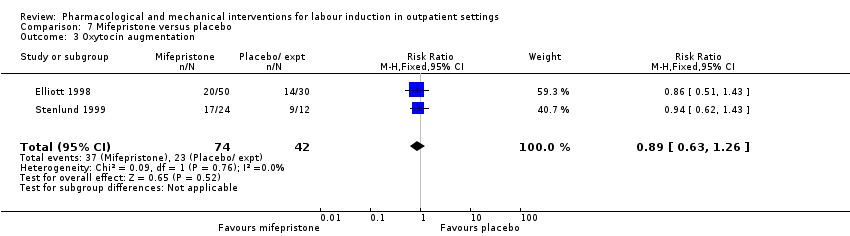
Comparison 7 Mifepristone versus placebo, Outcome 3 Oxytocin augmentation.

Comparison 7 Mifepristone versus placebo, Outcome 4 Epidural.
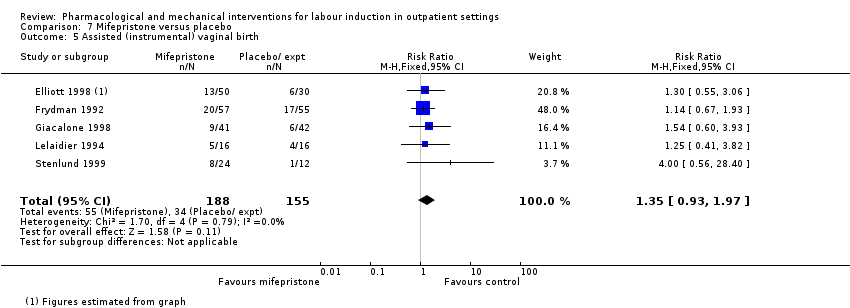
Comparison 7 Mifepristone versus placebo, Outcome 5 Assisted (instrumental) vaginal birth.

Comparison 7 Mifepristone versus placebo, Outcome 6 Caesarean section.
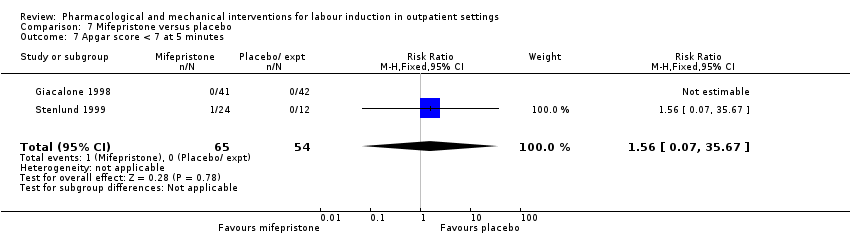
Comparison 7 Mifepristone versus placebo, Outcome 7 Apgar score < 7 at 5 minutes.

Comparison 7 Mifepristone versus placebo, Outcome 8 NICU admission.
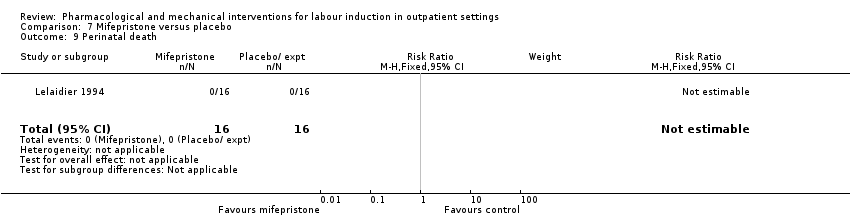
Comparison 7 Mifepristone versus placebo, Outcome 9 Perinatal death.

Comparison 7 Mifepristone versus placebo, Outcome 10 Uterine scar separation.

Comparison 7 Mifepristone versus placebo, Outcome 11 Chorioamnionitis.

Comparison 7 Mifepristone versus placebo, Outcome 12 Indicator of 'progress' in labour ‐ Labour or ripe cervix in 48 hours.
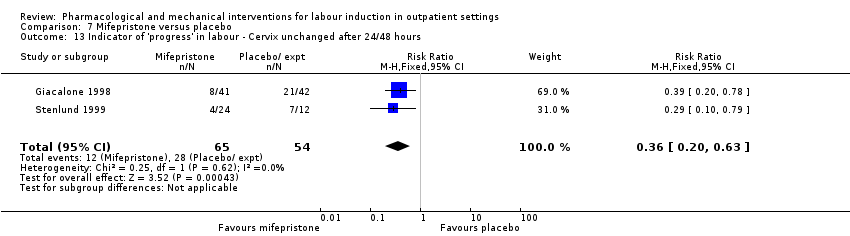
Comparison 7 Mifepristone versus placebo, Outcome 13 Indicator of 'progress' in labour ‐ Cervix unchanged after 24/48 hours.

Comparison 7 Mifepristone versus placebo, Outcome 14 Indicator of 'progress' in labour ‐ Spontaneous labour within 72 hours.

Comparison 7 Mifepristone versus placebo, Outcome 15 Indicator of 'progress' in labour ‐ Spontaneous labour within 48 hours.

Comparison 7 Mifepristone versus placebo, Outcome 16 Indicator of 'progress' in labour ‐ Oxytocin requirements (IU).
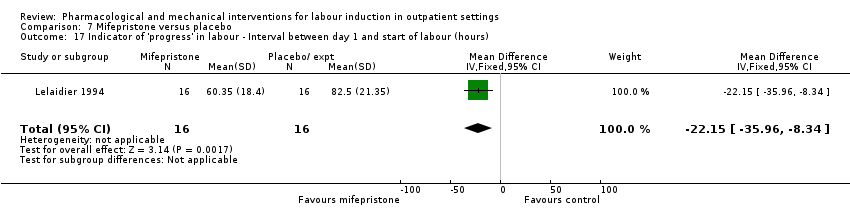
Comparison 7 Mifepristone versus placebo, Outcome 17 Indicator of 'progress' in labour ‐ Interval between day 1 and start of labour (hours).

Comparison 8 Oestrogens versus placebo, Outcome 1 Oxytocin augmentation.

Comparison 8 Oestrogens versus placebo, Outcome 2 Assisted (instrumental) vaginal birth.

Comparison 8 Oestrogens versus placebo, Outcome 3 Caesarean section.

Comparison 8 Oestrogens versus placebo, Outcome 4 NICU admission.

Comparison 8 Oestrogens versus placebo, Outcome 5 Chorioamnionitis.
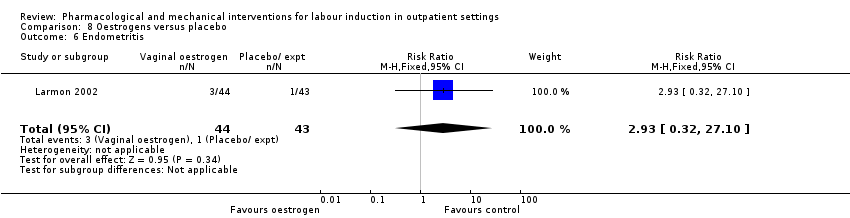
Comparison 8 Oestrogens versus placebo, Outcome 6 Endometritis.

Comparison 9 Vaginal isosorbide mononitrate (IMN) versus placebo, Outcome 1 Vaginal birth not achieved in 24/48 hours.

Comparison 9 Vaginal isosorbide mononitrate (IMN) versus placebo, Outcome 2 Additional induction agents required.
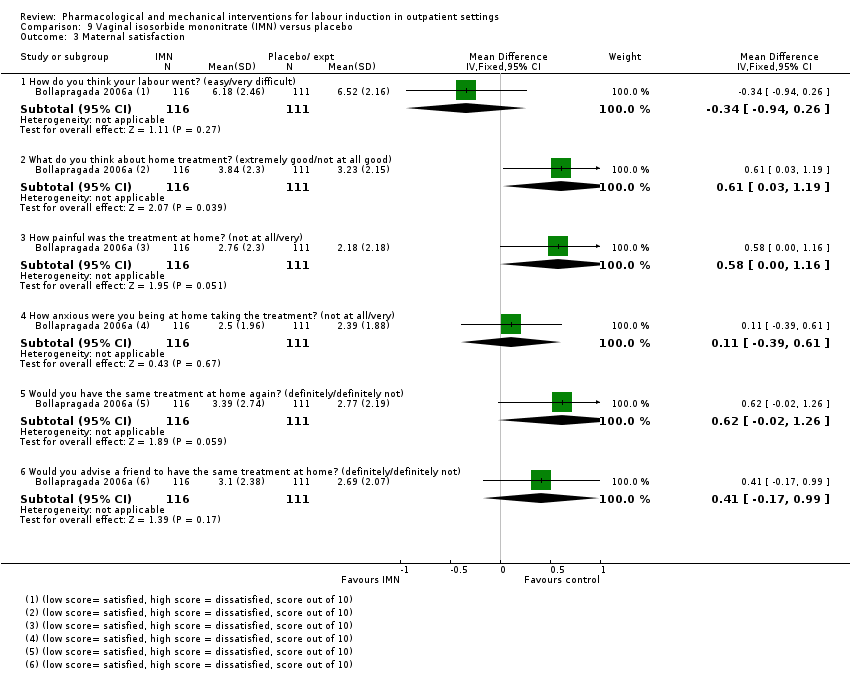
Comparison 9 Vaginal isosorbide mononitrate (IMN) versus placebo, Outcome 3 Maternal satisfaction.

Comparison 9 Vaginal isosorbide mononitrate (IMN) versus placebo, Outcome 4 Maternal satisfaction.

Comparison 9 Vaginal isosorbide mononitrate (IMN) versus placebo, Outcome 5 Perinatal death.

Comparison 9 Vaginal isosorbide mononitrate (IMN) versus placebo, Outcome 6 Neonatal trauma (long bone fracture, collarbone fracture, basal skull fracture, brachial plexus palsy, facial nerve palsy, phrenic nerve palsy, or subdural haemorrhage).

Comparison 9 Vaginal isosorbide mononitrate (IMN) versus placebo, Outcome 7 Neonatal convulsions in the first 24 hours.

Comparison 9 Vaginal isosorbide mononitrate (IMN) versus placebo, Outcome 8 Tracheal ventilation > 24 hours.

Comparison 9 Vaginal isosorbide mononitrate (IMN) versus placebo, Outcome 9 Neonatal ICU admission for 5 or more days.
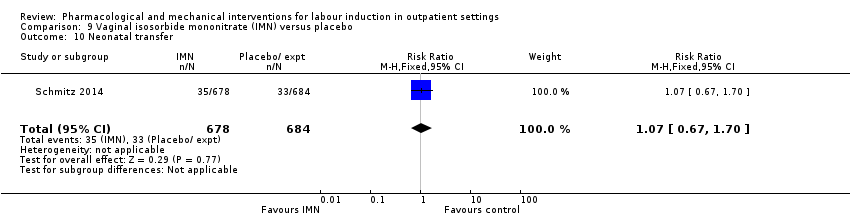
Comparison 9 Vaginal isosorbide mononitrate (IMN) versus placebo, Outcome 10 Neonatal transfer.

Comparison 9 Vaginal isosorbide mononitrate (IMN) versus placebo, Outcome 11 Maternal death.
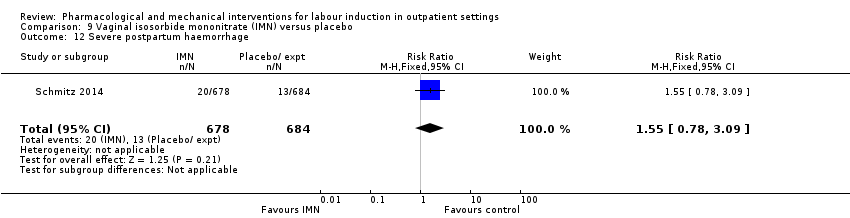
Comparison 9 Vaginal isosorbide mononitrate (IMN) versus placebo, Outcome 12 Severe postpartum haemorrhage.

Comparison 9 Vaginal isosorbide mononitrate (IMN) versus placebo, Outcome 13 Deep vein thrombosis.

Comparison 9 Vaginal isosorbide mononitrate (IMN) versus placebo, Outcome 14 Oxytocin augmentation.
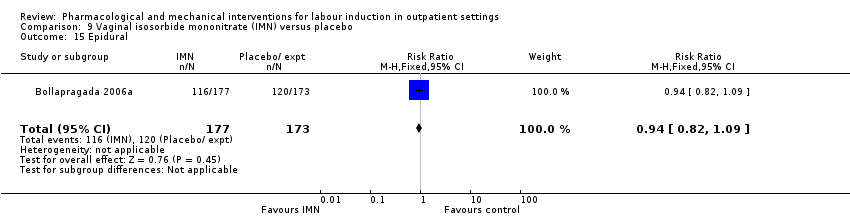
Comparison 9 Vaginal isosorbide mononitrate (IMN) versus placebo, Outcome 15 Epidural.
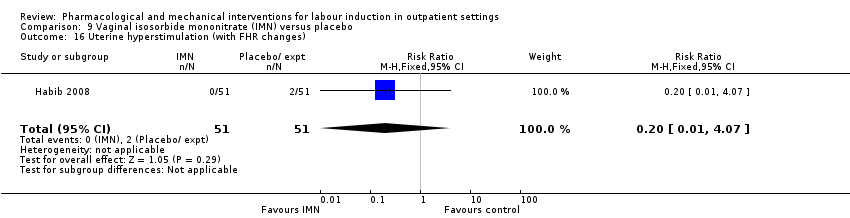
Comparison 9 Vaginal isosorbide mononitrate (IMN) versus placebo, Outcome 16 Uterine hyperstimulation (with FHR changes).

Comparison 9 Vaginal isosorbide mononitrate (IMN) versus placebo, Outcome 17 Uterine hyperstimulation (FHR changes unclear).
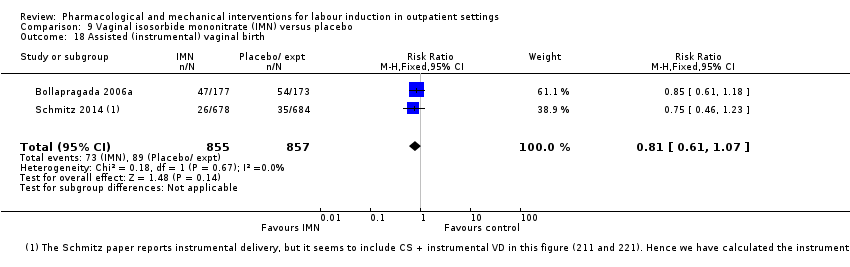
Comparison 9 Vaginal isosorbide mononitrate (IMN) versus placebo, Outcome 18 Assisted (instrumental) vaginal birth.

Comparison 9 Vaginal isosorbide mononitrate (IMN) versus placebo, Outcome 19 Caesarean section.
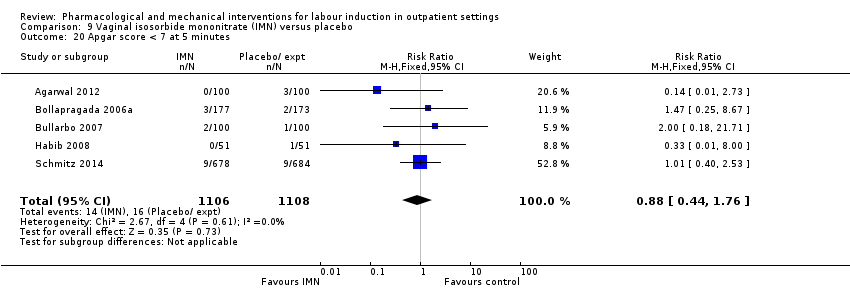
Comparison 9 Vaginal isosorbide mononitrate (IMN) versus placebo, Outcome 20 Apgar score < 7 at 5 minutes.

Comparison 9 Vaginal isosorbide mononitrate (IMN) versus placebo, Outcome 21 NICU (or SCBU) admission.
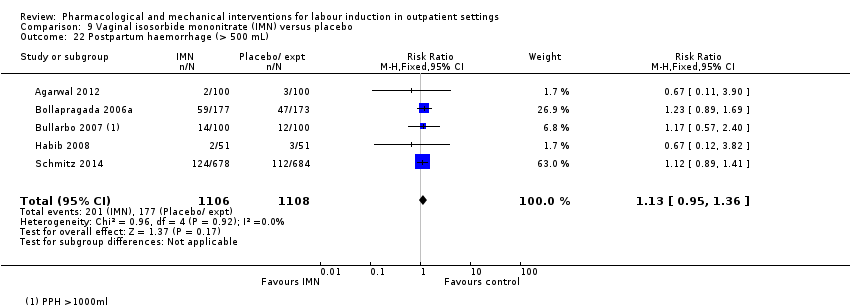
Comparison 9 Vaginal isosorbide mononitrate (IMN) versus placebo, Outcome 22 Postpartum haemorrhage (> 500 mL).

Comparison 9 Vaginal isosorbide mononitrate (IMN) versus placebo, Outcome 23 Neonatal infection.

Comparison 9 Vaginal isosorbide mononitrate (IMN) versus placebo, Outcome 24 Side effects ‐ Maternal side effect ‐ nausea.

Comparison 9 Vaginal isosorbide mononitrate (IMN) versus placebo, Outcome 25 Side effects ‐ Maternal side effect ‐ headache.

Comparison 9 Vaginal isosorbide mononitrate (IMN) versus placebo, Outcome 26 Side effects ‐ Maternal side effects ‐ severe headache.

Comparison 9 Vaginal isosorbide mononitrate (IMN) versus placebo, Outcome 27 Indicator of 'progress' in labour ‐ Admitted in established labour within 24 hours.

Comparison 9 Vaginal isosorbide mononitrate (IMN) versus placebo, Outcome 28 Indicator of 'progress' in labour ‐ Bishop score > 6 or active labour at 36 hours.

Comparison 9 Vaginal isosorbide mononitrate (IMN) versus placebo, Outcome 29 Time to birth ‐ Time in hours from admission to birth (all women).
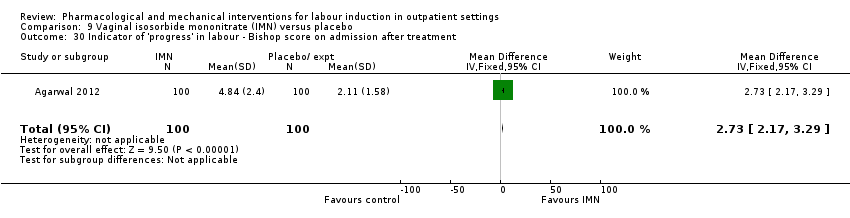
Comparison 9 Vaginal isosorbide mononitrate (IMN) versus placebo, Outcome 30 Indicator of 'progress' in labour ‐ Bishop score on admission after treatment.

Comparison 9 Vaginal isosorbide mononitrate (IMN) versus placebo, Outcome 31 Indicator of 'progress' in labour ‐ Change in Bishop score.

Comparison 9 Vaginal isosorbide mononitrate (IMN) versus placebo, Outcome 32 Time to birth ‐ Interval from onset of labour to birth (hours).

Comparison 9 Vaginal isosorbide mononitrate (IMN) versus placebo, Outcome 33 Indicator of 'progress' in labour ‐ Cervix unchanged after 48 hours.

Comparison 9 Vaginal isosorbide mononitrate (IMN) versus placebo, Outcome 34 Time to birth ‐ Interval from admission to vaginal birth (hours).
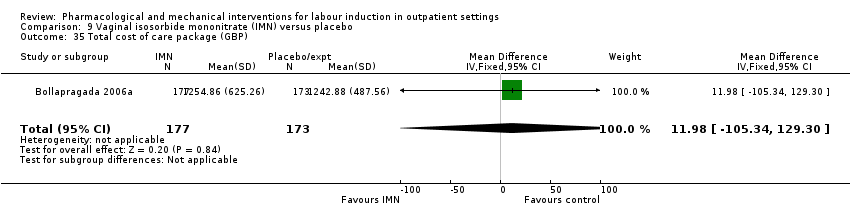
Comparison 9 Vaginal isosorbide mononitrate (IMN) versus placebo, Outcome 35 Total cost of care package (GBP).

Comparison 10 Acupuncture versus routine care, Outcome 1 Additional induction agents required.

Comparison 10 Acupuncture versus routine care, Outcome 2 Caesarean section.

Comparison 11 Outpatient amniotomy for induction versus routine care, Outcome 1 Maternal satisfaction ‐ I look back positively on the treatment I received.

Comparison 11 Outpatient amniotomy for induction versus routine care, Outcome 2 Maternal satisfaction ‐ In retrospect, I would have preferred another treatment than received.
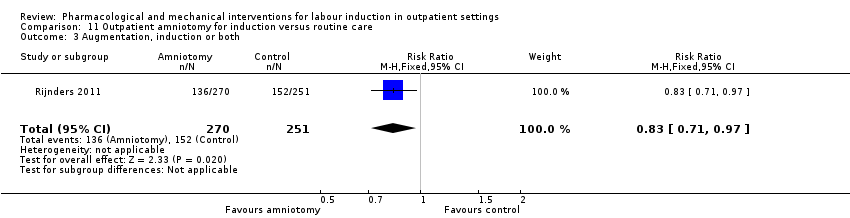
Comparison 11 Outpatient amniotomy for induction versus routine care, Outcome 3 Augmentation, induction or both.

Comparison 11 Outpatient amniotomy for induction versus routine care, Outcome 4 Epidural, opioids or both for pain relief.
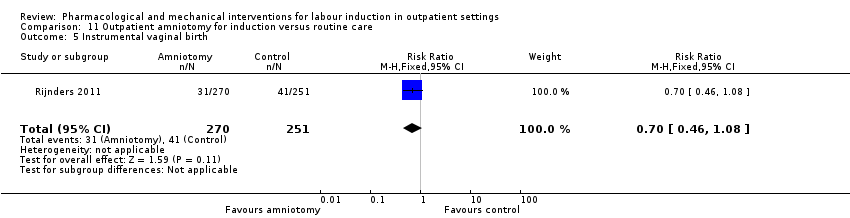
Comparison 11 Outpatient amniotomy for induction versus routine care, Outcome 5 Instrumental vaginal birth.

Comparison 11 Outpatient amniotomy for induction versus routine care, Outcome 6 Caesarean section.

Comparison 11 Outpatient amniotomy for induction versus routine care, Outcome 7 Apgar < 7 at 5 minutes.

Comparison 11 Outpatient amniotomy for induction versus routine care, Outcome 8 Neonatal intensive care unit admission.

Comparison 11 Outpatient amniotomy for induction versus routine care, Outcome 9 Duration of birth (hours).
| Vaginal PGE₂ compared to placebo or expectant management for the induction of labour in outpatient settings | ||||||
| Patient or population: women requiring term labour induction | ||||||
| Outcomes | Anticipated absolute effects* (95% CI) | Relative effect | № of participants | Quality of the evidence | Comments | |
| Risk with placebo or expectant management | Risk with intravaginal PGE₂ gel | |||||
| Vaginal birth not achieved within 24 h | Study population | ‐ | (0 study) | ‐ | No included trial reported this outcome. | |
| see comment | see comment | |||||
| Vaginal birth not achieved in 48 to 72 h | Study population | ‐ | (0 study) | ‐ | No included trial reported this outcome. | |
| see comment | see comment | |||||
| Uterine hyperstimulation (fetal heart rate changes unclear) | Study population | RR 3.76 | 244 | ⊕⊕⊝⊝ | There were no events in the control group and so it was not possible to calculate the anticipated absolute effects. | |
| see comment | see comment | |||||
| Caesarean section | Study population | RR 0.80 | 288 | ⊕⊕⊝⊝ | ||
| 196 per 1000 | 157 per 1000 | |||||
| Serious neonatal morbidity or death | Study population | ‐ | (0 study) | ‐ | No included trial reported this outcome. | |
| see comment | see comment | |||||
| Serious maternal morbidity or death | Study population | ‐ | (0 studies) | ‐ | No included trial reported this outcome. | |
| see comment | see comment | |||||
| Neonatal intensive care unit admission | Study population | RR 0.32 | 230 | ⊕⊕⊝⊝ | ||
| 93 per 1000 | 30 per 1000 | |||||
| *The risk in the intervention group (and its 95% confidence interval) is based on the assumed risk in the comparison group and the relative effect of the intervention (and its 95% CI). | ||||||
| GRADE Working Group grades of evidence | ||||||
| 1 Wide confidence interval crossing the line of no effect, few events and small sample size (‐2). 2 Wide confidence interval crossing the line of no effect and small sample size (‐2). | ||||||
| Intracervical PGE₂ compared to placebo for the induction of labour in outpatient settings | ||||||
| Patient or population: women requiring induction of labour | ||||||
| Outcomes | Anticipated absolute effects* (95% CI) | Relative effect | № of participants | Quality of the evidence | Comments | |
| Risk with placebo | Risk with intracervical PGE₂ | |||||
| Vaginal birth not achieved within 24 h | Study population | ‐ | (0 study) | ‐ | No included trial reported this outcome. | |
| see comment | see comment | |||||
| Vaginal birth not achieved in 48 to 72 h | Study population | RR 0.83 | 43 | ⊕⊕⊝⊝ | ||
| 1000 per 1000 | 830 per 1000 | |||||
| Uterine hyperstimulation (with fetal heart rate changes) | Study population | RR 2.66 | 488 | ⊕⊕⊝⊝ | ||
| 4 per 1000 | 11 per 1000 | |||||
| Caesarean section | Study population | RR 0.90 | 674 | ⊕⊕⊕⊝ | ||
| 310 per 1000 | 279 per 1000 | |||||
| Serious neonatal morbidity or death | Study population | ‐ | (0 study) | ‐ | ||
| see comment | see comment | |||||
| Serious maternal morbidity or death | Study population | ‐ | (0 study) | ‐ | ||
| see comment | see comment | |||||
| Neonatal intensive care unit admission | Study population | RR 1.61 | 215 | ⊕⊕⊝⊝ | ||
| 28 per 1000 | 44 per 1000 | |||||
| *The risk in the intervention group (and its 95% confidence interval) is based on the assumed risk in the comparison group and the relative effect of the intervention (and its 95% CI). | ||||||
| GRADE Working Group grades of evidence | ||||||
| 1 Wide confidence interval crossing the line of no effect, few events and small sample size (‐2). 2 Wide confidence interval crossing the line of no effect (‐1). | ||||||
| Vaginal misoprostol compared to placebo for the induction of labour in outpatient settings | ||||||
| Patient or population: women requiring induction of labour | ||||||
| Outcomes | Anticipated absolute effects* (95% CI) | Relative effect | № of participants | Quality of the evidence | Comments | |
| Risk with placebo | Risk with vaginal misoprostol | |||||
| Vaginal birth not achieved within 24 h | Study population | ‐ | (0 study) | ‐ | No included trial reported this outcome. | |
| see comment | see comment | |||||
| Vaginal birth not achieved within 48 and 72 h | Study population | ‐ | (0 study) | ‐ | No included trial reported this outcome. | |
| see comment | see comment | |||||
| Uterine hyperstimulation (with fetal heart rate changes) | Study population | RR 1.97 | 265 | ⊕⊕⊝⊝ | ||
| 15 per 1000 | 29 per 1000 | |||||
| Caesarean section | Study population | RR 0.94 | 325 | ⊕⊕⊝⊝ | ||
| 206 per 1000 | 194 per 1000 | |||||
| Serious neonatal morbidity or death | Study population | RR 0.34 | 77 | ⊕⊕⊝⊝ | Study reported perinatal deaths. | |
| 26 per 1000 | 9 per 1000 | |||||
| Serious maternal morbidity or death | Study population | ‐ | (0 study) | ‐ | No included trial reported this outcome. | |
| see comment | see comment | |||||
| Neonatal intensive care unit admission | Study population | RR 0.89 | 325 | ⊕⊕⊝⊝ | ||
| 147 per 1000 | 131 per 1000 | |||||
| *The risk in the intervention group (and its 95% confidence interval) is based on the assumed risk in the comparison group and the relative effect of the intervention (and its 95% CI). | ||||||
| GRADE Working Group grades of evidence | ||||||
| 1 Wide confidence interval crossing the line of no effect, few events and small sample size (‐2). 2 Wide confidence interval crossing the line of no effect and small sample size (‐2). | ||||||
| Uterine hyperstimulation | |
| PGE₂(vaginal) | |
| 1/18 PGE group (FHR status unknown), 0/18 in placebo group | |
| 2/28 PGE group (FHR status unknown), 0/30 in control group (no treatment) | |
| 1/50 PGE group (normal FHR), 0/50 in placebo group | |
| Total | 4/96 PGE, 0/98 in control group |
| PGE₂(intracervical) | |
| 1/23 PGE group (with FHR decelerations), 0/20 in placebo group | |
| 2/43 PGE group, 1/47 placebo group with FHR deceleration in both | |
| 1/30 PGE group (fetal bradycardia), 0/31 placebo group | |
| 1/143 PGE group, 0/151 control (no treatment) with hyperstimulation 11/143 FHR decelerations in PGE group, 12/151 in control | |
| Total | 5/239 PGE, 1/249 control with hyperstimulation |
| Intravaginal misoprostol | |
| 2/27 misoprostol group with FHR deceleration, 2/33 placebo group 1/27 misoprostol with tachysystole without FHR changes, 0/33 placebo group | |
| 3/57 misoprostol with hyperstimulation (FHR unknown), 2/63 placebo group 2/57 misoprostol with hypertonus, 5/57 misoprostol with tachysystole, none control | |
| 1/33 misoprostol (FHR deceleration), 0/35 placebo group | |
| Oral misoprostol | |
| 1/18 misoprostol, 2/22 placebo group (FHR unknown) with hyperstimulation | |
| 8/43 misoprostol, 4/44 placebo group hyperstimulation syndrome (tachysystole or hypertonus, with FHR changes) | |
| Total | 9/61 misoprostol, 6/66 placebo group |
| Mifepristone | |
| 4/41 mifepristone group, 0/42 placebo group with hypertonia (FHR unknown) | |
| 0/16 in both groups | |
| Total | 4/57 mifepristone, 0/58 placebo with hypertonia |
| IMN | |
| 0/51 IMN group, 2/51 placebo group with hyperstimulation (abnormal FHR) 1/51 IMN, 8/51 placebo group with tachysystolia (FHR normal) | |
| 0/100 IMN group, 5/100 placebo group with hyperstimulation (FHR changes unclear) | |
| Total | 1/151 IMN group, 15/151 placebo group (hyperstimulation or tachysystolia, ±FHR changes) |
| IMN: isosorbide mononitrate; FHR: fetal heart rate | |
| Neonatal complications | |
| PGE₂vaginal | |
| 0/24 in PGE₂ group; 2/26 in placebo group to NICU | |
| 2/38 in PGE₂; 4/42 in placebo group to NICU | |
| 1/50 in PGE₂; 5/50 in placebo group to NICU | |
| Total | 3/112 PGE, 11/118 control to NICU |
| PGE₂intracervical | |
| 6/41 PGE group, 8/43 placebo group with complication such as tachypnoea, meconium aspiration, meconium or admission to NICU | |
| 3/35 PGE₂ versus 0/35 control NICU admission | |
| 1/30 PGE, 2/31 placebo group with complication | |
| Total | 10/106 PGE, 10/109 controls with neonatal complications/admitted to NICU |
| Vaginal misoprostol | |
| 1/27 misoprostol, 3/33 placebo group to NICU | |
| 18/57 misoprostol, 20/63 placebo group to NICU | |
| 0/33 misoprostol, 1/35 placebo group to NICU | |
| 1/38 misoprostol, 1/39 control (no treatment) to NICU | |
| 1/43 misoprostol, 1/44 placebo group to NICU | |
| Total | 21/198 misoprostol, 26/214 control to NICU |
| Misoprostol 25 µg versus 50 µg | |
| 1/23 25 µg, 2/26 50 µg misoprostol to NICU | |
| Intracervical PGE₂versus intravaginal misoprostol | |
| 5/42 PGE, 4/42 misoprostol to NICU | |
| Mifepristone | |
| 0/50 mifepristone, 1/30 placebo group to NICU | |
| 5/41 mifepristone, 4/42 control to NICU | |
| Total | 5/91 mifepristone, 5/72 control to NICU |
| IMN | |
| 18/177 IMN, 16/173 placebo group to NICU | |
| 13/100 IMN, 9/100 placebo group to NICU | |
| 0/51 IMN, 1/51 placebo group to NICU | |
| 5/100 IMN, 14/100 placebo group to nursery admission | |
| 0/36 IMN, 0/36 placebo group to NICU | |
| 1/72 IMN, 1/72 placebo group to NICU | |
| Total | 37/536 IMN, 41/532 placebo group to NICU |
| Outpatient amniotomy for induction versus routine care | |
| 27/270 IMN, 23/251 placebo group to NICU | |
| NICU: neonatal intensive‐care unit | |
| Maternal complications | |
| Intracervical PGE₂ | |
| 4/41 PGE, 10/43 placebo group with complication such as endometritis, chorioamnionitis and pre‐eclampsia | |
| 6/43 PGE, 3/47 placebo group with complication such as endometritis and chorioamnionitis | |
| 1/30 PGE with PPH, 0/31 placebo group 2/30 PGE, 2/31 placebo group with infection | |
| 8/143 PGE, 7/151 control (no treatment) with endometritis | |
| Total | 21/257 PGE₂, 22/272 control with maternal complications |
| Oral misoprostol | |
| 8/43 misoprostol group, 9/44 placebo group with chorioamnionitis 1/43 misoprostol group, 2/44 placebo group with endometritis 2/43 misoprostol group, 0/44 placebo group with PPH | |
| Total | 11/43 misoprostol group, 11/44 placebo group with maternal complications |
| IMN | |
| Blood loss > 500 mL: 59/177 IMN, 47/173 placebo group | |
| Blood loss > 1000 mL: 14/100 IMN, 12/100 placebo group | |
| PPH: 2/51 IMN, 3/51 placebo group | |
| 2/100 IMN group, 3/100 placebo group with PPH | |
| 0/36 IMN group, 0/36 placebo group with need for blood transfusion | |
| 0/678 IMN group, 0/684 placebo group for maternal death 124/678 IMN group, 112/684 placebo group for PPH 20/678 IMN group, 13/684 placebo group for severe PPH 1/678 IMN group, 0/684 placebo group for deep vein thrombosis | |
| Total | 202/1142 IMN group, 204/1148 placebo group with maternal complications |
| Outpatient amniotomy | |
| 26/270 amniotomy group, 29/251 routine care group ‐ mother treated with antibiotics | |
| PPH: postpartum haemorrhage | |
| Outcome or subgroup title | No. of studies | No. of participants | Statistical method | Effect size |
| 1 Additional induction agents required Show forest plot | 2 | 150 | Risk Ratio (M‐H, Fixed, 95% CI) | 0.52 [0.27, 0.99] |
| 2 Epidural Show forest plot | 1 | 100 | Risk Ratio (M‐H, Fixed, 95% CI) | 0.83 [0.62, 1.12] |
| 3 Uterine hyperstimulation (FHR changes unclear) Show forest plot | 4 | 244 | Risk Ratio (M‐H, Fixed, 95% CI) | 3.76 [0.64, 22.24] |
| 4 Caesarean section Show forest plot | 4 | 288 | Risk Ratio (M‐H, Fixed, 95% CI) | 0.80 [0.49, 1.31] |
| 5 Apgar score < 7 at 5 minutes Show forest plot | 2 | 180 | Risk Ratio (M‐H, Fixed, 95% CI) | 0.45 [0.07, 2.93] |
| 6 NICU admission Show forest plot | 3 | 230 | Risk Ratio (M‐H, Fixed, 95% CI) | 0.32 [0.10, 1.03] |
| 7 Chorioamnionitis Show forest plot | 2 | 180 | Risk Ratio (M‐H, Fixed, 95% CI) | 0.37 [0.15, 0.90] |
| 8 Indicator of 'progress' in labour ‐ Cervix unchanged at follow up (not pre‐specified) Show forest plot | 1 | 36 | Risk Ratio (M‐H, Fixed, 95% CI) | 0.13 [0.03, 0.47] |
| 9 'Spontaneous labour' within 48 hours Show forest plot | 1 | 58 | Risk Ratio (M‐H, Fixed, 95% CI) | 6.43 [2.12, 19.48] |
| 10 Indicator of 'progress' in labour ‐ Admitted to hospital for labour Show forest plot | 1 | 100 | Risk Ratio (M‐H, Fixed, 95% CI) | 2.7 [1.47, 4.97] |
| 11 Time to birth ‐ Gestational age at birth (weeks) Show forest plot | 1 | 100 | Mean Difference (IV, Fixed, 95% CI) | ‐0.60 [‐0.99, ‐0.21] |
| 12 Time to birth ‐ Gestational age on admission (days) Show forest plot | 1 | 80 | Mean Difference (IV, Fixed, 95% CI) | ‐2.0 [‐4.17, 0.17] |
| Outcome or subgroup title | No. of studies | No. of participants | Statistical method | Effect size |
| 1 Additional induction agent required (induction with oxytocin or other means) Show forest plot | 3 | 445 | Risk Ratio (M‐H, Fixed, 95% CI) | 0.98 [0.74, 1.32] |
| 2 Additional induction agents required (further prostaglandin required) Show forest plot | 1 | 90 | Risk Ratio (M‐H, Fixed, 95% CI) | 0.61 [0.22, 1.67] |
| 3 Uterine rupture Show forest plot | 1 | 294 | Risk Ratio (M‐H, Fixed, 95% CI) | 0.0 [0.0, 0.0] |
| 4 Birth not achieved in 48 to 72 hours Show forest plot | 1 | 43 | Risk Ratio (M‐H, Fixed, 95% CI) | 0.83 [0.68, 1.02] |
| 5 Oxytocin augmentation Show forest plot | 1 | 84 | Risk Ratio (M‐H, Fixed, 95% CI) | 0.67 [0.40, 1.12] |
| 6 Uterine hyperstimulation (with FHR changes) Show forest plot | 4 | 488 | Risk Ratio (M‐H, Fixed, 95% CI) | 2.66 [0.63, 11.25] |
| 7 Assisted (instrumental) vaginal birth Show forest plot | 4 | 538 | Risk Ratio (M‐H, Fixed, 95% CI) | 1.29 [0.85, 1.96] |
| 8 Caesarean section Show forest plot | 7 | 674 | Risk Ratio (M‐H, Fixed, 95% CI) | 0.90 [0.72, 1.12] |
| 9 Apgar score < 7 at 5 minutes Show forest plot | 4 | 515 | Risk Ratio (M‐H, Fixed, 95% CI) | 0.82 [0.42, 1.60] |
| 10 NICU admission Show forest plot | 3 | 215 | Risk Ratio (M‐H, Fixed, 95% CI) | 1.61 [0.43, 6.05] |
| 11 Postpartum haemorrhage (> 500 mL) Show forest plot | 1 | 61 | Risk Ratio (M‐H, Fixed, 95% CI) | 3.10 [0.13, 73.16] |
| 12 Chorioamnionitis Show forest plot | 3 | 468 | Risk Ratio (M‐H, Fixed, 95% CI) | 2.03 [0.66, 6.18] |
| 13 Endometritis Show forest plot | 2 | 174 | Risk Ratio (M‐H, Fixed, 95% CI) | 1.60 [0.27, 9.37] |
| 14 Side effects ‐ Maternal side effects Show forest plot | 2 | 384 | Risk Ratio (M‐H, Fixed, 95% CI) | 0.59 [0.13, 2.77] |
| 15 Time to birth ‐ Interval from intervention to birth (days) Show forest plot | 2 | 133 | Std. Mean Difference (IV, Fixed, 95% CI) | ‐0.20 [‐0.55, 0.14] |
| 16 Time to birth ‐ Gestational age at birth (weeks) Show forest plot | 2 | 156 | Mean Difference (IV, Random, 95% CI) | ‐0.06 [‐0.35, 0.23] |
| 17 Indicator of 'progress' in labour ‐ Induction for gestational age > 42 weeks Show forest plot | 2 | Risk Ratio (M‐H, Fixed, 95% CI) | Totals not selected | |
| 18 Time to birth ‐ Birth within 48 hours of treatment (all births) Show forest plot | 1 | 61 | Risk Ratio (M‐H, Fixed, 95% CI) | 3.1 [1.29, 7.47] |
| Outcome or subgroup title | No. of studies | No. of participants | Statistical method | Effect size |
| 1 Serious neonatal morbidity or death Show forest plot | 1 | 77 | Risk Ratio (M‐H, Fixed, 95% CI) | 0.34 [0.01, 8.14] |
| 2 Epidural Show forest plot | 1 | 50 | Risk Ratio (M‐H, Fixed, 95% CI) | 0.98 [0.77, 1.26] |
| 3 Uterine hyperstimulation (with FHR changes) Show forest plot | 3 | 265 | Risk Ratio (M‐H, Fixed, 95% CI) | 1.97 [0.43, 9.00] |
| 4 Uterine hyperstimulation (without FHR changes) Show forest plot | 2 | 137 | Risk Ratio (M‐H, Fixed, 95% CI) | 3.64 [0.15, 85.97] |
| 5 Assisted (instrumental) vaginal birth Show forest plot | 2 | 145 | Risk Ratio (M‐H, Fixed, 95% CI) | 0.91 [0.50, 1.67] |
| 6 Caesarean section Show forest plot | 4 | 325 | Risk Ratio (M‐H, Fixed, 95% CI) | 0.94 [0.61, 1.46] |
| 7 Apgar score < 7 at 5 minutes Show forest plot | 3 | 248 | Risk Ratio (M‐H, Fixed, 95% CI) | 0.21 [0.01, 4.25] |
| 8 NICU admission Show forest plot | 4 | 325 | Risk Ratio (M‐H, Fixed, 95% CI) | 0.89 [0.54, 1.47] |
| 9 Perinatal death Show forest plot | 1 | 77 | Risk Ratio (M‐H, Fixed, 95% CI) | 0.34 [0.01, 8.14] |
| 10 Neonatal infection Show forest plot | 1 | 68 | Risk Ratio (M‐H, Fixed, 95% CI) | 0.30 [0.07, 1.36] |
| 11 Indicator of 'progress' in labour ‐ Oxytocin dose used (mU) Show forest plot | 1 | 72 | Mean Difference (IV, Fixed, 95% CI) | 1508.70 [‐2357.55, 5374.95] |
| 12 Indicator of 'progress' in labour ‐ Number of medication dose Show forest plot | 1 | 60 | Mean Difference (IV, Fixed, 95% CI) | ‐0.44 [‐0.49, ‐0.39] |
| 13 Indicator of 'progress' in labour ‐ Number of women requiring dosing on day 2 Show forest plot | 1 | 60 | Risk Ratio (M‐H, Fixed, 95% CI) | 0.61 [0.43, 0.87] |
| 14 Indicator of 'progress' in labour ‐ Number of women requiring induction on day 3 Show forest plot | 1 | 60 | Risk Ratio (M‐H, Fixed, 95% CI) | 0.13 [0.04, 0.38] |
| 15 Indicator of 'progress' in labour ‐ Days to admission (all) (days) Show forest plot | 1 | 77 | Mean Difference (IV, Fixed, 95% CI) | ‐2.90 [‐4.99, ‐0.81] |
| 16 Indicator of 'progress' in labour ‐ Days to admission (subgroups by parity) (days) Show forest plot | 1 | 77 | Mean Difference (IV, Fixed, 95% CI) | ‐3.15 [‐5.40, ‐0.89] |
| 16.1 Nulliparous women | 1 | 41 | Mean Difference (IV, Fixed, 95% CI) | ‐3.20 [‐6.44, 0.04] |
| 16.2 Parous women | 1 | 36 | Mean Difference (IV, Fixed, 95% CI) | ‐3.10 [‐6.24, 0.04] |
| 17 Indicator of 'progress' in labour ‐ Gestational age at labour (weeks) Show forest plot | 1 | 77 | Mean Difference (IV, Fixed, 95% CI) | ‐0.80 [‐1.05, ‐0.55] |
| 18 Indicator of 'progress' in labour ‐ Days to admission (parous) (weeks) Show forest plot | 1 | 36 | Mean Difference (IV, Fixed, 95% CI) | ‐3.10 [‐6.24, 0.04] |
| 19 Indicator of 'progress' in labour ‐ Days to PROM (days) Show forest plot | 1 | 77 | Mean Difference (IV, Fixed, 95% CI) | ‐2.5 [‐4.14, ‐0.86] |
| 20 Time to birth ‐ Interval from intervention to vaginal birth (days) Show forest plot | 1 | 50 | Mean Difference (IV, Fixed, 95% CI) | ‐1.4 [‐3.51, 0.71] |
| 21 Time to birth ‐ Days to birth (all) (days) Show forest plot | 1 | 68 | Mean Difference (IV, Fixed, 95% CI) | ‐1.90 [‐3.74, ‐0.06] |
| 22 Time to birth ‐ Days to birth (subgroups by parity) (days) Show forest plot | 1 | Mean Difference (IV, Fixed, 95% CI) | Subtotals only | |
| 22.1 Nulliparous women | 1 | 39 | Mean Difference (IV, Fixed, 95% CI) | ‐3.0 [‐5.42, ‐0.58] |
| 22.2 Parous women | 1 | 29 | Mean Difference (IV, Fixed, 95% CI) | ‐0.60 [‐3.51, 2.31] |
| Outcome or subgroup title | No. of studies | No. of participants | Statistical method | Effect size |
| 1 Additional induction agents required (oxytocin) Show forest plot | 1 | 49 | Risk Ratio (M‐H, Fixed, 95% CI) | 2.26 [0.22, 23.33] |
| 2 Uterine hyperstimulation Show forest plot | 1 | 49 | Risk Ratio (M‐H, Fixed, 95% CI) | 0.0 [0.0, 0.0] |
| 3 Caesarean section Show forest plot | 1 | 49 | Risk Ratio (M‐H, Fixed, 95% CI) | 0.94 [0.33, 2.68] |
| 4 NICU admission Show forest plot | 1 | 49 | Risk Ratio (M‐H, Fixed, 95% CI) | 0.57 [0.05, 5.83] |
| 5 Interval from treatment to birth (in days, all births) Show forest plot | 1 | 49 | Mean Difference (IV, Fixed, 95% CI) | 1.5 [1.19, 1.81] |
| Outcome or subgroup title | No. of studies | No. of participants | Statistical method | Effect size |
| 1 Uterine hyperstimulation (with or without FHR changes) Show forest plot | 1 | 64 | Risk Ratio (M‐H, Fixed, 95% CI) | 0.26 [0.03, 2.73] |
| 2 Caesarean section Show forest plot | 1 | 84 | Risk Ratio (M‐H, Fixed, 95% CI) | 0.89 [0.38, 2.08] |
| 3 Apgar score < 7 after 5 minutes Show forest plot | 1 | 84 | Risk Ratio (M‐H, Fixed, 95% CI) | 0.33 [0.01, 7.96] |
| 4 Admission to NICU Show forest plot | 1 | 84 | Risk Ratio (M‐H, Fixed, 95% CI) | 1.25 [0.36, 4.33] |
| 5 Indicator of 'progress' in labour ‐ Interval from administration to admission (hours) Show forest plot | 1 | 75 | Mean Difference (IV, Fixed, 95% CI) | 2.5 [2.22, 2.78] |
| 6 Indicator of 'progress' in labour ‐ Labour or SROM during ripening Show forest plot | 1 | 83 | Risk Ratio (M‐H, Fixed, 95% CI) | 0.31 [0.14, 0.69] |
| 7 Time to birth ‐ Birth within 24 hours Show forest plot | 1 | 83 | Risk Ratio (M‐H, Fixed, 95% CI) | 0.90 [0.75, 1.07] |
| 8 Time to birth ‐ Birth within 48 hours (cumulative) Show forest plot | 1 | 83 | Risk Ratio (M‐H, Fixed, 95% CI) | 0.93 [0.81, 1.06] |
| Outcome or subgroup title | No. of studies | No. of participants | Statistical method | Effect size |
| 1 Vaginal delivery not achieved within 24 hours Show forest plot | 1 | 87 | Risk Ratio (M‐H, Fixed, 95% CI) | 0.65 [0.48, 0.86] |
| 2 Additional induction agents required Show forest plot | 2 | 127 | Risk Ratio (M‐H, Fixed, 95% CI) | 0.60 [0.37, 0.97] |
| 3 Oxytocin augmentation Show forest plot | 1 | 87 | Risk Ratio (M‐H, Fixed, 95% CI) | 0.81 [0.61, 1.08] |
| 4 Uterine hyperstimulation (with FHR changes) Show forest plot | 1 | 87 | Risk Ratio (M‐H, Fixed, 95% CI) | 1.53 [0.47, 5.06] |
| 5 Uterine hyperstimulation (FHR changes unclear) Show forest plot | 1 | 40 | Risk Ratio (M‐H, Fixed, 95% CI) | 0.61 [0.06, 6.21] |
| 6 Instrumental vaginal birth Show forest plot | 1 | 87 | Risk Ratio (M‐H, Fixed, 95% CI) | 0.51 [0.17, 1.57] |
| 7 Caesarean section Show forest plot | 1 | 86 | Risk Ratio (M‐H, Fixed, 95% CI) | 0.62 [0.28, 1.33] |
| 8 Apgar score < 7 at 5 minutes Show forest plot | 1 | 87 | Risk Ratio (M‐H, Fixed, 95% CI) | 0.0 [0.0, 0.0] |
| 9 Neonatal intensive care unit admission Show forest plot | 1 | 87 | Risk Ratio (M‐H, Fixed, 95% CI) | 1.02 [0.07, 15.84] |
| 10 Postpartum haemorrhage Show forest plot | 1 | 87 | Risk Ratio (M‐H, Fixed, 95% CI) | 5.11 [0.25, 103.51] |
| 11 Chorioamnionitis Show forest plot | 2 | 124 | Risk Ratio (M‐H, Fixed, 95% CI) | 1.06 [0.52, 2.17] |
| 12 Endometritis Show forest plot | 1 | 87 | Risk Ratio (M‐H, Fixed, 95% CI) | 0.51 [0.05, 5.44] |
| 13 Indicator of 'progress' in labour ‐ Time from first dose to active labor (hours) Show forest plot | 2 | 127 | Mean Difference (IV, Fixed, 95% CI) | ‐37.08 [‐52.44, ‐21.72] |
| 14 Time to birth ‐ First dose to birth (hours) Show forest plot | 1 | 87 | Mean Difference (IV, Fixed, 95% CI) | ‐37.94 [‐57.97, ‐17.91] |
| 15 Indicator of 'progress' in labour ‐ Total doses of medication Show forest plot | 1 | 40 | Mean Difference (IV, Fixed, 95% CI) | ‐0.51 [‐0.92, ‐0.10] |
| Outcome or subgroup title | No. of studies | No. of participants | Statistical method | Effect size |
| 1 Additional induction agents required Show forest plot | 4 | 311 | Risk Ratio (M‐H, Random, 95% CI) | 0.59 [0.37, 0.95] |
| 2 Serious neonatal morbidity or death Show forest plot | 1 | 36 | Risk Ratio (M‐H, Fixed, 95% CI) | 1.56 [0.07, 35.67] |
| 3 Oxytocin augmentation Show forest plot | 2 | 116 | Risk Ratio (M‐H, Fixed, 95% CI) | 0.89 [0.63, 1.26] |
| 4 Epidural Show forest plot | 1 | 112 | Risk Ratio (M‐H, Fixed, 95% CI) | 0.87 [0.73, 1.03] |
| 5 Assisted (instrumental) vaginal birth Show forest plot | 5 | 343 | Risk Ratio (M‐H, Fixed, 95% CI) | 1.35 [0.93, 1.97] |
| 6 Caesarean section Show forest plot | 5 | 343 | Risk Ratio (M‐H, Fixed, 95% CI) | 0.88 [0.62, 1.25] |
| 7 Apgar score < 7 at 5 minutes Show forest plot | 2 | 119 | Risk Ratio (M‐H, Fixed, 95% CI) | 1.56 [0.07, 35.67] |
| 8 NICU admission Show forest plot | 2 | 163 | Risk Ratio (M‐H, Fixed, 95% CI) | 0.93 [0.31, 2.79] |
| 9 Perinatal death Show forest plot | 1 | 32 | Risk Ratio (M‐H, Fixed, 95% CI) | 0.0 [0.0, 0.0] |
| 10 Uterine scar separation Show forest plot | 1 | 32 | Risk Ratio (M‐H, Fixed, 95% CI) | 1.0 [0.07, 14.64] |
| 11 Chorioamnionitis Show forest plot | 1 | 32 | Risk Ratio (M‐H, Fixed, 95% CI) | 2.0 [0.20, 19.91] |
| 12 Indicator of 'progress' in labour ‐ Labour or ripe cervix in 48 hours Show forest plot | 1 | 36 | Risk Ratio (M‐H, Fixed, 95% CI) | 2.0 [1.00, 4.00] |
| 13 Indicator of 'progress' in labour ‐ Cervix unchanged after 24/48 hours Show forest plot | 2 | 119 | Risk Ratio (M‐H, Fixed, 95% CI) | 0.36 [0.20, 0.63] |
| 14 Indicator of 'progress' in labour ‐ Spontaneous labour within 72 hours Show forest plot | 1 | 80 | Risk Ratio (M‐H, Fixed, 95% CI) | 1.46 [0.68, 3.10] |
| 15 Indicator of 'progress' in labour ‐ Spontaneous labour within 48 hours Show forest plot | 1 | 83 | Risk Ratio (M‐H, Fixed, 95% CI) | 2.05 [1.27, 3.30] |
| 16 Indicator of 'progress' in labour ‐ Oxytocin requirements (IU) Show forest plot | 1 | 32 | Mean Difference (IV, Fixed, 95% CI) | ‐2.56 [‐4.01, ‐1.11] |
| 17 Indicator of 'progress' in labour ‐ Interval between day 1 and start of labour (hours) Show forest plot | 1 | 32 | Mean Difference (IV, Fixed, 95% CI) | ‐22.15 [‐35.96, ‐8.34] |
| Outcome or subgroup title | No. of studies | No. of participants | Statistical method | Effect size |
| 1 Oxytocin augmentation Show forest plot | 1 | 87 | Risk Ratio (M‐H, Fixed, 95% CI) | 0.93 [0.61, 1.43] |
| 2 Assisted (instrumental) vaginal birth Show forest plot | 1 | 87 | Risk Ratio (M‐H, Fixed, 95% CI) | 0.84 [0.44, 1.60] |
| 3 Caesarean section Show forest plot | 1 | 87 | Risk Ratio (M‐H, Fixed, 95% CI) | 1.27 [0.63, 2.58] |
| 4 NICU admission Show forest plot | 1 | 87 | Risk Ratio (M‐H, Fixed, 95% CI) | 0.98 [0.06, 15.13] |
| 5 Chorioamnionitis Show forest plot | 1 | 87 | Risk Ratio (M‐H, Fixed, 95% CI) | 1.95 [0.38, 10.12] |
| 6 Endometritis Show forest plot | 1 | 87 | Risk Ratio (M‐H, Fixed, 95% CI) | 2.93 [0.32, 27.10] |
| Outcome or subgroup title | No. of studies | No. of participants | Statistical method | Effect size |
| 1 Vaginal birth not achieved in 24/48 hours Show forest plot | 1 | 238 | Risk Ratio (M‐H, Fixed, 95% CI) | 0.97 [0.83, 1.15] |
| 2 Additional induction agents required Show forest plot | 4 | 1921 | Risk Ratio (M‐H, Random, 95% CI) | 0.87 [0.75, 1.00] |
| 3 Maternal satisfaction Show forest plot | 1 | Mean Difference (IV, Fixed, 95% CI) | Subtotals only | |
| 3.1 How do you think your labour went? (easy/very difficult) | 1 | 227 | Mean Difference (IV, Fixed, 95% CI) | ‐0.34 [‐0.94, 0.26] |
| 3.2 What do you think about home treatment? (extremely good/not at all good) | 1 | 227 | Mean Difference (IV, Fixed, 95% CI) | 0.61 [0.03, 1.19] |
| 3.3 How painful was the treatment at home? (not at all/very) | 1 | 227 | Mean Difference (IV, Fixed, 95% CI) | 0.58 [‐0.00, 1.16] |
| 3.4 How anxious were you being at home taking the treatment? (not at all/very) | 1 | 227 | Mean Difference (IV, Fixed, 95% CI) | 0.11 [‐0.39, 0.61] |
| 3.5 Would you have the same treatment at home again? (definitely/definitely not) | 1 | 227 | Mean Difference (IV, Fixed, 95% CI) | 0.62 [‐0.02, 1.26] |
| 3.6 Would you advise a friend to have the same treatment at home? (definitely/definitely not) | 1 | 227 | Mean Difference (IV, Fixed, 95% CI) | 0.41 [‐0.17, 0.99] |
| 4 Maternal satisfaction Show forest plot | 2 | Risk Ratio (M‐H, Fixed, 95% CI) | Subtotals only | |
| 4.1 Felt satisfied (very or extremely) | 1 | 1049 | Risk Ratio (M‐H, Fixed, 95% CI) | 0.80 [0.67, 0.94] |
| 4.2 Would recommend the same treatment | 1 | 1049 | Risk Ratio (M‐H, Fixed, 95% CI) | 0.84 [0.77, 0.90] |
| 4.3 Would recommend procedure | 1 | 193 | Risk Ratio (M‐H, Fixed, 95% CI) | 1.01 [0.94, 1.08] |
| 5 Perinatal death Show forest plot | 2 | 1712 | Risk Ratio (M‐H, Random, 95% CI) | 1.61 [0.08, 33.26] |
| 6 Neonatal trauma (long bone fracture, collarbone fracture, basal skull fracture, brachial plexus palsy, facial nerve palsy, phrenic nerve palsy, or subdural haemorrhage) Show forest plot | 1 | 1362 | Risk Ratio (M‐H, Fixed, 95% CI) | 0.67 [0.19, 2.37] |
| 7 Neonatal convulsions in the first 24 hours Show forest plot | 1 | 1362 | Risk Ratio (M‐H, Fixed, 95% CI) | 0.0 [0.0, 0.0] |
| 8 Tracheal ventilation > 24 hours Show forest plot | 1 | 1362 | Risk Ratio (M‐H, Fixed, 95% CI) | 1.01 [0.14, 7.14] |
| 9 Neonatal ICU admission for 5 or more days Show forest plot | 1 | 1362 | Risk Ratio (M‐H, Fixed, 95% CI) | 0.67 [0.19, 2.37] |
| 10 Neonatal transfer Show forest plot | 1 | 1362 | Risk Ratio (M‐H, Fixed, 95% CI) | 1.07 [0.67, 1.70] |
| 11 Maternal death Show forest plot | 1 | 1362 | Risk Ratio (M‐H, Fixed, 95% CI) | 0.0 [0.0, 0.0] |
| 12 Severe postpartum haemorrhage Show forest plot | 1 | 1362 | Risk Ratio (M‐H, Fixed, 95% CI) | 1.55 [0.78, 3.09] |
| 13 Deep vein thrombosis Show forest plot | 1 | 1362 | Risk Ratio (M‐H, Fixed, 95% CI) | 3.03 [0.12, 74.16] |
| 14 Oxytocin augmentation Show forest plot | 3 | 1816 | Risk Ratio (M‐H, Random, 95% CI) | 0.95 [0.78, 1.14] |
| 15 Epidural Show forest plot | 1 | 350 | Risk Ratio (M‐H, Fixed, 95% CI) | 0.94 [0.82, 1.09] |
| 16 Uterine hyperstimulation (with FHR changes) Show forest plot | 1 | 102 | Risk Ratio (M‐H, Fixed, 95% CI) | 0.2 [0.01, 4.07] |
| 17 Uterine hyperstimulation (FHR changes unclear) Show forest plot | 1 | 200 | Risk Ratio (M‐H, Fixed, 95% CI) | 0.09 [0.01, 1.62] |
| 18 Assisted (instrumental) vaginal birth Show forest plot | 2 | 1712 | Risk Ratio (M‐H, Fixed, 95% CI) | 0.81 [0.61, 1.07] |
| 19 Caesarean section Show forest plot | 6 | 2286 | Risk Ratio (M‐H, Fixed, 95% CI) | 0.99 [0.87, 1.14] |
| 20 Apgar score < 7 at 5 minutes Show forest plot | 5 | 2214 | Risk Ratio (M‐H, Fixed, 95% CI) | 0.88 [0.44, 1.76] |
| 21 NICU (or SCBU) admission Show forest plot | 6 | 1068 | Risk Ratio (M‐H, Fixed, 95% CI) | 0.89 [0.59, 1.36] |
| 22 Postpartum haemorrhage (> 500 mL) Show forest plot | 5 | 2214 | Risk Ratio (M‐H, Fixed, 95% CI) | 1.13 [0.95, 1.36] |
| 23 Neonatal infection Show forest plot | 1 | 200 | Risk Ratio (M‐H, Fixed, 95% CI) | 1.0 [0.26, 3.89] |
| 24 Side effects ‐ Maternal side effect ‐ nausea Show forest plot | 4 | 1926 | Risk Ratio (M‐H, Random, 95% CI) | 2.39 [1.54, 3.70] |
| 25 Side effects ‐ Maternal side effect ‐ headache Show forest plot | 7 | 2300 | Risk Ratio (M‐H, Random, 95% CI) | 5.45 [3.38, 8.81] |
| 26 Side effects ‐ Maternal side effects ‐ severe headache Show forest plot | 1 | 220 | Risk Ratio (M‐H, Fixed, 95% CI) | 21.21 [2.91, 154.65] |
| 27 Indicator of 'progress' in labour ‐ Admitted in established labour within 24 hours Show forest plot | 1 | 200 | Risk Ratio (M‐H, Fixed, 95% CI) | 2.75 [1.29, 5.88] |
| 28 Indicator of 'progress' in labour ‐ Bishop score > 6 or active labour at 36 hours Show forest plot | 1 | 102 | Risk Ratio (M‐H, Fixed, 95% CI) | 3.8 [1.54, 9.40] |
| 29 Time to birth ‐ Time in hours from admission to birth (all women) Show forest plot | 3 | 374 | Mean Difference (IV, Random, 95% CI) | ‐4.70 [‐6.08, ‐3.31] |
| 30 Indicator of 'progress' in labour ‐ Bishop score on admission after treatment Show forest plot | 1 | 200 | Mean Difference (IV, Fixed, 95% CI) | 2.73 [2.17, 3.29] |
| 31 Indicator of 'progress' in labour ‐ Change in Bishop score Show forest plot | 2 | 272 | Mean Difference (IV, Fixed, 95% CI) | 2.76 [2.48, 3.03] |
| 32 Time to birth ‐ Interval from onset of labour to birth (hours) Show forest plot | 1 | 200 | Mean Difference (IV, Fixed, 95% CI) | ‐1.24 [‐1.82, ‐0.66] |
| 33 Indicator of 'progress' in labour ‐ Cervix unchanged after 48 hours Show forest plot | 1 | 257 | Risk Ratio (M‐H, Fixed, 95% CI) | 0.83 [0.70, 0.97] |
| 34 Time to birth ‐ Interval from admission to vaginal birth (hours) Show forest plot | 1 | 128 | Mean Difference (IV, Fixed, 95% CI) | ‐0.70 [‐6.11, 4.71] |
| 35 Total cost of care package (GBP) Show forest plot | 1 | 350 | Mean Difference (IV, Fixed, 95% CI) | 11.98 [‐105.34, 129.30] |
| Outcome or subgroup title | No. of studies | No. of participants | Statistical method | Effect size |
| 1 Additional induction agents required Show forest plot | 1 | 56 | Risk Ratio (M‐H, Fixed, 95% CI) | 0.6 [0.31, 1.17] |
| 2 Caesarean section Show forest plot | 1 | 56 | Risk Ratio (M‐H, Fixed, 95% CI) | 0.43 [0.17, 1.11] |
| Outcome or subgroup title | No. of studies | No. of participants | Statistical method | Effect size |
| 1 Maternal satisfaction ‐ I look back positively on the treatment I received Show forest plot | 1 | 404 | Risk Ratio (M‐H, Fixed, 95% CI) | 1.04 [0.97, 1.10] |
| 2 Maternal satisfaction ‐ In retrospect, I would have preferred another treatment than received Show forest plot | 1 | 472 | Risk Ratio (M‐H, Fixed, 95% CI) | 0.51 [0.36, 0.72] |
| 3 Augmentation, induction or both Show forest plot | 1 | 521 | Risk Ratio (M‐H, Fixed, 95% CI) | 0.83 [0.71, 0.97] |
| 4 Epidural, opioids or both for pain relief Show forest plot | 1 | 521 | Risk Ratio (M‐H, Fixed, 95% CI) | 0.99 [0.76, 1.30] |
| 5 Instrumental vaginal birth Show forest plot | 1 | 521 | Risk Ratio (M‐H, Fixed, 95% CI) | 0.70 [0.46, 1.08] |
| 6 Caesarean section Show forest plot | 1 | 521 | Risk Ratio (M‐H, Fixed, 95% CI) | 1.20 [0.78, 1.86] |
| 7 Apgar < 7 at 5 minutes Show forest plot | 1 | 521 | Risk Ratio (M‐H, Fixed, 95% CI) | 1.86 [0.34, 10.06] |
| 8 Neonatal intensive care unit admission Show forest plot | 1 | 521 | Risk Ratio (M‐H, Fixed, 95% CI) | 1.09 [0.64, 1.85] |
| 9 Duration of birth (hours) Show forest plot | 1 | 521 | Mean Difference (IV, Fixed, 95% CI) | 0.40 [‐0.72, 1.52] |