Cirugía refractiva con láser excimer versus lentes intraoculares fáquicos para la corrección de la miopía de moderada a alta
Referencias
Referencias de los estudios incluidos en esta revisión
Referencias de los estudios excluidos de esta revisión
Referencias adicionales
Referencias de otras versiones publicadas de esta revisión
Characteristics of studies
Characteristics of included studies [ordered by study ID]
Ir a:
| Methods | Single centre, single surgeon prospective randomised trial | |
| Participants | Setting: Magrabi Eye and Ear Centre, Abu Dhabi, United Arab Emirates Numbers randomised: 90 eyes of 61 consecutive patients Age: range 21 to 47 years (mean, 33.7+/‐ 7.1 years) Gender: 37 (60.7%) were female Inclusion criteria: Age of at least 21 years, documented stable refraction for 1 year, spherical equivalent refraction between 9.0 and 19.5 D of myopia, refractive astigmatism less than 3.0 D, spectacle‐corrected visual acuity of 20/40 or better, corneal thickness permitting the surgeon to leave at least 250 µm deep to the ablation, pupil size less than 6 mm in dim illumination for eyes with myopia of 15.50 D or less, and 5 mm for eyes with myopia greater than 15.50 D, and realistic expectations concerning the outcome Exclusion criteria: Previous refractive surgery, keratoconus or keratoconus suspected by videokeratography, active ocular disease, dry eyes, systemic disease likely to affect corneal wound healing (e.g. connective tissue disease) and inability to achieve the follow‐up schedule given to the patients before surgery | |
| Interventions | Emetropia was the refractive aim in all eyes Artisan phakic intraocular lens implantation: Lens power was calculated based on the refraction at the corneal plane according to a customised clinical nomogram based on the manufacturer's instructions and the authors previous experience with Artisan lens implantation LASIK: Nidek EC‐5000 excimer laser with mean ablation zone diameter 5.6 +/‐ 0.3 mm (range, 5.0 to 6.0 mm); and transition zone 1 mm. A personal customised clinical nomogram was used for all LASIK procedures. A Carriazo‐Barraquer microkeratome with a manually advanced turbine motor head was used to create a 160 µm flap for all LASIK procedures | |
| Outcomes | All patients were examined, at 1 day, 1 week, and 1, 3, 6 and 12 months postoperatively. Slit lamp microscopy, manifest refraction, uncorrected and spectacle corrected visual acuity were performed at all visits from one month onwards. Contrast sensitivity, videokeratography, and specular microscopy were done at the 1, 6 and 12 month examinations One year after surgery, a patient satisfaction questionnaire was given to the 18 patients (29.5%) who had Artisan lens in one eye and LASIK in the other eye | |
| Notes | LASIK enhancement procedures were performed in both groups 4 to 6 months after the primary procedure if there was a residual refractive error of more than 1.0 D at the 3 month examination. One Artisan eye (2.3%) and seven LASIK eyes (16.3%) had enhancement procedures | |
| Risk of bias | ||
| Bias | Authors' judgement | Support for judgement |
| Random sequence generation (selection bias) | Low risk | A random number table was used to generate the sequence |
| Allocation concealment (selection bias) | Unclear risk | Not specified |
| Blinding (performance bias and detection bias) | High risk | Not mentioned but presumably not done as both procedures are inherently different and participants would know which procedure they were undergoing |
| Blinding (performance bias and detection bias) | High risk | Not mentioned but presumably not done as both procedures are inherently different and assessors would know which procedure had been performed |
| Incomplete outcome data (attrition bias) | Low risk | Losses to follow‐up were reported although no explanation was given as to why participants were lost to follow‐up |
| Selective reporting (reporting bias) | Low risk | There was no evidence of selective outcome reporting |
| Other bias | Low risk | No other sources of bias were detected |
| Methods | Two surgeon, two centre prospective, single masked randomised trial with paired eye control | |
| Participants | Numbers randomised: 25 consecutive patients (50 eyes) Age: range 31 to 52 years (mean 38.4 +/‐ 7.6 years) Gender: 17 (68%) were female Inclusion criteria: Stable myopia for 2 years and unsatisfactory correction by glasses or contact lenses. They had bilateral myopia between ‐8.0 and ‐12.0 with an astigmatism < 1.5 D. The anterior chamber depth was ≥ 3.0 mm, the endothelial cell count was ≥ 2000 cells/mm2, the corneal thickness was ≥ 530 µm and the mean keratometry was 42.0 to 45.0 D Exclusion criteria: Patients under the age of 30 years, corneal disease including keratoconus suspect with videokeratography, glaucoma, uveitis or a history of retinal detachment | |
| Interventions | Emmetropia was the target refraction in all eyes LASIK procedure: Keracor Technolas 217 C (Bausch & Lomb Surgical, Claremont, CA) was used. The software used was version 2.67, subgroup 036, with an ablation zone diameter of 5 mm and a peripheral treatment zone from 6 to 8.5 mm. The Hansotome (Bausch & Lomb Surgical, Claremont, CA) microkeratome was used to create a 160 µm flap Artisan procedure: The Artisan phakic intraocular lens, a convex‐concave, iris claw‐fixated lens with a 6 mm optical zone diameter (Artisan lens; Ophtec B.V., Groningen, Netherlands) was used. Patient refractive error, anterior chamber depth and keratometric values (Van der Heijde formula) were used to calculate the dioptric power of the lens | |
| Outcomes | The primary outcome measure was the postoperative spherical equivalent refraction at 1 year. The secondary outcome measure was safety measured by the percentage of eyes losing 2 or more Snellen lines of spectacle corrected visual acuity and the safety index Patients were examined postoperatively at 1 day, 1, 3 , 6 and 12 months after surgery. After day 1 postoperative all examinations included uncorrected and spectacle‐corrected visual acuity, refraction, slit‐lamp microscopy, applanation tonometry and corneal topography. At 3 months and 1 year postoperative an endothelial evaluation using a specular microscope was performed as well as contrast sensitivity. At 1 year postoperative a subjective evaluation and quality of vision score was calculated | |
| Notes | The evaluators did not participate in the surgical process. Both evaluators worked independently from any objective testing, such as slit‐lamp examination and corneal topography, which could have unmasked the surgical procedure. For this purpose independent evaluators performed objective tests | |
| Risk of bias | ||
| Bias | Authors' judgement | Support for judgement |
| Random sequence generation (selection bias) | Low risk | A random number table was used to generate the sequence |
| Allocation concealment (selection bias) | Unclear risk | Not specified |
| Blinding (performance bias and detection bias) | High risk | Not mentioned but presumably not done as both procedures are inherently different and participants would know which procedure they were undergoing on each eye |
| Blinding (performance bias and detection bias) | Low risk | The evaluators did not participate in the surgical process. Both evaluators worked independently from any objective testing, such as slit‐lamp examination and corneal topography, which could have unmasked the surgical procedure |
| Incomplete outcome data (attrition bias) | Low risk | Losses to follow‐up were reported although no explanation was given as to why participants were lost to follow‐up |
| Selective reporting (reporting bias) | Low risk | There was no evidence of selective outcome reporting |
| Other bias | Low risk | No other sources of bias were detected |
| Methods | Single centre, uncertain number of surgeons, prospective randomised trial | |
| Participants | Number randomised: 88 eyes of 46 patients Age: PRK group 32.6 +/‐ 7 years, Toric Implantable Collamer Lens (TICL) group 30.8 +/‐ 6 years Gender: PRK group 37% female, TICL group 44% female Inclusion criteria: Phakic patients with moderate to high myopia (‐6.0 to ‐20.0 D sphere) measured at the spectacle plane and astigmatism in the range of 1.0 to 4.0 D cylinder with a best spectacle‐corrected visual acuity of 20/40 or better in the eye to be treated. Patients had to be between the ages of 21 and 45 years and have a stable refraction for the last 12 months as documented by previous clinical records Exclusion criteria: Patients with a history of previous intraocular surgery, diabetes, glaucoma, ocular hypertension, amblyopia and any other serious ophthalmic or non‐ophthalmic conditions that may have precluded study completion | |
| Interventions | PRK: This was performed using a conventional PRK technique partnered with the use of mitomycin C (MMC). The VISX Star S3 (VISX Inc, Santa Clara, Calif) excimer laser was used with specifications of a 6.5 mm optical zone (major axis) with an 8.0 mm treatment zone TICL: The Visian TICL (STAAR Surgical) was implanted in all 43 eyes in the series. The TICL is designed to be placed behind the iris and to vault anteriorly to the crystalline lens. All TICL patients received iridotomies using an Nd:YAG laser 2 weeks prior to surgery. The TICL was inserted through a horizontal temporal 3 mm corneal incision then injected into the eye and dialled into position | |
| Outcomes | Visual measurements were collected to include uncorrected and best spectacle corrected vision and contrast sensitivity. Study follow up was 1 day, 1 week, and 1, 3, 6 and 12 months postoperatively. Additionally a psychometric subjective quality of vision and satisfaction after surgery questionnaire was given at the preoperative, 3 to 6 month and 12 month time points | |
| Notes | ||
| Risk of bias | ||
| Bias | Authors' judgement | Support for judgement |
| Random sequence generation (selection bias) | Unclear risk | Not specified |
| Allocation concealment (selection bias) | Unclear risk | Not specified |
| Blinding (performance bias and detection bias) | High risk | Not mentioned but presumably not done as both procedures are inherently different and participants would know which procedure they were undergoing |
| Blinding (performance bias and detection bias) | High risk | Not mentioned but presumably not done as both procedures are inherently different and assessors would know which procedure had been performed |
| Incomplete outcome data (attrition bias) | Low risk | Losses to follow‐up were reported although no explanation was given as to why participants were lost to follow‐up |
| Selective reporting (reporting bias) | Unclear risk | There was no clear evidence of selective outcome reporting, however it should be noted that the one patient in the phakic IOL group who developed a cataract attended his one month postoperative visit and was then lost to follow up until 2 years after the surgery |
| Other bias | Low risk | No other sources of bias were detected |
D: diopter
LASIK: laser assisted stromal in‐situ keratomileusis
IOL: intraocular lens
PRK: photorefractive keratectomy
Characteristics of excluded studies [ordered by study ID]
Ir a:
| Study | Reason for exclusion |
| Randomised controlled trial but several limitations including source of bias and out of date technology used | |
| The two groups were not randomised to treatment | |
| No randomisation to treatments | |
| No randomisation to treatments | |
| Minimum follow up less than one year |
Data and analyses
| Outcome or subgroup title | No. of studies | No. of participants | Statistical method | Effect size |
| 1 Uncorrected visual acuity of 20/20 or better at 12 months post‐treatment Show forest plot | 2 | 166 | Odds Ratio (Fixed, 95% CI) | 1.33 [0.08, 22.55] |
| Analysis 1.1  Comparison 1 Excimer laser versus phakic IOL, Outcome 1 Uncorrected visual acuity of 20/20 or better at 12 months post‐treatment. | ||||
| 2 UCVA of 20/20 or better at 6 months post‐treatment Show forest plot | 2 | 157 | Odds Ratio (Fixed, 95% CI) | 0.99 [0.25, 3.91] |
| Analysis 1.2  Comparison 1 Excimer laser versus phakic IOL, Outcome 2 UCVA of 20/20 or better at 6 months post‐treatment. | ||||
| 3 UCVA of 20/40 or better at 6 months post‐treatment Show forest plot | 2 | 125 | Odds Ratio (Fixed, 95% CI) | 0.71 [0.36, 1.39] |
| Analysis 1.3  Comparison 1 Excimer laser versus phakic IOL, Outcome 3 UCVA of 20/40 or better at 6 months post‐treatment. | ||||
| 4 UCVA of 20/40 or better at 12 months post‐treatment Show forest plot | 2 | 134 | Odds Ratio (Fixed, 95% CI) | 0.66 [0.36, 1.22] |
| Analysis 1.4  Comparison 1 Excimer laser versus phakic IOL, Outcome 4 UCVA of 20/40 or better at 12 months post‐treatment. | ||||
| 5 Percentage of eyes within ±0.50 D of target refraction at six months post‐treatment Show forest plot | 1 | Odds Ratio (Fixed, 95% CI) | Subtotals only | |
| Analysis 1.5  Comparison 1 Excimer laser versus phakic IOL, Outcome 5 Percentage of eyes within ±0.50 D of target refraction at six months post‐treatment. | ||||
| 6 Percentage of eyes within ±0.50 D of target refraction at 12 months post‐treatment Show forest plot | 3 | 216 | Odds Ratio (Fixed, 95% CI) | 0.72 [0.40, 1.29] |
| Analysis 1.6  Comparison 1 Excimer laser versus phakic IOL, Outcome 6 Percentage of eyes within ±0.50 D of target refraction at 12 months post‐treatment. | ||||
| 7 Percentage of eyes within ±1.00 D of target refraction at six months post‐treatment Show forest plot | 1 | Odds Ratio (Fixed, 95% CI) | Subtotals only | |
| Analysis 1.7  Comparison 1 Excimer laser versus phakic IOL, Outcome 7 Percentage of eyes within ±1.00 D of target refraction at six months post‐treatment. | ||||
| 8 Percentage of eyes within ±1.00 D of target refraction at 12 months post‐treatment Show forest plot | 3 | 216 | Odds Ratio (Fixed, 95% CI) | 1.01 [0.42, 2.45] |
| Analysis 1.8 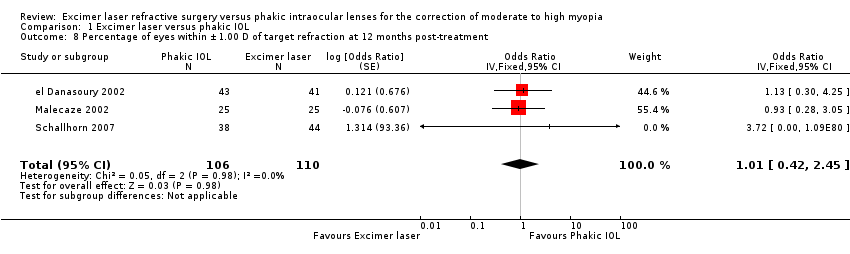 Comparison 1 Excimer laser versus phakic IOL, Outcome 8 Percentage of eyes within ±1.00 D of target refraction at 12 months post‐treatment. | ||||
| 9 Percentage of eyes that lost 2 or more lines of BSCVA at 12 months post‐treatment Show forest plot | 3 | 216 | Odds Ratio (Fixed, 95% CI) | 0.35 [0.19, 0.66] |
| Analysis 1.9 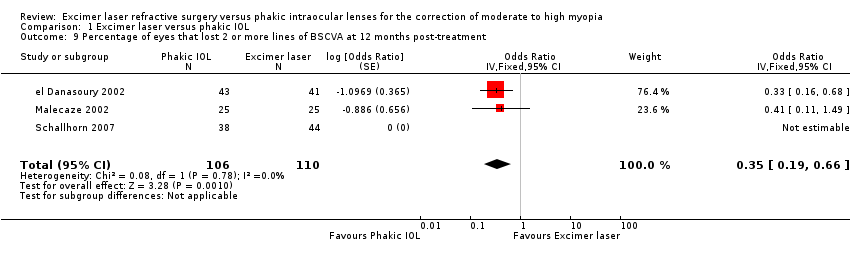 Comparison 1 Excimer laser versus phakic IOL, Outcome 9 Percentage of eyes that lost 2 or more lines of BSCVA at 12 months post‐treatment. | ||||
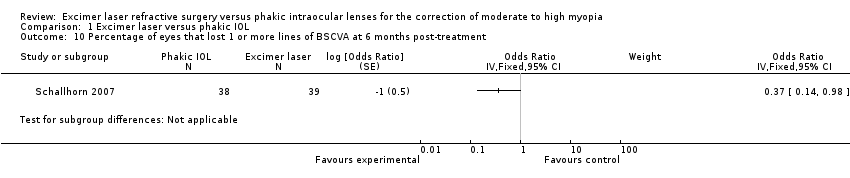
| 10 Percentage of eyes that lost 1 or more lines of BSCVA at 6 months post‐treatment Show forest plot | 1 | Odds Ratio (Fixed, 95% CI) | Subtotals only | |
| Analysis 1.10  Comparison 1 Excimer laser versus phakic IOL, Outcome 10 Percentage of eyes that lost 1 or more lines of BSCVA at 6 months post‐treatment. | ||||
| 11 Percentage of eyes that lost 1 or more lines of BSCVA at 12 months post‐treatment Show forest plot | 3 | 216 | Odds Ratio (Fixed, 95% CI) | 0.41 [0.33, 0.51] |
| Analysis 1.11 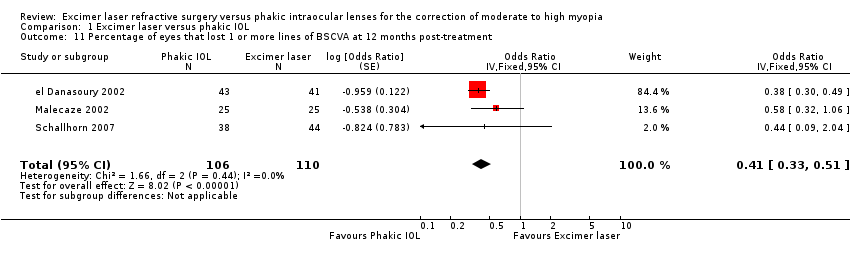 Comparison 1 Excimer laser versus phakic IOL, Outcome 11 Percentage of eyes that lost 1 or more lines of BSCVA at 12 months post‐treatment. | ||||
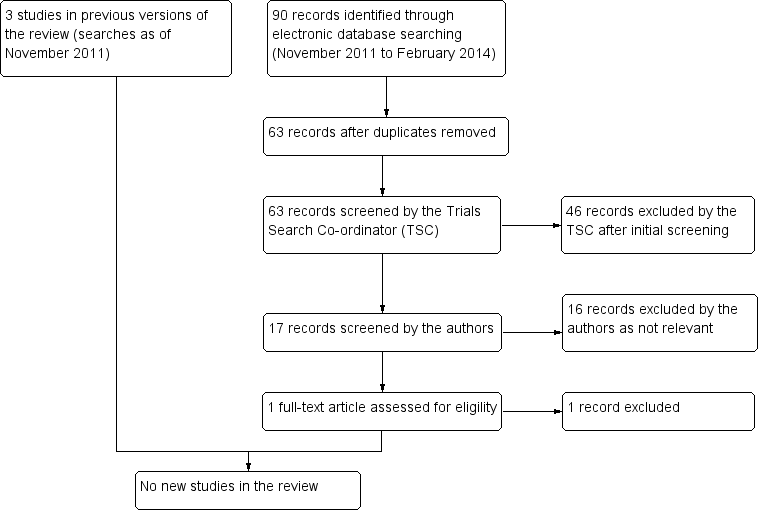
Results from searching for studies for inclusion in the review.

Risk of bias graph: review authors' judgements about each risk of bias item presented as percentages across all included studies.

Risk of bias summary: review authors' judgements about each risk of bias item for each included study.
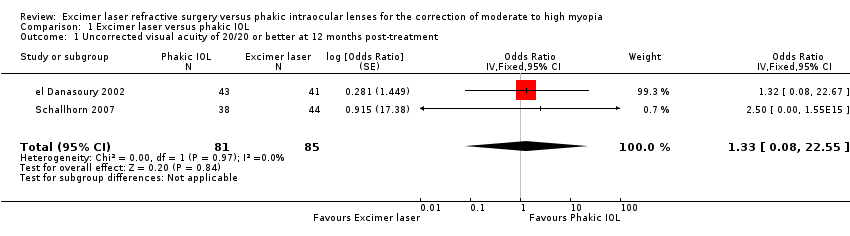
Comparison 1 Excimer laser versus phakic IOL, Outcome 1 Uncorrected visual acuity of 20/20 or better at 12 months post‐treatment.

Comparison 1 Excimer laser versus phakic IOL, Outcome 2 UCVA of 20/20 or better at 6 months post‐treatment.

Comparison 1 Excimer laser versus phakic IOL, Outcome 3 UCVA of 20/40 or better at 6 months post‐treatment.
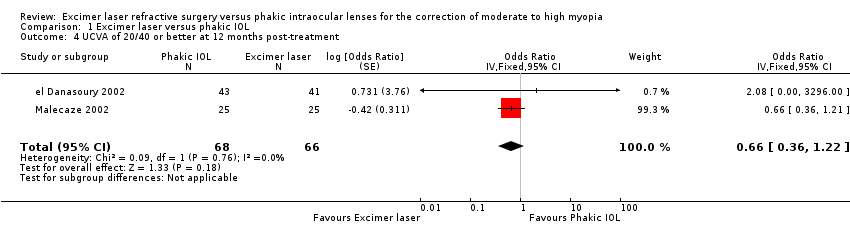
Comparison 1 Excimer laser versus phakic IOL, Outcome 4 UCVA of 20/40 or better at 12 months post‐treatment.

Comparison 1 Excimer laser versus phakic IOL, Outcome 5 Percentage of eyes within ±0.50 D of target refraction at six months post‐treatment.

Comparison 1 Excimer laser versus phakic IOL, Outcome 6 Percentage of eyes within ±0.50 D of target refraction at 12 months post‐treatment.

Comparison 1 Excimer laser versus phakic IOL, Outcome 7 Percentage of eyes within ±1.00 D of target refraction at six months post‐treatment.

Comparison 1 Excimer laser versus phakic IOL, Outcome 8 Percentage of eyes within ±1.00 D of target refraction at 12 months post‐treatment.

Comparison 1 Excimer laser versus phakic IOL, Outcome 9 Percentage of eyes that lost 2 or more lines of BSCVA at 12 months post‐treatment.
Comparison 1 Excimer laser versus phakic IOL, Outcome 10 Percentage of eyes that lost 1 or more lines of BSCVA at 6 months post‐treatment.

Comparison 1 Excimer laser versus phakic IOL, Outcome 11 Percentage of eyes that lost 1 or more lines of BSCVA at 12 months post‐treatment.
| Study | Complication rate | Flap/interface complication | Management | Outcome |
| el Danasoury 2002 | 1 interface complication in 45 LASIK treatments. No other flap/decentered ablation complications | Diffuse lamellar keratitis 3 days after uneventful LASIK | Topical steroid therapy | Inflammation completely resolved within one week |
| Malecaze 2002 | 0 flap/interface/decentered ablation complications in 25 LASIK treatments | N/A | N/A | N/A |
| Schallhorn 2007 | Flap/interface complications N/A as all treatments PRK. No decentered ablations or haze reported in 45 laser treatments | N/A | N/A | N/A |
| LASIK: laser assisted stromal in‐situ keratomileusis | ||||
| Study | Follow‐up | Findings |
| el Danasoury 2002 | One year | The mean endothelial cell loss 0.7% ± 1.1% (range ‐3.1% to 1.7 %) at 1 year in the Artisan group and mean 0.3% ± 0.9% (range ‐1.9% to 1.8%) at 1 year in the LASIK group. There was no statistically significant difference between endothelial cell loss in the 2 groups |
| Malecaze 2002 | One year | The differences between mean endothelial cell loss in LASIK treated eyes and Artisan‐treated eyes was not statistically different at either 3 months (P = 0.73) or 1 year (P = 0.60) postoperatively |
| Schallhorn 2007 | Endothelial cell loss was not reported. | N/A |
| LASIK: laser assisted stromal in‐situ keratomileusis | ||
| Study | IOL exchange rate | Indication for IOL exchange | Management | Outcome |
| el Danasoury 2002 | 1 eye (2.2%) | Severe night glare in a patient with a preoperative pupil at dim illumination of 5mm who received a 5 mm Artisan lens | Lens was removed and exchanged for a 6 mm Artisan lens | Night glare completely resolved. UCVA was 20/40 correcting to 20/20 |
| Malecaze 2002 | 0 cases reported of IOL exchange | N/A | N/A | N/A |
| Schallhorn 2007 | 1 eye (2.3%) | Anterior subcapsular cataract resulting in BCVA 20/50‐1 | Phakic IOL and cataract were removed and replaced with pseudophakic IOL | BSCVA of 20/20 |
| BCVA: best corrected visual acuity | ||||
| Study | Method | Findings |
| el Danasoury 2002 | Measured using the Vision Contrast Test System (VCTS‐6000, Vistech consultants, Inc. Dayton, OH) performed under normal room lighting | One year after surgery the contrast sensitivity curve of each eye was compared to its baseline curve. Two Artisan eyes (4.7%) and six LASIK eyes (14.6%) lost 2 or more lines, three Artisan eyes (7.0%) and nine LASIK eyes (22.0%) lost 1 line, four Artisan eyes (9.3%) and no LASIK eyes gained 2 or more lines, and seven Artisan eyes (16.3%) and five LASIK eyes (12.2%) gained 1 line. The contrast sensitivity did not change in 27 Artisan eyes (62.8%) and 21 LASIK eyes (51.2%). There was no comment on whether this difference was statistically significant or not |
| Malecaze 2002 | Not described | Pre‐operative contrast sensitivity measurements to one year postoperative measurements were slightly reduced in the LASIK group and slightly improved in the phakic IOL group. However this difference was not statistically significant at all 4 spatial frequencies (P = 0.66, 0.70, 0.06 and 0.29 for 3, 6, 12 and 18 cycles per degree cyc/deg respectively) |
| Schallhorn 2007 | Photopic contrast sensitivity was conducted with a back‐illuminated chart (5% ETDRS Chart, 9x14, Model 2186; Precision Vision, LaSalle, ILL) with room lights off. Mesopic testing was conducted with a 25% ETDRS chart (Precision Vision) behind two neutral density filters and room lights off | 5% photopic level: The mean BSCVA (logMAR) was significantly better in the phakic IOL group than the PRK laser group at all time points postoperatively (P = 0.002 at one week and P = <0.001 at all other time points). Loss of 2 or more lines of BSCVA was significantly higher in the PRK group at all time points except six months. Improvement in BSCVA by 2 or more lines and 1 or more lines was significantly better in the phakic IOL group from 1 to 12 months postoperatively 25% mesopic level: The mean BSCVA (logMAR) was significantly better in the phakic IOL group than the PRK laser group at all time points postoperatively (P = 0.048 at one week and P = <0.001 at all other time points). Improvement in BSCVA (2 or more lines) was significantly better in the phakic IOL group at all time points from 1 to 12 months. Losses of 1 or more lines of BSCVA was significantly higher in the PRK group at all time points after one week. Improvement of one or more lines of BSCVA was better in the phakic IOL series at 1, 3 and 12 months |
| BSCVA: best spectacle corrected visual acuity | ||
| Study | Methods | FIndings |
| el Danasoury 2002 | Patient satisfaction and preference questionnaire at 12 months postoperatively. This was only given to the 18 patients that had Artisan in one eye and LASIK in the other eye | There was no significant difference in the satisfaction levels between the two groups. 11 patients (61.1%) experienced more night glare or halos with their LASIK eye, 3 patients (16.7%) had more night glare with their Artisan eye, 1 patient (5.6%) reported equal glare in both eyes and 3 patients (16.7%) said that they had no glare with either eye (P = 0.001) Patient preference for Artisan was significantly higher (P = 0.0001) mainly because of better reported quality of vision |
| Malecaze 2002 | Patient satisfaction questionnaire at 12 months postoperatively | There was a slightly significantly increased frequency of halos following LASIK (P = 0.05) and non‐significantly increased frequency of halos following Artisan (P = 0.19). Both groups showed a significantly increased frequency of glare (P = 0.02 for LASIK and P = 0.01 for Artisan) but there was no statistically significant difference between the two groups (P = 0.30 for halos and P = 0.20 for glare). The satisfaction levels were not statistically different (P = 0.40) between the two groups. Concerning preference for one of the two techniques: 16% of patients preferred LASIK, 44% preferred Artisan and 40% had no preference |
| Schallhorn 2007 | Psychometric questionnaire was given preoperatively and 3, 6 and 12 months postoperatively. The questionnaire assessed subjective quality of vision (glare, halos, night vision, need for artificial tears) and satisfaction after the surgery | The PRK group showed significantly more need for artificial tears (P = 0.002) and more visual fluctuation (0.001) at the 3 and 6 month postoperative time periods. The PRK group had more glare symptoms at night (P = 0.033) and more trouble with oncoming car headlights at night (P = 0.014). All other questions at 3 and 6 months showed no difference between the two groups. The 12‐month questionnaire showed similar subjective visual results between the two groups with the exception of greater use of artificial tears in the PRK group (P = 0.008) and greater glare when watching television or computer monitors (P = 0.043) |
| LASIK: laser assisted stromal in‐situ keratomileusis | ||
| Outcome or subgroup title | No. of studies | No. of participants | Statistical method | Effect size |
| 1 Uncorrected visual acuity of 20/20 or better at 12 months post‐treatment Show forest plot | 2 | 166 | Odds Ratio (Fixed, 95% CI) | 1.33 [0.08, 22.55] |
| 2 UCVA of 20/20 or better at 6 months post‐treatment Show forest plot | 2 | 157 | Odds Ratio (Fixed, 95% CI) | 0.99 [0.25, 3.91] |
| 3 UCVA of 20/40 or better at 6 months post‐treatment Show forest plot | 2 | 125 | Odds Ratio (Fixed, 95% CI) | 0.71 [0.36, 1.39] |
| 4 UCVA of 20/40 or better at 12 months post‐treatment Show forest plot | 2 | 134 | Odds Ratio (Fixed, 95% CI) | 0.66 [0.36, 1.22] |
| 5 Percentage of eyes within ±0.50 D of target refraction at six months post‐treatment Show forest plot | 1 | Odds Ratio (Fixed, 95% CI) | Subtotals only | |
| 6 Percentage of eyes within ±0.50 D of target refraction at 12 months post‐treatment Show forest plot | 3 | 216 | Odds Ratio (Fixed, 95% CI) | 0.72 [0.40, 1.29] |
| 7 Percentage of eyes within ±1.00 D of target refraction at six months post‐treatment Show forest plot | 1 | Odds Ratio (Fixed, 95% CI) | Subtotals only | |
| 8 Percentage of eyes within ±1.00 D of target refraction at 12 months post‐treatment Show forest plot | 3 | 216 | Odds Ratio (Fixed, 95% CI) | 1.01 [0.42, 2.45] |
| 9 Percentage of eyes that lost 2 or more lines of BSCVA at 12 months post‐treatment Show forest plot | 3 | 216 | Odds Ratio (Fixed, 95% CI) | 0.35 [0.19, 0.66] |
| 10 Percentage of eyes that lost 1 or more lines of BSCVA at 6 months post‐treatment Show forest plot | 1 | Odds Ratio (Fixed, 95% CI) | Subtotals only | |
| 11 Percentage of eyes that lost 1 or more lines of BSCVA at 12 months post‐treatment Show forest plot | 3 | 216 | Odds Ratio (Fixed, 95% CI) | 0.41 [0.33, 0.51] |