| 1 Any adverse event certolizumab 200 mg Show forest plot | 9 | 3927 | Risk Ratio (M‐H, Random, 95% CI) | 1.16 [1.03, 1.31] |
|
| 2 Any adverse events certolizumab 400 mg Show forest plot | 6 | 1624 | Risk Ratio (M‐H, Random, 95% CI) | 1.19 [1.05, 1.34] |
|
| 3 Adverse events: Intensity mild certolizumab 200 mg Show forest plot | 4 | 2249 | Risk Ratio (M‐H, Random, 95% CI) | 1.18 [1.00, 1.41] |
|
| 4 Adverse events: Intensity mild certolizumab 400 mg Show forest plot | 5 | 1462 | Risk Ratio (M‐H, Random, 95% CI) | 1.25 [1.06, 1.47] |
|
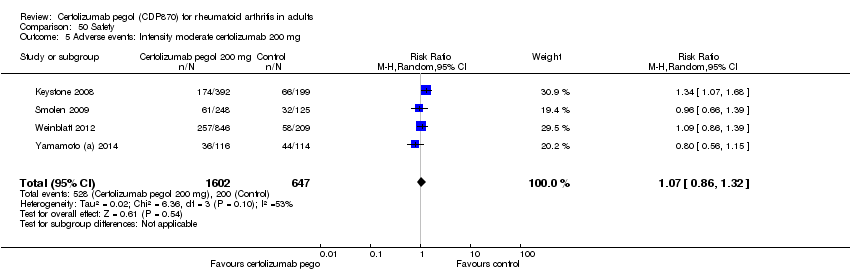
| 5 Adverse events: Intensity moderate certolizumab 200 mg Show forest plot | 4 | 2249 | Risk Ratio (M‐H, Random, 95% CI) | 1.07 [0.86, 1.32] |
|
| 6 Adverse events: Intensity moderate certolizumab 400 mg Show forest plot | 5 | 1462 | Risk Ratio (M‐H, Random, 95% CI) | 1.21 [0.99, 1.47] |
|
| 7 Adverse events: Intensity severe certolizumab 200 mg Show forest plot | 4 | 2249 | Peto Odds Ratio (Peto, Fixed, 95% CI) | 1.14 [0.78, 1.65] |
|
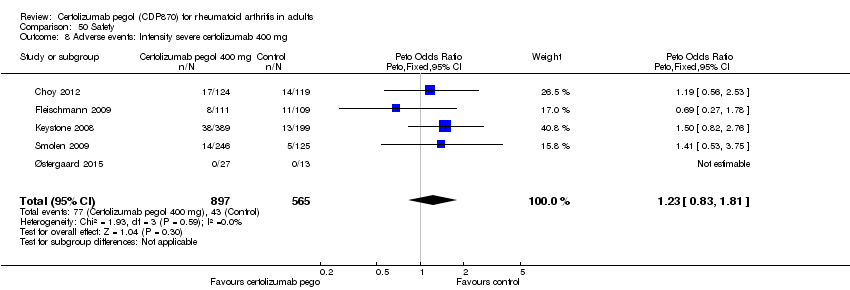
| 8 Adverse events: Intensity severe certolizumab 400 mg Show forest plot | 5 | 1462 | Peto Odds Ratio (Peto, Fixed, 95% CI) | 1.23 [0.83, 1.81] |
|
| 9 Adverse events related to study drug certolizumab 200 mg Show forest plot | 2 | 964 | Risk Ratio (M‐H, Random, 95% CI) | 1.59 [1.27, 1.99] |
|
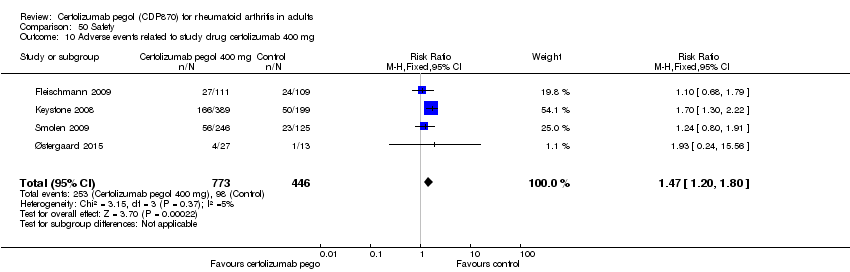
| 10 Adverse events related to study drug certolizumab 400 mg Show forest plot | 4 | 1219 | Risk Ratio (M‐H, Fixed, 95% CI) | 1.47 [1.20, 1.80] |
|
| 11 Serious Infections certolizumab 200 mg Show forest plot | 3 | 1283 | Peto Odds Ratio (Peto, Fixed, 95% CI) | 1.94 [0.99, 3.80] |
|
| 12 Serious infections certolizumab 400 mg Show forest plot | 4 | 1422 | Peto Odds Ratio (Peto, Fixed, 95% CI) | 3.25 [1.65, 6.39] |
|
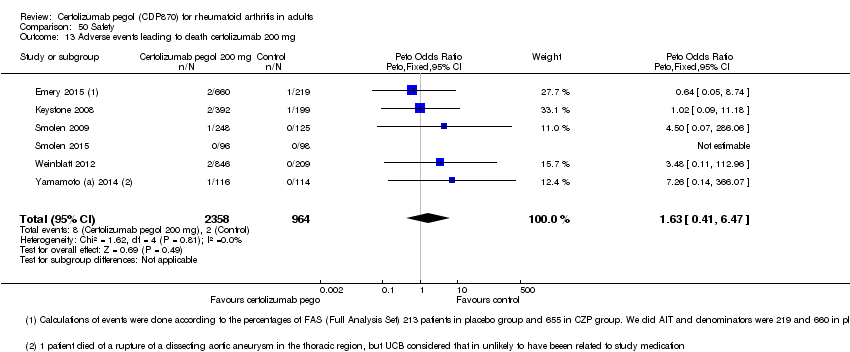
| 13 Adverse events leading to death certolizumab 200 mg Show forest plot | 6 | 3322 | Peto Odds Ratio (Peto, Fixed, 95% CI) | 1.63 [0.41, 6.47] |
|
| 14 Adverse events leading to death certolizumab 400 mg Show forest plot | 3 | 1179 | Peto Odds Ratio (Peto, Fixed, 95% CI) | 2.16 [0.40, 11.79] |
|
| 15 Adverse events leading to withdrawal certolizumab 200 mg Show forest plot | 8 | 3608 | Peto Odds Ratio (Peto, Fixed, 95% CI) | 1.32 [0.95, 1.84] |
|
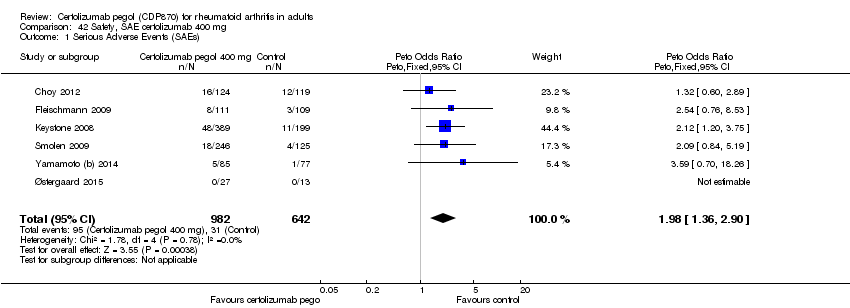
| 16 Adverse events leading to withdrawal certolizumab 400 mg Show forest plot | 6 | 1624 | Peto Odds Ratio (Peto, Fixed, 95% CI) | 2.01 [1.20, 3.36] |
|
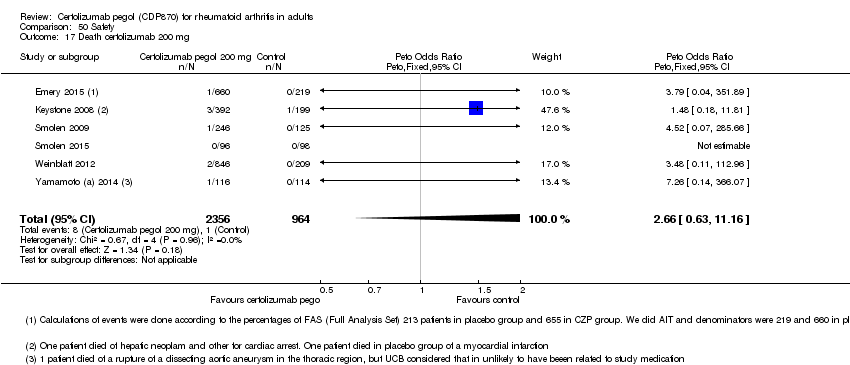
| 17 Death certolizumab 200 mg Show forest plot | 6 | 3320 | Peto Odds Ratio (Peto, Fixed, 95% CI) | 2.66 [0.63, 11.16] |
|
| 18 Death certolizumab 400 mg Show forest plot | 5 | 1462 | Risk Ratio (M‐H, Fixed, 95% CI) | 1.87 [0.31, 11.34] |
|
| 19 Deaths overall Show forest plot | 10 | 4745 | Peto Odds Ratio (Peto, Fixed, 95% CI) | 2.63 [0.78, 8.91] |
|
| 19.1 Certolizumab pegol 200 mg | 7 | 3266 | Peto Odds Ratio (Peto, Fixed, 95% CI) | 2.10 [0.44, 10.08] |
| 19.2 Certolizumab pegol 400 mg | 5 | 1349 | Peto Odds Ratio (Peto, Fixed, 95% CI) | 3.53 [0.40, 31.39] |
| 19.3 Other doses | 2 | 130 | Peto Odds Ratio (Peto, Fixed, 95% CI) | 4.48 [0.07, 286.49] |
| 20 Tuberculosis certolizumab 200 mg Show forest plot | 7 | 3538 | Peto Odds Ratio (Peto, Fixed, 95% CI) | 1.90 [0.55, 6.58] |
|
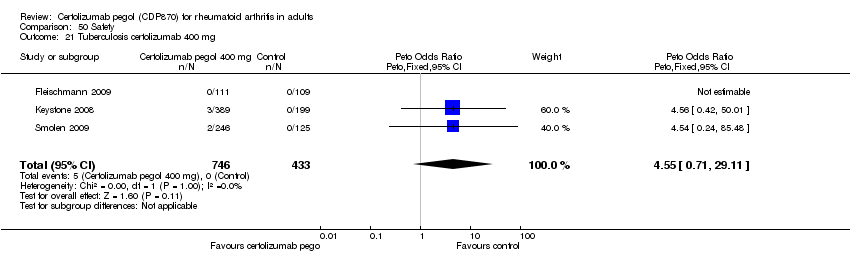
| 21 Tuberculosis certolizumab 400 mg Show forest plot | 3 | 1179 | Peto Odds Ratio (Peto, Fixed, 95% CI) | 4.55 [0.71, 29.11] |
|
| 22 Tuberculosis overall Show forest plot | 7 | 4074 | Peto Odds Ratio (Peto, Fixed, 95% CI) | 1.91 [0.61, 5.96] |
|
| 22.1 Certolizumab pegol 200 mg | 6 | 3058 | Peto Odds Ratio (Peto, Fixed, 95% CI) | 1.53 [0.40, 5.77] |
| 22.2 Certolizumab pegol 400 mg | 3 | 1016 | Peto Odds Ratio (Peto, Fixed, 95% CI) | 3.52 [0.40, 31.33] |
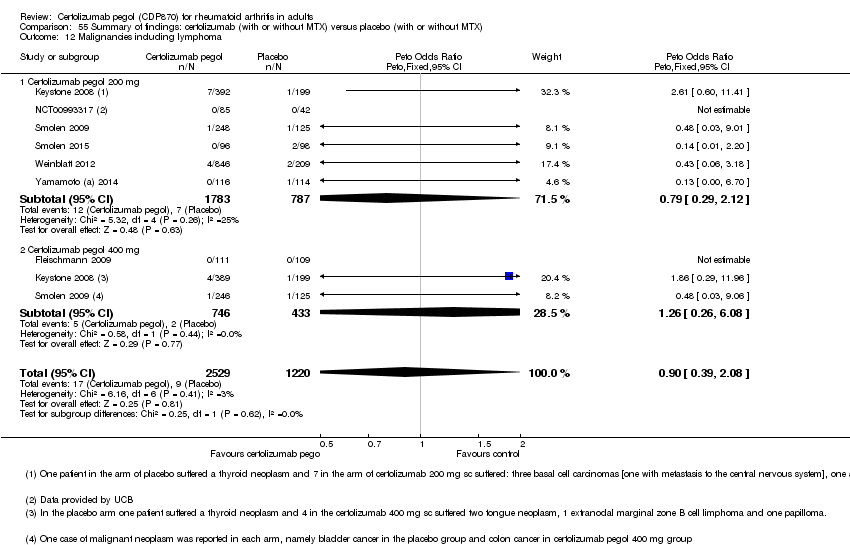
| 23 Malignancies included lymphoma certolizumab 200 mg Show forest plot | 8 | 3768 | Peto Odds Ratio (Peto, Fixed, 95% CI) | 0.92 [0.40, 2.11] |
|
| 24 Malignancies included lymphoma certolizumab 400 mg Show forest plot | 3 | 1179 | Peto Odds Ratio (Peto, Fixed, 95% CI) | 1.26 [0.26, 6.08] |
|
| 25 Injection side reactions certolizumab 200 mg Show forest plot | 5 | 2497 | Peto Odds Ratio (Peto, Fixed, 95% CI) | 3.34 [1.85, 6.06] |
|
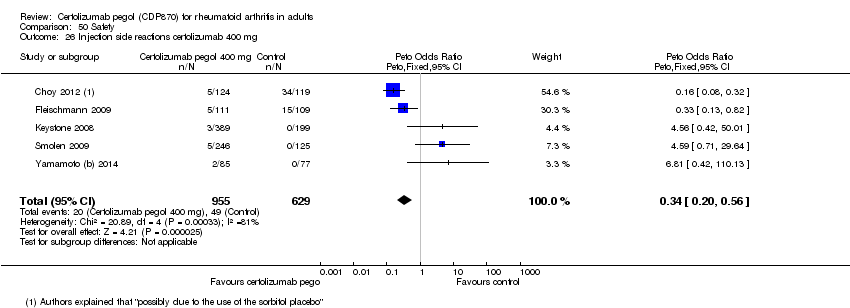
| 26 Injection side reactions certolizumab 400 mg Show forest plot | 5 | 1584 | Peto Odds Ratio (Peto, Fixed, 95% CI) | 0.34 [0.20, 0.56] |
|
| 27 Antinuclear antibodies (ANA) Anti‐certolizumab pegol antibodies certolizumab 200 mg Show forest plot | 1 | | Peto Odds Ratio (Peto, Fixed, 95% CI) | Totals not selected |
|
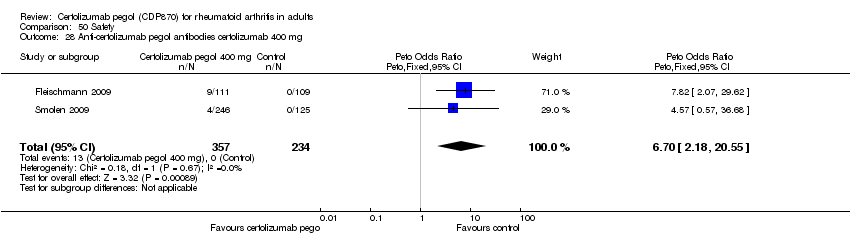
| 28 Anti‐certolizumab pegol antibodies certolizumab 400 mg Show forest plot | 2 | 591 | Peto Odds Ratio (Peto, Fixed, 95% CI) | 6.70 [2.18, 20.55] |
|
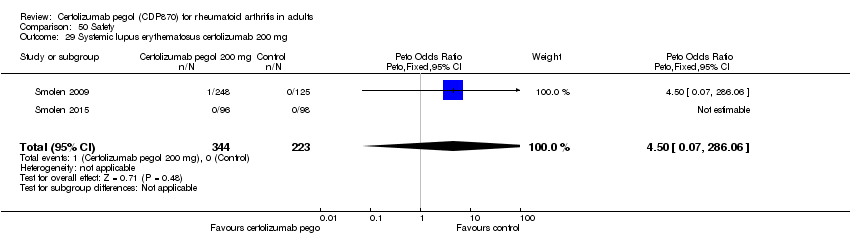
| 29 Systemic lupus erythematosus certolizumab 200 mg Show forest plot | 2 | 567 | Peto Odds Ratio (Peto, Fixed, 95% CI) | 4.50 [0.07, 286.06] |
|
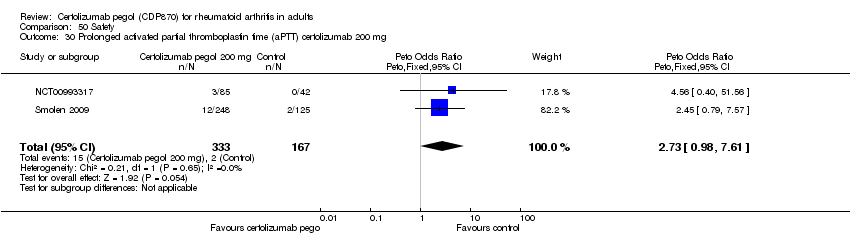
| 30 Prolonged activated partial thromboplastin time (aPTT) certolizumab 200 mg Show forest plot | 2 | 500 | Peto Odds Ratio (Peto, Fixed, 95% CI) | 2.73 [0.98, 7.61] |
|
| 31 Prolonged activated partial thromboplastin time (aPTT) certolizumab 400 mg Show forest plot | 1 | | Peto Odds Ratio (Peto, Fixed, 95% CI) | Totals not selected |
|
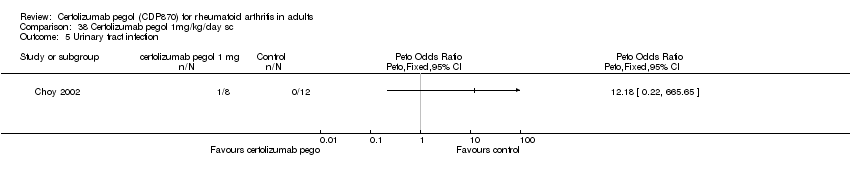
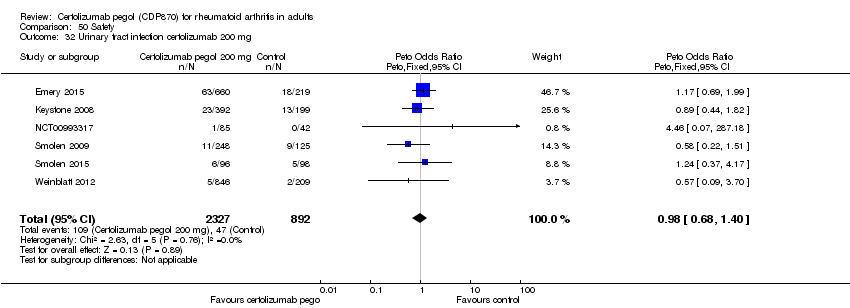
| 32 Urinary tract infection certolizumab 200 mg Show forest plot | 6 | 3219 | Peto Odds Ratio (Peto, Fixed, 95% CI) | 0.98 [0.68, 1.40] |
|
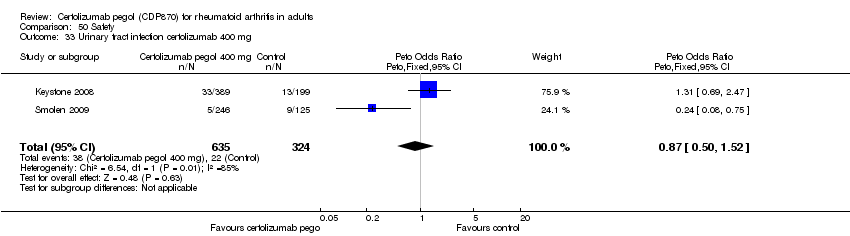
| 33 Urinary tract infection certolizumab 400 mg Show forest plot | 2 | 959 | Peto Odds Ratio (Peto, Fixed, 95% CI) | 0.87 [0.50, 1.52] |
|
| 34 Upper respiratory tract infection certolizumab 200 mg Show forest plot | 8 | 3608 | Peto Odds Ratio (Peto, Fixed, 95% CI) | 1.68 [1.28, 2.20] |
|
| 35 Upper respiratory tract infection certolizumab 400 mg Show forest plot | 4 | 1364 | Peto Odds Ratio (Peto, Fixed, 95% CI) | 1.42 [0.77, 2.61] |
|
| 36 Lower respiratory tract infection/ lung infection certolizumab 200 mg Show forest plot | 6 | 2356 | Peto Odds Ratio (Peto, Fixed, 95% CI) | 2.12 [0.76, 5.95] |
|
| 37 Lower respiratory tract infection/ lung infection certolizumab 400 mg Show forest plot | 3 | 993 | Peto Odds Ratio (Peto, Fixed, 95% CI) | 2.11 [0.75, 5.95] |
|
| 38 Pneumonia certolizumab 200 mg Show forest plot | 6 | 2804 | Peto Odds Ratio (Peto, Fixed, 95% CI) | 0.94 [0.45, 1.97] |
|
| 39 Pneumonitis certolizumab 400 mg Show forest plot | 1 | | Peto Odds Ratio (Peto, Fixed, 95% CI) | Totals not selected |
|
| 40 Headache certolizumab 200 mg Show forest plot | 6 | 3251 | Peto Odds Ratio (Peto, Fixed, 95% CI) | 1.33 [0.94, 1.87] |
|
| 41 Headache certolizumab 400 mg Show forest plot | 4 | 1364 | Peto Odds Ratio (Peto, Fixed, 95% CI) | 1.30 [0.76, 2.20] |
|
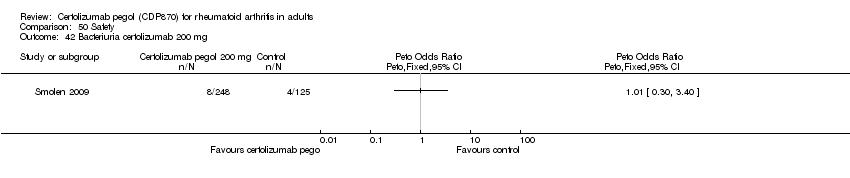
| 42 Bacteriuria certolizumab 200 mg Show forest plot | 1 | | Peto Odds Ratio (Peto, Fixed, 95% CI) | Totals not selected |
|
| 43 Bacteriuria certolizumab 400 mg Show forest plot | 1 | | Peto Odds Ratio (Peto, Fixed, 95% CI) | Totals not selected |
|
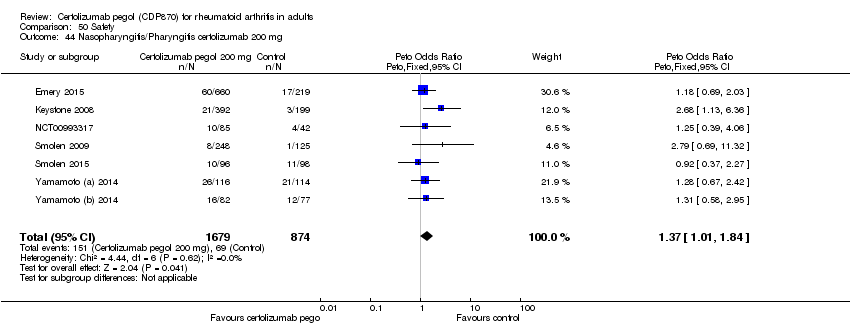
| 44 Nasopharyngitis/Pharyngitis certolizumab 200 mg Show forest plot | 7 | 2553 | Peto Odds Ratio (Peto, Fixed, 95% CI) | 1.37 [1.01, 1.84] |
|
| 45 Nasopharyngitis/Pharyngitis certolizumab 400 mg Show forest plot | 4 | 1364 | Peto Odds Ratio (Peto, Fixed, 95% CI) | 1.98 [1.26, 3.11] |
|
| 46 Injection site pain certolizumab 200 mg Show forest plot | 3 | 1091 | Peto Odds Ratio (Peto, Fixed, 95% CI) | 1.85 [0.49, 6.92] |
|
| 47 Injection site pain certolizumab 400 mg Show forest plot | 3 | 1179 | Peto Odds Ratio (Peto, Fixed, 95% CI) | 1.74 [0.41, 7.42] |
|
| 48 Hypertension certolizumab 200 mg Show forest plot | 4 | 1353 | Peto Odds Ratio (Peto, Fixed, 95% CI) | 3.09 [1.64, 5.84] |
|
| 49 Hypertension certolizumab 400 mg Show forest plot | 3 | 1121 | Peto Odds Ratio (Peto, Fixed, 95% CI) | 3.35 [1.80, 6.20] |
|
| 50 Hematuria certolizumab 200 mg Show forest plot | 1 | | Peto Odds Ratio (Peto, Fixed, 95% CI) | Totals not selected |
|
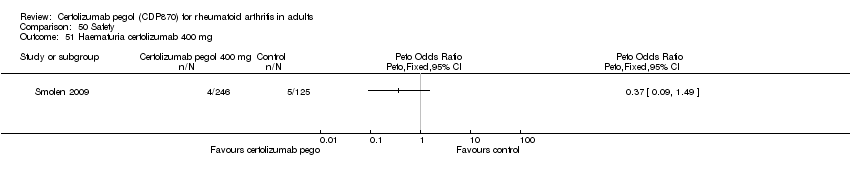
| 51 Haematuria certolizumab 400 mg Show forest plot | 1 | | Peto Odds Ratio (Peto, Fixed, 95% CI) | Totals not selected |
|
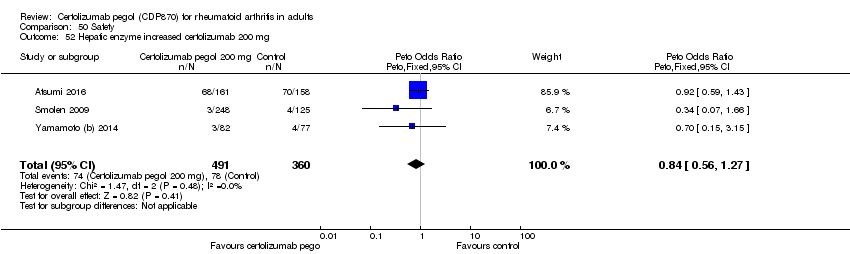
| 52 Hepatic enzyme increased certolizumab 200 mg Show forest plot | 3 | 851 | Peto Odds Ratio (Peto, Fixed, 95% CI) | 0.84 [0.56, 1.27] |
|
| 53 Hepatic enzyme increased certolizumab 400 mg Show forest plot | 2 | 533 | Peto Odds Ratio (Peto, Fixed, 95% CI) | 0.69 [0.25, 1.92] |
|
| 54 AST increased certolizumab 200 mg Show forest plot | 1 | | Peto Odds Ratio (Peto, Fixed, 95% CI) | Totals not selected |
|
| 55 AST increased certolizumab 400 mg Show forest plot | 1 | | Peto Odds Ratio (Peto, Fixed, 95% CI) | Totals not selected |
|
| 56 ALT increased certolizumab 200 mg Show forest plot | 2 | 1252 | Peto Odds Ratio (Peto, Fixed, 95% CI) | 0.85 [0.48, 1.50] |
|
| 57 ALT increased certolizumab 400 mg Show forest plot | 1 | | Peto Odds Ratio (Peto, Fixed, 95% CI) | Totals not selected |
|
| 58 Diarrhoea certolizumab 200 mg Show forest plot | 3 | 1200 | Peto Odds Ratio (Peto, Fixed, 95% CI) | 0.71 [0.25, 2.03] |
|
| 59 Gastroenteritis certolizumab 200 mg Show forest plot | 2 | 785 | Peto Odds Ratio (Peto, Fixed, 95% CI) | 0.97 [0.33, 2.87] |
|
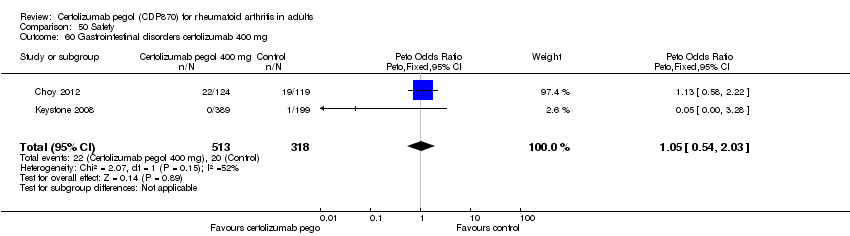
| 60 Gastrointestinal disorders certolizumab 400 mg Show forest plot | 2 | 831 | Peto Odds Ratio (Peto, Fixed, 95% CI) | 1.05 [0.54, 2.03] |
|
| 61 Back pain certolizumab 200 mg Show forest plot | 1 | | Peto Odds Ratio (Peto, Fixed, 95% CI) | Totals not selected |
|
| 62 Back pain certolizumab 400 mg Show forest plot | 2 | 831 | Peto Odds Ratio (Peto, Fixed, 95% CI) | 3.11 [1.48, 6.55] |
|
| 63 Hematologic abnormalities certolizumab 200 mg Show forest plot | 2 | 821 | Peto Odds Ratio (Peto, Fixed, 95% CI) | 2.02 [0.27, 15.21] |
|
| 64 Haematologic abnormalities certolizumab 400 mg Show forest plot | 2 | 750 | Peto Odds Ratio (Peto, Fixed, 95% CI) | 1.13 [0.21, 6.07] |
|
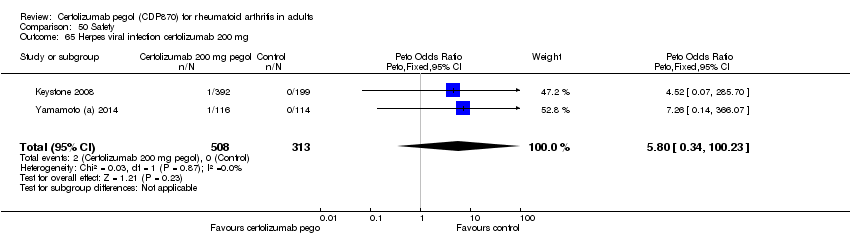
| 65 Herpes viral infection certolizumab 200 mg Show forest plot | 2 | 821 | Peto Odds Ratio (Peto, Fixed, 95% CI) | 5.80 [0.34, 100.23] |
|
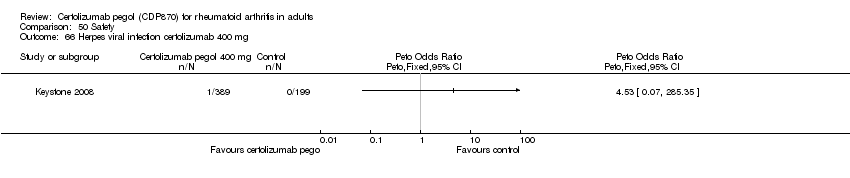
| 66 Herpes viral infection certolizumab 400 mg Show forest plot | 1 | | Peto Odds Ratio (Peto, Fixed, 95% CI) | Totals not selected |
|
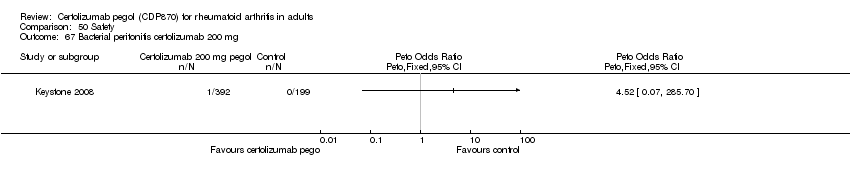
| 67 Bacterial peritonitis certolizumab 200 mg Show forest plot | 1 | | Peto Odds Ratio (Peto, Fixed, 95% CI) | Totals not selected |
|
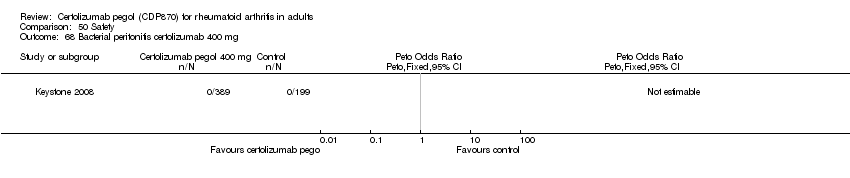
| 68 Bacterial peritonitis certolizumab 400 mg Show forest plot | 1 | | Peto Odds Ratio (Peto, Fixed, 95% CI) | Totals not selected |
|
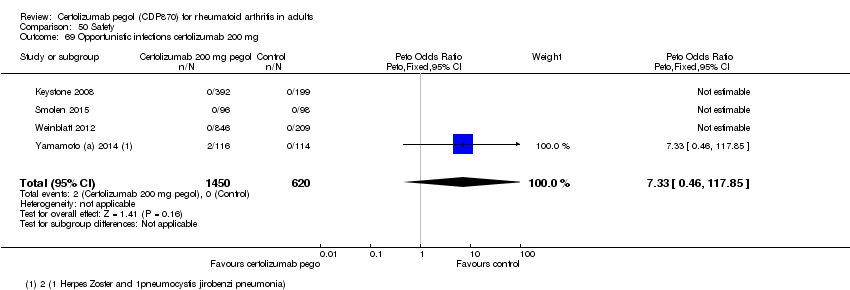
| 69 Opportunistic infections certolizumab 200 mg Show forest plot | 4 | 2070 | Peto Odds Ratio (Peto, Fixed, 95% CI) | 7.33 [0.46, 117.85] |
|
| 70 Opportunistic infections certolizumab 400 mg Show forest plot | 1 | | Peto Odds Ratio (Peto, Fixed, 95% CI) | Totals not selected |
|
| 71 Infections and infestations certolizumab 200 mg Show forest plot | 9 | 3910 | Risk Ratio (M‐H, Random, 95% CI) | 1.27 [1.10, 1.46] |
|
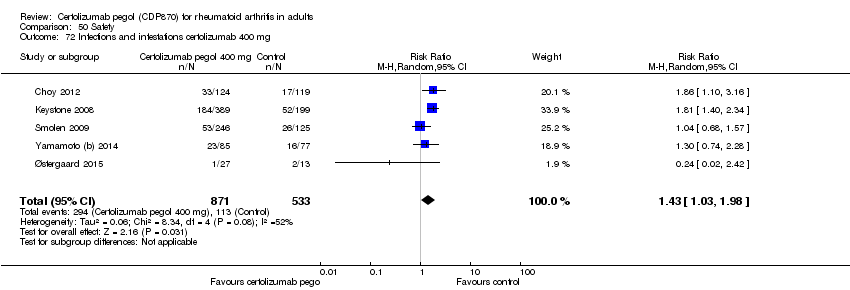
| 72 Infections and infestations certolizumab 400 mg Show forest plot | 5 | 1404 | Risk Ratio (M‐H, Random, 95% CI) | 1.43 [1.03, 1.98] |
|
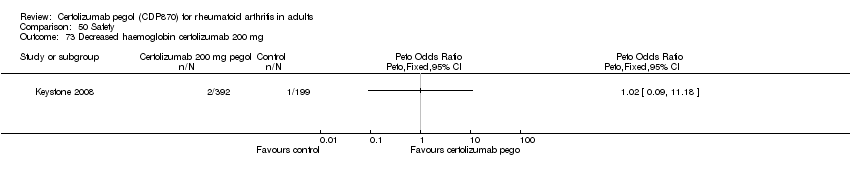
| 73 Decreased haemoglobin certolizumab 200 mg Show forest plot | 1 | | Peto Odds Ratio (Peto, Fixed, 95% CI) | Totals not selected |
|
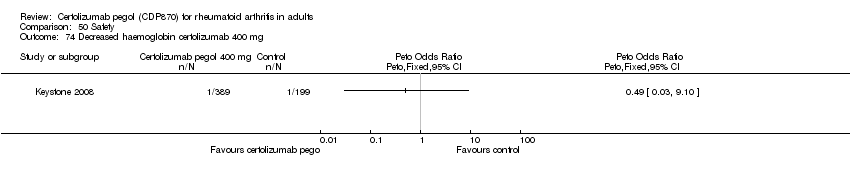
| 74 Decreased haemoglobin certolizumab 400 mg Show forest plot | 1 | | Peto Odds Ratio (Peto, Fixed, 95% CI) | Totals not selected |
|
| 75 Increased platelet count certolizumab 200 mg Show forest plot | 1 | | Peto Odds Ratio (Peto, Fixed, 95% CI) | Totals not selected |
|
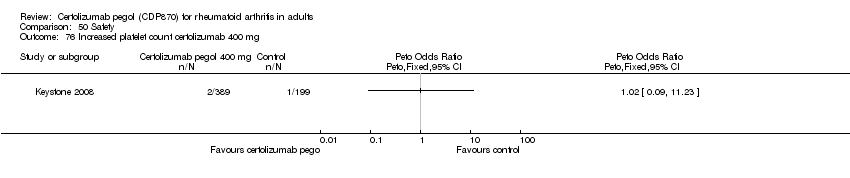
| 76 Increased platelet count certolizumab 400 mg Show forest plot | 1 | | Peto Odds Ratio (Peto, Fixed, 95% CI) | Totals not selected |
|
| 77 Cerebral haemorrhage including subarachnoid certolizumab 200 mg Show forest plot | 2 | 321 | Peto Odds Ratio (Peto, Fixed, 95% CI) | 1.27 [0.12, 13.50] |
|
| 78 Ischaemic stroke certolizumab 400 mg Show forest plot | 1 | | Peto Odds Ratio (Peto, Fixed, 95% CI) | Totals not selected |
|
| 79 Nausea/vomiting certolizumab 200 mg Show forest plot | 4 | 2447 | Peto Odds Ratio (Peto, Fixed, 95% CI) | 1.13 [0.84, 1.54] |
|
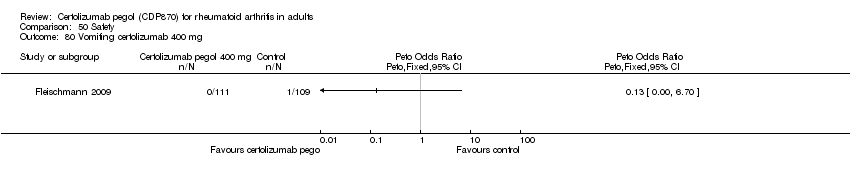
| 80 Vomiting certolizumab 400 mg Show forest plot | 1 | | Peto Odds Ratio (Peto, Fixed, 95% CI) | Totals not selected |
|
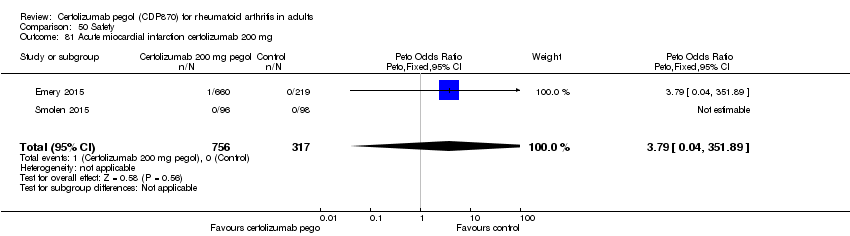
| 81 Acute miocardial infarction certolizumab 200 mg Show forest plot | 2 | 1073 | Peto Odds Ratio (Peto, Fixed, 95% CI) | 3.79 [0.04, 351.89] |
|
| 82 Acute myocardial infarction certolizumab 400 mg Show forest plot | 1 | | Peto Odds Ratio (Peto, Fixed, 95% CI) | Totals not selected |
|
| 83 Abdominal pain/discomfort/dyspepsia certolizumab 200 mg Show forest plot | 1 | | Peto Odds Ratio (Peto, Fixed, 95% CI) | Totals not selected |
|
| 84 Constipation certolizumab 200 mg Show forest plot | 1 | | Peto Odds Ratio (Peto, Fixed, 95% CI) | Totals not selected |
|
| 85 Skin and subcutaneous tissue disorders certolizumab 200 mg Show forest plot | 4 | 1395 | Peto Odds Ratio (Peto, Fixed, 95% CI) | 2.83 [1.46, 5.48] |
|
| 86 Skin and subcutaneous tissue disorders certolizumab 400 mg Show forest plot | 1 | | Peto Odds Ratio (Peto, Fixed, 95% CI) | Totals not selected |
|
| 87 Cough certolizumab 200 mg Show forest plot | 1 | | Peto Odds Ratio (Peto, Fixed, 95% CI) | Totals not selected |
|
| 88 Pruritus certolizumab 200 mg Show forest plot | 1 | | Peto Odds Ratio (Peto, Fixed, 95% CI) | Totals not selected |
|
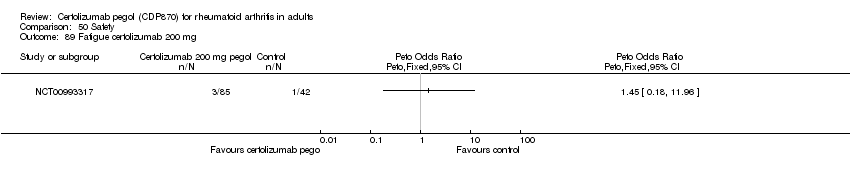
| 89 Fatigue certolizumab 200 mg Show forest plot | 1 | | Peto Odds Ratio (Peto, Fixed, 95% CI) | Totals not selected |
|
| 90 Fatigue certolizumab 400 mg Show forest plot | 1 | | Peto Odds Ratio (Peto, Fixed, 95% CI) | Totals not selected |
|
| 91 Periodontitis certolizumab 200 mg Show forest plot | 1 | | Peto Odds Ratio (Peto, Fixed, 95% CI) | Totals not selected |
|
| 92 Arthritis bacterial certolizumab 400 mg Show forest plot | 1 | | Peto Odds Ratio (Peto, Fixed, 95% CI) | Totals not selected |
|
| 93 Mastitis certolizumab 400 mg Show forest plot | 1 | 220 | Peto Odds Ratio (Peto, Fixed, 95% CI) | 7.26 [0.14, 365.79] |
|
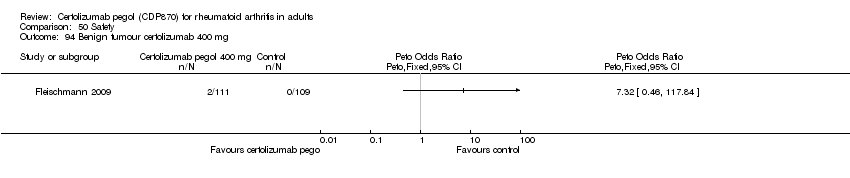
| 94 Benign tumour certolizumab 400 mg Show forest plot | 1 | | Peto Odds Ratio (Peto, Fixed, 95% CI) | Totals not selected |
|
| 95 Dizziness postural certolizumab 400 mg Show forest plot | 1 | | Peto Odds Ratio (Peto, Fixed, 95% CI) | Totals not selected |
|
| 96 Menorrhagia certolizumab 400 mg Show forest plot | 1 | | Peto Odds Ratio (Peto, Fixed, 95% CI) | Totals not selected |
|
| 97 Corneal perforation certolizumab 400 mg Show forest plot | 1 | | Peto Odds Ratio (Peto, Fixed, 95% CI) | Totals not selected |
|
| 98 Conjunctivitis allergic certolizumab 400 mg Show forest plot | 1 | | Peto Odds Ratio (Peto, Fixed, 95% CI) | Totals not selected |
|
| 99 Periodontitis certolizumab 400 mg Show forest plot | 1 | | Risk Ratio (M‐H, Fixed, 95% CI) | Totals not selected |
|