Scolaris Content Display Scolaris Content Display

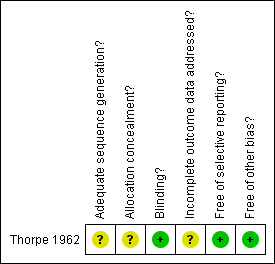
Methodological quality summary: review authors' judgements about each methodological quality item for each included study.
Figuras y tablas -
Figure 1

Methodological quality summary: review authors' judgements about each methodological quality item for each included study.

Comparison 1 MONETARY REWARD vs NO MONETARY REWARD, Outcome 1 Target behaviour: average number of dolls assembled per day.
Figuras y tablas -
Analysis 1.1

Comparison 1 MONETARY REWARD vs NO MONETARY REWARD, Outcome 1 Target behaviour: average number of dolls assembled per day.

Comparison 1 MONETARY REWARD vs NO MONETARY REWARD, Outcome 2 Leaving the study early.
Figuras y tablas -
Analysis 1.2

Comparison 1 MONETARY REWARD vs NO MONETARY REWARD, Outcome 2 Leaving the study early.

Table 1. Suggested design of study

Methods

Allocation: randomised, clearly described.
Design: cross‐over.*
Duration: 3 months before first cross‐over.

Participants

Diagnosis: schizophrenia.
N=300.**
Age: any.
Sex: men and women.
History: stable, perhaps with prominent negative symptoms, perhaps attending day units.

Interventions

1. Additional funds: not given every day but intermittently and randomly*** as reward for countering person‐specific negative symptom. N=150.

2. No additional funds. N=150.

Outcomes

Target symptoms: improved/not improved to important extent.
Satisfaction.
Quality of life.
Functioning.

Notes

* in suggesting cross‐over design we are attempting to ensure that everyone is assured of reward.
** study size to clearly illustrate 20% difference between groups in binary outcome.
*** strong positive reinforcer

Figuras y tablas -
Table 1. Suggested design of study
Summary of findings for the main comparison. Monetary reward compared with no monetary reward for schizophrenia

Monetary reward compared with no monetary reward for schizophrenia

Patient or population: patients with schizophrenia1
Settings: in hospital in UK in 1960s2
Intervention: Monetary reward3
Comparison: no monetary reward

Outcomes

Illustrative comparative risks* (95% CI)

Relative effect
(95% CI)

No of Participants
(studies)

Quality of the evidence
(GRADE)

Comments

Assumed risk

Corresponding risk

no monetary reward

Monetary reward

Target behaviour: average number of dolls assembled per day

The mean Target behaviour: average number of dolls assembled per day in the intervention groups was
0.8 lower
(1.41 to 0.19 lower)

25
(1 study)

⊕⊝⊝⊝
very low4,5,6

*The basis for the assumed risk (e.g. the median control group risk across studies) is provided in footnotes. The corresponding risk (and its 95% confidence interval) is based on the assumed risk in the comparison group and the relative effect of the intervention (and its 95% CI).
CI: Confidence interval;

GRADE Working Group grades of evidence
High quality: Further research is very unlikely to change our confidence in the estimate of effect.
Moderate quality: Further research is likely to have an important impact on our confidence in the estimate of effect and may change the estimate.
Low quality: Further research is very likely to have an important impact on our confidence in the estimate of effect and is likely to change the estimate.
Very low quality: We are very uncertain about the estimate.

1 Very chronically ill, not actively psychotic
2 Average stay in hospital ‐ 20 years
3 £0 s0 6d (1/40 th of one pound sterling)
4 Randomisation not well described
5 Work was assembling dolls in hospital workshop
6 Small study, likely others are unpublished or in dissertations only

Figuras y tablas -
Summary of findings for the main comparison. Monetary reward compared with no monetary reward for schizophrenia
Comparison 1. MONETARY REWARD vs NO MONETARY REWARD

Outcome or subgroup title

No. of studies

No. of participants

Statistical method

Effect size

1 Target behaviour: average number of dolls assembled per day Show forest plot

1

25

Mean Difference (IV, Fixed, 95% CI)

‐0.80 [‐1.41, ‐0.19]

2 Leaving the study early Show forest plot

1

25

Risk Difference (M‐H, Fixed, 95% CI)

0.0 [‐0.15, 0.15]

Figuras y tablas -
Comparison 1. MONETARY REWARD vs NO MONETARY REWARD