Scolaris Content Display Scolaris Content Display

Study flow diagram
Figuras y tablas -
Figure 1

Study flow diagram

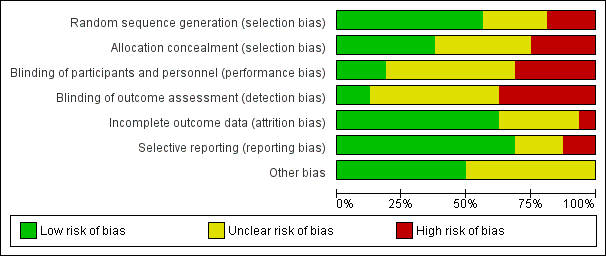
Methodological quality graph: review authors' judgements about each methodological quality item presented as percentages across all included studies
Figuras y tablas -
Figure 2

Methodological quality graph: review authors' judgements about each methodological quality item presented as percentages across all included studies

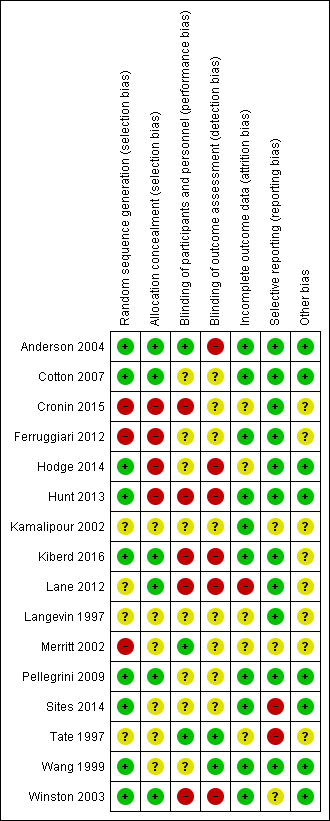
Methodological quality summary: review authors' judgements about each methodological quality item for each included study
Figuras y tablas -
Figure 3

Methodological quality summary: review authors' judgements about each methodological quality item for each included study

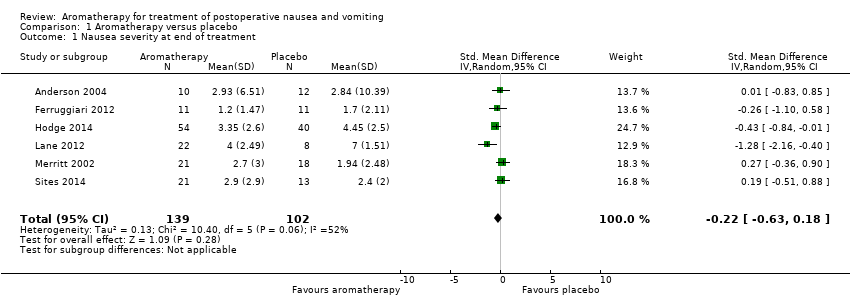
Comparison 1 Aromatherapy versus placebo, Outcome 1 Nausea severity at end of treatment.
Figuras y tablas -
Analysis 1.1

Comparison 1 Aromatherapy versus placebo, Outcome 1 Nausea severity at end of treatment.

Comparison 1 Aromatherapy versus placebo, Outcome 2 Duration of nausea measured as nausea‐free at the end of treatment.
Figuras y tablas -
Analysis 1.2

Comparison 1 Aromatherapy versus placebo, Outcome 2 Duration of nausea measured as nausea‐free at the end of treatment.

Comparison 1 Aromatherapy versus placebo, Outcome 3 Proportion requiring rescue antiemetics.
Figuras y tablas -
Analysis 1.3

Comparison 1 Aromatherapy versus placebo, Outcome 3 Proportion requiring rescue antiemetics.

Comparison 2 Peppermint versus placebo, Outcome 1 Nausea severity at 5 minutes post‐initial treatment.
Figuras y tablas -
Analysis 2.1

Comparison 2 Peppermint versus placebo, Outcome 1 Nausea severity at 5 minutes post‐initial treatment.

Comparison 3 Isopropyl alcohol versus standard treatment for PONV, Outcome 1 Time (minutes) to 50% reduction in nausea score.
Figuras y tablas -
Analysis 3.1

Comparison 3 Isopropyl alcohol versus standard treatment for PONV, Outcome 1 Time (minutes) to 50% reduction in nausea score.

Comparison 3 Isopropyl alcohol versus standard treatment for PONV, Outcome 2 Proportion requiring antiemetics.
Figuras y tablas -
Analysis 3.2

Comparison 3 Isopropyl alcohol versus standard treatment for PONV, Outcome 2 Proportion requiring antiemetics.

Comparison 3 Isopropyl alcohol versus standard treatment for PONV, Outcome 3 Patient satisfaction.
Figuras y tablas -
Analysis 3.3

Comparison 3 Isopropyl alcohol versus standard treatment for PONV, Outcome 3 Patient satisfaction.

Comparison 4 Isopropyl alcohol versus saline, Outcome 1 Proportion requiring rescue antiemetics.
Figuras y tablas -
Analysis 4.1

Comparison 4 Isopropyl alcohol versus saline, Outcome 1 Proportion requiring rescue antiemetics.

Summary of findings for the main comparison. Aromatherapy compared to placebo for treatment of postoperative nausea and vomiting

Aromatherapy compared to placebo for treatment of postoperative nausea and vomiting

Patient or population: adults and children having any type of surgical procedure under general anaesthesia, regional anaesthesia or sedation, either as hospital inpatients or outpatients, with existing PONV
Setting: hospital post‐anaesthesia care unit or same‐day surgery unit in USA and Iran
Intervention: aromatherapy
Comparison: placebo

Outcomes

Anticipated absolute effects* (95% CI)

Relative effect
(95% CI)

№ of participants
(studies)

Quality of the evidence
(GRADE)

Comments

Risk with placebo

Risk with aromatherapy

Nausea severity
Assessed with VAS at end of treatment
Scale from 0 to 10 (higher indicates worse nausea)
Follow‐up: range 5 minutes to participant discharge

The mean nausea severity was 2.8 (SD = 10.39)

SMD 0.22 SD lower
(0.63 lower to 0.18 higher)

241
(6 RCTs)

⊕⊕⊝⊝
Low1, 2

Risk in placebo group based on control group in Anderson 2004

Nausea duration (nausea‐free at end of treatment)
Assessed by numbers of participants
Follow‐up: range 5 minutes to participant discharge

Measured by participant self‐report or medical or nursing observation

Study population

RR 3.25
(0.31 to 34.33)

193
(4 RCTs)

⊕⊝⊝⊝
Very low3, 4, 5

30 per 100

96 per 100
(9 to 100)

Proportion requiring rescue antiemetics
Assessed by numbers of participants
Follow up: range 5 minutes to participant discharge

Study population

RR 0.60
(0.37 to 0.97)

609
(7 RCTs)

⊕⊕⊝⊝
Low1, 2

68 per 100

41 per 100
(25 to 66)

Adverse events

(common reactions to aromatherapy include skin rashes, dyspnoea, headache, cardiac arrhythmias, hypotension, hypertension or dizziness)

See comment

The studies reporting this comparison did not report this outcome.

Patient satisfaction with treatment

Measured by a validated scale

See comment

The studies reporting this comparison did not report this outcome.

*The risk in the intervention group (and its 95% confidence interval) is based on the assumed risk in the comparison group and the relative effect of the intervention (and its 95% CI).

CI: confidence interval; PONV: postoperative nausea and vomiting; RCT: randomized controlled trial; RR: risk ratio; SD: standard deviation; SMD: standardized mean difference; VAS: visual analogue scale

GRADE Working Group grades of evidence
High quality: we are very confident that the true effect lies close to that of the estimate of the effect
Moderate quality: we are moderately confident in the effect estimate: the true effect is likely to be close to the estimate of the effect, but there is a possibility that it is substantially different
Low quality: our confidence in the effect estimate is limited: the true effect may be substantially different from the estimate of the effect
Very low quality: we have very little confidence in the effect estimate: the true effect is likely to be substantially different from the estimate of effect

1Risk of bias across all studies due to study designs, downgraded one level.
2Inconsistent results for aromatherapy, downgraded one level.
3High risk of bias in included studies due to study designs, downgraded two levels.
4Low numbers of participants and events leading to imprecision of results, downgraded one level.
5Very serious inconsistency between studies, downgraded two levels.

Figuras y tablas -
Summary of findings for the main comparison. Aromatherapy compared to placebo for treatment of postoperative nausea and vomiting
Summary of findings 2. Peppermint compared to placebo for treatment of postoperative nausea and vomiting

Peppermint compared to placebo for treatment of postoperative nausea and vomiting

Patient or population: adults and children having any type of surgical procedure under general anaesthesia, regional anaesthesia or sedation, as hospital inpatients or outpatients, with existing PONV
Setting: hospital post‐anaesthesia care unit or same‐day surgery unit in USA
Intervention: peppermint
Comparison: placebo

Outcomes

Anticipated absolute effects* (95% CI)

Relative effect
(95% CI)

№ of participants
(studies)

Quality of the evidence
(GRADE)

Comments

Risk with placebo

Risk with peppermint

Nausea severity
Assessed with VAS at 5 minutes post‐initial treatment
Scale from: 0 to 10 (higher indicates worse nausea)

The mean nausea severity was 2.8 (SD = 10.39)

SMD 0.18 SD lower
(0.86 lower to 0.49 higher)

115
(4 RCTs)

⊕⊕⊝⊝
Low1, 2

Risk in placebo group based on control group in Anderson 2004

Nausea duration (nausea‐free at end of treatment)

Measured by participant self‐report or medical or nursing observation

See comment

The studies reporting this comparison did not report this outcome.

Use of rescue antiemetics

See comment

The studies reporting this comparison did not report this outcome.

Adverse events

(common reactions to aromatherapy include skin rashes, dyspnoea, headache, cardiac arrhythmias, hypotension, hypertension or dizziness)

See comment

The studies reporting this comparison did not report this outcome.

Patient satisfaction with treatment

Measured by a validated scale

See comment

The studies reporting this comparison did not report this outcome.

*The risk in the intervention group (and its 95% confidence interval) is based on the assumed risk in the comparison group and the relative effect of the intervention (and its 95% CI).

CI: confidence interval; PONV: postoperative nausea and vomiting; RCT: randomized controlled trial; SD: standard deviation; SMD: standardized mean difference; VAS: visual analogue scale

GRADE Working Group grades of evidence
High quality: we are very confident that the true effect lies close to that of the estimate of the effect
Moderate quality: we are moderately confident in the effect estimate: the true effect is likely to be close to the estimate of the effect, but there is a possibility that it is substantially different
Low quality: our confidence in the effect estimate is limited: the true effect may be substantially different from the estimate of the effect
Very low quality: we have very little confidence in the effect estimate: the true effect is likely to be substantially different from the estimate of effect

1Risk of bias in included studies due to study designs, downgraded one level.
2Significant inconsistency between studies, downgraded one level.

Figuras y tablas -
Summary of findings 2. Peppermint compared to placebo for treatment of postoperative nausea and vomiting
Summary of findings 3. Isopropyl alcohol compared to standard treatment for postoperative nausea and vomiting

Isopropyl alcohol compared to standard treatment for postoperative nausea and vomiting

Patient or population: adults and children having any type of surgical procedure under general anaesthesia, regional anaesthesia or sedation, as hospital inpatients or outpatients, with existing PONV
Setting: hospital post‐anaesthesia care unit or same‐day surgery unit in USA
Intervention: isopropyl alcohol
Comparison: standard treatment for PONV

Outcomes

Anticipated absolute effects* (95% CI)

Relative effect
(95% CI)

№ of participants
(studies)

Quality of the evidence
(GRADE)

Comments

Risk with standard treatment for PONV

Risk with isopropyl alcohol

Nausea severity

Measured by a validated scale or medical or nursing observation

See comment

The studies reporting this comparison did not report this outcome.

Nausea duration (measured as nausea‐free at end of treatment)
Assessed by time (minutes) to 50% reduction in nausea score
Scale from: 0 to 120
Follow‐up: range 5 minutes to participant discharge

Measured by participant self‐report or medical or nursing observation

The mean time to 50% reduction in nausea score was 20.5 minutes

SMD 1.10 SD lower
(1.43 lower to 0.78 lower)

176
(3 RCTs)

⊕⊕⊕⊝
Moderate1

Risk in placebo group based

on Pellegrini 2009

Use of rescue antiemetics
Assessed by proportion requiring antiemetics
Follow‐up: range 5 minutes to participant discharge

Study population

RR 0.67
(0.46 to 0.98)

215
(4 RCTs)

⊕⊕⊕⊝
Moderate2

39 per 100

26 per 100
(18 to 38)

Patient satisfaction with treatment
Assessed with Yes or No

Measured by a validated scale

Study population

RR 1.12
(0.62 to 2.03)

172
(2 RCTs)

⊕⊝⊝⊝
Very low1, 3, 4

76 per 100

85 per 100
(47 to 100)

Adverse events

(common reactions to aromatherapy include skin rashes, dyspnoea, headache, cardiac arrhythmias, hypotension, hypertension or dizziness)

See comment

The studies reporting this comparison did not report this outcome.

*The risk in the intervention group (and its 95% confidence interval) is based on the assumed risk in the comparison group and the relative effect of the intervention (and its 95% CI).

CI: confidence interval; PONV: postoperative nausea and vomiting; RCT: randomized controlled trial; RR: risk ratio; SD: standard deviation; SMD: standardized mean difference

GRADE Working Group grades of evidence
High quality: we are very confident that the true effect lies close to that of the estimate of the effect
Moderate quality: we are moderately confident in the effect estimate: the true effect is likely to be close to the estimate of the effect, but there is a possibility that it is substantially different
Low quality: our confidence in the effect estimate is limited: the true effect may be substantially different from the estimate of the effect
Very low quality: we have very little confidence in the effect estimate: the true effect is likely to be substantially different from the estimate of effect

1No or unclear blinding in all included studies, downgraded one level.
2No or unclear blinding in three of the four included studies, downgraded one level.
3High heterogeneity between studies, downgraded one level.
4High imprecision due to wide confidence intervals and small numbers of participants, downgraded one level.

Figuras y tablas -
Summary of findings 3. Isopropyl alcohol compared to standard treatment for postoperative nausea and vomiting
Summary of findings 4. Isopropyl alcohol compared to saline for treatment of postoperative nausea and vomiting

Isopropyl alcohol compared to saline for treatment of postoperative nausea and vomiting

Patient or population: adults and children having any type of surgical procedure under general anaesthesia, regional anaesthesia or sedation, as hospital inpatients or outpatients, with existing PONV
Setting: hospital post‐anaesthesia care unit or same‐day surgery unit in USA and Iran
Intervention: isopropyl alcohol
Comparison: saline

Outcomes

Anticipated absolute effects* (95% CI)

Relative effect
(95% CI)

№ of participants
(studies)

Quality of the evidence
(GRADE)

Comments

Risk with saline

Risk with isopropyl alcohol

Nausea severity

Measured by a validated scale or medical or nursing observation

See comment

The studies reporting this comparison did not report this outcome.

Nausea duration (nausea‐free at end of treatment)

Measured by participant self‐report or medical or nursing observation

See comment

The studies reporting this comparison did not report this outcome.

Use of rescue antiemetics
Assessed by proportion requiring rescue antiemetics
Follow‐up: range 5 minutes to participant discharge

Study population

RR 0.39
(0.12 to 1.24)

291
(4 RCTs)

⊕⊝⊝⊝
Very low1, 2, 3

90 per 100

35 per 100
(11 to 100)

Adverse events

(common reactions to aromatherapy include skin rashes, dyspnoea, headache, cardiac arrhythmias, hypotension, hypertension or dizziness)

See comment

The studies reporting this comparison did not report this outcome.

Patient satisfaction with treatment

Measured by a validated scale

See comment

The studies reporting this comparison did not report this outcome.

*The risk in the intervention group (and its 95% confidence interval) is based on the assumed risk in the comparison group and the relative effect of the intervention (and its 95% CI).

CI: confidence interval; PONV: postoperative nausea and vomiting; RCT: randomized controlled trial; RR: risk ratio

GRADE Working Group grades of evidence
High quality: we are very confident that the true effect lies close to that of the estimate of the effect
Moderate quality: we are moderately confident in the effect estimate: the true effect is likely to be close to the estimate of the effect, but there is a possibility that it is substantially different
Low quality: our confidence in the effect estimate is limited: the true effect may be substantially different from the estimate of the effect
Very low quality: we have very little confidence in the effect estimate: the true effect is likely to be substantially different from the estimate of effect

1Poor reporting in Kamalipour 2002 and Langevin 1997 affect confidence in results, downgraded one level.
2Wide confidence interval for pooled results, downgraded one level.
3Very high heterogeneity between studies, downgraded two levels.

Figuras y tablas -
Summary of findings 4. Isopropyl alcohol compared to saline for treatment of postoperative nausea and vomiting
Table 1. Patient satisfaction

Study

Design

Intervention/comparison

Measure

Satisfied

Anderson 2004

RCT

IPA/Saline/Peppermint

100 mm VAS (0 mm extremely dissatisfied; 100 mm fully satisfied)

IPA: 90.3 (SD: 14.9)

peppermint: 86.3 (SD: 32.3)

saline: 83.7 (SD: 25.6)

Cotton 2007

RCT

IPA/ondansetron

4‐point DOS

(poor, fair, good, excellent)

Good or excellent: Intervention: 38/38

Comparison: 34/34

Pellegrini 2009

RCT

IPA/Promethazine

5‐point DOS

 (1 = totally unsatisfied, 5 = totally satisfied)

Both groups reported median score 4

Winston 2003

RCT

IPA/ondansetron

4‐point DOS

(poor, fair, good, excellent)

Good or excellent:

Intervention: 38/50

Comparison: 30/50

DOS: descriptive ordinal scale; IPA: isopropyl alcohol; RCT: randomized controlled trial; SD: standard deviation; VAS: visual analogue scale

Figuras y tablas -
Table 1. Patient satisfaction
Comparison 1. Aromatherapy versus placebo

Outcome or subgroup title

No. of studies

No. of participants

Statistical method

Effect size

1 Nausea severity at end of treatment Show forest plot

6

241

Std. Mean Difference (IV, Random, 95% CI)

‐0.22 [‐0.63, 0.18]

2 Duration of nausea measured as nausea‐free at the end of treatment Show forest plot

4

193

Risk Ratio (M‐H, Random, 95% CI)

3.25 [0.31, 34.33]

3 Proportion requiring rescue antiemetics Show forest plot

7

609

Risk Ratio (M‐H, Random, 95% CI)

0.60 [0.37, 0.97]

Figuras y tablas -
Comparison 1. Aromatherapy versus placebo
Comparison 2. Peppermint versus placebo

Outcome or subgroup title

No. of studies

No. of participants

Statistical method

Effect size

1 Nausea severity at 5 minutes post‐initial treatment Show forest plot

4

115

Std. Mean Difference (IV, Random, 95% CI)

‐0.18 [‐0.86, 0.49]

Figuras y tablas -
Comparison 2. Peppermint versus placebo
Comparison 3. Isopropyl alcohol versus standard treatment for PONV

Outcome or subgroup title

No. of studies

No. of participants

Statistical method

Effect size

1 Time (minutes) to 50% reduction in nausea score Show forest plot

3

176

Std. Mean Difference (IV, Random, 95% CI)

‐1.10 [‐1.43, ‐0.78]

2 Proportion requiring antiemetics Show forest plot

4

215

Risk Ratio (M‐H, Random, 95% CI)

0.67 [0.46, 0.98]

3 Patient satisfaction Show forest plot

2

172

Risk Ratio (M‐H, Random, 95% CI)

1.12 [0.62, 2.03]

Figuras y tablas -
Comparison 3. Isopropyl alcohol versus standard treatment for PONV
Comparison 4. Isopropyl alcohol versus saline

Outcome or subgroup title

No. of studies

No. of participants

Statistical method

Effect size

1 Proportion requiring rescue antiemetics Show forest plot

4

291

Risk Ratio (M‐H, Random, 95% CI)

0.39 [0.12, 1.24]

Figuras y tablas -
Comparison 4. Isopropyl alcohol versus saline