Antibioticoterapia de corta duración versus ciclo prolongado para la neumonía adquirida en el hospital en adultos graves
Referencias
Referencias de los estudios incluidos en esta revisión
Referencias de los estudios excluidos de esta revisión
Referencias de los estudios en curso
Referencias adicionales
Referencias de otras versiones publicadas de esta revisión
Characteristics of studies
Characteristics of included studies [ordered by study ID]
| Methods | Multi‐centre study, based in France. Unblinded, randomised controlled trial comparing fixed durations (8‐day versus 15‐day) of antibiotic therapy for early‐onset VAP conducted between 1998 and 2002 | |
| Participants | 225 adult patients in 13 ICUs (medical, surgical, trauma; 70% male; mean age 49; mean SAPS II score 39; no episodes due to NF‐GNB; no episodes due to MRSA). VAP diagnosis required 2 of the following: temperature of 38.3 °C or higher, white cell count > 10 x 109/L, excessive purulent secretions, and meeting radiological criteria. VAP diagnosis was confirmed with BAL culture of ≥ 104 cfu/ml. Early onset VAP was defined as pneumonia developing more than 24 hours but less than 8 days after onset of mechanical ventilation. Mean interval between hospital admission and intubation was 1.6 days, and between intubation and BAL (i.e. onset of VAP) 3.5 days. Bacterial pathogen identified on blood culture in 8% cases | |
| Interventions | 116 patients were allocated to receive an 8‐day course of beta‐lactam (from choice of 3) plus 5 days of aminoglycoside antibiotic (from choice of 3); 109 patients were allocated to receive a 15‐day course of beta‐lactam plus 5 days of aminoglycoside | |
| Outcomes | The trial was designed to show equivalence in terms of clinical cure rate Primary outcome:
Secondary outcomes (with the exception of 90‐day mortality, all evaluated at day 21):
| |
| Notes | Appropriateness of initial antibiotic therapy was not reported. Mean duration of first‐line treatment was 7.8 days (SD 1.6) in the short course and 13.1 (SD 3.6) in the prolonged course group The interval between the end of data collection and publication was 10 years | |
| Risk of bias | ||
| Bias | Authors' judgement | Support for judgement |
| Random sequence generation (selection bias) | Low risk | "Randomization is allocated in each centre by a dedicated randomisation table." |
| Allocation concealment (selection bias) | Unclear risk | "The assigned treatment arm is communicated by fax at the latest at D5 by the main investigator centre." Comment: unclear to what extent participants/investigators at main centre could have access to/have foreseen allocation according to randomisation table |
| Blinding of participants and personnel (performance bias) | High risk | Non‐blinded |
| Blinding of outcome assessment (detection bias) | High risk | Non‐blinded |
| Incomplete outcome data (attrition bias) | Unclear risk | Data regarding exclusions not reported. No loss to 21‐day follow‐up. However, loss to 90‐day follow‐up of 14 patients (12%) in short‐course, and of 13 (12%) in prolonged‐course group. Explanation not provided and significance not explored |
| Selective reporting (reporting bias) | Unclear risk | Antibiotic‐free days unreported |
| Other bias | Unclear risk | Follow‐up at 21‐days is relatively early compared with other studies, for assessment of, e.g. duration of ICU stay. Data were collected between 1998 and 2002. Though recently published, results will reflect critical care medicine as practised a decade earlier |
| Methods | The PNEUMA study, a multi‐centre study based in France. Unblinded, randomised controlled trial comparing fixed durations (8‐day versus 15‐day) of antibiotic therapy for VAP. Randomisation occurred 3 days after BAL results confirmed VAP | |
| Participants | 401 adult patients. 51 French ICUs. 72% male; mean age 61; episodes due to NF‐GNB 32.5%, MRSA 11.2%; mean SAPS II score 45; mean SOFA score 7.4 at admission. VAP was diagnosed according to the following criteria: new and persistent radiographic infiltrate, plus 1 of: purulent tracheal secretions, temperature of 38.4 °C or higher, or leukocyte count > 10,000/µL; and positive quantitative culture of 104 cfu/mL from BAL or 103 cfu/mL from PSB. Duration of mechanical ventilation prior to VAP: 13.6 days. No significant differences between groups at baseline, with the exception of significantly higher proportion of men (76.6%) in 8‐day regimen versus men in 15‐day regimen (67.6%; P value = 0.046). All patients received appropriate initial antibiotics. Exclusions included early onset pneumonia (within 5 days of commencing mechanical ventilation) in patients who had received no antimicrobial therapy in the 15 days prior to diagnosis of pneumonia, and immunocompromised state, characterised by: neutropenia, AIDS, long‐term corticosteroids or other immunosuppressant therapy | |
| Interventions | 197 patients received a fixed 8‐day course of antibiotics (chosen by treating physician); 204 patients received a 15‐day course | |
| Outcomes | The trial was designed to demonstrate the non‐inferiority of short‐course therapy in terms of all‐cause mortality and pulmonary infection recurrence, and superiority in terms of 28‐day antibiotic‐free days. It was powered to detect a 10% difference in death and pulmonary infection recurrence, and a 20% difference in 28‐day antibiotic‐free days The primary outcome measures were:
The following additional measures were reported:
| |
| Notes | Repeat bronchoscopy was performed on the basis of fever, purulent secretions, new or progressive pulmonary infiltrates, or deterioration in respiratory or haemodynamic parameters. It was not performed routinely, e.g. on completion of 8‐day course of therapy, and consequently data regarding persistent colonisation with NF‐GNB are not available | |
| Risk of bias | ||
| Bias | Authors' judgement | Support for judgement |
| Random sequence generation (selection bias) | Low risk | "Randomisation was performed...and stratified... according to a computer‐generated random‐number table." |
| Allocation concealment (selection bias) | Low risk | "Randomisation performed centrally, using an interactive voice system... randomisation was not communicated to the investigators until day 8... On that day, investigators had to telephone the randomisation centre to receive the treatment assignment by fax." |
| Blinding of participants and personnel (performance bias) | High risk | "...Patients, medical and nursing staffs, and pharmacists remained blinded until [day 8]." However, importantly, no attempt was made to blind from day 8, i.e. the point from which allocation might make a significant difference |
| Blinding of outcome assessment (detection bias) | High risk | "...Patients, medical and nursing staffs, and pharmacists remained blinded until [day 8]." Again, no attempt was made to blind from day 8, i.e. the point from which allocation might make a significant difference |
| Incomplete outcome data (attrition bias) | Low risk | Following randomisation, 0 patients were lost to follow‐up. 1 patient was excluded from analysis following withdrawal of consent |
| Selective reporting (reporting bias) | Unclear risk | Study protocol not available for examination. However, outcome measures are those expected and appropriately presented within the report |
| Other bias | Low risk | There was a significantly higher proportion of men in the 8‐day group (76.6%) compared with the 15‐day group (67.6%; P value = 0.046). However, there were not significant differences in illness severity scores, prior duration of mechanical ventilation, prior antibiotic administration, micro‐organisms responsible for VAP, and antibiotic regimes to treat VAP Data regarding proportions of patients who contrary to protocol did not receive a full 8‐day or 15‐day course of antibiotics are not provided. However, absolute antibiotic‐treatment days and 28‐day antibiotic‐free day data indicate significantly less antibiotic exposure as a consequence of allocation to short or prolonged‐course therapy |
| Methods | Single‐centre study based in Tunisia. RCT comparing fixed durations (7‐day versus 10‐day) of antibiotic therapy for VAP | |
| Participants | Medical ICU. 30 adult patients (63% male; mean age 63 years; episodes due to NF‐GNB 72%; SAPS II 42.4). VAP (onset more than 48 hours after mechanical ventilation in ICU) diagnosis was suspected on the basis of: new and persistent radiographic infiltrate, purulent secretions, fever or deteriorating gas exchange or white cell count and confirmed on quantitative analysis of culture of endotracheal aspirate (> 104 cfu/ml) or protected distal respiratory specimens (>103 cfu/ml). Mean onset of VAP after institution of mechanical ventilation: 10 days. Initial antibiotics were appropriate in 94% of cases. No significant differences in baseline characteristics between the 2 groups Exclusions include: second episode of pneumonia during single hospitalisation, terminal illness, failure to isolate bacterial growth 30 patients randomised from 39 patients with clinical features of VAP: 9 not enrolled because of terminal illness or failure to isolate bacteria | |
| Interventions | 14 patients randomised to receive 7‐day course of antibiotics; 16 patients to receive 16‐day course. Choice of antibiotic: on microbiology advice, taking into account whether early (up to including 5 days after commencing mechanical ventilation) or late‐onset VAP, and whether risk factors for multi‐resistant bacteria present, and modified according to culture/sensitivity results 94% patients received appropriate initial antibiotic therapy | |
| Outcomes | Primary outcome measures were:
Power calculation is not reported The following additional outcome measures were presented:
| |
| Notes | Data regarding protocol violations and patients lost to follow‐up not available. Unable to make contact with trial authors to request supplementary information | |
| Risk of bias | ||
| Bias | Authors' judgement | Support for judgement |
| Random sequence generation (selection bias) | Low risk | Use of random number table |
| Allocation concealment (selection bias) | Unclear risk | Inadequately reported |
| Blinding of participants and personnel (performance bias) | Unclear risk | Inadequately reported |
| Blinding of outcome assessment (detection bias) | Unclear risk | Inadequately reported |
| Incomplete outcome data (attrition bias) | Unclear risk | Inadequately reported |
| Selective reporting (reporting bias) | Unclear risk | Inadequately reported |
| Other bias | Low risk | No evidence of other source of bias |
| Methods | International multi‐centre study (56 sites in 19 countries, stratified according to region as Central and Southern America, Eastern Europe and Asia, and Western Europe, North America and Australia) conducted between April 2008 and June 2011. Double‐blinded randomised controlled trial comparing a fixed 7‐day course of doripenem, with a fixed 10‐day course of imipenem‐cilastatin | |
| Participants | 274 patients (APACHE II score > 8 and < 35, baseline CPIS > 6, prior hospitalisation or management in chronic care facility for total 5 days or more within previous 90 days) with pneumonia acquired at least 48 hours after onset of mechanical ventilation. Of these, 227 (65% male, mean age 78 years, 57% APACHE II > 15, mean SOFA score 5.8) were included in the ITT analysis. Baseline characteristics of intervention groups overall appear balanced, but statistical significance of any differences not explored. VAP diagnosed on the basis of new or worsening radiographic infiltrates and at least one of: temperature > 39 °C or < 35 °C, or an increase of temperature of > 1 °C, or white blood cell count > 10 x 109/L. Among the microbiological intention‐to‐treat group (MITT; at least 1 gram‐negative pathogen identified on BAL or mini‐BAL at density of ≥ 104 cfu/mL with an imipenem MIC < 8 μg/mL), a gram‐negative pathogen was identified in 89% cases. Within this MITT group a higher proportion of the patients receiving doripenem had either Pseudomonas aeruginosa (22% versus 11%) or Acinetobacter spp. (19% versus 11%) identified. No data presented for duration of mechanical ventilation prior to onset of VAP | |
| Interventions | Among the ITT group, 115 patients received a 7‐day course of doripenem 1 g administered as 4‐hour infusion every 8 hours, and 112 patients a 10‐day course of imipenem‐cilastatin 1 g as a 1‐hour infusion every 8 hours. Among the subgroup meeting the MITT criteria as above, 79 received doripenem and 88 imipenem‐cilastatin | |
| Outcomes | The study was designed to demonstrate non‐inferiority for the primary outcome measure, clinical cure (according to radiological and clinical features) at end of treatment (day 10) The following additional outcomes were reported for the MITT group:
| |
| Notes | Study was closed prematurely because of inferior efficacy and higher mortality in 1 treatment arm Median duration of study drug therapy 9.7 days in each group, and for active drug 7.0 days in doripenem group and 10.0 days in imipenem group 5 sites (3 in Guatemala, 1 in Germany, 1 in United States) deemed to be non‐compliant with good clinical practices, and for this reason data regarding 41 patients were excluded from analysis. Note additional data published elsewhere regarding ITT patients not included in MITT analysis (Dimopoulos 2013). However, given the intention described in the original report to restrict data analysis to MITT patients, only data from these patients are included in this review The US Food and Drug Administration agency issued a warning regarding use of doripenem for ventilator‐associated pneumonia in 2014 (FDA 2014) | |
| Risk of bias | ||
| Bias | Authors' judgement | Support for judgement |
| Random sequence generation (selection bias) | Unclear risk | Quote: "Treatment was randomised with use of a central interactive phone system." Comment: this implies that the randomisation process is computer‐generated, but is unclear from the text |
| Allocation concealment (selection bias) | Low risk | "Treatment was randomised with use of a central interactive phone system." |
| Blinding of participants and personnel (performance bias) | Low risk | Double‐blinded. All patients received a 7‐day infusion (whether placebo or active drug) and 10‐day infusion (whether active drug or placebo) |
| Blinding of outcome assessment (detection bias) | Low risk | "Double‐blinded", implying outcome assessment probably blinded |
| Incomplete outcome data (attrition bias) | Low risk | Outcome data are complete for the MITT subgroup of interest |
| Selective reporting (reporting bias) | Unclear risk | Duration of mechanical ventilation before episode of VAP not presented, which is unexpected given the intention to compare interventions in patients with late‐onset VAP In terms of outcome data, duration of mechanical ventilation and of ICU and hospital length of stay are unreported, but possibly such outcome data would have been difficult to interpret given variation in processes at such a large number of centres |
| Other bias | High risk | Unfortunately, there are multiple interventions. This study is comparing not just a short course of therapy with a prolonged course, but a short course of one antibiotic administered over a long infusion time (which may be more effective against resistant bacteria), with a long course of another antibiotic administered over a short infusion time There is a higher proportion of Pseudomonas aeruginosa and Acinetobacter spp. in the doripenem group The timing of EOT assessment (at day 10) may have favoured patients in the 10‐day therapy group rather than the 7‐day therapy group, not having allowed for relapse to have occurred in the prolonged‐therapy group |
| Methods | 2‐centre study, based in Uruguay, conducted May 2003 to December 2006. Randomised controlled study comparing fixed short (8‐day) and long (12‐day) courses of antibiotic therapy for VAP | |
| Participants | 77 patients (medical, surgical and neurosurgical; mean age 59 years, 53% male, 63.6% episodes due to NF‐GNB, 9.1% episodes due to MRSA; median APACHE II score 21, MODS score 5, SOFA score 6) with VAP. VAP was diagnosed on the basis of: new and persistent radiographic infiltrates, 2 of temperature ≥ 38.5 ºC or < 36 ºC, leukocytes ≥ 12,000/ mm3 or ≤ 4 x 10³/mm3, and BAL culture ≥ 104 cfu/ml, or positive ETA plus CPIS > 6, or micro‐organism in ≥ 2 blood cultures with identical sensitivity to tracheal secretions and in the absence of other possible infection, or positive culture of pleural fluid. Mean time after commencing mechanical ventilation before onset of VAP: 9.3 days. 68% patients had received a prior course of antibiotics. In 97% cases, initial antibiotic therapy for VAP was appropriate. There were no significant differences in baseline characteristics between treatment groups | |
| Interventions | 77 patients randomised to 8‐day treatment or 12‐day course on day 8 of antibiotic therapy. Antibiotic choice was that of the attending physician; in 75/77 (97%) cases, initial antibiotic therapy was appropriate. The most commonly used antibiotics were: cefoperazone‐sulbactam, carbapenem and other third‐generation cephalosporins. In 51% cases, antibiotic combinations were used | |
| Outcomes | The study was designed to demonstrate the non‐inferiority of short‐course therapy in terms of clinical resolution and non‐resolution ("therapeutic failure") of VAP The following other outcomes were also reported:
| |
| Notes | No patients were lost to follow‐up. No patient received a shorter duration of antibiotic therapy than allocated; data are incomplete for patients who had antibiotics continued beyond the allocated duration At the time our searches were performed, this study had not been published in a peer‐reviewed journal | |
| Risk of bias | ||
| Bias | Authors' judgement | Support for judgement |
| Random sequence generation (selection bias) | Low risk | Block randomisation using random number table |
| Allocation concealment (selection bias) | Low risk | Sealed, numbered envelopes opened sequentially |
| Blinding of participants and personnel (performance bias) | High risk | Non‐blinded study |
| Blinding of outcome assessment (detection bias) | High risk | Non‐blinded study |
| Incomplete outcome data (attrition bias) | Low risk | No patients lost to follow‐up |
| Selective reporting (reporting bias) | Unclear risk | Unclear. Data incomplete for patients who had antibiotics continued beyond the allocated duration |
| Other bias | Low risk | Study appears to be free of other sources of bias |
| Methods | Single‐centre study from the USA. Randomised controlled trial comparing strategy of 3 days' ciprofloxacin monotherapy versus standard therapy (duration and antibiotic choice at the discretion of physician) for patients with pulmonary infiltrates but low‐probability pneumonia. | |
| Participants | Study entry criteria: new‐onset pulmonary infiltrate associated with possible nosocomial pneumonia. Modified Clinical Pulmonary Infection Score (CPIS) < 7 on day 1 (suggesting low probability pneumonia) 81 adult medical and surgical ICU patients; 47 (58%) receiving mechanical ventilation; mean age 66.7 years; no data on sex. APACHE III score 41.8; mean CPIS 4.9. Prior mean duration of ICU stay 8.8 days and duration of mechanical ventilation 7.6 days. Chronic obstructive airways disease present in 27% cases. 5% patients were transplant recipients. With the exception of abnormal respiration (92% experimental group versus 71% standard‐therapy group, P value = 0.016), there were no significant differences in baseline characteristics between the 2 groups, though mean duration of mechanical ventilation prior to enrolment was 10 days in the short‐course group and 5 days in the standard‐therapy group. Exclusions: HIV, chemotherapy‐induced neutropenia, concurrent antibiotic administration (other than surgical prophylaxis), flouroquinolone allergy | |
| Interventions | Randomised at day 1 of episode of possible pneumonia. Intervention group (N = 39): 3 days' ciprofloxacin monotherapy. At day 3 if CPIS < 7, antibiotics would be discontinued; if CPIS > 6, therapy would be continued, with choice of agent and duration of therapy at the discretion of treating physician, and incorporating microbiology results Standard therapy (N = 42): choice and duration of antibiotic therapy at choice of treating physician | |
| Outcomes | The following outcomes were reported:
Power calculation was conducted according to "worse outcome" and development of antimicrobial resistance | |
| Notes | Pathogens associated with possible HAP were incompletely presented Outcome data for patients who were and were not mechanically ventilated are not reported separately For patients allocated to the short‐course therapy, 0 patients with CPIS < 7 at day 3 had antibiotics continued beyond 72 hours A significant decrease in duration of therapy in the "standard therapy" group was observed with time (P value = 0.0001), thought to be a result of the unblinded nature of the study. The study was terminated by institutional review board as it was deemed "unethical to continue study" | |
| Risk of bias | ||
| Bias | Authors' judgement | Support for judgement |
| Random sequence generation (selection bias) | Unclear risk | Randomisation process not described |
| Allocation concealment (selection bias) | Unclear risk | Randomisation/concealment not described |
| Blinding of participants and personnel (performance bias) | High risk | Non‐blinded study |
| Blinding of outcome assessment (detection bias) | High risk | Non‐blinded study |
| Incomplete outcome data (attrition bias) | Low risk | No missing outcome data |
| Selective reporting (reporting bias) | High risk | Microbiological data are partially reported. The components of the composite measure of "emergence of antimicrobial resistance or superinfection" are not reported |
| Other bias | High risk | Stopped early by institutional review board. Results for patients managed in "experimental" group appear to have influenced management of patients subsequently allocated to "standard therapy group" |
APACHE II score: Acute Physiology and Chronic Health Evaluation II score
ARDS: acute respiratory distress syndrome
BAL: broncho‐alveolar lavage
cfu/ml: colony‐forming units per millilitre
COPD: chronic obstructive pulmonary disease
CPIS: clinical pulmonary infection score
DNR order: do not resuscitate order
EOT: end‐of‐treatment
ETA: endo‐tracheal aspirate
FiO2: fraction of inspired oxygen (in a gas mixture)
HAP: hospital‐acquired pneumonia
ICU: intensive care unit
ITT: intention‐to‐treat
ITU: intensive therapy unit
MITT: microbiological intention‐to‐treat
MODS: multiple organ dysfunction score
MRSA: methicillin‐resistant Staphylococcus aureus
NF‐GNB: non‐fermenting Gram‐negative bacilli
ODIN: organ dysfunction and/or infection score
PaO2: partial pressure of oxygen
PSB: protected specimen brush
RCT: randomised controlled trial
SAPS II: Simplified Acute Physiology Score II
SD: standard deviation
SOFA score: Sequential Organ Failure Assessment score
VAP: ventilator‐associated pneumonia
Characteristics of excluded studies [ordered by study ID]
| Study | Reason for exclusion |
| The PRORATA randomised controlled study investigating the utility of a procalcitonin‐guided (PCT‐guided) algorithm for antibiotic administration for intensive care patients (34% with hospital‐acquired pneumonia, of whom approximately 2/3 were mechanically ventilated). Mean duration of antibiotic therapy was significantly lower in the PCT group among patients with VAP. However, the study was excluded because interventions did not include a fixed duration of therapy | |
| A randomised controlled study investigating diagnostic strategies (quantitative versus qualitative culture of respiratory tract specimens) on outcome from VAP | |
| This 2‐by‐2 factorial randomised controlled study aiming to compare: i. invasive and non‐invasive diagnostic strategies for diagnosis of VAP, and ii. initial empiric treatment with meropenem or meropenem plus ciprofloxacin for suspected VAP. There was no significant difference in number of antibiotic‐free days between groups of patients allocated to invasive or non‐invasive strategies | |
| Data subsequently published in full (Chastre 2003a) | |
| This was a randomised study designed to compare strategies for diagnosis and selection of initial antimicrobial therapy of VAP, not duration of therapy. For groups of patients randomised to both invasive and non‐invasive diagnostic strategies, recommended duration of therapy in the presence of positive respiratory culture (i.e. confirmed pneumonia) was 14 days | |
| This was a randomised controlled study comparing a strategy using serial PCT measurement to guide discontinuation of antibiotic therapy for treatment of sepsis in 110 surgical intensive care patients with standard therapy. Of these patients, 43 had "pneumonia"; it is unclear what proportion had nosocomial or community‐acquired pneumonia, and what proportion of patients was receiving mechanical ventilation at time of diagnosis. Duration of antibiotic therapy was significantly shorter in the intervention (PCT‐guided) group; however, the study was excluded because interventions did not include a fixed duration of therapy | |
| Non‐randomised before‐and‐after study investigating a clinical guideline regarding initial treatment and subsequent discontinuation of antibiotic therapy | |
| Data subsequently published in full (Kim 2012) | |
| This was a single‐centre RCT investigating effectiveness of an antibiotic de‐escalation protocol for intensive care patients with HAP. 109 medical ICU patients aged 18 years and over with HAP (defined according to ACCP clinical and radiographic criteria) were randomised to the de‐escalation (DE) protocol (N = 54) or non de‐escalation (NDE) protocol (N = 55). There was no significant difference in duration of antibiotic therapy between intervention groups, and the study was excluded on the basis that fixed courses of therapy were not used | |
| Prospective observational study investigating application of previously described clinical guideline (Ibrahim 2001) for patients with suspected VAP, but negative quantitative BAL results | |
| This randomised controlled study attempted to evaluate the feasibility (and outcomes) with a treatment goal of 5 or 7 days for pneumonia in intensive care. It was excluded on consideration of a conference proceedings abstract because fixed courses of therapy appear not to have been utilised and duration of therapy was not significantly different between groups | |
| This multi‐centre randomised controlled study enrolled 65 patients in a study intended to evaluate a strategy of early discontinuation of empirical antibiotic therapy: it has been published in abstract form only. 31 patients were allocated to early (< 8 days) discontinuation of empirical therapy versus 34 patients to late discontinuation (> 9 days). Patient characteristics and diagnostic criteria were not described. Outcome data presented in the abstract were inadequate for the study's inclusion in this review, and contact with a trial author did not yield any further information. Furthermore, a highly significant risk of bias was identified: antibiotic discontinuation at day 8 was higher (70.6%) among patients allocated to late discontinuation than among patients allocated to early discontinuation (67.7%) | |
| This RCT sought to evaluate the effectiveness of an antibiotic discontinuation policy for suspected VAP. Mean duration of antibiotic therapy was lower in the intervention group (6 days) compared with the standard therapy group (8 days). However, the study was excluded because interventions did not include a fixed duration of therapy | |
| This was a randomised controlled study comparing a strategy using serial measurements of procalcitonin (PCT) to guide cessation of antibiotic therapy with standard therapy in critically ill patients with sepsis or septic shock. 79 patients were randomised, of whom a total of 47 patients had sepsis of pulmonary origin. A high proportion of patients (68%) had community‐acquired sepsis. A significant proportion of patients in the PCT group (19%) had the protocol overridden to receive a longer course of antibiotics than advised by the algorithm. On intention‐to‐treat analysis, the difference in antibiotic days between control and intervention groups for all patients was not significant. The study was excluded because interventions did not include a fixed duration of therapy | |
| This was a randomised study comparing diagnostic strategies for suspected VAP. It was not designed to investigate duration of therapy; there were no protocols to guide duration of antibiotic therapy | |
| This RCT compared use of a PCT‐guided algorithm with standard therapy in antibiotic treatment of VAP; the study was excluded because interventions did not include a fixed duration of therapy | |
| This was an observational rather than a randomised controlled study. It investigated outcomes following introduction of a "De‐escalation" strategy which incorporated the initial administration of broad spectrum antibiotics and subsequent simplification of antibiotic treatment with culture results: 1. changing to monotherapy in absence ofPseudomonas sp; 2. shortening therapy to < 5 days if culture negative and > 48 hours of defervescence; 3. changing from a broad to narrow spectrum agent on basis of culture results | |
| A randomised clinical trial comparing the effects of an invasive quantitative diagnostic strategy versus a non‐invasive strategy on management of and outcome from suspected VAP | |
| This was a RCT comparing a procalcitonin‐guided antibiotic discontinuation strategy with standard treatment for surgical intensive care patients with severe sepsis. The study was excluded because interventions did not include a fixed duration of therapy | |
| Data subsequently published in full (Singh 2000) | |
| A RCT to evaluate invasive versus non‐invasive diagnostic methods on outcome from VAP | |
| The ProVAP study was a randomised controlled trial comparing a PCT‐guided algorithm with standard therapy for ICU patients with VAP. Duration of antibiotic therapy was lower in the PCT‐guided group (median 15 days versus 10 days in standard therapy group). The study was excluded because interventions did not include a fixed duration of therapy | |
| Data subsequently published in full (Stolz 2009a) | |
| RCT evaluating PCT‐guided strategies in the management of septic illness after multiple trauma or major surgery. The study was excluded because interventions did not include a fixed duration of therapy | |
| Data subsequently published in full (Chastre 2003a) |
BAL: broncho‐alveolar lavage
CPIS: clinical pulmonary infection score
HAP: hospital‐acquired pneumonia
ICU: intensive care unit
ITU: intensive therapy unit
PCT: procalcitonin
RCT: randomised controlled trial
VAP: ventilator‐associated pneumonia
Characteristics of ongoing studies [ordered by study ID]
| Trial name or title | 'Effectiveness of short‐course versus standard antibiotic therapy in ICU patients' |
| Methods | Randomised controlled trial |
| Participants | ICU patients (not necessarily mechanically ventilated) aged 18 years and older with pulmonary infiltrates on chest radiography, but low probability of pneumonia according to CPIS of 6 or less |
| Interventions | 3‐day course of meropenem versus standard course (8 days or more) of antibiotic therapy |
| Outcomes | Identification of resistant organisms in respiratory specimen; duration of antibiotic therapy; duration of ICU and hospital length of stay |
| Starting date | August 2006 |
| Contact information | Not available |
| Notes | https://clinicaltrials.gov/ct2/show/study/NCT00410527 |
| Trial name or title | 'Five versus seven day antibiotic course for the treatment of pneumonia in the Intensive Care Unit' |
| Methods | Randomised controlled trial |
| Participants | Medical and surgical patients aged 18 years and over with pneumonia |
| Interventions | 5 days of antibiotic therapy versus 7 days of antibiotic therapy |
| Outcomes | Length of antibiotic therapy, 28‐day mortality, 28‐day hospital length of stay, 28‐day development of C. difficile‐related diarrhoea, identification of MDR bacteria from lower respiratory tract specimen |
| Starting date | January 2011 |
| Contact information | Not available |
| Notes | https://clinicaltrials.gov/ct2/show/study/NCT01554657 |
| Trial name or title | 'Duration of antibiotic treatment for early VAP (Date) trial' |
| Methods | Randomised controlled trial |
| Participants | Surgical patients aged 18 years and older with VAP, defined according to CPIS and BAL threshold culture |
| Interventions | 4 days of antibiotic therapy versus 8 days of antibiotic therapy |
| Outcomes | Clinical outcomes (CPIS); microbiological outcome (BAL culture); biomarker response (procalcitonin) |
| Starting date | December 2013 |
| Contact information | Maria Rodil, Denver Medical Health Centre, Denver, Colorado, United States 80204 |
| Notes | https://clinicaltrials.gov/ct2/show/NCT01994980 |
BAL: broncho‐alveolar lavage
CPIS: Clinical Pulmonary Infection Score
CRP: C‐reactive protein
ICU: intensive care unit
MDR: multi‐drug resistant pathogen
PCT: procalcitonin
SIRS: systemic inflammatory response syndrome
VAP: ventilator‐associated pneumonia
Data and analyses
| Outcome or subgroup title | No. of studies | No. of participants | Statistical method | Effect size |
| 1 28‐day mortality Show forest plot | 3 | 598 | Odds Ratio (M‐H, Random, 95% CI) | 1.18 [0.77, 1.80] |
| Analysis 1.1  Comparison 1 Short (fixed)‐course antibiotic therapy versus prolonged‐course antibiotic therapy for HAP, Outcome 1 28‐day mortality. | ||||
| 1.1 NF‐GNB | 2 | 179 | Odds Ratio (M‐H, Random, 95% CI) | 0.95 [0.39, 2.27] |
| 1.2 MRSA | 1 | 42 | Odds Ratio (M‐H, Random, 95% CI) | 1.28 [0.32, 5.09] |
| 1.3 Non NF‐GNB/MRSA | 1 | 232 | Odds Ratio (M‐H, Random, 95% CI) | 1.65 [0.73, 3.73] |
| 1.4 Unspecified organism | 2 | 145 | Odds Ratio (M‐H, Random, 95% CI) | 1.22 [0.53, 2.78] |
| 2 Recurrence of pneumonia Show forest plot | 4 | 733 | Odds Ratio (M‐H, Random, 95% CI) | 1.41 [0.94, 2.12] |
| Analysis 1.2  Comparison 1 Short (fixed)‐course antibiotic therapy versus prolonged‐course antibiotic therapy for HAP, Outcome 2 Recurrence of pneumonia. | ||||
| 2.1 NF‐GNB | 2 | 176 | Odds Ratio (M‐H, Random, 95% CI) | 2.18 [1.14, 4.16] |
| 2.2 MRSA | 2 | 49 | Odds Ratio (M‐H, Random, 95% CI) | 1.56 [0.12, 19.61] |
| 2.3 Non NF‐GNB/MRSA | 3 | 478 | Odds Ratio (M‐H, Random, 95% CI) | 1.17 [0.64, 2.14] |
| 2.4 Unspecified organism | 1 | 30 | Odds Ratio (M‐H, Random, 95% CI) | 1.17 [0.14, 9.59] |
| 3 28‐day antibiotic‐free days Show forest plot | 2 | 431 | Mean Difference (IV, Random, 95% CI) | 4.02 [2.26, 5.78] |
| Analysis 1.3  Comparison 1 Short (fixed)‐course antibiotic therapy versus prolonged‐course antibiotic therapy for HAP, Outcome 3 28‐day antibiotic‐free days. | ||||
| 3.1 NF‐GNB | 1 | 127 | Mean Difference (IV, Random, 95% CI) | 4.5 [2.25, 6.75] |
| 3.2 MRSA | 1 | 42 | Mean Difference (IV, Random, 95% CI) | 8.0 [4.14, 11.86] |
| 3.3 Non NF‐GNB/ MRSA | 1 | 232 | Mean Difference (IV, Random, 95% CI) | 3.70 [2.09, 5.31] |
| 3.4 Unspecified organism | 1 | 30 | Mean Difference (IV, Random, 95% CI) | 2.3 [1.03, 3.57] |
| 4 ITU mortality Show forest plot | 2 | 107 | Odds Ratio (M‐H, Random, 95% CI) | 0.85 [0.37, 1.91] |
| Analysis 1.4  Comparison 1 Short (fixed)‐course antibiotic therapy versus prolonged‐course antibiotic therapy for HAP, Outcome 4 ITU mortality. | ||||
| 5 In‐hospital mortality Show forest plot | 1 | 401 | Odds Ratio (M‐H, Random, 95% CI) | 1.09 [0.71, 1.68] |
| Analysis 1.5  Comparison 1 Short (fixed)‐course antibiotic therapy versus prolonged‐course antibiotic therapy for HAP, Outcome 5 In‐hospital mortality. | ||||
| 5.1 NF‐GNB | 1 | 127 | Odds Ratio (M‐H, Random, 95% CI) | 0.75 [0.36, 1.53] |
| 5.2 MRSA | 1 | 42 | Odds Ratio (M‐H, Random, 95% CI) | 1.47 [0.43, 4.95] |
| 5.3 Non NF‐GNB/MRSA | 1 | 232 | Odds Ratio (M‐H, Random, 95% CI) | 1.32 [0.72, 2.42] |
| 6 21‐day mortality Show forest plot | 1 | 225 | Odds Ratio (M‐H, Random, 95% CI) | 1.05 [0.41, 2.69] |
| Analysis 1.6  Comparison 1 Short (fixed)‐course antibiotic therapy versus prolonged‐course antibiotic therapy for HAP, Outcome 6 21‐day mortality. | ||||
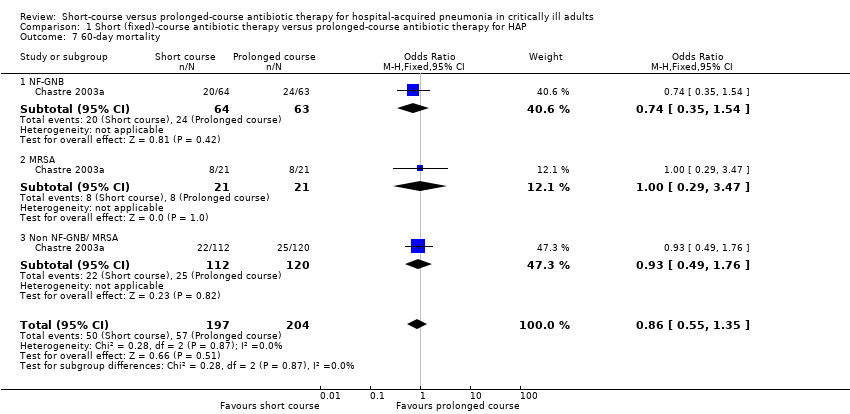
| 7 60‐day mortality Show forest plot | 1 | 401 | Odds Ratio (M‐H, Fixed, 95% CI) | 0.86 [0.55, 1.35] |
| Analysis 1.7  Comparison 1 Short (fixed)‐course antibiotic therapy versus prolonged‐course antibiotic therapy for HAP, Outcome 7 60‐day mortality. | ||||
| 7.1 NF‐GNB | 1 | 127 | Odds Ratio (M‐H, Fixed, 95% CI) | 0.74 [0.35, 1.54] |
| 7.2 MRSA | 1 | 42 | Odds Ratio (M‐H, Fixed, 95% CI) | 1.0 [0.29, 3.47] |
| 7.3 Non NF‐GNB/ MRSA | 1 | 232 | Odds Ratio (M‐H, Fixed, 95% CI) | 0.93 [0.49, 1.76] |
| 8 90‐day mortality Show forest plot | 1 | 198 | Odds Ratio (M‐H, Random, 95% CI) | 0.99 [0.49, 1.99] |
| Analysis 1.8  Comparison 1 Short (fixed)‐course antibiotic therapy versus prolonged‐course antibiotic therapy for HAP, Outcome 8 90‐day mortality. | ||||
| 9 Clinical resolution Show forest plot | 3 | 472 | Odds Ratio (M‐H, Random, 95% CI) | 0.75 [0.49, 1.15] |
| Analysis 1.9  Comparison 1 Short (fixed)‐course antibiotic therapy versus prolonged‐course antibiotic therapy for HAP, Outcome 9 Clinical resolution. | ||||
| 9.1 NF‐GNB | 1 | 55 | Odds Ratio (M‐H, Random, 95% CI) | 0.48 [0.16, 1.48] |
| 9.2 Unspecified organism | 3 | 417 | Odds Ratio (M‐H, Random, 95% CI) | 0.81 [0.51, 1.28] |
| 10 Relapse of pneumonia Show forest plot | 2 | 626 | Odds Ratio (M‐H, Random, 95% CI) | 1.70 [0.97, 2.97] |
| Analysis 1.10  Comparison 1 Short (fixed)‐course antibiotic therapy versus prolonged‐course antibiotic therapy for HAP, Outcome 10 Relapse of pneumonia. | ||||
| 10.1 NF‐GNB | 1 | 127 | Odds Ratio (M‐H, Random, 95% CI) | 2.08 [0.92, 4.70] |
| 10.2 MRSA | 1 | 42 | Odds Ratio (M‐H, Random, 95% CI) | 0.71 [0.14, 3.64] |
| 10.3 Non NF‐GNB/MRSA | 1 | 232 | Odds Ratio (M‐H, Random, 95% CI) | 1.41 [0.51, 3.92] |
| 10.4 Unspecified organism | 1 | 225 | Odds Ratio (M‐H, Random, 95% CI) | 2.92 [0.58, 14.78] |
| 11 Subsequent infection due to resistant organism Show forest plot | 1 | 110 | Odds Ratio (M‐H, Fixed, 95% CI) | 0.44 [0.21, 0.95] |
| Analysis 1.11  Comparison 1 Short (fixed)‐course antibiotic therapy versus prolonged‐course antibiotic therapy for HAP, Outcome 11 Subsequent infection due to resistant organism. | ||||
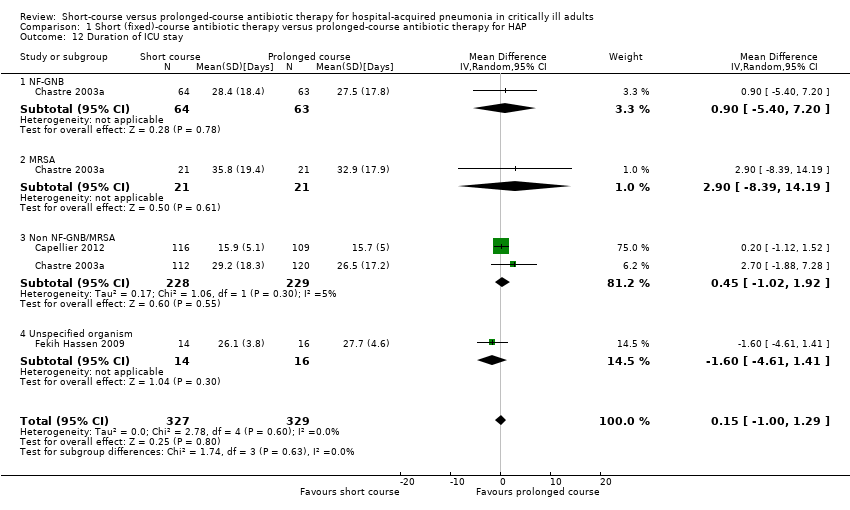
| 12 Duration of ICU stay Show forest plot | 3 | 656 | Mean Difference (IV, Random, 95% CI) | 0.15 [1.00, 1.29] |
| Analysis 1.12  Comparison 1 Short (fixed)‐course antibiotic therapy versus prolonged‐course antibiotic therapy for HAP, Outcome 12 Duration of ICU stay. | ||||
| 12.1 NF‐GNB | 1 | 127 | Mean Difference (IV, Random, 95% CI) | 0.90 [‐5.40, 7.20] |
| 12.2 MRSA | 1 | 42 | Mean Difference (IV, Random, 95% CI) | 2.90 [‐8.39, 14.19] |
| 12.3 Non NF‐GNB/MRSA | 2 | 457 | Mean Difference (IV, Random, 95% CI) | 0.45 [‐1.02, 1.92] |
| 12.4 Unspecified organism | 1 | 30 | Mean Difference (IV, Random, 95% CI) | ‐1.60 [‐4.61, 1.41] |
| 13 Duration of hospital stay Show forest plot | 1 | 30 | Mean Difference (IV, Fixed, 95% CI) | ‐1.0 [‐4.11, 2.11] |
| Analysis 1.13  Comparison 1 Short (fixed)‐course antibiotic therapy versus prolonged‐course antibiotic therapy for HAP, Outcome 13 Duration of hospital stay. | ||||
| 14 Duration of mechanical ventilation Show forest plot | 3 | 332 | Mean Difference (IV, Random, 95% CI) | 0.02 [‐0.51, 0.54] |
| Analysis 1.14  Comparison 1 Short (fixed)‐course antibiotic therapy versus prolonged‐course antibiotic therapy for HAP, Outcome 14 Duration of mechanical ventilation. | ||||
| Outcome or subgroup title | No. of studies | No. of participants | Statistical method | Effect size |
| 1 30‐day mortality Show forest plot | 1 | 81 | Odds Ratio (M‐H, Fixed, 95% CI) | 0.33 [0.10, 1.03] |
| Analysis 2.1  Comparison 2 Discontinuation of antibiotics according to Clinical Pulmonary Infection Score, Outcome 1 30‐day mortality. | ||||
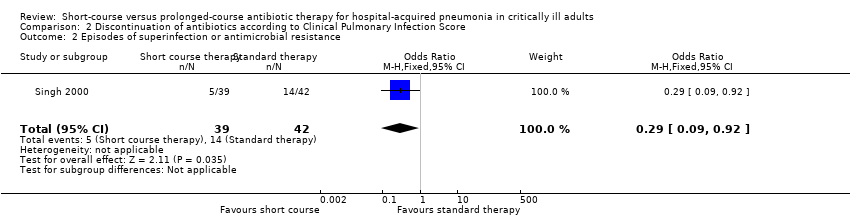
| 2 Episodes of superinfection or antimicrobial resistance Show forest plot | 1 | 81 | Odds Ratio (M‐H, Fixed, 95% CI) | 0.29 [0.09, 0.92] |
| Analysis 2.2  Comparison 2 Discontinuation of antibiotics according to Clinical Pulmonary Infection Score, Outcome 2 Episodes of superinfection or antimicrobial resistance. | ||||

'Risk of bias' graph: review authors' judgements about each risk of bias item presented as percentages across all included studies.

'Risk of bias' summary: review authors' judgements about each risk of bias item for each included study.
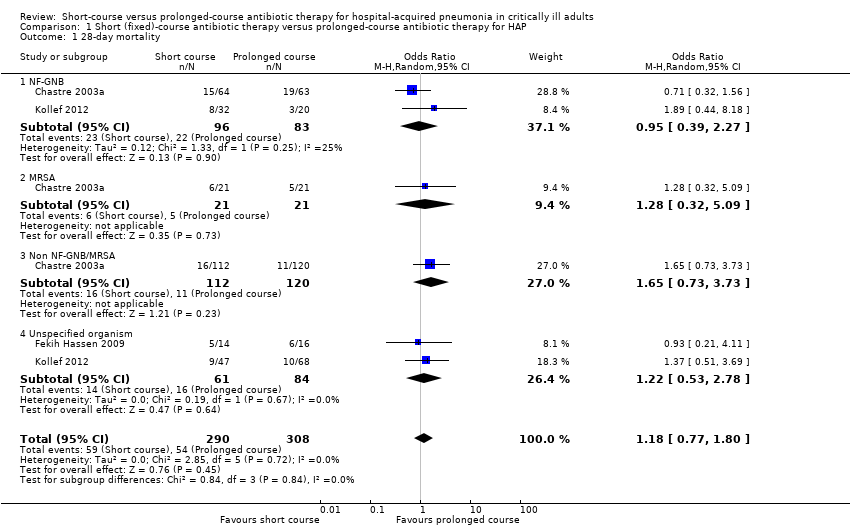
Comparison 1 Short (fixed)‐course antibiotic therapy versus prolonged‐course antibiotic therapy for HAP, Outcome 1 28‐day mortality.
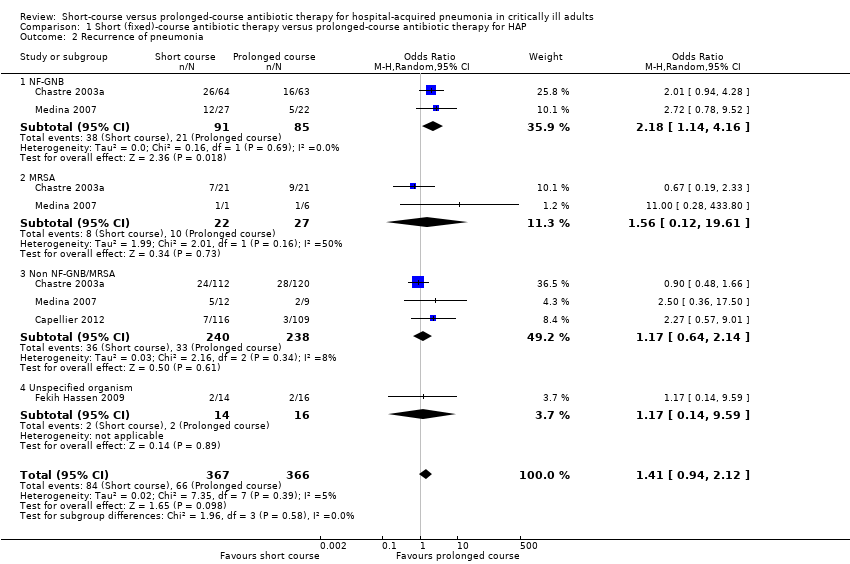
Comparison 1 Short (fixed)‐course antibiotic therapy versus prolonged‐course antibiotic therapy for HAP, Outcome 2 Recurrence of pneumonia.

Comparison 1 Short (fixed)‐course antibiotic therapy versus prolonged‐course antibiotic therapy for HAP, Outcome 3 28‐day antibiotic‐free days.
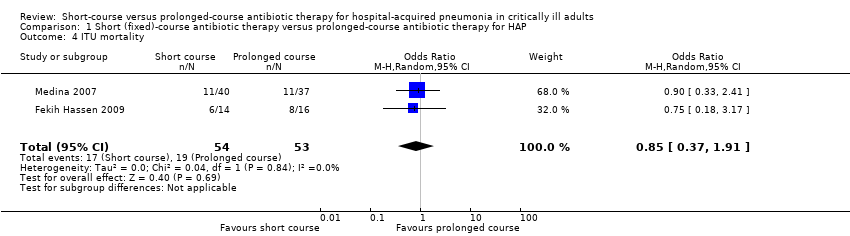
Comparison 1 Short (fixed)‐course antibiotic therapy versus prolonged‐course antibiotic therapy for HAP, Outcome 4 ITU mortality.
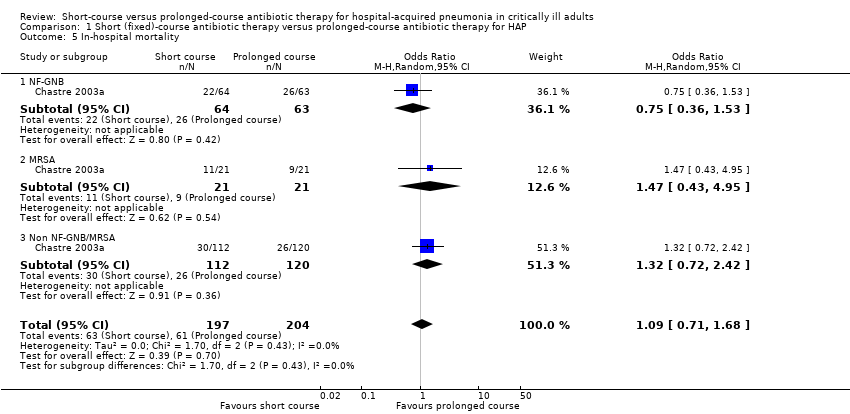
Comparison 1 Short (fixed)‐course antibiotic therapy versus prolonged‐course antibiotic therapy for HAP, Outcome 5 In‐hospital mortality.

Comparison 1 Short (fixed)‐course antibiotic therapy versus prolonged‐course antibiotic therapy for HAP, Outcome 6 21‐day mortality.
Comparison 1 Short (fixed)‐course antibiotic therapy versus prolonged‐course antibiotic therapy for HAP, Outcome 7 60‐day mortality.

Comparison 1 Short (fixed)‐course antibiotic therapy versus prolonged‐course antibiotic therapy for HAP, Outcome 8 90‐day mortality.

Comparison 1 Short (fixed)‐course antibiotic therapy versus prolonged‐course antibiotic therapy for HAP, Outcome 9 Clinical resolution.

Comparison 1 Short (fixed)‐course antibiotic therapy versus prolonged‐course antibiotic therapy for HAP, Outcome 10 Relapse of pneumonia.

Comparison 1 Short (fixed)‐course antibiotic therapy versus prolonged‐course antibiotic therapy for HAP, Outcome 11 Subsequent infection due to resistant organism.
Comparison 1 Short (fixed)‐course antibiotic therapy versus prolonged‐course antibiotic therapy for HAP, Outcome 12 Duration of ICU stay.

Comparison 1 Short (fixed)‐course antibiotic therapy versus prolonged‐course antibiotic therapy for HAP, Outcome 13 Duration of hospital stay.

Comparison 1 Short (fixed)‐course antibiotic therapy versus prolonged‐course antibiotic therapy for HAP, Outcome 14 Duration of mechanical ventilation.

Comparison 2 Discontinuation of antibiotics according to Clinical Pulmonary Infection Score, Outcome 1 30‐day mortality.
Comparison 2 Discontinuation of antibiotics according to Clinical Pulmonary Infection Score, Outcome 2 Episodes of superinfection or antimicrobial resistance.
| Should short‐course antibiotic therapy versus prolonged‐course antibiotic therapy be used in critically ill patients with hospital‐acquired pneumonia? | ||||||
| Patient or population: hospital‐acquired pneumonia | ||||||
| Outcomes | Illustrative comparative risks* (95% CI) | Relative effect | No. of participants | Quality of the evidence | Comments | |
| Assumed risk | Corresponding risk | |||||
| Prolonged‐course antibiotic therapy | Short‐course antibiotic therapy | |||||
| Mortality | 175 per 1000 | 201 per 1000 | OR 1.18 | 598 | ⊕⊕⊕⊝ | — |
| Mortality NF‐GNB | 265 per 1000 | 255 per 1000 | OR 0.95 | 179 | ⊕⊕⊝⊝ | — |
| Mortality MRSA | 238 per 1000 | 286 per 1000 | OR 1.28 | 42 | ⊕⊕⊕⊝ | — |
| Recurrence of pneumonia | 180 per 1000 | 237 per 1000 | OR 1.41 | 733 | ⊕⊕⊝⊝ | — |
| Recurrence of pneumonia NF‐GNB | 247 per 1000 | 417 per 1000 | OR 2.18 | 176 | ⊕⊕⊕⊝ | — |
| Recurrence of pneumonia MRSA | 370 per 1000 | 479 per 1000 | OR 1.56 | 49 | ⊕⊕⊕⊝ | — |
| 28‐day antibiotic‐free days | The mean 28‐day antibiotic free days in the intervention groups was | 431 | ⊕⊕⊝⊝ | — | ||
| *The basis for the assumed risk (e.g. the median control group risk across studies) is provided in footnotes. The corresponding risk (and its 95% confidence interval) is based on the assumed risk in the comparison group and the relative effect of the intervention (and its 95% CI). | ||||||
| GRADE Working Group grades of evidence | ||||||
| 1Low total number of events. | ||||||
| Outcome or subgroup title | No. of studies | No. of participants | Statistical method | Effect size |
| 1 28‐day mortality Show forest plot | 3 | 598 | Odds Ratio (M‐H, Random, 95% CI) | 1.18 [0.77, 1.80] |
| 1.1 NF‐GNB | 2 | 179 | Odds Ratio (M‐H, Random, 95% CI) | 0.95 [0.39, 2.27] |
| 1.2 MRSA | 1 | 42 | Odds Ratio (M‐H, Random, 95% CI) | 1.28 [0.32, 5.09] |
| 1.3 Non NF‐GNB/MRSA | 1 | 232 | Odds Ratio (M‐H, Random, 95% CI) | 1.65 [0.73, 3.73] |
| 1.4 Unspecified organism | 2 | 145 | Odds Ratio (M‐H, Random, 95% CI) | 1.22 [0.53, 2.78] |
| 2 Recurrence of pneumonia Show forest plot | 4 | 733 | Odds Ratio (M‐H, Random, 95% CI) | 1.41 [0.94, 2.12] |
| 2.1 NF‐GNB | 2 | 176 | Odds Ratio (M‐H, Random, 95% CI) | 2.18 [1.14, 4.16] |
| 2.2 MRSA | 2 | 49 | Odds Ratio (M‐H, Random, 95% CI) | 1.56 [0.12, 19.61] |
| 2.3 Non NF‐GNB/MRSA | 3 | 478 | Odds Ratio (M‐H, Random, 95% CI) | 1.17 [0.64, 2.14] |
| 2.4 Unspecified organism | 1 | 30 | Odds Ratio (M‐H, Random, 95% CI) | 1.17 [0.14, 9.59] |
| 3 28‐day antibiotic‐free days Show forest plot | 2 | 431 | Mean Difference (IV, Random, 95% CI) | 4.02 [2.26, 5.78] |
| 3.1 NF‐GNB | 1 | 127 | Mean Difference (IV, Random, 95% CI) | 4.5 [2.25, 6.75] |
| 3.2 MRSA | 1 | 42 | Mean Difference (IV, Random, 95% CI) | 8.0 [4.14, 11.86] |
| 3.3 Non NF‐GNB/ MRSA | 1 | 232 | Mean Difference (IV, Random, 95% CI) | 3.70 [2.09, 5.31] |
| 3.4 Unspecified organism | 1 | 30 | Mean Difference (IV, Random, 95% CI) | 2.3 [1.03, 3.57] |
| 4 ITU mortality Show forest plot | 2 | 107 | Odds Ratio (M‐H, Random, 95% CI) | 0.85 [0.37, 1.91] |
| 5 In‐hospital mortality Show forest plot | 1 | 401 | Odds Ratio (M‐H, Random, 95% CI) | 1.09 [0.71, 1.68] |
| 5.1 NF‐GNB | 1 | 127 | Odds Ratio (M‐H, Random, 95% CI) | 0.75 [0.36, 1.53] |
| 5.2 MRSA | 1 | 42 | Odds Ratio (M‐H, Random, 95% CI) | 1.47 [0.43, 4.95] |
| 5.3 Non NF‐GNB/MRSA | 1 | 232 | Odds Ratio (M‐H, Random, 95% CI) | 1.32 [0.72, 2.42] |
| 6 21‐day mortality Show forest plot | 1 | 225 | Odds Ratio (M‐H, Random, 95% CI) | 1.05 [0.41, 2.69] |
| 7 60‐day mortality Show forest plot | 1 | 401 | Odds Ratio (M‐H, Fixed, 95% CI) | 0.86 [0.55, 1.35] |
| 7.1 NF‐GNB | 1 | 127 | Odds Ratio (M‐H, Fixed, 95% CI) | 0.74 [0.35, 1.54] |
| 7.2 MRSA | 1 | 42 | Odds Ratio (M‐H, Fixed, 95% CI) | 1.0 [0.29, 3.47] |
| 7.3 Non NF‐GNB/ MRSA | 1 | 232 | Odds Ratio (M‐H, Fixed, 95% CI) | 0.93 [0.49, 1.76] |
| 8 90‐day mortality Show forest plot | 1 | 198 | Odds Ratio (M‐H, Random, 95% CI) | 0.99 [0.49, 1.99] |
| 9 Clinical resolution Show forest plot | 3 | 472 | Odds Ratio (M‐H, Random, 95% CI) | 0.75 [0.49, 1.15] |
| 9.1 NF‐GNB | 1 | 55 | Odds Ratio (M‐H, Random, 95% CI) | 0.48 [0.16, 1.48] |
| 9.2 Unspecified organism | 3 | 417 | Odds Ratio (M‐H, Random, 95% CI) | 0.81 [0.51, 1.28] |
| 10 Relapse of pneumonia Show forest plot | 2 | 626 | Odds Ratio (M‐H, Random, 95% CI) | 1.70 [0.97, 2.97] |
| 10.1 NF‐GNB | 1 | 127 | Odds Ratio (M‐H, Random, 95% CI) | 2.08 [0.92, 4.70] |
| 10.2 MRSA | 1 | 42 | Odds Ratio (M‐H, Random, 95% CI) | 0.71 [0.14, 3.64] |
| 10.3 Non NF‐GNB/MRSA | 1 | 232 | Odds Ratio (M‐H, Random, 95% CI) | 1.41 [0.51, 3.92] |
| 10.4 Unspecified organism | 1 | 225 | Odds Ratio (M‐H, Random, 95% CI) | 2.92 [0.58, 14.78] |
| 11 Subsequent infection due to resistant organism Show forest plot | 1 | 110 | Odds Ratio (M‐H, Fixed, 95% CI) | 0.44 [0.21, 0.95] |
| 12 Duration of ICU stay Show forest plot | 3 | 656 | Mean Difference (IV, Random, 95% CI) | 0.15 [1.00, 1.29] |
| 12.1 NF‐GNB | 1 | 127 | Mean Difference (IV, Random, 95% CI) | 0.90 [‐5.40, 7.20] |
| 12.2 MRSA | 1 | 42 | Mean Difference (IV, Random, 95% CI) | 2.90 [‐8.39, 14.19] |
| 12.3 Non NF‐GNB/MRSA | 2 | 457 | Mean Difference (IV, Random, 95% CI) | 0.45 [‐1.02, 1.92] |
| 12.4 Unspecified organism | 1 | 30 | Mean Difference (IV, Random, 95% CI) | ‐1.60 [‐4.61, 1.41] |
| 13 Duration of hospital stay Show forest plot | 1 | 30 | Mean Difference (IV, Fixed, 95% CI) | ‐1.0 [‐4.11, 2.11] |
| 14 Duration of mechanical ventilation Show forest plot | 3 | 332 | Mean Difference (IV, Random, 95% CI) | 0.02 [‐0.51, 0.54] |
| Outcome or subgroup title | No. of studies | No. of participants | Statistical method | Effect size |
| 1 30‐day mortality Show forest plot | 1 | 81 | Odds Ratio (M‐H, Fixed, 95% CI) | 0.33 [0.10, 1.03] |
| 2 Episodes of superinfection or antimicrobial resistance Show forest plot | 1 | 81 | Odds Ratio (M‐H, Fixed, 95% CI) | 0.29 [0.09, 0.92] |