Intervenções para aumentar o retorno ao trabalho dos pacientes oncológicos
Appendices
Appendix 1. MEDLINE search strategy
1. neoplasms (MeSH Terms)
2. cancer* (Text Word)
3. neoplasm* (Text Word)
4.carcinoma* (Text Word)
5. oncolog* (Text Word)
6. malignan* (Text Word)
7. tumor (Text Word)
8. tumour (Text Word)
9. tumors (Text Word)
10. tumours (Text Word)
11. leukemia* (Text Word)
12. sarcoma* (Text Word)
13. lymphoma* (Text Word)
14. melanoma* (Text Word)
15. blastoma* (Text Word)
16. radiotherapy (Text Word)
17. chemotherapy (Text Word)
18. 1 or 2 or 3 or 4 or 5 or 6 or 7 or 8 or 9 or 10 or 11 or 12 or 13 or 14 or 15 or 16 or 17
19. “return‐to‐work” (Text word)
20. employment (MeSH Terms)
21. employment (Text Word)
22. unemployment (MeSH Terms)
23. unemployment (Text Word)
24. unemployed (Text Word)
25. retirement (Text Word)
26. “sick leave” (MeSH Terms)
27. sick leave (Text Word)
28. Sickness absence (Text Word)
29. absenteeism (MeSH Terms)
30. absenteeism (Text word)
31. “work” (MeSH Terms)
32. occupations (MeSH Terms)
33. “occupational medicine” (MeSH Terms)
34. “occupational health” (MeSH Terms)
35. “occupational health services” (MeSH Terms)
36. “disability management” (Text word)
37. “rehabilitation, vocational” (MeSH Terms)
38. occupation* (Text Word)
39. rehabilitation (MeSH Terms:NoExp)
40. “neoplasms/rehabilitation” (MeSH Terms)
41. vocational* (Text Word)
42. “work ability” (Text Word)
43. “work capacity” (Text Word)
44. “work activity” (Text Word)
45. “work disability” (Text Word)
46. “work rehabilitation” (Text Word)
47. “work status” (Text Word)
48. “work retention” (Text Word)
49. workability (Text Word)
50. employability (Text Word)
51. employable (Text Word)
52. employee* (Text Word)
53. 19 or 20 or 21 or 22 or 23 or 24 or 25 or 26 or 27 or 28 or 29 or 30 or 31 or 32 or 33 or 34 or 35 or 36 or 37 or 38 or 39 or 40 or 41 or 42 or 43 or 44 or 45 or 46 or 47 or 48 or 49 or 50 or 51 or 52
54. randomized‐controlled‐trial (pt)
55. controlled clinical trial (pt)
56. randomized controlled trials (mh)
57. random allocation (mh)
58. double blind method (mh)
59. single blind method (mh)
60. clinical trial (pt)
61. clinical trials (mh)
62. (clin* adj25 trial*) (ti,ab)
63. ((singl*(tw) OR doubl*(tw) OR trebl*(tw) OR tripl*(tw)) AND (mask*(tw) OR blind*(tw)))
64. placebos (mh)
65. placebo*(tw)
66. random*(tw)
67. research design(mh:noexp)
68. comparative study(pt)
69. evaluation studies(pt)
70. follow‐up studies(mh)
71. prospective studies(mh)
72. cross‐over studies(mh)
73. control*(tw)
74. prospectiv*(tw)
75. volunteer*(tw))
76. Evaluate* (tw)
77. Compare* (tw)
78. Program* (tw)
79. 54 or 55 or 56 or 57 or 58 or 59 or 60 or 61 or 62 or 63 or 64 or 65 or 66 or 67 or 68 or 69 or 70 or 71 or 72 or 73 or 74 or 75 or 76 or 77 or 78
80. “primary prevention” (MeSH Terms)
81. "Neoplasms/prevention and control"(MeSH Terms)
82. "Smoking/prevention and control"(MeSH)
83. “smoking cessation” (MeSH Terms)
84. Smoking/adverse effects"(MeSH Terms)
85. “occupational exposure” (MeSH Terms)
86. occupational exposure (Text Word)
87. “occupational diseases” (MeSH Terms)
88. occupational risk factor (Text Word)
89. “protective clothing” (MeSH Terms)
90. “inhalation exposure” (MeSH Terms )
91. exposure (Text Word)
92. exposed (Text Word)
93. body mass (tw)
94. tobacco (tw)
95. occupational vitiligo (Text Word)
96. "Antineoplastic Agents"(Mesh)
97. "Molecular Structure"(Mesh)
98. "Immunoconjugates"(Mesh)
99. "Mutagenesis"(Mesh)
100. "Apoptosis"(Mesh)
101. apoptosis (Text Word)
102. "Tumor Markers, Biological"(Mesh)
103. marker* (tw)
104. genet* (tw)
105. "Signal Transduction"(Mesh)
106. toxin (Text Word)
107. toxin* (Text Word)
108. toxic* (Text Word)
109. toxic (Text Word)
110. "Toxicology"(Mesh)
111. “case control” (tw)
112. epidemiol* (tw)
113. "Carcinogens, Environmental/adverse effects"(MeSH)
114. “Mass Screening” (MeSH Terms)
115. screening (tw)
116. “Palliative Care” (MeSH Terms)
117. “end of life” (tw)
118. palliative (tw)
119. “Neoplasm Metastasis” (MeSH Terms)
120. “Mortality” (MeSH Terms)
121. “aged, 80 and over” (MeSH Terms)
122. “terminal care” (MeSH Terms)
123. “geriatric assessment” (MeSH Terms)
124. “non‐cancer” (tw)
125. “non‐malignant” (tw)
126. “gene expression profiling” (MeSH Terms)
127. "Radiology/education"(MeSH Terms)
128. 80 or 81 or 82 or 83 or 84 or 85 or 86 or 87 or 88 or 89 or 90 or 91 or 92 or 93 or 94 or 95 or 96 or 97 or 98 or 99 or 100 or 101 or 102 or 103 or 104 or 105 or 106 or 107 or 108 or 109 or 110 or 111 or 112 or 113 or 114 or 115 or 116 or 117 or 118 or 119 or 120 or 121 or 122 or 123 or 124 or 125 or 126 or 127
129. (18 and 53 and 79) not 128
130. (animal(mh) NOT human(mh))
131. 129 not 130
Appendix 2. EMBASE, CINAHL, OSH‐ROM & PsycINFO: identical search strategy via Ovid
1. cancer.mp. (*)
2. *Neoplasm/ or neoplasm*.mp.
3. carcinoma*.mp.
4. oncolog*.mp.
5. malignan*.mp.
6. tumor*.mp.
7. tumour*.mp.
8. leukemi*.mp.
9. sarcom*.mp.
10. lymphom*.mp.
11. melanom*.mp.
12. blastom*.mp.
13. radiotherapy.mp.
14. chemotherapy.mp.
15. 6 or 11 or 3 or 7 or 9 or 12 or 2 or 14 or 8 or 1 or 4 or 13 or 10 or 5
16. exp Work Resumption/ or return to work.mp.
17. exp Employment/ or exp Employment Status/ or employment.mp.
18. exp Unemployment/ or unemployment.mp.
19. unemployed.mp.
20. retirement.mp.
21. (sick leave or Sickness absence or absenteeism).mp.
22. (vocational* or work ability or work capacity or work activity or work disability or work rehabilitation or work status or work retention or workability or employability or employable or employee*).mp.
23. randomized controlled trial.mp.
24. controlled clinical trial.mp.
25. (random allocation or double blind method or single blind method or clinical trial or placebo* or random* or comparative study or follow‐up study or cross‐over study or control* or prospectiv* or volunteer* or Evaluate* or Compare* or Program*).mp.
26. (primary prevention or smoking cessation or occupational disease* or occupational risk factor or protective clothing or exposure or exposed or body mass or tobacco or occupational vitiligo or Antineoplastic Agents or Molecular Structure or Immunoconjugates or Mutagenesis or Apoptosis or genet* or Signal Transduction or toxin or toxin* or toxic* or toxic or case control or epidemiol* or screening or end of life or palliative or Metastas* or terminal care or geriatric assessment or non‐malignant or gene expression).mp.
27. animal.mp. or exp Animal/
28. 24 or 25 or 23
29. occupation.mp.
30. exp Vocational Rehabilitation/ or exp Work Disability/
31. disability management.mp.
32. exp Vocational Rehabilitation/ or work rehabilitation.mp.
33. 21 or 30 or 17 or 20 or 32 or 18 or 22 or 31 or 16 or 19
34. 33 and 28 and 15
35. 34 not 26
36. 35 not 27
* ([mp=title, abstract, subject headings, heading word, drug trade name, original title, device manufacturer, drug manufacturer name])
Appendix 3. DARE search strategy
DARE: (more terms not possible)
(cancer OR neoplasm* OR carcinoma* OR oncolog* OR malignan* OR tumor* OR tumour* OR leukemi* OR sarcom* OR lymphom* OR melanom* OR blastom* OR radiotherapy OR chemotherapy) AND (return to work OR employment OR unemployment OR unemployed OR retirement OR sick leave OR Sickness absence OR absenteeism OR occupation* OR vocational* OR work ability OR work capacity OR work activity OR work disability OR work rehabilitation OR work status OR work retention OR workability OR employability OR employable OR employee*) NOT (primary prevention OR smoking cessation OR palliative OR Metastasis OR terminal)

PRISMA flow diagram of reference selection and study inclusion.

'Risk of bias' graph: review authors' judgements about each 'Risk of bias' item presented as percentages across all included studies.

'Risk of bias' summary: review authors' judgements about each 'Risk of bias' item for each included study.

Funnel plot of comparison: 4 Medical function conserving versus Medical more radical‐RCTs, outcome: 4.1 RTW.

Comparison 1 Psycho‐educational versus Care as usual, Outcome 1 RTW.
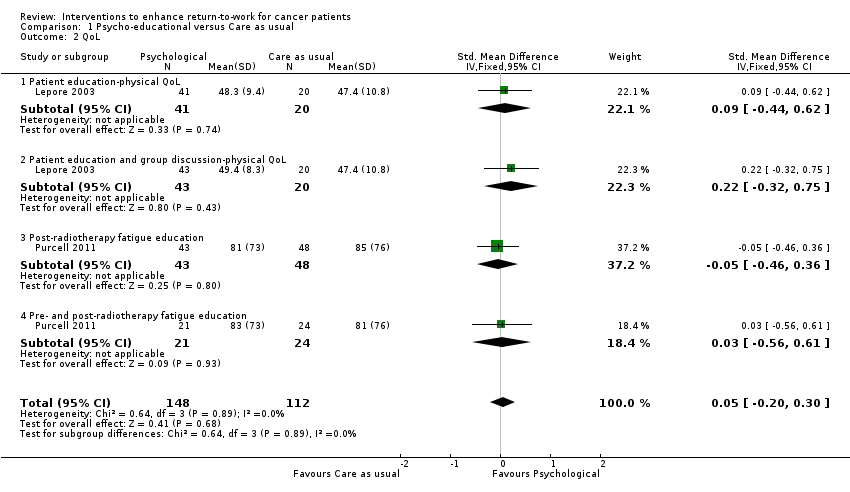
Comparison 1 Psycho‐educational versus Care as usual, Outcome 2 QoL.

Comparison 2 Physical versus Care as usual, Outcome 1 RTW.

Comparison 2 Physical versus Care as usual, Outcome 2 QoL.

Comparison 3 Medical function conserving versus Medical more radical, Outcome 1 RTW.

Comparison 3 Medical function conserving versus Medical more radical, Outcome 2 QoL.
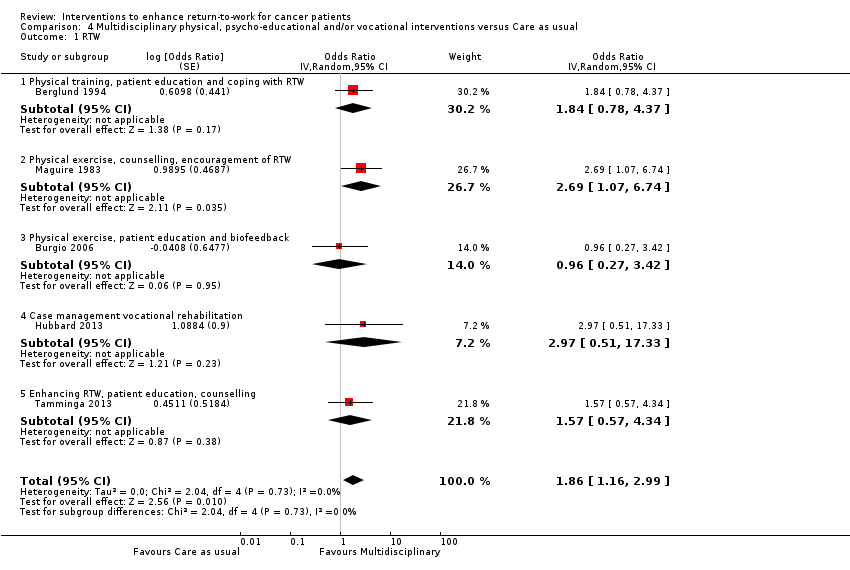
Comparison 4 Multidisciplinary physical, psycho‐educational and/or vocational interventions versus Care as usual, Outcome 1 RTW.

Comparison 4 Multidisciplinary physical, psycho‐educational and/or vocational interventions versus Care as usual, Outcome 2 QoL.
| Multidisciplinary physical, psycho‐educational and/or vocational interventions versus Care as usual for cancer | |||||
| Patient or population: Patients with cancer | |||||
| Outcomes | Illustrative comparative risks* (95% CI) | Relative effect | No of participants | Quality of the evidence | |
| Assumed risk | Corresponding risk | ||||
| Control | Multidisciplinary physical, psycho‐educationaland/or vocational interventions versus Care as usual | ||||
| RTW | 786 per 10001 | 872 per 1000 | RR 1.11 | 450 | ⊕⊕⊕⊝ |
| QoL | ‐ | The mean QoL in the intervention groups was | ‐ | 316 | ⊕⊕⊝⊝ |
| *The basis for the assumed risk (e.g. the median control group risk across studies) is provided in footnotes. The corresponding risk (and its 95% CI) is based on the assumed risk in the comparison group and the relative effect of the intervention (and its 95% CI). | |||||
| GRADE Working Group grades of evidence | |||||
| 1Median RTW rate in control groups. | |||||
| Psycho‐educational care versus Care as usual for return to work in cancer patients | |||||
| Patient or population: Patients with cancer | |||||
| Outcomes | Illustrative comparative risks* (95% CI) | Relative effect | No of participants | Quality of the evidence | |
| Assumed risk | Corresponding risk | ||||
| Care as usual | Psycho‐educationalcare | ||||
| Return to work (RTW) | 491 per 10001 | 535 per 1000 | RR 1.09 | 260 | ⊕⊕⊝⊝ |
| Quality of life (QoL) | ‐ | The mean QoL in the intervention groups was | ‐ | 260 | ⊕⊕⊝⊝ |
| *The basis for the assumed risk (e.g. the median control group risk across studies) is provided in footnotes. The corresponding risk (and its 95% CI) is based on the assumed risk in the comparison group and the relative effect of the intervention (and its 95% CI). | |||||
| GRADE Working Group grades of evidence | |||||
| 1Average of control groups' RTW rates. | |||||
| Physical exercise versus Care as usual for return to work in cancer | |||||
| Patient or population: Patients with cancer | |||||
| Outcomes | Illustrative comparative risks* (95% CI) | Relative effect | No of participants | Quality of the evidence | |
| Assumed risk | Corresponding risk | ||||
| Care as usual | Physical exercise | ||||
| RTW | 357 per 10001 | 429 per 1000 | RR 1.2 | 28 | ⊕⊕⊝⊝ low2 |
| QoL | ‐ | The mean QoL in the intervention groups was | ‐ | 41 | ⊕⊕⊝⊝ |
| *The basis for the assumed risk (e.g. the median control group risk across studies) is provided in footnotes. The corresponding risk (and its 95% CI) is based on the assumed risk in the comparison group and the relative effect of the intervention (and its 95% CI). | |||||
| GRADE Working Group grades of evidence | |||||
| 1RTW rate in the control group. | |||||
| Medical function conserving treatment versus Medical more radical treatment for cancer | |||||
| Patient or population: Patients with cancer | |||||
| Outcomes | Illustrative comparative risks* (95% CI) | Relative effect | No of participants | Quality of the evidence | |
| Assumed risk | Corresponding risk | ||||
| Medical more radical treatment | Medical function conserving treatment | ||||
| RTW | 850 per 10001 | 884 per 1000 | RR 1.04 | 1097 | ⊕⊕⊝⊝ |
| QoL | ‐ | The mean QoL in the intervention groups was | ‐ | 1028 | ⊕⊕⊕⊝ |
| *The basis for the assumed risk (e.g. the median control group risk across studies) is provided in footnotes. The corresponding risk (and its 95% CI) is based on the assumed risk in the comparison group and the relative effect of the intervention (and its 95% CI). | |||||
| GRADE Working Group grades of evidence | |||||
| 1 Median RTW rate in control groups of this comparison. | |||||
| Study | Country | Diagnosis | Design | Number | Intervention(s) | Control | Type |
| Netherlands | Head, neck | RCT | 34 versus 28 | Intra‐arterial chemoradiation | Intravenous chemoradiation | Medical | |
| Sweden | Breast | RCT | 81 versus 73 | Physical training, patient education and training of coping skills re RTW | Care as usual | Multidisciplinary | |
| USA | Prostate | RCT | 28 versus 29 | Biofeedback behavioral training | Care as usual | Multidisciplinary | |
| Germany | Thyroid | RCT | 7 versus 6 | L‐thyroxine after surgery | Later provision of L‐thyroxine | Medical | |
| Germany | Leukemia | RCT | 163 versus 166 | Peripheral blood progenitor cell transplantation | Bone marrow transplantation | Medical | |
| USA | Laryngeal | RCT | 80 versus 63 | Chemotherapy | Laryngectomy | Medical | |
| UK | Breast | RCT | 7 versus 11 | Physical, occupational, psycho‐educational support services, multi‐disciplinary | Booklet work and cancer | Multidisciplinary | |
| Sweden | Breast | RCT | 53 versus 17 55 versus 17 64 versus 17 |
| No endocrine therapy | Medical | |
| USA | Endometrial | RCT | 164 versus 73 | Laparoscopy | Laparotomy | Medical | |
| UK | Breast | RCT | 44 versus 47 | Breast conservation | Mastectomy | Medical | |
| USA | Prostate | RCT | 41 versus 20 43 versus 20 |
| Care as usual | Psycho‐educational | |
| UK | Breast | RCT | 42 versus 46 | Physical training, individual counselling and encouragement of RTW. | Care as usual | Multidisciplinary | |
| Australia | Radiotherapy patients | RCT | 43 versus 48 21 versus 24 |
| Flyer with generic information about fatigue. | Psycho‐educational | |
| USA | Breast | RCT | 14 versus 14 | Physical activity training | Care as usual | Physical | |
| Netherlands | Breast | RCT | 65 versus 68 | Vocational support, counselling, education, multi‐disciplinary, RTW advice. | Care as usual | Multidisciplinary |
| Comparison/outcome | Number of studies | Study limitations | Inconsistency | Indirectness | Imprecision | Publication bias | Overall quality of evidence |
| Psycho‐educational versus Care as usual/ RTW | 2 RCTs | Yes: 1 high 1 low risk 1 level down | No inconsistency | No | Wide CI 1 level down | Only two studies | Low |
| Physical versus Care as usual/ RTW | 1 RCT | No: Low risk | No | No | Wide CI 2 levels down | Only one study | Low |
| Medical function conserving versus Medical more radical/ RTW | 7 RCTs | No: 2/7 high risk studies contribute 25% | High: I² statistic = 51% | No | Wide CI 1 level down | Not observed | Low |
| Multidisciplinary physical, psycho‐educational and/or vocational interventions versus Care as usual/ RTW | 5 RCTs | Yes: 3/5 high risk 1 level down | No: I² statistic = 0% | No | Narrow CIs | Not observed | Moderate |
| Psycho‐educational versus Care as usual/QoL | 2 RCTs | Yes: 1 high, 1 low risk 1 level down | No: I² statistic = 0% | No | Wide CI 1 level down | Only two studies | Low |
| Physical versus Care as usual/ QoL | 1 RCT | No: Low risk | Not applicable | No | Wide CI 1 level down | Only one study | Low |
| Medical function conserving versus Medical more radical/QoL | 2 RCTs | No: Low risk studies | No: I² statistic = 0% | No | Wide CI 1 level down | Only two studies | Moderate |
| Multidisciplinary physical, psycho‐educational and/or vocational interventions versus Care as usual/QoL | 2 RCTs | Yes: 1 low, 1 high risk studies 1 level down | No: I² statistic = 17% | No | Wide CI 1 level down | Only two studies | Low |
| Column headings (with explanations in parentheses): Study design (RCT = randomised controlled trial); study limitations (likelihood of reported results not being an accurate estimate of the truth); inconsistency (lack of similarity of estimates of treatment effects); indirectness (not representing PICO well); imprecision (insufficient number of patients or wide CIs) of results; and publication bias (probability of selective publication of trials and outcomes) across all studies that measured that particular outcome. | |||||||
| Outcome or subgroup title | No. of studies | No. of participants | Statistical method | Effect size |
| 1 RTW Show forest plot | 2 | 260 | Risk Ratio (M‐H, Fixed, 95% CI) | 1.09 [0.88, 1.35] |
| 1.1 Patient education | 1 | 61 | Risk Ratio (M‐H, Fixed, 95% CI) | 1.08 [0.77, 1.51] |
| 1.2 Patient education, group discussion | 1 | 63 | Risk Ratio (M‐H, Fixed, 95% CI) | 1.33 [0.99, 1.79] |
| 1.3 Post‐radiotherapy fatigue education | 1 | 91 | Risk Ratio (M‐H, Fixed, 95% CI) | 0.98 [0.54, 1.76] |
| 1.4 Pre‐ and post‐radiotherapy fatigue education | 1 | 45 | Risk Ratio (M‐H, Fixed, 95% CI) | 0.83 [0.41, 1.67] |
| 2 QoL Show forest plot | 2 | 260 | Std. Mean Difference (IV, Fixed, 95% CI) | 0.05 [‐0.20, 0.30] |
| 2.1 Patient education‐physical QoL | 1 | 61 | Std. Mean Difference (IV, Fixed, 95% CI) | 0.09 [‐0.44, 0.62] |
| 2.2 Patient education and group discussion‐physical QoL | 1 | 63 | Std. Mean Difference (IV, Fixed, 95% CI) | 0.22 [‐0.32, 0.75] |
| 2.3 Post‐radiotherapy fatigue education | 1 | 91 | Std. Mean Difference (IV, Fixed, 95% CI) | ‐0.05 [‐0.46, 0.36] |
| 2.4 Pre‐ and post‐radiotherapy fatigue education | 1 | 45 | Std. Mean Difference (IV, Fixed, 95% CI) | 0.03 [‐0.56, 0.61] |
| Outcome or subgroup title | No. of studies | No. of participants | Statistical method | Effect size |
| 1 RTW Show forest plot | 1 | Risk Ratio (Fixed, 95% CI) | Totals not selected | |
| 1.1 Physical activity | 1 | Risk Ratio (Fixed, 95% CI) | 0.0 [0.0, 0.0] | |
| 2 QoL Show forest plot | 1 | Std. Mean Difference (IV, Fixed, 95% CI) | Totals not selected | |
| Outcome or subgroup title | No. of studies | No. of participants | Statistical method | Effect size |
| 1 RTW Show forest plot | 7 | Odds Ratio (Random, 95% CI) | 1.32 [0.78, 2.25] | |
| 1.1 Chemoradiation | 1 | Odds Ratio (Random, 95% CI) | 0.73 [0.25, 2.14] | |
| 1.2 Early thyroid hormones | 1 | Odds Ratio (Random, 95% CI) | 11.36 [1.17, 110.34] | |
| 1.3 Minimal surgery | 3 | Odds Ratio (Random, 95% CI) | 1.52 [0.74, 3.14] | |
| 1.4 Adjuvant endocrine | 1 | Odds Ratio (Random, 95% CI) | 1.28 [0.24, 6.77] | |
| 1.5 Peripheral blood progenitor cell transplantation | 1 | Odds Ratio (Random, 95% CI) | 0.81 [0.38, 1.73] | |
| 2 QoL Show forest plot | 2 | 1028 | Std. Mean Difference (IV, Fixed, 95% CI) | 0.10 [‐0.04, 0.23] |
| 2.1 Chemoradiation | 1 | 126 | Std. Mean Difference (IV, Fixed, 95% CI) | 0.17 [‐0.18, 0.52] |
| 2.2 Minimal surgery | 1 | 902 | Std. Mean Difference (IV, Fixed, 95% CI) | 0.08 [‐0.06, 0.23] |
| Outcome or subgroup title | No. of studies | No. of participants | Statistical method | Effect size |
| 1 RTW Show forest plot | 5 | Odds Ratio (Random, 95% CI) | 1.86 [1.16, 2.99] | |
| 1.1 Physical training, patient education and coping with RTW | 1 | Odds Ratio (Random, 95% CI) | 1.84 [0.78, 4.37] | |
| 1.2 Physical exercise, counselling, encouragement of RTW | 1 | Odds Ratio (Random, 95% CI) | 2.69 [1.07, 6.74] | |
| 1.3 Physical exercise, patient education and biofeedback | 1 | Odds Ratio (Random, 95% CI) | 0.96 [0.27, 3.42] | |
| 1.4 Case management vocational rehabilitation | 1 | Odds Ratio (Random, 95% CI) | 2.97 [0.51, 17.33] | |
| 1.5 Enhancing RTW, patient education, counselling | 1 | Odds Ratio (Random, 95% CI) | 1.57 [0.57, 4.34] | |
| 2 QoL Show forest plot | 2 | 316 | Std. Mean Difference (IV, Fixed, 95% CI) | 0.03 [‐0.20, 0.25] |
| 2.1 Physical training, patient education and coping with RTW | 1 | 188 | Std. Mean Difference (IV, Fixed, 95% CI) | ‐0.08 [‐0.36, 0.21] |
| 2.2 Enhancing RTW, patient education, counselling | 1 | 128 | Std. Mean Difference (IV, Fixed, 95% CI) | 0.18 [‐0.17, 0.52] |