Ecografía Doppler umbilical y fetal en embarazos de alto riesgo
Información
- DOI:
- https://doi.org/10.1002/14651858.CD007529.pub4Copiar DOI

- Base de datos:
-
- Cochrane Database of Systematic Reviews
- Versión publicada:
-
- 13 junio 2017see what's new
- Tipo:
-
- Intervention
- Etapa:
-
- Review
- Grupo Editorial Cochrane:
-
Grupo Cochrane de Embarazo y parto
- Copyright:
-
- Copyright © 2017 The Cochrane Collaboration. Published by John Wiley & Sons, Ltd.
Cifras del artículo
Altmetric:
Citado por:
Autores
Contributions of authors
In an earlier version of this review, T Stampalija (TS) drafted the background section, with Z Alfirevic (ZA) providing comments and suggestions. In this update, T Dowswell (TD) assisted with assessing new studies, grading the evidence and producing the 'Summary of findings' table. All authors commented on drafts.
Sources of support
Internal sources
-
The University of Liverpool, UK.
External sources
-
National Institute for Health Research (NIHR), UK.
NIHR Cochrane Programme Grant Project: 13/89/05 – Pregnancy and childbirth systematic reviews to support clinical guidelines
Declarations of interest
Zarko Alfirevic: none known.
Tamara Stampalija: none known.
Therese Dowswell: I am paid via my institution by the UK NHS (NIHR programme grant) to work on a range of Cochrane Reviews. In the last 36 months, I have received funding from the WHO to work on other Cochrane reviews. The funders have no influence on the content or conclusions of the reviews I work on.
Acknowledgements
In the previous version of this review, Alfirevic 2010, Gill Gyte was supported by the NIHR NHS Cochrane Collaboration Programme grant scheme award for NHS‐prioritised centrally‐managed, pregnancy and childbirth systematic reviews: CPGS02. We thank Gill for her contributions to previous versions of this review.
This project was supported by the National Institute for Health Research, via Cochrane programme grant funding to Cochrane Pregnancy and Childbirth. The views and opinions expressed therein are those of the authors and do not necessarily reflect those of the Systematic Reviews Programme, NIHR, NHS or the Department of Health.
Therese Dowswell is supported by the NIHR Cochrane Programme Grant Project: 13/89/05 – Pregnancy and childbirth systematic reviews to support clinical guidelines.
Version history
| Published | Title | Stage | Authors | Version |
| 2017 Jun 13 | Fetal and umbilical Doppler ultrasound in high‐risk pregnancies | Review | Zarko Alfirevic, Tamara Stampalija, Therese Dowswell | |
| 2013 Nov 12 | Fetal and umbilical Doppler ultrasound in high‐risk pregnancies | Review | Zarko Alfirevic, Tamara Stampalija, Gillian ML Gyte | |
| 2010 Jan 20 | Fetal and umbilical Doppler ultrasound in high‐risk pregnancies | Review | Zarko Alfirevic, Tamara Stampalija, Gillian ML Gyte | |
| 2009 Jan 21 | Fetal and umbilical Doppler ultrasound in high‐risk pregnancies | Protocol | Zarko Alfirevic, Tamara Stampalija, Gillian ML Gyte, James P Neilson | |
Differences between protocol and review
The secondary outcome of 'any perinatal death after randomisation excluding malformations' was changed to 'any potentially preventable perinatal death', which was defined as 'perinatal death excluding chromosomal abnormalities, termination of pregnancies, birth before fetal viability (less than 500 g) and fetal death before use of the intervention'.
The methods have been updated to the current Cochrane Pregnancy and Childbirth Group standard text, and a 'summary of findings' table has been added to the updated review.
We included the following clinically relevant outcomes that were not prespecified in our protocol.
-
Antenatal admissions.
-
Birth less than 34 weeks.
-
Phototherapy for neonatal jaundice.
-
Abnormal neurological development at nine months.
-
Hospitalisation for IUGR neonatal.
-
Fetal distress in labour.
-
Birthweight < 5 percentile.
-
Periventricular leucomalacia.
-
Antenatal hospital stay (days).
-
Infant survival at two years.
-
Sepsis (proven).
Keywords
MeSH
Medical Subject Headings (MeSH) Keywords
- Cardiotocography;
- Cesarean Section [statistics & numerical data];
- Fetal Monitoring [*methods];
- Labor, Induced [statistics & numerical data];
- Perinatal Mortality;
- *Pregnancy, High-Risk;
- Randomized Controlled Trials as Topic;
- Stillbirth [epidemiology];
- *Ultrasonography, Prenatal;
- Umbilical Arteries [*diagnostic imaging, physiopathology];
- Umbilical Cord [blood supply, *diagnostic imaging];
Medical Subject Headings Check Words
Female; Humans; Pregnancy;
PICO
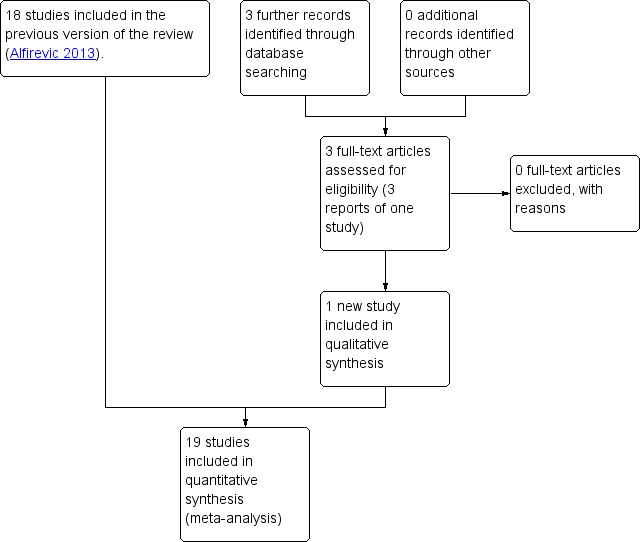
Study flow diagram.

Methodological quality summary: review authors' judgements about each methodological quality item for each included study.

Funnel plot of comparison: 1 Doppler ultrasound versus no Doppler ultrasound, outcome: 1.1 Any perinatal death after randomisation.

Funnel plot of comparison: 1 Doppler ultrasound versus no Doppler ultrasound, outcome: 1.8 Cesarean section (elective and emergency).

Funnel plot of comparison: 1 Doppler ultrasound versus no Doppler ultrasound, outcome: 1.9 Cesarean section ‐ elective.
Funnel plot of comparison: 1 Doppler ultrasound versus no Doppler ultrasound, outcome: 1.10 Cesarean section ‐ emergency.

Comparison 1 Umbilical artery Doppler ultrasound versus no Doppler ultrasound, Outcome 1 Any perinatal death after randomisation.
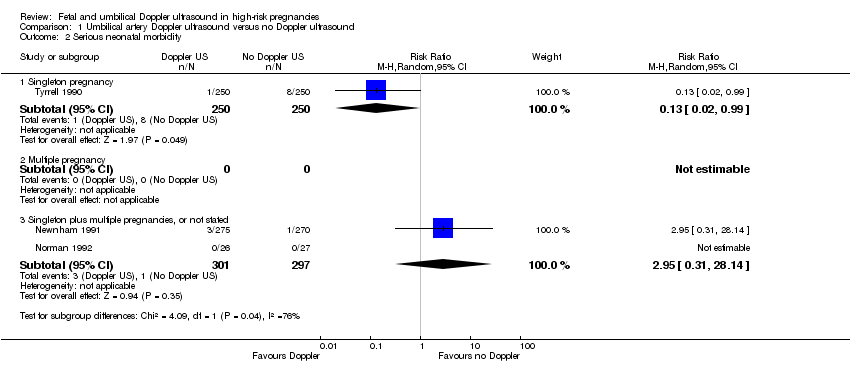
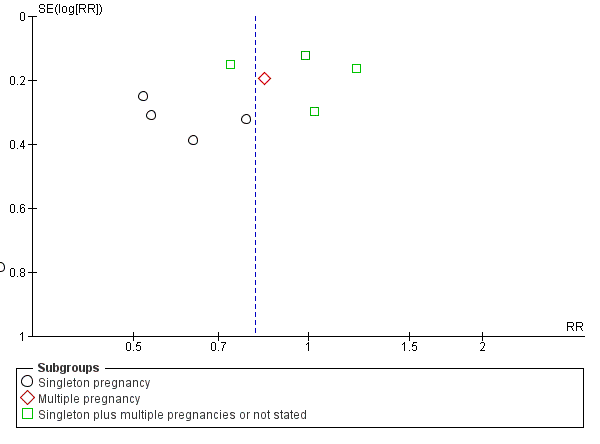
Comparison 1 Umbilical artery Doppler ultrasound versus no Doppler ultrasound, Outcome 2 Serious neonatal morbidity.

Comparison 1 Umbilical artery Doppler ultrasound versus no Doppler ultrasound, Outcome 3 Stillbirth.

Comparison 1 Umbilical artery Doppler ultrasound versus no Doppler ultrasound, Outcome 4 Neonatal death.

Comparison 1 Umbilical artery Doppler ultrasound versus no Doppler ultrasound, Outcome 5 Any potentially preventable perinatal death*.

Comparison 1 Umbilical artery Doppler ultrasound versus no Doppler ultrasound, Outcome 6 Apgar < 7 at 5 minutes.

Comparison 1 Umbilical artery Doppler ultrasound versus no Doppler ultrasound, Outcome 7 Caesarean section (elective and emergency).

Comparison 1 Umbilical artery Doppler ultrasound versus no Doppler ultrasound, Outcome 8 Caesarean section ‐ elective.
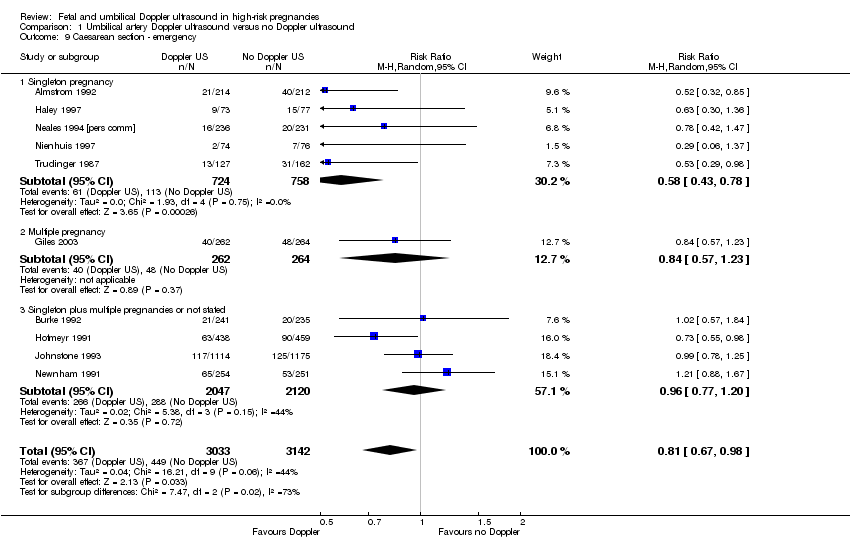
Comparison 1 Umbilical artery Doppler ultrasound versus no Doppler ultrasound, Outcome 9 Caesarean section ‐ emergency.

Comparison 1 Umbilical artery Doppler ultrasound versus no Doppler ultrasound, Outcome 10 Spontaneous vaginal birth.

Comparison 1 Umbilical artery Doppler ultrasound versus no Doppler ultrasound, Outcome 11 Operative vaginal birth.
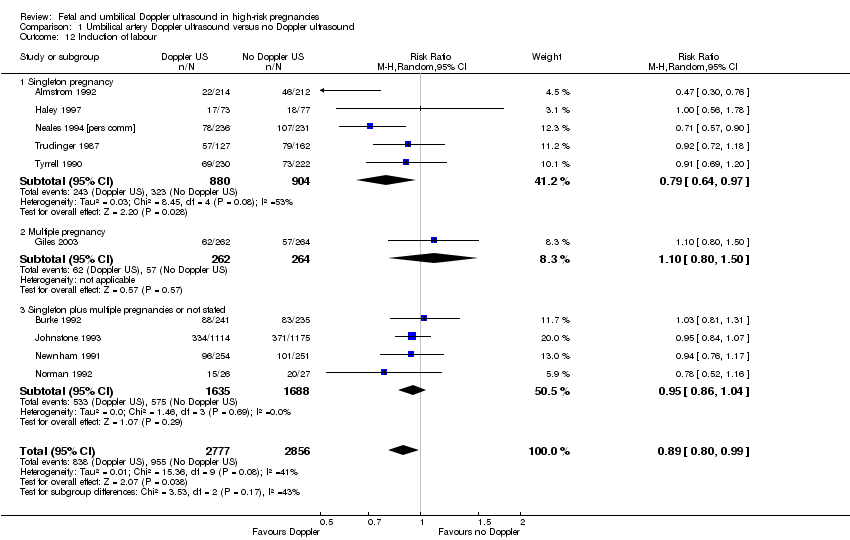
Comparison 1 Umbilical artery Doppler ultrasound versus no Doppler ultrasound, Outcome 12 Induction of labour.
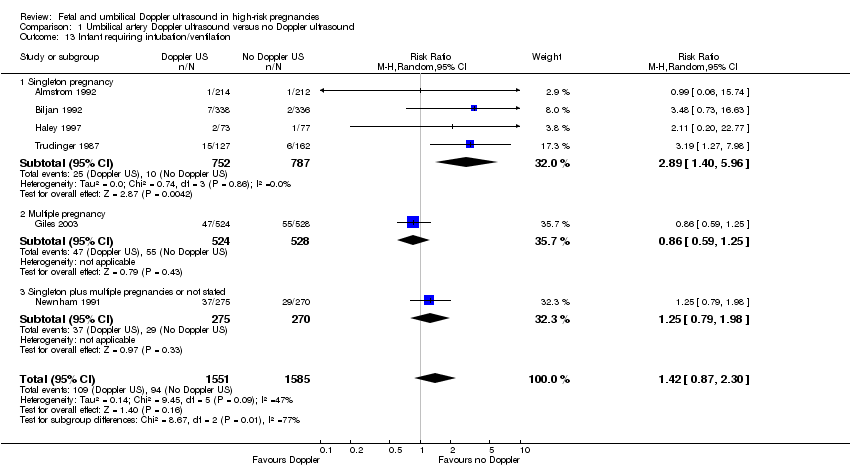
Comparison 1 Umbilical artery Doppler ultrasound versus no Doppler ultrasound, Outcome 13 Infant requiring intubation/ventilation.

Comparison 1 Umbilical artery Doppler ultrasound versus no Doppler ultrasound, Outcome 14 Neonatal fitting/seizures.

Comparison 1 Umbilical artery Doppler ultrasound versus no Doppler ultrasound, Outcome 15 Preterm labour.
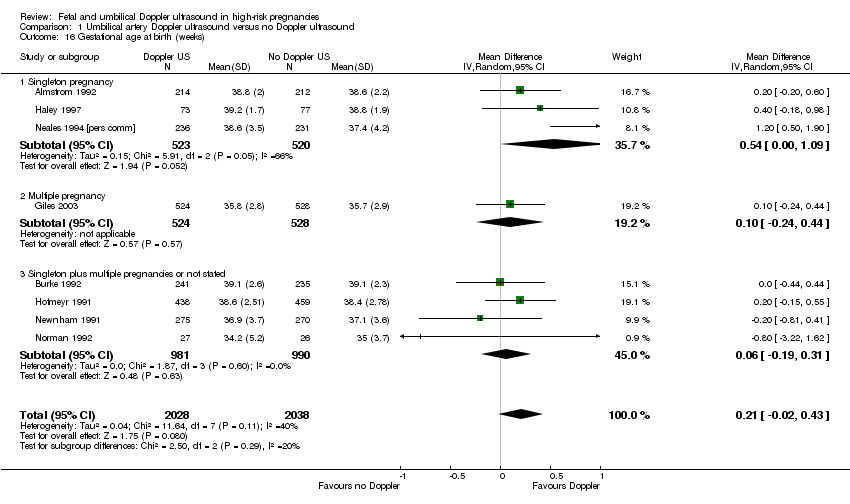
Comparison 1 Umbilical artery Doppler ultrasound versus no Doppler ultrasound, Outcome 16 Gestational age at birth (weeks).

Comparison 1 Umbilical artery Doppler ultrasound versus no Doppler ultrasound, Outcome 17 Infant respiratory distress syndrome (RDS).
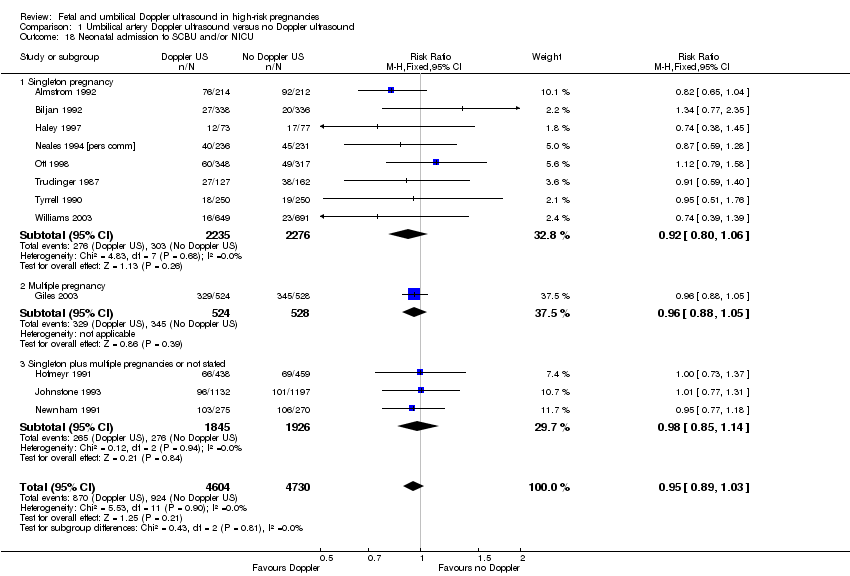
Comparison 1 Umbilical artery Doppler ultrasound versus no Doppler ultrasound, Outcome 18 Neonatal admission to SCBU and/or NICU.

Comparison 1 Umbilical artery Doppler ultrasound versus no Doppler ultrasound, Outcome 19 Hypoxic ischaemic encephalopathy.

Comparison 1 Umbilical artery Doppler ultrasound versus no Doppler ultrasound, Outcome 20 Intraventricular haemorrhage.

Comparison 1 Umbilical artery Doppler ultrasound versus no Doppler ultrasound, Outcome 21 Birthweight (grams).
Comparison 1 Umbilical artery Doppler ultrasound versus no Doppler ultrasound, Outcome 22 Length of infant hospital stay (days).
Comparison 1 Umbilical artery Doppler ultrasound versus no Doppler ultrasound, Outcome 23 Birth < 34 weeks (not prespecified).

Comparison 1 Umbilical artery Doppler ultrasound versus no Doppler ultrasound, Outcome 24 Antenatal admissions (not prespecified).

Comparison 1 Umbilical artery Doppler ultrasound versus no Doppler ultrasound, Outcome 25 Phototherapy for neonatal jaundice (not prespecified).

Comparison 1 Umbilical artery Doppler ultrasound versus no Doppler ultrasound, Outcome 26 Abnormal neurological development at 9 months (not prespecified).
Comparison 1 Umbilical artery Doppler ultrasound versus no Doppler ultrasound, Outcome 27 Hospitalisation for IUGR neonatal (not prespecified).

Comparison 1 Umbilical artery Doppler ultrasound versus no Doppler ultrasound, Outcome 28 Fetal distress in labour (not prespecified).

Comparison 1 Umbilical artery Doppler ultrasound versus no Doppler ultrasound, Outcome 29 Birthweight < 5 percentile (not prespecified).

Comparison 1 Umbilical artery Doppler ultrasound versus no Doppler ultrasound, Outcome 30 Periventricular leucomalacia (not prespecified).

Comparison 1 Umbilical artery Doppler ultrasound versus no Doppler ultrasound, Outcome 31 Antenatal hospital stay (days) (not prespecified).

Comparison 2 Umbilical artery Doppler ultrasound versus no Doppler ultrasound (all subgroups), Outcome 1 Any perinatal death after randomisation.

Comparison 2 Umbilical artery Doppler ultrasound versus no Doppler ultrasound (all subgroups), Outcome 2 Serious neonatal morbidity.

Comparison 3 Umbilical artery Doppler ultrasound alone versus CTG alone, Outcome 1 Any perinatal death after randomisation.

Comparison 3 Umbilical artery Doppler ultrasound alone versus CTG alone, Outcome 2 Stillbirth.

Comparison 3 Umbilical artery Doppler ultrasound alone versus CTG alone, Outcome 3 Neonatal death.
Comparison 3 Umbilical artery Doppler ultrasound alone versus CTG alone, Outcome 4 Any potentially preventable perinatal death*.

Comparison 3 Umbilical artery Doppler ultrasound alone versus CTG alone, Outcome 5 Apgar < 7 at 5 minutes.

Comparison 3 Umbilical artery Doppler ultrasound alone versus CTG alone, Outcome 6 Caesarean section (elective and emergency).

Comparison 3 Umbilical artery Doppler ultrasound alone versus CTG alone, Outcome 7 Caesarean section ‐ elective.
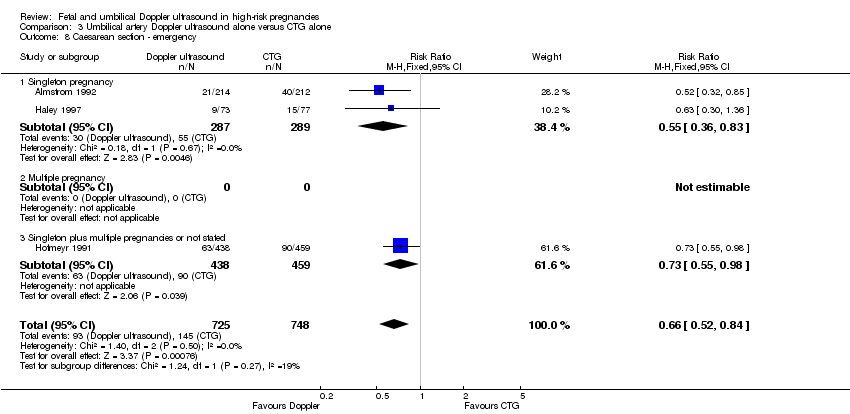
Comparison 3 Umbilical artery Doppler ultrasound alone versus CTG alone, Outcome 8 Caesarean section ‐ emergency.
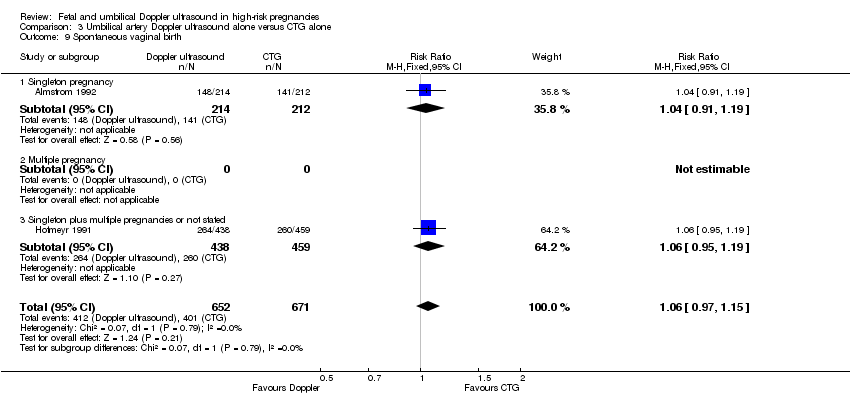
Comparison 3 Umbilical artery Doppler ultrasound alone versus CTG alone, Outcome 9 Spontaneous vaginal birth.
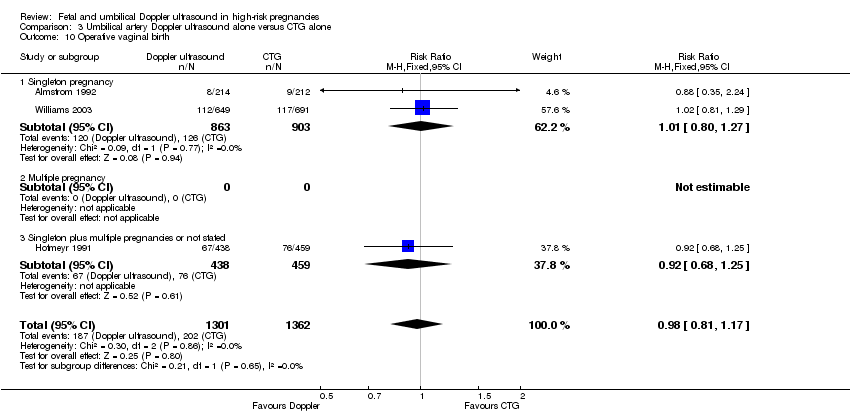
Comparison 3 Umbilical artery Doppler ultrasound alone versus CTG alone, Outcome 10 Operative vaginal birth.

Comparison 3 Umbilical artery Doppler ultrasound alone versus CTG alone, Outcome 11 Induction of labour.
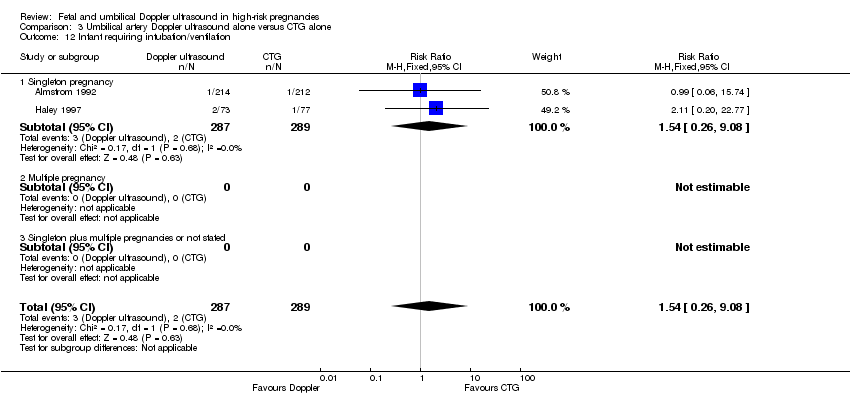
Comparison 3 Umbilical artery Doppler ultrasound alone versus CTG alone, Outcome 12 Infant requiring intubation/ventilation.
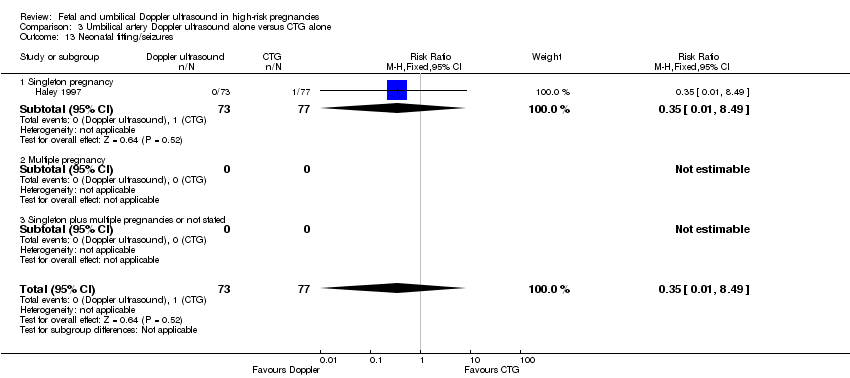
Comparison 3 Umbilical artery Doppler ultrasound alone versus CTG alone, Outcome 13 Neonatal fitting/seizures.

Comparison 3 Umbilical artery Doppler ultrasound alone versus CTG alone, Outcome 14 Gestational age at birth.

Comparison 3 Umbilical artery Doppler ultrasound alone versus CTG alone, Outcome 15 Neonatal admission to SCBU and/or NICU.

Comparison 3 Umbilical artery Doppler ultrasound alone versus CTG alone, Outcome 16 Infant birthweight (grams).
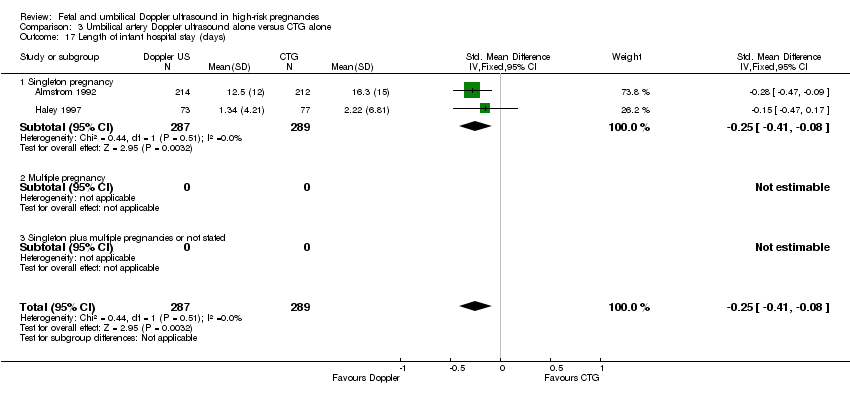
Comparison 3 Umbilical artery Doppler ultrasound alone versus CTG alone, Outcome 17 Length of infant hospital stay (days).
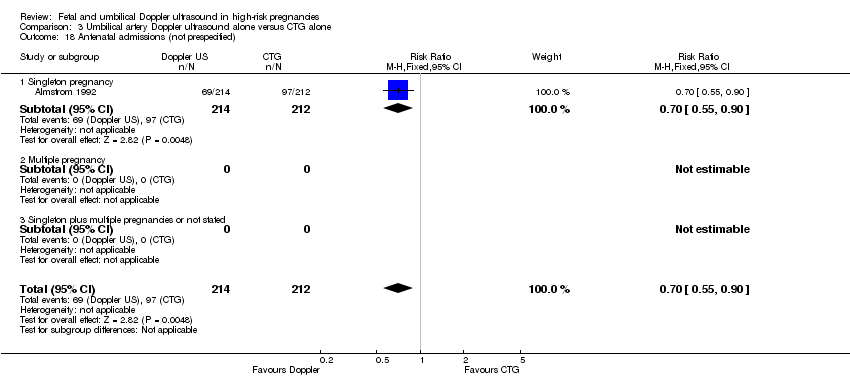
Comparison 3 Umbilical artery Doppler ultrasound alone versus CTG alone, Outcome 18 Antenatal admissions (not prespecified).

Comparison 3 Umbilical artery Doppler ultrasound alone versus CTG alone, Outcome 19 Phototherapy for neonatal jaundice (not prespecified).

Comparison 3 Umbilical artery Doppler ultrasound alone versus CTG alone, Outcome 20 Antenatal hospital stay (days) (not prespecified).

Comparison 4 Umbilical artery Doppler ultrasound alone versus CTG alone (all subgroups), Outcome 1 Any perinatal death after randomisation.

Comparison 5 Early ductus venosus Doppler ultrasound versus CTG, Outcome 1 Any perinatal death after randomisation.
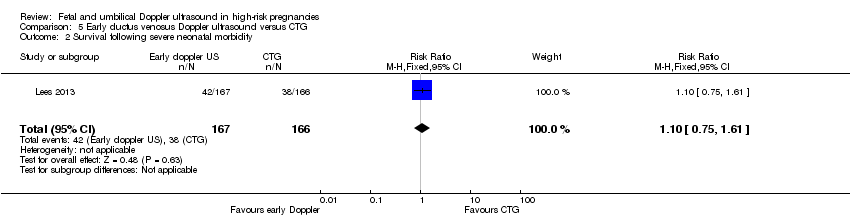
Comparison 5 Early ductus venosus Doppler ultrasound versus CTG, Outcome 2 Survival following severe neonatal morbidity.

Comparison 5 Early ductus venosus Doppler ultrasound versus CTG, Outcome 3 Stillbirth.
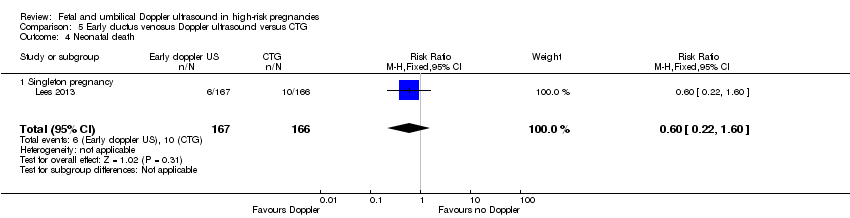
Comparison 5 Early ductus venosus Doppler ultrasound versus CTG, Outcome 4 Neonatal death.

Comparison 5 Early ductus venosus Doppler ultrasound versus CTG, Outcome 5 Any potentially preventable perinatal death*.

Comparison 5 Early ductus venosus Doppler ultrasound versus CTG, Outcome 6 Fetal acidosis.

Comparison 5 Early ductus venosus Doppler ultrasound versus CTG, Outcome 7 Apgar < 7 at 5 minutes.

Comparison 5 Early ductus venosus Doppler ultrasound versus CTG, Outcome 8 Infant requiring intubation/ventilation.
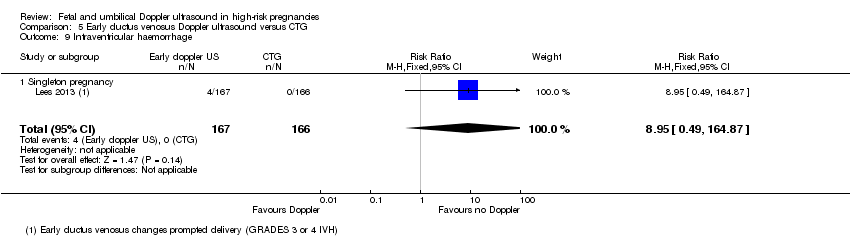
Comparison 5 Early ductus venosus Doppler ultrasound versus CTG, Outcome 9 Intraventricular haemorrhage.

Comparison 5 Early ductus venosus Doppler ultrasound versus CTG, Outcome 10 Bronchopulmonary dysplasia.

Comparison 5 Early ductus venosus Doppler ultrasound versus CTG, Outcome 11 Necrotising enterocolitis.

Comparison 5 Early ductus venosus Doppler ultrasound versus CTG, Outcome 12 Infant birthweight (grams).

Comparison 5 Early ductus venosus Doppler ultrasound versus CTG, Outcome 13 Long‐term infant neurodevelopmental outcome (impairment at 2 years).

Comparison 5 Early ductus venosus Doppler ultrasound versus CTG, Outcome 14 Long‐term infant neurodevelopmental outcome (cerebral palsy at 2 years).

Comparison 5 Early ductus venosus Doppler ultrasound versus CTG, Outcome 15 Infant survival at 2 years without neurodevelopmental impairment (not prespecified).

Comparison 5 Early ductus venosus Doppler ultrasound versus CTG, Outcome 16 Sepsis (proven) (not prespecified).

Comparison 6 Late ductus venosus Doppler ultrasound versus CTG, Outcome 1 Any perinatal death after randomisation.

Comparison 6 Late ductus venosus Doppler ultrasound versus CTG, Outcome 2 Survival following severe neonatal morbidity.
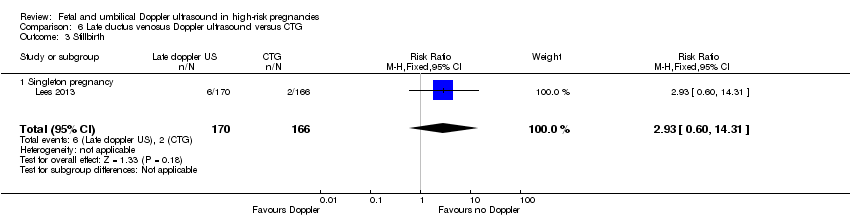
Comparison 6 Late ductus venosus Doppler ultrasound versus CTG, Outcome 3 Stillbirth.

Comparison 6 Late ductus venosus Doppler ultrasound versus CTG, Outcome 4 Neonatal death.

Comparison 6 Late ductus venosus Doppler ultrasound versus CTG, Outcome 5 Any potentially preventable perinatal death*.

Comparison 6 Late ductus venosus Doppler ultrasound versus CTG, Outcome 6 Fetal acidosis.
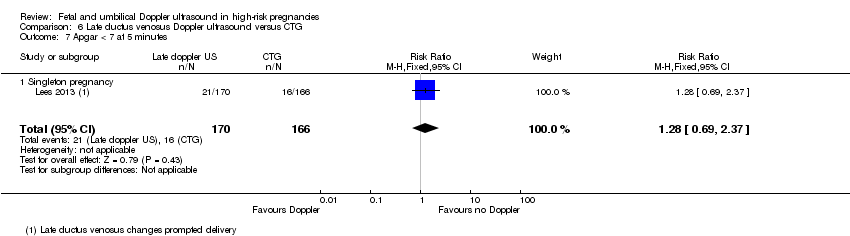
Comparison 6 Late ductus venosus Doppler ultrasound versus CTG, Outcome 7 Apgar < 7 at 5 minutes.
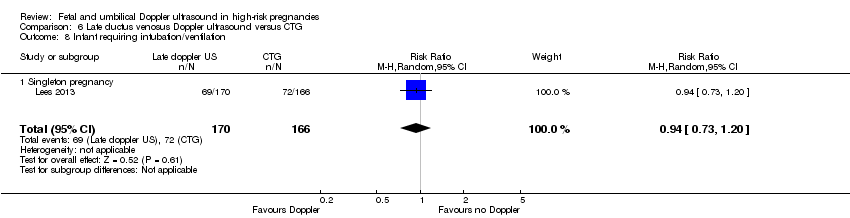
Comparison 6 Late ductus venosus Doppler ultrasound versus CTG, Outcome 8 Infant requiring intubation/ventilation.

Comparison 6 Late ductus venosus Doppler ultrasound versus CTG, Outcome 9 Intraventricular haemorrhage.

Comparison 6 Late ductus venosus Doppler ultrasound versus CTG, Outcome 10 Bronchopulmonary dysplasia.

Comparison 6 Late ductus venosus Doppler ultrasound versus CTG, Outcome 11 Necrotising enterocolitis.

Comparison 6 Late ductus venosus Doppler ultrasound versus CTG, Outcome 12 Infant birthweight (grams).

Comparison 6 Late ductus venosus Doppler ultrasound versus CTG, Outcome 13 Long‐term infant neurodevelopmental outcome (impairment at 2 years).

Comparison 6 Late ductus venosus Doppler ultrasound versus CTG, Outcome 14 Long‐term infant neurodevelopmental outcome (cerebral palsy at 2 years).
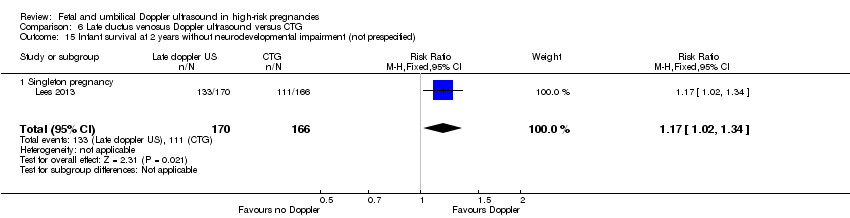
Comparison 6 Late ductus venosus Doppler ultrasound versus CTG, Outcome 15 Infant survival at 2 years without neurodevelopmental impairment (not prespecified).

Comparison 6 Late ductus venosus Doppler ultrasound versus CTG, Outcome 16 Sepsis (proven) (not prespecified).

Comparison 7 Early ductus venosus Doppler ultrasound versus late, Outcome 1 Any perinatal death after randomisation.

Comparison 7 Early ductus venosus Doppler ultrasound versus late, Outcome 2 Survival following severe neonatal morbidity.

Comparison 7 Early ductus venosus Doppler ultrasound versus late, Outcome 3 Stillbirth.

Comparison 7 Early ductus venosus Doppler ultrasound versus late, Outcome 4 Neonatal death.
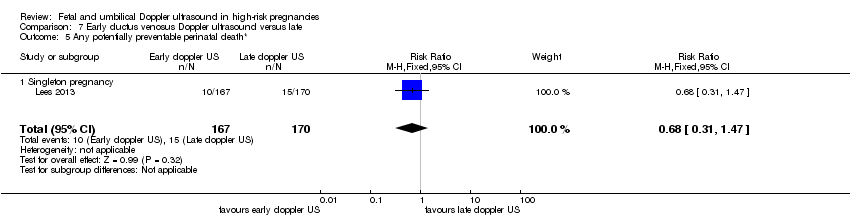
Comparison 7 Early ductus venosus Doppler ultrasound versus late, Outcome 5 Any potentially preventable perinatal death*.

Comparison 7 Early ductus venosus Doppler ultrasound versus late, Outcome 6 Fetal acidosis.

Comparison 7 Early ductus venosus Doppler ultrasound versus late, Outcome 7 Apgar < 7 at 5 minutes.

Comparison 7 Early ductus venosus Doppler ultrasound versus late, Outcome 8 Infant requiring intubation/ventilation.

Comparison 7 Early ductus venosus Doppler ultrasound versus late, Outcome 9 Intraventricular haemorrhage.

Comparison 7 Early ductus venosus Doppler ultrasound versus late, Outcome 10 Bronchopulmonary dysplasia.

Comparison 7 Early ductus venosus Doppler ultrasound versus late, Outcome 11 Necrotising enterocolitis.
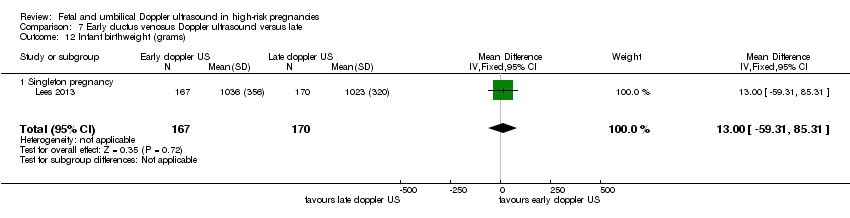
Comparison 7 Early ductus venosus Doppler ultrasound versus late, Outcome 12 Infant birthweight (grams).

Comparison 7 Early ductus venosus Doppler ultrasound versus late, Outcome 13 Long‐term infant neurodevelopmental outcome (impairment at 2 years).

Comparison 7 Early ductus venosus Doppler ultrasound versus late, Outcome 14 Long‐term infant neurodevelopmental outcome (cerebral palsy at 2 years).
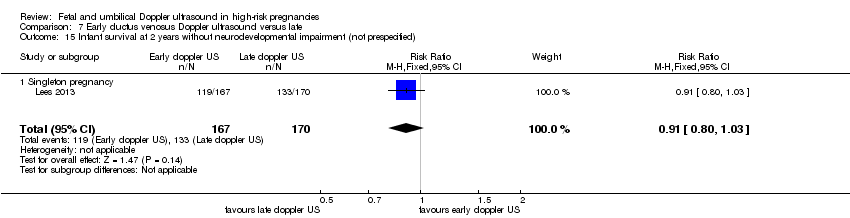
Comparison 7 Early ductus venosus Doppler ultrasound versus late, Outcome 15 Infant survival at 2 years without neurodevelopmental impairment (not prespecified).
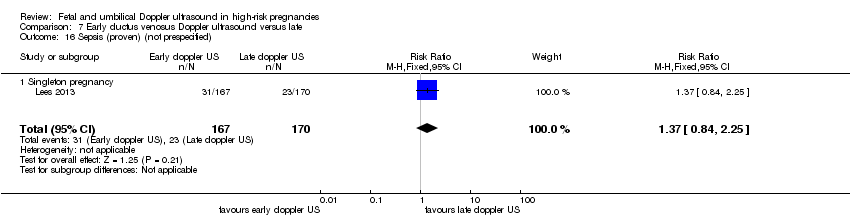
Comparison 7 Early ductus venosus Doppler ultrasound versus late, Outcome 16 Sepsis (proven) (not prespecified).
| Umbilical artery Doppler ultrasound compared to no Doppler ultrasound in high‐risk pregnancies | ||||||
| Patient or population: pregnant women at increased risk of fetal complications | ||||||
| Outcomes | Anticipated absolute effects* (95% CI) | Relative effect | № of participants | Quality of the evidence | Comments | |
| Risk with no Doppler ultrasound | Risk with umbilical artery Doppler ultrasound | |||||
| Any perinatal death after randomisation | Study population | RR 0.71 | 10225 | ⊕⊕⊕⊝ | ||
| 17 per 1000 | 12 per 1000 | |||||
| Serious neonatal morbidity | Study population | 1098 | ⊕⊝⊝⊝ | We did not pool the data for this outcome due to high heterogeneity (the direction of effect in the 2 studies contributing data were not consistent). | ||
| Stillbirth | Study population | RR 0.65 | 9560 | ⊕⊕⊝⊝ | ||
| 9 per 1000 | 6 per 1000 | |||||
| Apgar < 7 at 5 minutes | Study population | RR 0.92 | 6321 | ⊕⊕⊝⊝ | ||
| 29 per 1000 | 26 per 1000 | |||||
| Caesarean section (elective and emergency) | Study population | RR 0.90 | 7918 | ⊕⊕⊕⊝ | ||
| 263 per 1000 | 237 per 1000 | |||||
| Induction of labour | Study population | RR 0.89 | 5633 | ⊕⊕⊕⊝ | ||
| 334 per 1000 | 298 per 1000 | |||||
| Long‐term infant neurodevelopmental outcome (impairment at 2 years) | Study population | ‐ | (0 studies) | ‐ | There has been no comparative long‐term follow‐up of babies exposed to Doppler ultrasound in pregnancy in women at increased risk of complications. | |
| see comment | see comment | |||||
| *The risk in the intervention group (and its 95% confidence interval) is based on the assumed risk in the comparison group and the relative effect of the intervention (and its 95% CI). | ||||||
| GRADE Working Group grades of evidence | ||||||
| 1 All studies assessed as having design limitations due to lack of information. 2 Although there was some evidence of funnel plot asymmetry suggesting small‐study effect (with studies with smaller sample sizes appearing to have a more pronounced effect), we did not downgrade for publication bias because, for our selected outcomes, individual studies did not reach statistical significance and there was low heterogeneity across all studies for this outcome. 3 High heterogeneity (I² statistic 76%) with direction of effect different in the 2 studies contributing data. 4 95% CI crossing the line of no effect. Low event rate. 5 Wide 95% CI crossing the line of no effect. | ||||||
| Outcome or subgroup title | No. of studies | No. of participants | Statistical method | Effect size |
| 1 Any perinatal death after randomisation Show forest plot | 16 | 10225 | Risk Ratio (M‐H, Fixed, 95% CI) | 0.71 [0.52, 0.98] |
| 1.1 Singleton pregnancy | 9 | 4661 | Risk Ratio (M‐H, Fixed, 95% CI) | 0.59 [0.35, 1.01] |
| 1.2 Multiple pregnancy | 1 | 1052 | Risk Ratio (M‐H, Fixed, 95% CI) | 0.88 [0.32, 2.41] |
| 1.3 Singleton plus multiple pregnancies, or not stated | 6 | 4512 | Risk Ratio (M‐H, Fixed, 95% CI) | 0.78 [0.51, 1.19] |
| 2 Serious neonatal morbidity Show forest plot | 3 | Risk Ratio (M‐H, Random, 95% CI) | Subtotals only | |
| 2.1 Singleton pregnancy | 1 | 500 | Risk Ratio (M‐H, Random, 95% CI) | 0.13 [0.02, 0.99] |
| 2.2 Multiple pregnancy | 0 | 0 | Risk Ratio (M‐H, Random, 95% CI) | 0.0 [0.0, 0.0] |
| 2.3 Singleton plus multiple pregnancies, or not stated | 2 | 598 | Risk Ratio (M‐H, Random, 95% CI) | 2.95 [0.31, 28.14] |
| 3 Stillbirth Show forest plot | 15 | 9560 | Risk Ratio (M‐H, Fixed, 95% CI) | 0.65 [0.41, 1.04] |
| 3.1 Singleton pregnancy | 8 | 3996 | Risk Ratio (M‐H, Fixed, 95% CI) | 0.61 [0.31, 1.19] |
| 3.2 Multiple pregnancy | 1 | 1052 | Risk Ratio (M‐H, Fixed, 95% CI) | 0.67 [0.11, 4.00] |
| 3.3 Singleton plus multiple pregnancy, or not stated | 6 | 4512 | Risk Ratio (M‐H, Fixed, 95% CI) | 0.70 [0.35, 1.39] |
| 4 Neonatal death Show forest plot | 13 | 8167 | Risk Ratio (M‐H, Fixed, 95% CI) | 0.81 [0.53, 1.24] |
| 4.1 Singleton pregnancy | 7 | 2656 | Risk Ratio (M‐H, Fixed, 95% CI) | 0.69 [0.31, 1.53] |
| 4.2 Multiple pregnancy | 1 | 1052 | Risk Ratio (M‐H, Fixed, 95% CI) | 1.01 [0.29, 3.46] |
| 4.3 Singleton plus multiple pregnancies, or not stated | 5 | 4459 | Risk Ratio (M‐H, Fixed, 95% CI) | 0.84 [0.48, 1.45] |
| 5 Any potentially preventable perinatal death* Show forest plot | 16 | 10225 | Risk Ratio (M‐H, Fixed, 95% CI) | 0.67 [0.46, 0.98] |
| 5.1 Singleton pregnancy | 9 | 4661 | Risk Ratio (M‐H, Fixed, 95% CI) | 0.58 [0.30, 1.13] |
| 5.2 Multiple pregnancy | 1 | 1052 | Risk Ratio (M‐H, Fixed, 95% CI) | 0.88 [0.32, 2.41] |
| 5.3 Singleton plus multiple pregnancies or not stated | 6 | 4512 | Risk Ratio (M‐H, Fixed, 95% CI) | 0.69 [0.41, 1.15] |
| 6 Apgar < 7 at 5 minutes Show forest plot | 7 | 6321 | Risk Ratio (M‐H, Fixed, 95% CI) | 0.92 [0.69, 1.24] |
| 6.1 Singleton pregnancy | 4 | 2555 | Risk Ratio (M‐H, Fixed, 95% CI) | 0.70 [0.45, 1.09] |
| 6.2 Multiple pregnancy | 0 | 0 | Risk Ratio (M‐H, Fixed, 95% CI) | 0.0 [0.0, 0.0] |
| 6.3 Singleton plus multiple pregnancies or not stated | 3 | 3766 | Risk Ratio (M‐H, Fixed, 95% CI) | 1.16 [0.77, 1.73] |
| 7 Caesarean section (elective and emergency) Show forest plot | 14 | 7918 | Risk Ratio (M‐H, Fixed, 95% CI) | 0.90 [0.84, 0.97] |
| 7.1 Singleton pregnancy | 7 | 2929 | Risk Ratio (M‐H, Fixed, 95% CI) | 0.84 [0.75, 0.95] |
| 7.2 Multiple pregnancy | 1 | 526 | Risk Ratio (M‐H, Fixed, 95% CI) | 0.96 [0.77, 1.19] |
| 7.3 Singleton plus multiple pregnancies or not stated | 6 | 4463 | Risk Ratio (M‐H, Fixed, 95% CI) | 0.94 [0.84, 1.05] |
| 8 Caesarean section ‐ elective Show forest plot | 11 | 6627 | Risk Ratio (M‐H, Fixed, 95% CI) | 1.07 [0.93, 1.22] |
| 8.1 Singleton pregnancy | 6 | 1934 | Risk Ratio (M‐H, Fixed, 95% CI) | 1.11 [0.90, 1.38] |
| 8.2 Multiple pregnancy | 1 | 526 | Risk Ratio (M‐H, Fixed, 95% CI) | 1.06 [0.77, 1.47] |
| 8.3 Singleton plus multiple pregnancies or not stated | 4 | 4167 | Risk Ratio (M‐H, Fixed, 95% CI) | 1.03 [0.84, 1.26] |
| 9 Caesarean section ‐ emergency Show forest plot | 10 | 6175 | Risk Ratio (M‐H, Random, 95% CI) | 0.81 [0.67, 0.98] |
| 9.1 Singleton pregnancy | 5 | 1482 | Risk Ratio (M‐H, Random, 95% CI) | 0.58 [0.43, 0.78] |
| 9.2 Multiple pregnancy | 1 | 526 | Risk Ratio (M‐H, Random, 95% CI) | 0.84 [0.57, 1.23] |
| 9.3 Singleton plus multiple pregnancies or not stated | 4 | 4167 | Risk Ratio (M‐H, Random, 95% CI) | 0.96 [0.77, 1.20] |
| 10 Spontaneous vaginal birth Show forest plot | 5 | 2504 | Risk Ratio (M‐H, Fixed, 95% CI) | 1.04 [0.98, 1.10] |
| 10.1 Singleton pregnancy | 2 | 576 | Risk Ratio (M‐H, Fixed, 95% CI) | 1.07 [0.96, 1.18] |
| 10.2 Multiple pregnancy | 1 | 526 | Risk Ratio (M‐H, Fixed, 95% CI) | 1.03 [0.90, 1.19] |
| 10.3 Singleton plus multiple pregnancies or not stated | 2 | 1402 | Risk Ratio (M‐H, Fixed, 95% CI) | 1.03 [0.95, 1.12] |
| 11 Operative vaginal birth Show forest plot | 4 | 2813 | Risk Ratio (M‐H, Fixed, 95% CI) | 0.95 [0.80, 1.14] |
| 11.1 Singleton pregnancy | 3 | 1916 | Risk Ratio (M‐H, Fixed, 95% CI) | 0.97 [0.78, 1.22] |
| 11.2 Multiple pregnancy | 0 | 0 | Risk Ratio (M‐H, Fixed, 95% CI) | 0.0 [0.0, 0.0] |
| 11.3 Singleton plus multiple pregnancies or not stated | 1 | 897 | Risk Ratio (M‐H, Fixed, 95% CI) | 0.92 [0.68, 1.25] |
| 12 Induction of labour Show forest plot | 10 | 5633 | Risk Ratio (M‐H, Random, 95% CI) | 0.89 [0.80, 0.99] |
| 12.1 Singleton pregnancy | 5 | 1784 | Risk Ratio (M‐H, Random, 95% CI) | 0.79 [0.64, 0.97] |
| 12.2 Multiple pregnancy | 1 | 526 | Risk Ratio (M‐H, Random, 95% CI) | 1.10 [0.80, 1.50] |
| 12.3 Singleton plus multiple pregnancies or not stated | 4 | 3323 | Risk Ratio (M‐H, Random, 95% CI) | 0.95 [0.86, 1.04] |
| 13 Infant requiring intubation/ventilation Show forest plot | 6 | 3136 | Risk Ratio (M‐H, Random, 95% CI) | 1.42 [0.87, 2.30] |
| 13.1 Singleton pregnancy | 4 | 1539 | Risk Ratio (M‐H, Random, 95% CI) | 2.89 [1.40, 5.96] |
| 13.2 Multiple pregnancy | 1 | 1052 | Risk Ratio (M‐H, Random, 95% CI) | 0.86 [0.59, 1.25] |
| 13.3 Singleton plus multiple pregnancies or not stated | 1 | 545 | Risk Ratio (M‐H, Random, 95% CI) | 1.25 [0.79, 1.98] |
| 14 Neonatal fitting/seizures Show forest plot | 1 | 150 | Risk Ratio (M‐H, Fixed, 95% CI) | 0.35 [0.01, 8.49] |
| 14.1 Singleton pregnancy | 1 | 150 | Risk Ratio (M‐H, Fixed, 95% CI) | 0.35 [0.01, 8.49] |
| 14.2 Multiple pregnancy | 0 | 0 | Risk Ratio (M‐H, Fixed, 95% CI) | 0.0 [0.0, 0.0] |
| 14.3 Singleton plus multiple pregnancies or not stated | 0 | 0 | Risk Ratio (M‐H, Fixed, 95% CI) | 0.0 [0.0, 0.0] |
| 15 Preterm labour Show forest plot | 2 | 626 | Risk Ratio (M‐H, Fixed, 95% CI) | 1.12 [0.72, 1.75] |
| 15.1 Singleton pregnancy | 1 | 150 | Risk Ratio (M‐H, Fixed, 95% CI) | 1.03 [0.51, 2.07] |
| 15.2 Multiple pregnancy | 0 | 0 | Risk Ratio (M‐H, Fixed, 95% CI) | 0.0 [0.0, 0.0] |
| 15.3 Singleton plus multiple pregnancy or not stated | 1 | 476 | Risk Ratio (M‐H, Fixed, 95% CI) | 1.18 [0.66, 2.11] |
| 16 Gestational age at birth (weeks) Show forest plot | 8 | 4066 | Mean Difference (IV, Random, 95% CI) | 0.21 [‐0.02, 0.43] |
| 16.1 Singleton pregnancy | 3 | 1043 | Mean Difference (IV, Random, 95% CI) | 0.54 [‐0.00, 1.09] |
| 16.2 Multiple pregnancy | 1 | 1052 | Mean Difference (IV, Random, 95% CI) | 0.10 [‐0.24, 0.44] |
| 16.3 Singleton plus multiple pregnancies or not stated | 4 | 1971 | Mean Difference (IV, Random, 95% CI) | 0.06 [‐0.19, 0.31] |
| 17 Infant respiratory distress syndrome (RDS) Show forest plot | 1 | 107 | Risk Ratio (M‐H, Fixed, 95% CI) | 1.06 [0.07, 16.48] |
| 17.1 Singleton pregnancy | 1 | 107 | Risk Ratio (M‐H, Fixed, 95% CI) | 1.06 [0.07, 16.48] |
| 17.2 Multiple pregnancy | 0 | 0 | Risk Ratio (M‐H, Fixed, 95% CI) | 0.0 [0.0, 0.0] |
| 17.3 Singleton plus multiple pregnancies or not stated | 0 | 0 | Risk Ratio (M‐H, Fixed, 95% CI) | 0.0 [0.0, 0.0] |
| 18 Neonatal admission to SCBU and/or NICU Show forest plot | 12 | 9334 | Risk Ratio (M‐H, Fixed, 95% CI) | 0.95 [0.89, 1.03] |
| 18.1 Singleton pregnancy | 8 | 4511 | Risk Ratio (M‐H, Fixed, 95% CI) | 0.92 [0.80, 1.06] |
| 18.2 Multiple pregnancy | 1 | 1052 | Risk Ratio (M‐H, Fixed, 95% CI) | 0.96 [0.88, 1.05] |
| 18.3 Singleton plus multiple pregnancies or not stated | 3 | 3771 | Risk Ratio (M‐H, Fixed, 95% CI) | 0.98 [0.85, 1.14] |
| 19 Hypoxic ischaemic encephalopathy Show forest plot | 2 | 1045 | Risk Ratio (M‐H, Random, 95% CI) | 0.65 [0.01, 33.07] |
| 19.1 Singleton pregnancy | 1 | 500 | Risk Ratio (M‐H, Random, 95% CI) | 0.09 [0.01, 1.64] |
| 19.2 Multiple pregnancy | 0 | 0 | Risk Ratio (M‐H, Random, 95% CI) | 0.0 [0.0, 0.0] |
| 19.3 Singleton plus multiple pregnancies or not stated | 1 | 545 | Risk Ratio (M‐H, Random, 95% CI) | 4.91 [0.24, 101.79] |
| 20 Intraventricular haemorrhage Show forest plot | 4 | 2008 | Risk Ratio (M‐H, Fixed, 95% CI) | 1.42 [0.47, 4.30] |
| 20.1 Singleton pregnancy | 3 | 1463 | Risk Ratio (M‐H, Fixed, 95% CI) | 1.26 [0.38, 4.16] |
| 20.2 Multiple pregnancy | 0 | 0 | Risk Ratio (M‐H, Fixed, 95% CI) | 0.0 [0.0, 0.0] |
| 20.3 Singleton plus multiple pregnancies or not stated | 1 | 545 | Risk Ratio (M‐H, Fixed, 95% CI) | 2.95 [0.12, 71.99] |
| 21 Birthweight (grams) Show forest plot | 7 | 3887 | Mean Difference (IV, Fixed, 95% CI) | 31.33 [‐8.70, 71.37] |
| 21.1 Singleton pregnancy | 3 | 1916 | Mean Difference (IV, Fixed, 95% CI) | 49.34 [‐0.62, 99.31] |
| 21.2 Multiple pregnancy | 0 | 0 | Mean Difference (IV, Fixed, 95% CI) | 0.0 [0.0, 0.0] |
| 21.3 Singleton plus multiple pregnancies or not stated | 4 | 1971 | Mean Difference (IV, Fixed, 95% CI) | ‐0.95 [‐67.84, 65.95] |
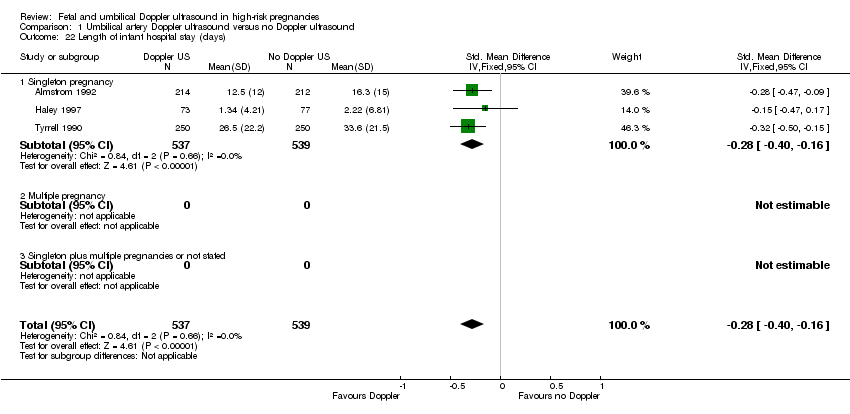
| 22 Length of infant hospital stay (days) Show forest plot | 3 | 1076 | Std. Mean Difference (IV, Fixed, 95% CI) | ‐0.28 [‐0.40, ‐0.16] |
| 22.1 Singleton pregnancy | 3 | 1076 | Std. Mean Difference (IV, Fixed, 95% CI) | ‐0.28 [‐0.40, ‐0.16] |
| 22.2 Multiple pregnancy | 0 | 0 | Std. Mean Difference (IV, Fixed, 95% CI) | 0.0 [0.0, 0.0] |
| 22.3 Singleton plus multiple pregnancies or not stated | 0 | 0 | Std. Mean Difference (IV, Fixed, 95% CI) | 0.0 [0.0, 0.0] |
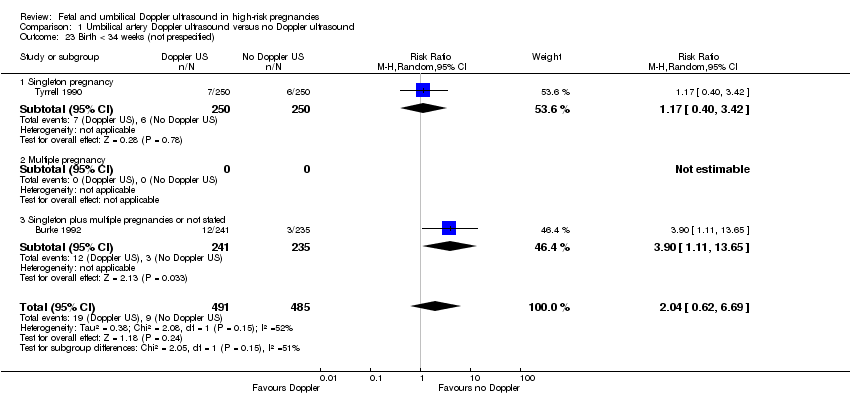
| 23 Birth < 34 weeks (not prespecified) Show forest plot | 2 | 976 | Risk Ratio (M‐H, Random, 95% CI) | 2.04 [0.62, 6.69] |
| 23.1 Singleton pregnancy | 1 | 500 | Risk Ratio (M‐H, Random, 95% CI) | 1.17 [0.40, 3.42] |
| 23.2 Multiple pregnancy | 0 | 0 | Risk Ratio (M‐H, Random, 95% CI) | 0.0 [0.0, 0.0] |
| 23.3 Singleton plus multiple pregnancies or not stated | 1 | 476 | Risk Ratio (M‐H, Random, 95% CI) | 3.90 [1.11, 13.65] |
| 24 Antenatal admissions (not prespecified) Show forest plot | 2 | 893 | Risk Ratio (M‐H, Fixed, 95% CI) | 0.72 [0.60, 0.88] |
| 24.1 Singleton pregnancy | 2 | 893 | Risk Ratio (M‐H, Fixed, 95% CI) | 0.72 [0.60, 0.88] |
| 24.2 Multiple pregnancy | 0 | 0 | Risk Ratio (M‐H, Fixed, 95% CI) | 0.0 [0.0, 0.0] |
| 24.3 Singleton plus multiple pregnancies or not stated | 0 | 0 | Risk Ratio (M‐H, Fixed, 95% CI) | 0.0 [0.0, 0.0] |
| 25 Phototherapy for neonatal jaundice (not prespecified) Show forest plot | 1 | 150 | Risk Ratio (M‐H, Fixed, 95% CI) | 0.15 [0.01, 2.87] |
| 25.1 Singleton pregnancy | 1 | 150 | Risk Ratio (M‐H, Fixed, 95% CI) | 0.15 [0.01, 2.87] |
| 25.2 Multiple pregnancy | 0 | 0 | Risk Ratio (M‐H, Fixed, 95% CI) | 0.0 [0.0, 0.0] |
| 25.3 Singleton plus multiple pregnancies or not stated | 0 | 0 | Risk Ratio (M‐H, Fixed, 95% CI) | 0.0 [0.0, 0.0] |
| 26 Abnormal neurological development at 9 months (not prespecified) Show forest plot | 1 | 137 | Risk Ratio (M‐H, Fixed, 95% CI) | 0.61 [0.26, 1.45] |
| 26.1 Singleton pregnancy | 1 | 137 | Risk Ratio (M‐H, Fixed, 95% CI) | 0.61 [0.26, 1.45] |
| 26.2 Multiple pregnancy | 0 | 0 | Risk Ratio (M‐H, Fixed, 95% CI) | 0.0 [0.0, 0.0] |
| 26.3 Singleton plus multiple pregnancies or not stated | 0 | 0 | Risk Ratio (M‐H, Fixed, 95% CI) | 0.0 [0.0, 0.0] |
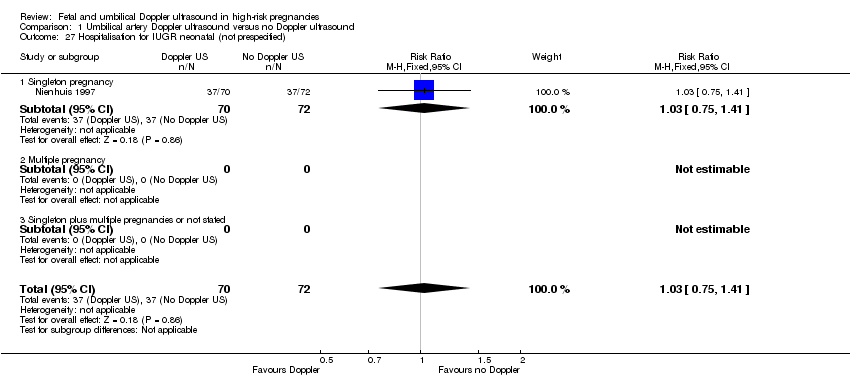
| 27 Hospitalisation for IUGR neonatal (not prespecified) Show forest plot | 1 | 142 | Risk Ratio (M‐H, Fixed, 95% CI) | 1.03 [0.75, 1.41] |
| 27.1 Singleton pregnancy | 1 | 142 | Risk Ratio (M‐H, Fixed, 95% CI) | 1.03 [0.75, 1.41] |
| 27.2 Multiple pregnancy | 0 | 0 | Risk Ratio (M‐H, Fixed, 95% CI) | 0.0 [0.0, 0.0] |
| 27.3 Singleton plus multiple pregnancies or not stated | 0 | 0 | Risk Ratio (M‐H, Fixed, 95% CI) | 0.0 [0.0, 0.0] |
| 28 Fetal distress in labour (not prespecified) Show forest plot | 1 | 289 | Risk Ratio (M‐H, Fixed, 95% CI) | 0.35 [0.10, 1.22] |
| 28.1 Singleton pregnancy | 1 | 289 | Risk Ratio (M‐H, Fixed, 95% CI) | 0.35 [0.10, 1.22] |
| 28.2 Multiple pregnancy | 0 | 0 | Risk Ratio (M‐H, Fixed, 95% CI) | 0.0 [0.0, 0.0] |
| 28.3 Singleton plus multiple pregnancies or not stated | 0 | 0 | Risk Ratio (M‐H, Fixed, 95% CI) | 0.0 [0.0, 0.0] |
| 29 Birthweight < 5 percentile (not prespecified) Show forest plot | 1 | 289 | Risk Ratio (M‐H, Fixed, 95% CI) | 1.16 [0.51, 2.64] |
| 29.1 Singleton pregnancy | 1 | 289 | Risk Ratio (M‐H, Fixed, 95% CI) | 1.16 [0.51, 2.64] |
| 29.2 Multiple pregnancy | 0 | 0 | Risk Ratio (M‐H, Fixed, 95% CI) | 0.0 [0.0, 0.0] |
| 29.3 Singleton plus multiple pregnancies or not stated | 0 | 0 | Risk Ratio (M‐H, Fixed, 95% CI) | 0.0 [0.0, 0.0] |
| 30 Periventricular leucomalacia (not prespecified) Show forest plot | 1 | 545 | Risk Ratio (M‐H, Fixed, 95% CI) | 0.33 [0.01, 8.00] |
| 30.1 Singleton pregnancy | 0 | 0 | Risk Ratio (M‐H, Fixed, 95% CI) | 0.0 [0.0, 0.0] |
| 30.2 Multiple pregnancy | 0 | 0 | Risk Ratio (M‐H, Fixed, 95% CI) | 0.0 [0.0, 0.0] |
| 30.3 Singleton plus multiple pregnancies or not stated | 1 | 545 | Risk Ratio (M‐H, Fixed, 95% CI) | 0.33 [0.01, 8.00] |
| 31 Antenatal hospital stay (days) (not prespecified) Show forest plot | 1 | 426 | Mean Difference (IV, Fixed, 95% CI) | ‐0.60 [‐2.39, 1.19] |
| 31.1 Singleton pregnancy | 1 | 426 | Mean Difference (IV, Fixed, 95% CI) | ‐0.60 [‐2.39, 1.19] |
| 31.2 Multiple pregnancy | 0 | 0 | Mean Difference (IV, Fixed, 95% CI) | 0.0 [0.0, 0.0] |
| 31.3 Singleton plus multiple pregnancies or not stated | 0 | 0 | Mean Difference (IV, Fixed, 95% CI) | 0.0 [0.0, 0.0] |
| Outcome or subgroup title | No. of studies | No. of participants | Statistical method | Effect size |
| 1 Any perinatal death after randomisation Show forest plot | 6 | Risk Ratio (M‐H, Fixed, 95% CI) | Subtotals only | |
| 1.1 SGA/IUGR | 5 | 1292 | Risk Ratio (M‐H, Fixed, 95% CI) | 0.72 [0.38, 1.35] |
| 1.2 Hypertension/pre‐eclampsia | 1 | 89 | Risk Ratio (M‐H, Fixed, 95% CI) | 3.57 [0.42, 30.73] |
| 1.3 Diabetes | 0 | 0 | Risk Ratio (M‐H, Fixed, 95% CI) | 0.0 [0.0, 0.0] |
| 1.4 Prolonged pregnancy | 0 | 0 | Risk Ratio (M‐H, Fixed, 95% CI) | 0.0 [0.0, 0.0] |
| 1.5 Previous pregnancy loss | 1 | 53 | Risk Ratio (M‐H, Fixed, 95% CI) | 0.26 [0.03, 2.17] |
| 2 Serious neonatal morbidity Show forest plot | 1 | 53 | Risk Ratio (M‐H, Random, 95% CI) | 0.0 [0.0, 0.0] |
| 2.1 SGA/IUGR | 0 | 0 | Risk Ratio (M‐H, Random, 95% CI) | 0.0 [0.0, 0.0] |
| 2.2 Hypertension/pre‐eclampsia | 0 | 0 | Risk Ratio (M‐H, Random, 95% CI) | 0.0 [0.0, 0.0] |
| 2.3 Diabetes | 0 | 0 | Risk Ratio (M‐H, Random, 95% CI) | 0.0 [0.0, 0.0] |
| 2.4 Prolonged pregnancy | 0 | 0 | Risk Ratio (M‐H, Random, 95% CI) | 0.0 [0.0, 0.0] |
| 2.5 Previous pregnancy loss | 1 | 53 | Risk Ratio (M‐H, Random, 95% CI) | 0.0 [0.0, 0.0] |
| Outcome or subgroup title | No. of studies | No. of participants | Statistical method | Effect size |
| 1 Any perinatal death after randomisation Show forest plot | 4 | 2813 | Risk Ratio (M‐H, Fixed, 95% CI) | 0.45 [0.17, 1.15] |
| 1.1 Singleton pregnancy | 3 | 1916 | Risk Ratio (M‐H, Fixed, 95% CI) | 0.34 [0.07, 1.68] |
| 1.2 Multiple pregnancy | 0 | 0 | Risk Ratio (M‐H, Fixed, 95% CI) | 0.0 [0.0, 0.0] |
| 1.3 Singleton plus multiple pregnancies or not stated | 1 | 897 | Risk Ratio (M‐H, Fixed, 95% CI) | 0.52 [0.16, 1.73] |
| 2 Stillbirth Show forest plot | 4 | 2813 | Risk Ratio (M‐H, Fixed, 95% CI) | 0.48 [0.14, 1.71] |
| 2.1 Singleton pregnancy | 3 | 1916 | Risk Ratio (M‐H, Fixed, 95% CI) | 0.28 [0.05, 1.70] |
| 2.2 Multiple pregnancy | 0 | 0 | Risk Ratio (M‐H, Fixed, 95% CI) | 0.0 [0.0, 0.0] |
| 2.3 Singleton plus multiple pregnancies or not stated | 1 | 897 | Risk Ratio (M‐H, Fixed, 95% CI) | 1.05 [0.15, 7.41] |
| 3 Neonatal death Show forest plot | 3 | 1473 | Risk Ratio (M‐H, Fixed, 95% CI) | 0.52 [0.16, 1.72] |
| 3.1 Singleton pregnancy | 2 | 576 | Risk Ratio (M‐H, Fixed, 95% CI) | 1.02 [0.15, 7.10] |
| 3.2 Multiple pregnancy | 0 | 0 | Risk Ratio (M‐H, Fixed, 95% CI) | 0.0 [0.0, 0.0] |
| 3.3 Singleton plus multiple pregnancies or not stated | 1 | 897 | Risk Ratio (M‐H, Fixed, 95% CI) | 0.35 [0.07, 1.72] |
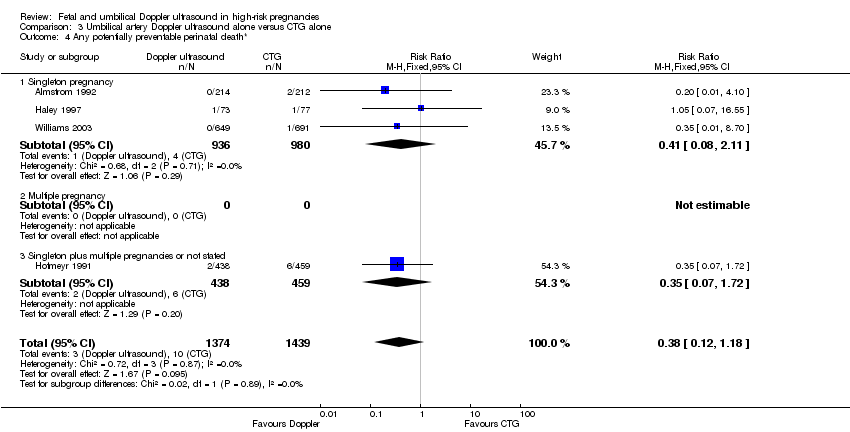
| 4 Any potentially preventable perinatal death* Show forest plot | 4 | 2813 | Risk Ratio (M‐H, Fixed, 95% CI) | 0.38 [0.12, 1.18] |
| 4.1 Singleton pregnancy | 3 | 1916 | Risk Ratio (M‐H, Fixed, 95% CI) | 0.41 [0.08, 2.11] |
| 4.2 Multiple pregnancy | 0 | 0 | Risk Ratio (M‐H, Fixed, 95% CI) | 0.0 [0.0, 0.0] |
| 4.3 Singleton plus multiple pregnancies or not stated | 1 | 897 | Risk Ratio (M‐H, Fixed, 95% CI) | 0.35 [0.07, 1.72] |
| 5 Apgar < 7 at 5 minutes Show forest plot | 3 | 2663 | Risk Ratio (M‐H, Fixed, 95% CI) | 0.86 [0.54, 1.37] |
| 5.1 Singleton pregnancy | 2 | 1766 | Risk Ratio (M‐H, Fixed, 95% CI) | 0.83 [0.49, 1.43] |
| 5.2 Multiple pregnancy | 0 | 0 | Risk Ratio (M‐H, Fixed, 95% CI) | 0.0 [0.0, 0.0] |
| 5.3 Singleton plus multiple pregnancies or not stated | 1 | 897 | Risk Ratio (M‐H, Fixed, 95% CI) | 0.93 [0.36, 2.39] |
| 6 Caesarean section (elective and emergency) Show forest plot | 4 | 2813 | Risk Ratio (M‐H, Fixed, 95% CI) | 0.89 [0.79, 1.01] |
| 6.1 Singleton pregnancy | 3 | 1916 | Risk Ratio (M‐H, Fixed, 95% CI) | 0.89 [0.77, 1.02] |
| 6.2 Multiple pregnancy | 0 | 0 | Risk Ratio (M‐H, Fixed, 95% CI) | 0.0 [0.0, 0.0] |
| 6.3 Singleton plus multiple pregnancies or not stated | 1 | 897 | Risk Ratio (M‐H, Fixed, 95% CI) | 0.91 [0.73, 1.14] |
| 7 Caesarean section ‐ elective Show forest plot | 3 | 1473 | Risk Ratio (M‐H, Fixed, 95% CI) | 1.53 [1.12, 2.09] |
| 7.1 Singleton pregnancy | 2 | 576 | Risk Ratio (M‐H, Fixed, 95% CI) | 1.69 [1.07, 2.67] |
| 7.2 Multiple pregnancy | 0 | 0 | Risk Ratio (M‐H, Fixed, 95% CI) | 0.0 [0.0, 0.0] |
| 7.3 Singleton plus multiple pregnancies or not stated | 1 | 897 | Risk Ratio (M‐H, Fixed, 95% CI) | 1.40 [0.91, 2.15] |
| 8 Caesarean section ‐ emergency Show forest plot | 3 | 1473 | Risk Ratio (M‐H, Fixed, 95% CI) | 0.66 [0.52, 0.84] |
| 8.1 Singleton pregnancy | 2 | 576 | Risk Ratio (M‐H, Fixed, 95% CI) | 0.55 [0.36, 0.83] |
| 8.2 Multiple pregnancy | 0 | 0 | Risk Ratio (M‐H, Fixed, 95% CI) | 0.0 [0.0, 0.0] |
| 8.3 Singleton plus multiple pregnancies or not stated | 1 | 897 | Risk Ratio (M‐H, Fixed, 95% CI) | 0.73 [0.55, 0.98] |
| 9 Spontaneous vaginal birth Show forest plot | 2 | 1323 | Risk Ratio (M‐H, Fixed, 95% CI) | 1.06 [0.97, 1.15] |
| 9.1 Singleton pregnancy | 1 | 426 | Risk Ratio (M‐H, Fixed, 95% CI) | 1.04 [0.91, 1.19] |
| 9.2 Multiple pregnancy | 0 | 0 | Risk Ratio (M‐H, Fixed, 95% CI) | 0.0 [0.0, 0.0] |
| 9.3 Singleton plus multiple pregnancies or not stated | 1 | 897 | Risk Ratio (M‐H, Fixed, 95% CI) | 1.06 [0.95, 1.19] |
| 10 Operative vaginal birth Show forest plot | 3 | 2663 | Risk Ratio (M‐H, Fixed, 95% CI) | 0.98 [0.81, 1.17] |
| 10.1 Singleton pregnancy | 2 | 1766 | Risk Ratio (M‐H, Fixed, 95% CI) | 1.01 [0.80, 1.27] |
| 10.2 Multiple pregnancy | 0 | 0 | Risk Ratio (M‐H, Fixed, 95% CI) | 0.0 [0.0, 0.0] |
| 10.3 Singleton plus multiple pregnancies or not stated | 1 | 897 | Risk Ratio (M‐H, Fixed, 95% CI) | 0.92 [0.68, 1.25] |
| 11 Induction of labour Show forest plot | 2 | 576 | Risk Ratio (M‐H, Random, 95% CI) | 0.67 [0.32, 1.40] |
| 11.1 Singleton pregnancy | 2 | 576 | Risk Ratio (M‐H, Random, 95% CI) | 0.67 [0.32, 1.40] |
| 11.2 Multiple pregnancy | 0 | 0 | Risk Ratio (M‐H, Random, 95% CI) | 0.0 [0.0, 0.0] |
| 11.3 Singleton plus multiple pregnancies or not stated | 0 | 0 | Risk Ratio (M‐H, Random, 95% CI) | 0.0 [0.0, 0.0] |
| 12 Infant requiring intubation/ventilation Show forest plot | 2 | 576 | Risk Ratio (M‐H, Fixed, 95% CI) | 1.54 [0.26, 9.08] |
| 12.1 Singleton pregnancy | 2 | 576 | Risk Ratio (M‐H, Fixed, 95% CI) | 1.54 [0.26, 9.08] |
| 12.2 Multiple pregnancy | 0 | 0 | Risk Ratio (M‐H, Fixed, 95% CI) | 0.0 [0.0, 0.0] |
| 12.3 Singleton plus multiple pregnancies or not stated | 0 | 0 | Risk Ratio (M‐H, Fixed, 95% CI) | 0.0 [0.0, 0.0] |
| 13 Neonatal fitting/seizures Show forest plot | 1 | 150 | Risk Ratio (M‐H, Fixed, 95% CI) | 0.35 [0.01, 8.49] |
| 13.1 Singleton pregnancy | 1 | 150 | Risk Ratio (M‐H, Fixed, 95% CI) | 0.35 [0.01, 8.49] |
| 13.2 Multiple pregnancy | 0 | 0 | Risk Ratio (M‐H, Fixed, 95% CI) | 0.0 [0.0, 0.0] |
| 13.3 Singleton plus multiple pregnancies or not stated | 0 | 0 | Risk Ratio (M‐H, Fixed, 95% CI) | 0.0 [0.0, 0.0] |
| 14 Gestational age at birth Show forest plot | 3 | 1473 | Mean Difference (IV, Fixed, 95% CI) | 0.23 [‐0.00, 0.47] |
| 14.1 Singleton pregnancy | 2 | 576 | Mean Difference (IV, Fixed, 95% CI) | 0.26 [‐0.06, 0.59] |
| 14.2 Multiple pregnancy | 0 | 0 | Mean Difference (IV, Fixed, 95% CI) | 0.0 [0.0, 0.0] |
| 14.3 Singleton plus multiple pregnancies or not stated | 1 | 897 | Mean Difference (IV, Fixed, 95% CI) | 0.20 [‐0.15, 0.55] |
| 15 Neonatal admission to SCBU and/or NICU Show forest plot | 4 | 2813 | Risk Ratio (M‐H, Fixed, 95% CI) | 0.87 [0.73, 1.03] |
| 15.1 Singleton pregnancy | 3 | 1916 | Risk Ratio (M‐H, Fixed, 95% CI) | 0.80 [0.64, 0.99] |
| 15.2 Multiple pregnancy | 0 | 0 | Risk Ratio (M‐H, Fixed, 95% CI) | 0.0 [0.0, 0.0] |
| 15.3 Singleton plus multiple pregnancies or not stated | 1 | 897 | Risk Ratio (M‐H, Fixed, 95% CI) | 1.00 [0.73, 1.37] |
| 16 Infant birthweight (grams) Show forest plot | 4 | 2813 | Mean Difference (IV, Fixed, 95% CI) | 38.41 [‐6.14, 82.97] |
| 16.1 Singleton pregnancy | 3 | 1916 | Mean Difference (IV, Fixed, 95% CI) | 49.34 [‐0.62, 99.31] |
| 16.2 Multiple pregnancy | 0 | 0 | Mean Difference (IV, Fixed, 95% CI) | 0.0 [0.0, 0.0] |
| 16.3 Singleton plus multiple pregnancies or not stated | 1 | 897 | Mean Difference (IV, Fixed, 95% CI) | ‐4.0 [‐102.42, 94.42] |
| 17 Length of infant hospital stay (days) Show forest plot | 2 | 576 | Std. Mean Difference (IV, Fixed, 95% CI) | ‐0.25 [‐0.41, ‐0.08] |
| 17.1 Singleton pregnancy | 2 | 576 | Std. Mean Difference (IV, Fixed, 95% CI) | ‐0.25 [‐0.41, ‐0.08] |
| 17.2 Multiple pregnancy | 0 | 0 | Std. Mean Difference (IV, Fixed, 95% CI) | 0.0 [0.0, 0.0] |
| 17.3 Singleton plus multiple pregnancies or not stated | 0 | 0 | Std. Mean Difference (IV, Fixed, 95% CI) | 0.0 [0.0, 0.0] |
| 18 Antenatal admissions (not prespecified) Show forest plot | 1 | 426 | Risk Ratio (M‐H, Fixed, 95% CI) | 0.70 [0.55, 0.90] |
| 18.1 Singleton pregnancy | 1 | 426 | Risk Ratio (M‐H, Fixed, 95% CI) | 0.70 [0.55, 0.90] |
| 18.2 Multiple pregnancy | 0 | 0 | Risk Ratio (M‐H, Fixed, 95% CI) | 0.0 [0.0, 0.0] |
| 18.3 Singleton plus multiple pregnancies or not stated | 0 | 0 | Risk Ratio (M‐H, Fixed, 95% CI) | 0.0 [0.0, 0.0] |
| 19 Phototherapy for neonatal jaundice (not prespecified) Show forest plot | 1 | 150 | Risk Ratio (M‐H, Fixed, 95% CI) | 0.15 [0.01, 2.87] |
| 19.1 Singleton pregnancy | 1 | 150 | Risk Ratio (M‐H, Fixed, 95% CI) | 0.15 [0.01, 2.87] |
| 19.2 Multiple pregnancy | 0 | 0 | Risk Ratio (M‐H, Fixed, 95% CI) | 0.0 [0.0, 0.0] |
| 19.3 Singleton plus multiple pregnancies or not stated | 0 | 0 | Risk Ratio (M‐H, Fixed, 95% CI) | 0.0 [0.0, 0.0] |
| 20 Antenatal hospital stay (days) (not prespecified) Show forest plot | 1 | 426 | Mean Difference (IV, Fixed, 95% CI) | ‐0.60 [‐2.39, 1.19] |
| 20.1 Singleton pregnancy | 1 | 426 | Mean Difference (IV, Fixed, 95% CI) | ‐0.60 [‐2.39, 1.19] |
| 20.2 Multiple pregnancy | 0 | 0 | Mean Difference (IV, Fixed, 95% CI) | 0.0 [0.0, 0.0] |
| 20.3 Singleton plus multiple pregnancies or not stated | 0 | 0 | Mean Difference (IV, Fixed, 95% CI) | 0.0 [0.0, 0.0] |
| Outcome or subgroup title | No. of studies | No. of participants | Statistical method | Effect size |
| 1 Any perinatal death after randomisation Show forest plot | 3 | Risk Ratio (M‐H, Fixed, 95% CI) | Subtotals only | |
| 1.1 SGA/IUGR | 2 | 572 | Risk Ratio (M‐H, Fixed, 95% CI) | 0.33 [0.05, 2.09] |
| 1.2 Hypertension/pre‐eclampsia | 1 | 89 | Risk Ratio (M‐H, Fixed, 95% CI) | 3.57 [0.42, 30.73] |
| 1.3 Diabetes | 0 | 0 | Risk Ratio (M‐H, Fixed, 95% CI) | 0.0 [0.0, 0.0] |
| 1.4 Prolonged pregnancy | 0 | 0 | Risk Ratio (M‐H, Fixed, 95% CI) | 0.0 [0.0, 0.0] |
| 1.5 Previous pregnancy loss | 0 | 0 | Risk Ratio (M‐H, Fixed, 95% CI) | 0.0 [0.0, 0.0] |
| Outcome or subgroup title | No. of studies | No. of participants | Statistical method | Effect size |
| 1 Any perinatal death after randomisation Show forest plot | 1 | 333 | Risk Ratio (M‐H, Fixed, 95% CI) | 0.84 [0.39, 1.82] |
| 1.1 Singleton pregnancy | 1 | 333 | Risk Ratio (M‐H, Fixed, 95% CI) | 0.84 [0.39, 1.82] |
| 2 Survival following severe neonatal morbidity Show forest plot | 1 | 333 | Risk Ratio (M‐H, Fixed, 95% CI) | 1.10 [0.75, 1.61] |
| 3 Stillbirth Show forest plot | 1 | 333 | Risk Ratio (M‐H, Fixed, 95% CI) | 1.99 [0.37, 10.71] |
| 3.1 Singleton pregnancy | 1 | 333 | Risk Ratio (M‐H, Fixed, 95% CI) | 1.99 [0.37, 10.71] |
| 4 Neonatal death Show forest plot | 1 | 333 | Risk Ratio (M‐H, Fixed, 95% CI) | 0.60 [0.22, 1.60] |
| 4.1 Singleton pregnancy | 1 | 333 | Risk Ratio (M‐H, Fixed, 95% CI) | 0.60 [0.22, 1.60] |
| 5 Any potentially preventable perinatal death* Show forest plot | 1 | 333 | Risk Ratio (M‐H, Fixed, 95% CI) | 0.83 [0.37, 1.86] |
| 5.1 Singleton pregnancy | 1 | 333 | Risk Ratio (M‐H, Fixed, 95% CI) | 0.83 [0.37, 1.86] |
| 6 Fetal acidosis Show forest plot | 1 | 333 | Risk Ratio (M‐H, Fixed, 95% CI) | 0.25 [0.03, 2.20] |
| 6.1 Singleton pregnancy | 1 | 333 | Risk Ratio (M‐H, Fixed, 95% CI) | 0.25 [0.03, 2.20] |
| 7 Apgar < 7 at 5 minutes Show forest plot | 1 | 333 | Risk Ratio (M‐H, Fixed, 95% CI) | 0.87 [0.44, 1.72] |
| 7.1 Singleton pregnancy | 1 | 333 | Risk Ratio (M‐H, Fixed, 95% CI) | 0.87 [0.44, 1.72] |
| 8 Infant requiring intubation/ventilation Show forest plot | 1 | 333 | Risk Ratio (M‐H, Random, 95% CI) | 0.87 [0.67, 1.13] |
| 8.1 Singleton pregnancy | 1 | 333 | Risk Ratio (M‐H, Random, 95% CI) | 0.87 [0.67, 1.13] |
| 9 Intraventricular haemorrhage Show forest plot | 1 | 333 | Risk Ratio (M‐H, Fixed, 95% CI) | 8.95 [0.49, 164.87] |
| 9.1 Singleton pregnancy | 1 | 333 | Risk Ratio (M‐H, Fixed, 95% CI) | 8.95 [0.49, 164.87] |
| 10 Bronchopulmonary dysplasia Show forest plot | 1 | 333 | Risk Ratio (M‐H, Fixed, 95% CI) | 0.87 [0.55, 1.38] |
| 10.1 Singleton pregnancy | 1 | 333 | Risk Ratio (M‐H, Fixed, 95% CI) | 0.87 [0.55, 1.38] |
| 11 Necrotising enterocolitis Show forest plot | 1 | 333 | Risk Ratio (M‐H, Fixed, 95% CI) | 0.33 [0.03, 3.15] |
| 11.1 Singleton pregnancy | 1 | 333 | Risk Ratio (M‐H, Fixed, 95% CI) | 0.33 [0.03, 3.15] |
| 12 Infant birthweight (grams) Show forest plot | 1 | 333 | Mean Difference (IV, Fixed, 95% CI) | 38.0 [‐31.53, 107.53] |
| 12.1 Singleton pregnancy | 1 | 333 | Mean Difference (IV, Fixed, 95% CI) | 38.0 [‐31.53, 107.53] |
| 13 Long‐term infant neurodevelopmental outcome (impairment at 2 years) Show forest plot | 1 | 333 | Risk Ratio (M‐H, Fixed, 95% CI) | 0.60 [0.30, 1.18] |
| 13.1 Singleton pregnancy | 1 | 333 | Risk Ratio (M‐H, Fixed, 95% CI) | 0.60 [0.30, 1.18] |
| 14 Long‐term infant neurodevelopmental outcome (cerebral palsy at 2 years) Show forest plot | 1 | 333 | Risk Ratio (M‐H, Fixed, 95% CI) | 0.20 [0.02, 1.68] |
| 14.1 Singleton pregnancy | 1 | 333 | Risk Ratio (M‐H, Fixed, 95% CI) | 0.20 [0.02, 1.68] |
| 15 Infant survival at 2 years without neurodevelopmental impairment (not prespecified) Show forest plot | 1 | 333 | Risk Ratio (M‐H, Fixed, 95% CI) | 1.07 [0.92, 1.23] |
| 15.1 Singleton pregnancy | 1 | 333 | Risk Ratio (M‐H, Fixed, 95% CI) | 1.07 [0.92, 1.23] |
| 16 Sepsis (proven) (not prespecified) Show forest plot | 1 | 333 | Risk Ratio (M‐H, Fixed, 95% CI) | 0.93 [0.60, 1.45] |
| 16.1 Singleton pregnancy | 1 | 333 | Risk Ratio (M‐H, Fixed, 95% CI) | 0.93 [0.60, 1.45] |
| Outcome or subgroup title | No. of studies | No. of participants | Statistical method | Effect size |
| 1 Any perinatal death after randomisation Show forest plot | 1 | 336 | Risk Ratio (M‐H, Fixed, 95% CI) | 1.28 [0.64, 2.55] |
| 1.1 Singleton pregnancy | 1 | 336 | Risk Ratio (M‐H, Fixed, 95% CI) | 1.28 [0.64, 2.55] |
| 2 Survival following severe neonatal morbidity Show forest plot | 1 | 336 | Risk Ratio (M‐H, Fixed, 95% CI) | 0.98 [0.66, 1.45] |
| 3 Stillbirth Show forest plot | 1 | 336 | Risk Ratio (M‐H, Fixed, 95% CI) | 2.93 [0.60, 14.31] |
| 3.1 Singleton pregnancy | 1 | 336 | Risk Ratio (M‐H, Fixed, 95% CI) | 2.93 [0.60, 14.31] |
| 4 Neonatal death Show forest plot | 1 | 336 | Risk Ratio (M‐H, Fixed, 95% CI) | 1.07 [0.47, 2.46] |
| 4.1 Singleton pregnancy | 1 | 336 | Risk Ratio (M‐H, Fixed, 95% CI) | 1.07 [0.47, 2.46] |
| 5 Any potentially preventable perinatal death* Show forest plot | 1 | 336 | Risk Ratio (M‐H, Fixed, 95% CI) | 1.22 [0.59, 2.53] |
| 5.1 Singleton pregnancy | 1 | 336 | Risk Ratio (M‐H, Fixed, 95% CI) | 1.22 [0.59, 2.53] |
| 6 Fetal acidosis Show forest plot | 1 | 336 | Risk Ratio (M‐H, Fixed, 95% CI) | 0.11 [0.01, 2.00] |
| 6.1 Singleton pregnancy | 1 | 336 | Risk Ratio (M‐H, Fixed, 95% CI) | 0.11 [0.01, 2.00] |
| 7 Apgar < 7 at 5 minutes Show forest plot | 1 | 336 | Risk Ratio (M‐H, Fixed, 95% CI) | 1.28 [0.69, 2.37] |
| 7.1 Singleton pregnancy | 1 | 336 | Risk Ratio (M‐H, Fixed, 95% CI) | 1.28 [0.69, 2.37] |
| 8 Infant requiring intubation/ventilation Show forest plot | 1 | 336 | Risk Ratio (M‐H, Random, 95% CI) | 0.94 [0.73, 1.20] |
| 8.1 Singleton pregnancy | 1 | 336 | Risk Ratio (M‐H, Random, 95% CI) | 0.94 [0.73, 1.20] |
| 9 Intraventricular haemorrhage Show forest plot | 1 | 336 | Risk Ratio (M‐H, Fixed, 95% CI) | 16.60 [0.97, 285.35] |
| 9.1 Singleton pregnancy | 1 | 336 | Risk Ratio (M‐H, Fixed, 95% CI) | 16.60 [0.97, 285.35] |
| 10 Bronchopulmonary dysplasia Show forest plot | 1 | 336 | Risk Ratio (M‐H, Fixed, 95% CI) | 0.95 [0.61, 1.48] |
| 10.1 Singleton pregnancy | 1 | 336 | Risk Ratio (M‐H, Fixed, 95% CI) | 0.95 [0.61, 1.48] |
| 11 Necrotising enterocolitis Show forest plot | 1 | 336 | Risk Ratio (M‐H, Fixed, 95% CI) | 0.98 [0.20, 4.77] |
| 11.1 Singleton pregnancy | 1 | 336 | Risk Ratio (M‐H, Fixed, 95% CI) | 0.98 [0.20, 4.77] |
| 12 Infant birthweight (grams) Show forest plot | 1 | 336 | Mean Difference (IV, Fixed, 95% CI) | 25.0 [‐40.06, 90.06] |
| 12.1 Singleton pregnancy | 1 | 336 | Mean Difference (IV, Fixed, 95% CI) | 25.0 [‐40.06, 90.06] |
| 13 Long‐term infant neurodevelopmental outcome (impairment at 2 years) Show forest plot | 1 | 336 | Risk Ratio (M‐H, Fixed, 95% CI) | 0.34 [0.15, 0.79] |
| 13.1 Singleton pregnancy | 1 | 336 | Risk Ratio (M‐H, Fixed, 95% CI) | 0.34 [0.15, 0.79] |
| 14 Long‐term infant neurodevelopmental outcome (cerebral palsy at 2 years) Show forest plot | 1 | 336 | Risk Ratio (M‐H, Fixed, 95% CI) | 0.09 [0.00, 1.59] |
| 14.1 Singleton pregnancy | 1 | 336 | Risk Ratio (M‐H, Fixed, 95% CI) | 0.09 [0.00, 1.59] |
| 15 Infant survival at 2 years without neurodevelopmental impairment (not prespecified) Show forest plot | 1 | 336 | Risk Ratio (M‐H, Fixed, 95% CI) | 1.17 [1.02, 1.34] |
| 15.1 Singleton pregnancy | 1 | 336 | Risk Ratio (M‐H, Fixed, 95% CI) | 1.17 [1.02, 1.34] |
| 16 Sepsis (proven) (not prespecified) Show forest plot | 1 | 336 | Risk Ratio (M‐H, Fixed, 95% CI) | 0.68 [0.42, 1.11] |
| 16.1 Singleton pregnancy | 1 | 336 | Risk Ratio (M‐H, Fixed, 95% CI) | 0.68 [0.42, 1.11] |
| Outcome or subgroup title | No. of studies | No. of participants | Statistical method | Effect size |
| 1 Any perinatal death after randomisation Show forest plot | 1 | 337 | Risk Ratio (M‐H, Fixed, 95% CI) | 0.66 [0.32, 1.36] |
| 1.1 Singleton pregnancy | 1 | 337 | Risk Ratio (M‐H, Fixed, 95% CI) | 0.66 [0.32, 1.36] |
| 2 Survival following severe neonatal morbidity Show forest plot | 1 | 337 | Risk Ratio (M‐H, Fixed, 95% CI) | 1.13 [0.77, 1.65] |
| 3 Stillbirth Show forest plot | 1 | 337 | Risk Ratio (M‐H, Fixed, 95% CI) | 0.68 [0.20, 2.36] |
| 3.1 Singleton pregnancy | 1 | 337 | Risk Ratio (M‐H, Fixed, 95% CI) | 0.68 [0.20, 2.36] |
| 4 Neonatal death Show forest plot | 1 | 337 | Risk Ratio (M‐H, Fixed, 95% CI) | 0.56 [0.21, 1.47] |
| 4.1 Singleton pregnancy | 1 | 337 | Risk Ratio (M‐H, Fixed, 95% CI) | 0.56 [0.21, 1.47] |
| 5 Any potentially preventable perinatal death* Show forest plot | 1 | 337 | Risk Ratio (M‐H, Fixed, 95% CI) | 0.68 [0.31, 1.47] |
| 5.1 Singleton pregnancy | 1 | 337 | Risk Ratio (M‐H, Fixed, 95% CI) | 0.68 [0.31, 1.47] |
| 6 Fetal acidosis Show forest plot | 1 | 337 | Risk Ratio (M‐H, Fixed, 95% CI) | 3.05 [0.13, 74.43] |
| 6.1 Singleton pregnancy | 1 | 337 | Risk Ratio (M‐H, Fixed, 95% CI) | 3.05 [0.13, 74.43] |
| 7 Apgar < 7 at 5 minutes Show forest plot | 1 | 337 | Risk Ratio (M‐H, Fixed, 95% CI) | 0.68 [0.36, 1.29] |
| 7.1 Singleton pregnancy | 1 | 337 | Risk Ratio (M‐H, Fixed, 95% CI) | 0.68 [0.36, 1.29] |
| 8 Infant requiring intubation/ventilation Show forest plot | 1 | 337 | Risk Ratio (M‐H, Random, 95% CI) | 0.93 [0.71, 1.21] |
| 8.1 Singleton pregnancy | 1 | 337 | Risk Ratio (M‐H, Random, 95% CI) | 0.93 [0.71, 1.21] |
| 9 Intraventricular haemorrhage Show forest plot | 1 | 337 | Risk Ratio (M‐H, Fixed, 95% CI) | 0.51 [0.16, 1.66] |
| 9.1 Singleton pregnancy | 1 | 337 | Risk Ratio (M‐H, Fixed, 95% CI) | 0.51 [0.16, 1.66] |
| 10 Bronchopulmonary dysplasia Show forest plot | 1 | 337 | Risk Ratio (M‐H, Fixed, 95% CI) | 0.92 [0.58, 1.46] |
| 10.1 Singleton pregnancy | 1 | 337 | Risk Ratio (M‐H, Fixed, 95% CI) | 0.92 [0.58, 1.46] |
| 11 Necrotising enterocolitis Show forest plot | 1 | 337 | Risk Ratio (M‐H, Fixed, 95% CI) | 0.34 [0.04, 3.23] |
| 11.1 Singleton pregnancy | 1 | 337 | Risk Ratio (M‐H, Fixed, 95% CI) | 0.34 [0.04, 3.23] |
| 12 Infant birthweight (grams) Show forest plot | 1 | 337 | Mean Difference (IV, Fixed, 95% CI) | 13.0 [‐59.31, 85.31] |
| 12.1 Singleton pregnancy | 1 | 337 | Mean Difference (IV, Fixed, 95% CI) | 13.0 [‐59.31, 85.31] |
| 13 Long‐term infant neurodevelopmental outcome (impairment at 2 years) Show forest plot | 1 | 337 | Risk Ratio (M‐H, Fixed, 95% CI) | 1.75 [0.70, 4.32] |
| 13.1 Singleton pregnancy | 1 | 337 | Risk Ratio (M‐H, Fixed, 95% CI) | 1.75 [0.70, 4.32] |
| 14 Long‐term infant neurodevelopmental outcome (cerebral palsy at 2 years) Show forest plot | 1 | 337 | Risk Ratio (M‐H, Fixed, 95% CI) | 3.05 [0.13, 74.43] |
| 14.1 Singleton pregnancy | 1 | 337 | Risk Ratio (M‐H, Fixed, 95% CI) | 3.05 [0.13, 74.43] |
| 15 Infant survival at 2 years without neurodevelopmental impairment (not prespecified) Show forest plot | 1 | 337 | Risk Ratio (M‐H, Fixed, 95% CI) | 0.91 [0.80, 1.03] |
| 15.1 Singleton pregnancy | 1 | 337 | Risk Ratio (M‐H, Fixed, 95% CI) | 0.91 [0.80, 1.03] |
| 16 Sepsis (proven) (not prespecified) Show forest plot | 1 | 337 | Risk Ratio (M‐H, Fixed, 95% CI) | 1.37 [0.84, 2.25] |
| 16.1 Singleton pregnancy | 1 | 337 | Risk Ratio (M‐H, Fixed, 95% CI) | 1.37 [0.84, 2.25] |