L’échographie Doppler fœtale et ombilicale dans les grossesses à risques
Résumé scientifique
Contexte
Les anomalies de la circulation sanguine du fœtus détectées par échographie Doppler peuvent indiquer un mauvais pronostic fœtal. Il est également possible que des faux positifs de l'échographie Doppler puissent entraîner des résultats négatifs dû à des interventions inutiles, dont l'accouchement prématuré.
Objectifs
L'objectif de cette revue était d'évaluer les effets de l'échographie Doppler, utilisée pour estimer le bien‐être du fœtus dans les grossesses à haut risque, sur les soins obstétriques et les critère de jugement cliniques du fœtus.
Stratégie de recherche documentaire
Nous avons mis à jour la recherche dans le registre des essais du groupe Cochrane sur la grossesse et l’accouchement le 31 mars 2017 et vérifié les listes de référence des études extraites.
Critères de sélection
Nous avons inclus les essais contrôlés randomisés et quasi‐randomisés portant sur l'investigation par échographie Doppler des vaisseaux fœtaux et ombilicaux dans les grossesses à haut risque, comparés avec la non utilisation de l'échographie Doppler. Les essais randomisés en grappes étaient également éligibles, mais aucun n'a été identifié.
Recueil et analyse des données
Deux auteurs de la revue ont indépendamment évalué les études en vue de leur l'inclusion, évalué les risques de biais et extrait les données. Les données saisies ont été vérifiées. Nous avons évalué la qualité des données probantes en utilisant l'approche GRADE.
Résultats principaux
Dix‐neuf essais impliquant 10 667 femmes ont été inclus. Le risque de biais dans les essais était difficile à évaluer avec précision en raison de rapports incomplets. Aucune des données relatives à nos principaux critères de jugement n'a été jugée de grande qualité. La qualité des données probantes a été dégradée en raison du manque d'information sur les méthodes d'essai, de l'imprécision des estimations des risques et de l'hétérogénéité. Dix‐huit de ces études ont comparé l'utilisation de l'échographie Doppler de l'artère ombilicale du fœtus à l'absence de Doppler ou à la cardiotocographie (CTG). Un essai plus récent a comparé l'examen Doppler d'autres vaisseaux sanguins fœtaux (ductus venosus) avec la CTG par ordinateur.
L'utilisation de l'échographie Doppler de l'artère ombilicale dans les grossesses à haut risque a été associée à moins de décès périnatals (risque relatif (RR)) 0,71, intervalle de confiance (IC) à 95 % (IC) 0,52 à 0,98, 16 études, 10 225 fœtus, 1,2 % contre 1,7 %, nombre de sujets à traiter (NST) = 203 ; IC à 95 % 103 à 4352, résultats modérés). Les résultats pour les mort‐nés étaient cohérents avec le taux global de mortalité périnatale, bien qu'il n'y ait pas de différence claire entre les groupes pour ce critère de jugement (RR 0,65, IC à 95 % : 0,41 à 1,04 ; 15 études, 9560 fœtus, résultats faibles). Lorsque l'échographie Doppler a été utilisée, on a observé moins de déclenchements artificiels du travail (RR moyen de 0,89, IC à 95 % de 0,80 à 0,99, 10 études, 5633 femmes, effets aléatoires, données de qualité modérée) et moins de césariennes (RR 0,90, IC à 95 % de 0,84 à 0,97, 14 études, 7918 femmes, données de qualité modérée). Il n'y a pas eu de suivi comparatif à long terme des bébés suite à une échographie Doppler pendant la grossesse de femmes présentant un risque accru de complications.
Aucune différence n'a été observée dans les accouchements opératoires par voie basse (RR 0,95, IC à 95%, 0,80 à 1,14, quatre études, 2 813 femmes), ni dans les scores d'Apgar inférieurs à sept à cinq minutes de vie (RR 0,92, IC à 95%, 0,69 à 1,24, sept études, 6 321 bébés, résultats de faible valeur). Les données sur la morbidité néonatale grave n'ont pas été regroupées en raison de l'hétérogénéité élevée entre les trois études qui l'ont signalée (1 098 bébés) (les données probantes étaient très faibles).
L'utilisation du Doppler pour évaluer les changements précoces et tardifs du conduit veineux lors de retard de croissance intra‐utérin précoce n'a pas été associée à des différences significatives dans la mortalité périnatale globale après randomisation. Cependant, on a observé une amélioration des résultats neurologiques à long terme chez le groupe de bébés dont le déclenchement artificiel de l’accouchement était dû soit à des changements tardifs dans le conduit veineux, soit à des anomalies observées sur CTG informatisé.
Conclusions des auteurs
Les données probantes actuelles suggèrent que l'utilisation de l'échographie Doppler sur l'artère ombilicale dans les grossesses à haut risque réduit le risque de décès périnatal et peut potentiellement entraîner une diminution des interventions obstétricales. Toutefois, les résultats doivent être interprétés avec prudence, car les données probantes ne sont pas de grande qualité. La surveillance en série des changements Doppler dans le canal veineux peut potentiellement être bénéfique, mais d'autres études de grande qualité avec un suivi incluant le développement neurologique sont nécessaires pour que les données probantes soient concluantes.
PICO
Résumé simplifié
L'échographie Doppler des vaisseaux fœtaux dans les grossesses à risque élevé
Quelle est la problématique ?
Dans les pays à revenu élevé, la plupart des fœtus se développe bien dans l'utérus. Cependant, lorsque la mère présente un problème médical, tel que du diabète, de l’hypertension artérielle, des problèmes cardiaques ou rénaux, ou encore une mauvaise formation du placenta, cela peut affecter le développement du fœtus. Il arrive aussi parfois que les fœtus ne se développent pas correctement pour des raisons que nous ne comprenons pas parfaitement. Les fœtus présentant un retard de croissance sont plus susceptibles de développer des complications pouvant donner lieu à des maladies ou à la mort du fœtus. L'échographie Doppler détecte les anomalies d’écoulement du sang dans les vaisseaux sanguins du fœtus. Ces anomalies peuvent permettre d'identifier les fœtus qui présent des problèmes.
Pourquoi est‐ce important ?
Si les fœtus présentant des problèmes de croissance sont identifiés, des interventions comme l'accouchement précoce pourraient potentiellement aider à prévenir les maladies graves et la mort. Toutefois, l'utilisation de l'échographie Doppler pourrait augmenter le nombre d'interventions comme la césarienne.
Quelles données probantes avons‐nous trouvées ?
Nous avons cherché des données probantes en mars 2017. Nous avons trouvé 19 essais impliquant plus de 10 000 femmes. Dix‐huit de ces études ont comparé l'utilisation de l'échographie Doppler de l'artère ombilicale du fœtus à naître avec l’absence d’échographie Doppler ou avec la cardiotocographie (CTG, ou monitoring fœtal) Un essai plus récent a comparé l'examen Doppler de d'autres vaisseaux sanguins fœtaux (ductus venosus) avec la cardiotocographie informatisée (variation à court terme).
La qualité des données probantes tirées des études incluses a été jugée de modérée à très faible en raison de rapports incomplets sur les méthodes employées et de l'incertitude des résultats. Lorsque la qualité des données probantes est faible voire très faible, des recherches futures pourraient démentir les présents résultats dont nous ne pouvons pas garantir la certitude.
Les résultats ont montré que l'échographie Doppler de l'artère ombilicale peut potentiellement réduire les cas de mortalité périnatale et entraîner une diminution du nombre de césariennes et de déclenchements artificiels du travail. Il n'y avait pas de différence claire dans le nombre de mort‐nés, de naissances avec forceps ou ventouse, ou de bébés ayant un faible score d'Apgar cinq minutes après la naissance. Les conclusions relatives aux problèmes graves chez le nouveau‐né n'étaient pas cohérentes entre les différentes études. Chez les fœtus présentant un retard de croissance, lorsque la décision de déclencher l'accouchement était fondée sur des modifications tardives du canal veineux ou sur des anomalies de la CTG informatisée, cela semblait améliorer les résultats développementaux à long terme (deux ans).
Qu’est‐ce que cela signifie ?
L'échographie Doppler dans les grossesses à haut risque semble réduire les cas de mortalité périnatale, et peut également potentiellement mener à moins d'interventions obstétricales. Toutefois, les données probantes étaient de qualité moyenne à très faible. D'autres études de haute qualité avec un suivi à long terme nous aideraient à être plus sûrs.
Authors' conclusions
Summary of findings
| Umbilical artery Doppler ultrasound compared to no Doppler ultrasound in high‐risk pregnancies | ||||||
| Patient or population: pregnant women at increased risk of fetal complications | ||||||
| Outcomes | Anticipated absolute effects* (95% CI) | Relative effect | № of participants | Quality of the evidence | Comments | |
| Risk with no Doppler ultrasound | Risk with umbilical artery Doppler ultrasound | |||||
| Any perinatal death after randomisation | Study population | RR 0.71 | 10225 | ⊕⊕⊕⊝ | ||
| 17 per 1000 | 12 per 1000 | |||||
| Serious neonatal morbidity | Study population | 1098 | ⊕⊝⊝⊝ | We did not pool the data for this outcome due to high heterogeneity (the direction of effect in the 2 studies contributing data were not consistent). | ||
| Stillbirth | Study population | RR 0.65 | 9560 | ⊕⊕⊝⊝ | ||
| 9 per 1000 | 6 per 1000 | |||||
| Apgar < 7 at 5 minutes | Study population | RR 0.92 | 6321 | ⊕⊕⊝⊝ | ||
| 29 per 1000 | 26 per 1000 | |||||
| Caesarean section (elective and emergency) | Study population | RR 0.90 | 7918 | ⊕⊕⊕⊝ | ||
| 263 per 1000 | 237 per 1000 | |||||
| Induction of labour | Study population | RR 0.89 | 5633 | ⊕⊕⊕⊝ | ||
| 334 per 1000 | 298 per 1000 | |||||
| Long‐term infant neurodevelopmental outcome (impairment at 2 years) | Study population | ‐ | (0 studies) | ‐ | There has been no comparative long‐term follow‐up of babies exposed to Doppler ultrasound in pregnancy in women at increased risk of complications. | |
| see comment | see comment | |||||
| *The risk in the intervention group (and its 95% confidence interval) is based on the assumed risk in the comparison group and the relative effect of the intervention (and its 95% CI). | ||||||
| GRADE Working Group grades of evidence | ||||||
| 1 All studies assessed as having design limitations due to lack of information. 2 Although there was some evidence of funnel plot asymmetry suggesting small‐study effect (with studies with smaller sample sizes appearing to have a more pronounced effect), we did not downgrade for publication bias because, for our selected outcomes, individual studies did not reach statistical significance and there was low heterogeneity across all studies for this outcome. 3 High heterogeneity (I² statistic 76%) with direction of effect different in the 2 studies contributing data. 4 95% CI crossing the line of no effect. Low event rate. 5 Wide 95% CI crossing the line of no effect. | ||||||
Background
The previous version of this review (Neilson 1996) was split into two separate reviews, for which new protocols were prepared. This present review covers Doppler ultrasound of fetal vessels including umbilical arteries in women at high risk of fetal compromise. The other review covers Doppler ultrasound of utero‐placental circulation (Utero‐placental Doppler ultrasound for improving pregnancy outcome;Stampalija 2010). In addition, we will update the review of 'routine' use of Doppler ultrasound in low‐risk pregnant women (Fetal and umbilical Doppler ultrasound in normal pregnancy;Alfirevic 2015).
Description of the condition
When it comes to the provision of antenatal care or research, pregnant women tend to be divided into low‐ and high‐risk populations; however, the boundaries between the groups are often blurred. For most researchers, ‘high‐risk status’ includes maternal conditions associated with increased perinatal mortality and morbidity such as diabetes, hypertensive disorders (chronic hypertension and pre‐eclampsia), cardiac, renal, and autoimmune disorders (Fisk 2001; Graves 2007; Westergaard 2001). More recently, thrombophilias (congenital and acquired) have been added to this list (Alfirevic 2002; Greer 1999).
Of the conditions specific to pregnancy, fetal growth restriction, antepartum haemorrhage, multiple pregnancy, and prolonged pregnancy tend to be regarded as ‘high risk’ (Bernstein 2000; Westergaard 2001).
It is important to stress that fetal growth restriction is often confused with the concept of being small‐for‐gestational age. Some fetuses are constitutionally small and they do not have increased perinatal morbidity and mortality. Our inability to distinguish easily between small, but healthy fetuses and those who are failing to reach their growth potential has hampered attempts to find appropriate treatment for growth restriction. Growth‐restricted fetuses, who may or may not be small‐for‐dates are at increased risk of mortality and serious morbidity (intraventricular haemorrhage, bronchopulmonary dysplasia, necrotising enterocolitis, infection, pulmonary haemorrhage, hypothermia and hypoglycaemia) (Fisk 2001). Early antenatal detection, treatment where appropriate, and timely delivery could minimise the risks significantly.
In multiple pregnancies, most of the excess morbidity and mortality can be attributed to preterm birth and to pathology associated with twin‐to‐twin transfusion syndrome (TTTS) in monochorionic pregnancies. However, growth discordance or selective intrauterine growth restriction (IUGR) are more common that TTTS (Ortibus 2009). The pathophysiological nature of the TTTS differs from other placental pathology with specific impact on the fetal haemodynamics. Different monitoring and treatment strategies are needed for this condition and for this reason we planned to exclude this subgroup of multiple pregnancies from this review if such information was available.
The most commonly used methods for the assessment of fetal well‐being in high‐risk pregnancies include fetal cardiotocography (CTG) (Grivell 2015), biophysical profile (Lalor 2008) and Doppler studies of the fetal circulation. This review focuses on the role of fetal and umbilical Doppler ultrasound as a test of fetal well‐being in high‐risk pregnancies.
Description of the intervention
The use of Doppler ultrasound to investigate the pattern of waveforms in the umbilical artery during pregnancy was first reported in 1977 from Dublin (Fitzgerald 1977). The waveforms were derived from the changes in the ultrasound frequency of the Doppler signal, which targeted circulating fetal blood within the umbilical artery. Such flow velocity waveforms (FVW) from the feto‐placental circulation are dependent on the fetal cardiac contraction force, density of the blood, the vessel wall elasticity and peripheral or downstream resistance (Giles 1985; Owen 2001). It was suggested that the FVWs should be obtained with the mother in a semirecumbent position during a period of fetal inactivity, as the impedance indices are moderated by fetal breathing and elevated fetal heart rates (Mires 2000).
Different types of measurements have been described in an attempt to quantify the Doppler signals accurately and reproducibly (Chen 1996; Mari 2009; Owen 2001). The indices are calculated as ratios between peak systolic velocity (A), end‐diastolic peak velocity (B) and mean velocity. The most common in clinical practice are pulsatility index (PI = (A ‐ B)/mean)) and resistant index (RI = (A ‐ B)/A) (Burns 1993). Ideally, the measurements have to be done on several consecutive identical wave forms with the angle of the insonation as close to zero as possible (Burns 1993).
Observational studies have demonstrated that, in the presence of normal placental function, the umbilical artery waveform has a pattern compatible with a low‐resistance system, displaying forward blood flow throughout the cardiac cycle (Neilson 1987).
Initial studies have focused on umbilical arteries and veins, but better equipment has allowed studies of carotid and intracranial arteries, aorta, coronary circulation (Baschat 2002), mesenteric artery and the venous circulation (ductus venosus, inferior vena cava and vena Galena) (Cheema 2004; Owen 2001). The assessment of utero‐placental arteries has also been investigated (Trudinger 1985a; Trudinger 1985b) and has been reviewed in a separate Cochrane review (Utero‐placental Doppler ultrasound for improving pregnancy outcome;Stampalija 2010).
When inadequate vascularisation of the placenta occurs (placental insufficiency), the haemodynamic changes in the feto‐placental circulation develop, often in a progressive fashion. Doppler indices from the umbilical artery start to increase when approximately 60% to 70% of the placental vascular tree is not functioning (Thompson 1990). This tends to be followed by a decrease in the impedance to blood flow in the middle cerebral artery as a consequence of 'brain sparing effect' (Hecher 2001), while the resistance increases in aortic blood flow (Ferrazzi 2002; Hecher 2001). This redistribution of the blood flow allows preferential oxygenation of fetal vital organs such as brain and heart. Late Doppler changes include absent or reverse end diastolic flow in the umbilical artery (Al‐Ghazali 1990; Nicholaides 1988) and increase in the resistance of venous blood flow (ductus venosus and inferior vena cava) (Baschat 2001; Ferrazzi 2002). Higher resistance in venous circulation reflects the elevation of right heart afterload and increase of the intraventricular pressure caused by hypoxaemia of the myocardium. Those changes correlate well with fetal acidosis (Bilardo 1990; Weiner 1990).
How the intervention might work
The time scale over which placental insufficiency and fetal compensatory changes develop varies and depends on underlying maternal and fetal pathology and gestational age. It is, therefore, difficult to apply the same management protocol to all women with abnormal Doppler findings. Normal Doppler findings do provide some reassurance and may, in some circumstances, reduce the need for hospitalisation and additional fetal monitoring, but this is not always the case. There is also some suggestion that normal umbilical artery Doppler ultrasound cannot be assumed to mean low risk where the fetus is small (Figueras 2008). An abnormal Doppler finding tends to trigger management protocols that vary significantly, not only between low‐ and high‐income countries, but also from unit to unit in the same country. The most important factors that determine subsequent management are gestation, availability of additional monitoring methods (computerised CTG, biophysical profile, Doppler), and neonatal intensive care availability.
The Growth Restriction Intervention Trial (GRIT) study showed that although the delay in delivery (around four days) may lead to more stillbirths, the overall number of perinatal deaths is not reduced by an immediate delivery (GRIT 2003). Importantly, the study showed that at two years follow‐up, the immediate delivery group showed a trend towards more neurological disability (GRIT 2004).
Recently, considerable interest has been generated by observations that ductus venous flow may be a good predictor of perinatal outcome (Baschat 2001; Bilardo 2004; Ferrazzi 2002). The TRUFFLE study was designed to compare reduced short‐term variation on computerized CTG, early ductus venosus changes or late ductus venosus changes as a trigger for delivery of the growth‐restricted babies between 26+0‐31+6 gestational weeks and results from that trial have now been published and are included in the review (Lees 2005; Lees 2015).
Ultimately, the goal of any Doppler‐triggered management protocol is to improve perinatal mortality and morbidity. An unnecessary early intervention may result in excess morbidity from prematurity, whilst a delay may result in a stillbirth or severely compromised newborn (GRIT 2003).
Why it is important to do this review
The first meta‐analysis of umbilical artery Doppler in high‐risk pregnancies was published in 1995 (Alfirevic 1995; Neilson 1995), demonstrating improvement with Doppler in a number of clinical outcomes and possible reduction in perinatal deaths. Since then, ultrasound technology has developed further and much more complex assessment of fetal circulation has become standard clinical practice in fetal medicine units worldwide. However, the potential for benefit from the knowledge generated by these new methods has to be balanced with the potential for harm. Any suggestion of fetal compromise in high‐risk women is likely to lead to considerable anxiety in families and clinicians, further diagnostic testing, and early (possibly very preterm) birth often by caesarean section.
Another Cochrane review analysed the role of Doppler ultrasound in routine practice (Bricker 2007), with doubts expressed about its benefit as a screening tool in all pregnancies (Alfirevic 2015). The use of utero‐placental Doppler ultrasound is the subject of another Cochrane review (Utero‐placental Doppler ultrasound for improving pregnancy outcome;Stampalija 2010). However, when both fetal and utero‐placental Doppler assessments are used in high‐risk pregnancies, the study will be included here because clinical judgements tend to rest on the fetal assessment.
Objectives
The objective of this review was to assess the effects of Doppler ultrasound used to assess fetal well‐being in high‐risk pregnancies on obstetric care and fetal outcomes.
Methods
Criteria for considering studies for this review
Types of studies
All randomised trials and quasi‐randomised studies comparing Doppler ultrasound (fetal and umbilical circulations) in pregnancies considered to be at high risk of fetal compromise. Cluster‐randomised trials were eligible for inclusion, as were abstracts if enough information was available for assessment and data extraction. Cross‐over trials were not eligible for inclusion.
Types of participants
Women with pregnancies considered to be at 'high risk' for fetal compromise, e.g. intrauterine growth restriction, post‐term pregnancies, previous pregnancy loss, women with hypertension, women with diabetes, or other maternal pathology (e.g. thrombophilia). We planned to include twin pregnancies, separating monochorionic and dichorionic pregnancies, where possible.
Types of interventions
Doppler ultrasound of the fetal and umbilical vessels for fetal assessment in pregnancies in high‐risk populations. We excluded utero‐placental Doppler studies (as these are assessed in a separate review). However, where umbilical artery or fetal Doppler was combined with utero‐placental Doppler, the study has been included in this review.
Comparisons
-
Doppler ultrasound of fetal vessels versus no Doppler ultrasound of fetal vessels (including comparisons of Doppler ultrasound of fetal vessels revealed versus Doppler ultrasound of fetal vessels concealed).
-
Doppler ultrasound of fetal vessels versus other forms of monitoring, e.g. cardiotocography, biophysical profile.
-
Comparison of different forms of Doppler ultrasound of fetal vessels versus other types of Doppler ultrasound of fetal vessels.
-
Combination of umbilical artery or fetal Doppler with utero‐placental Doppler (uterine artery Doppler) versus either no other monitoring or additional monitoring.
-
Early ductus venosus Doppler ultrasound versus computerized CTG.
-
Late ductus venosus Doppler ultrasound versus computerized CTG.
-
Early versus late ductus venosus Doppler ultrasound.
Types of outcome measures
We selected outcome measures with the help of a proposed core data set of outcome measures (Devane 2007).
Main outcomes
-
Any perinatal death after randomisation.
-
Serious neonatal morbidity ‐ composite outcome including hypoxic ischaemic encephalopathy, intraventricular haemorrhage (IVH), bronchopulmonary dysplasia (BPD), necrotising enterocolitis (NEC).
Additional outcomes of interest
-
Stillbirth.
-
Neonatal death.
-
Any potentially preventable perinatal death*.
-
Fetal acidosis.
-
Apgar score less than seven at five minutes.
-
Caesarean section (both elective and emergency).
-
Spontaneous vaginal birth.
-
Operative vaginal birth.
-
Induction of labour.
-
Oxytocin augmentation.
-
Neonatal resuscitation required.
-
Infant requiring intubation/ventilation.
-
Neonatal fitting/seizures.
-
Preterm labour (onset of labour before 37 completed weeks of pregnancy).
-
Gestational age at birth.
-
Infant respiratory distress syndrome.
-
Meconium aspiration.
-
Neonatal admission to special care or intensive care unit, or both.
-
Hypoxic ischaemic encephalopathy (a condition of injury to the brain).
-
Intraventricular haemorrhage (IVH).
-
Bronchopulmonary dysplasia (BPD).
-
Necrotising enterocolitis (NEC).
-
Infant birthweight.
-
Length of infant hospital stay.
-
Long‐term infant/child neurodevelopmental outcome.
-
Women's views of their care.
* Perinatal death excluding chromosomal abnormalities, termination of pregnancies, birth before fetal viability (as defined by trialists) and fetal death before use of the intervention.
Non‐prespecified outcomes were also reported if we considered them to be important.
Search methods for identification of studies
The following methods section of this review was based on a standard template used by Cochrane Pregnancy and Childbirth.
Electronic searches
We searched Cochrane Pregnancy and Childbirth’s Trials Register by contacting their Information Specialist (31 March 2017).
The Register is a database containing over 22,000 reports of controlled trials in the field of pregnancy and childbirth. For full search methods used to populate Pregnancy and Childbirth’s Trials Register (including the detailed search strategies for CENTRAL, MEDLINE, Embase and CINAHL), the list of handsearched journals and conference proceedings, and the list of journals reviewed via the current awareness service, please follow this link to the editorial information about the Cochrane Pregnancy and Childbirth in the Cochrane Library and select the ‘Specialised Register ’ section from the options on the left side of the screen.
Briefly, Cochrane Pregnancy and Childbirth’s Trials Register is maintained by their Information Specialist and contains trials identified from:
-
monthly searches of the Cochrane Central Register of Controlled Trials (CENTRAL);
-
weekly searches of MEDLINE (Ovid);
-
weekly searches of Embase (Ovid);
-
monthly searches of CINAHL (EBSCO);
-
handsearches of 30 journals and the proceedings of major conferences;
-
weekly current awareness alerts for a further 44 journals plus monthly BioMed Central email alerts.
Search results are screened by two people and the full text of all relevant trial reports identified through the searching activities described above is reviewed. Based on the intervention described, each trial report is assigned a number that corresponds to a specific Pregnancy and Childbirth review topic (or topics), and is then added to the Register. The Information Specialist searches the Register for each review using this topic number rather than keywords. This results in a more specific search set which has been fully accounted for in the relevant review sections (Included studies; Excluded studies).
Searching other resources
We also planned to look for additional studies in the reference lists of the studies identified.
We did not apply any language or date restrictions.
Data collection and analysis
For methods used in the previous version of this review, seeAlfirevic 2013.
For this update, the following methods were used for assessing the reports that were identified as a result of the updated search.
The following methods section of this review was based on a standard template used by Cochrane Pregnancy and Childbirth.
Selection of studies
Two review authors independently assessed for inclusion all the potential studies identified as a result of the search strategy. We resolved any disagreement through discussion or, if required, we consulted the third review author.
Data extraction and management
We designed a form to extract data. For eligible studies, two review authors extracted the data using the agreed form. We resolved discrepancies through discussion or, if required, we consulted the third review author. Data were entered into Review Manager software (RevMan 2014) and checked for accuracy.
When information regarding any of the above was unclear, we planned to contact authors of the original reports to provide further details.
Assessment of risk of bias in included studies
Two review authors independently assessed risk of bias for each study using the criteria outlined in the Cochrane Handbook for Systematic Reviews of Interventions (Higgins 2011). Any disagreement was resolved by discussion or by involving a third assessor.
(1) Random sequence generation (checking for possible selection bias)
We described for each included study the method used to generate the allocation sequence in sufficient detail to allow an assessment of whether it should produce comparable groups.
We assessed the method as:
-
low risk of bias (any truly random process, e.g. random number table; computer random number generator);
-
high risk of bias (any nonrandom process, e.g. odd or even date of birth; hospital or clinic record number);
-
unclear risk of bias.
(2) Allocation concealment (checking for possible selection bias)
We described for each included study the method used to conceal allocation to interventions prior to assignment and assessed whether intervention allocation could have been foreseen in advance of, or during recruitment, or changed after assignment.
We assessed the methods as:
-
low risk of bias (e.g. telephone or central randomisation; consecutively numbered sealed opaque envelopes);
-
high risk of bias (open random allocation; unsealed or nonopaque envelopes, alternation; date of birth);
-
unclear risk of bias.
(3.1) Blinding of participants and personnel (checking for possible performance bias)
We described for each included study the methods used, if any, to blind study participants and personnel from knowledge of which intervention a participant received. We considered that studies were at low risk of bias if they were blinded, or if we judged that the lack of blinding was unlikely to affect results. We assessed blinding separately for different outcomes or classes of outcomes.
We assessed the methods as:
-
low, high, or unclear risk of bias for participants;
-
low, high, or unclear risk of bias for personnel.
(3.2) Blinding of outcome assessment (checking for possible detection bias)
We described for each included study the methods used, if any, to blind outcome assessors from knowledge of which intervention a participant received. We assessed blinding separately for different outcomes or classes of outcomes.
We assessed methods used to blind outcome assessment as:
-
low, high, or unclear risk of bias.
(4) Incomplete outcome data (checking for possible attrition bias due to the amount, nature and handling of incomplete outcome data)
We described for each included study, and for each outcome or class of outcomes, the completeness of data including attrition and exclusions from the analysis. We stated whether attrition and exclusions were reported and the numbers included in the analysis at each stage (compared with the total randomised participants), reasons for attrition or exclusion where reported, and whether missing data were balanced across groups or were related to outcomes. Where sufficient information was reported, or could be supplied by the trial authors, we planned to reinclude missing data in the analyses which we undertook.
We assessed methods as:
-
low risk of bias (e.g. no missing outcome data; missing outcome data balanced across groups);
-
high risk of bias (e.g. numbers or reasons for missing data imbalanced across groups; ‘as treated’ analysis done with substantial departure of intervention received from that assigned at randomisation);
-
unclear risk of bias.
(5) Selective reporting (checking for reporting bias)
We described for each included study how we investigated the possibility of selective outcome reporting bias and what we found.
We assessed the methods as:
-
low risk of bias (where it is clear that all of the study’s prespecified outcomes and all expected outcomes of interest to the review have been reported);
-
high risk of bias (where not all the study’s prespecified outcomes have been reported; one or more reported primary outcomes were not prespecified; outcomes of interest are reported incompletely and so cannot be used; study fails to include results of a key outcome that would have been expected to have been reported);
-
unclear risk of bias.
(6) Other bias (checking for bias due to problems not covered by (1) to (5) above)
We described for each included study any important concerns we had about other possible sources of bias.
(7) Overall risk of bias
We made explicit judgements about whether studies were at high risk of bias, according to the criteria given in the Cochrane Handbook for Systematic Reviews of Interventions (Higgins 2011). With reference to (1) to (6) above, we planned to assess the likely magnitude and direction of the bias and whether we considered it was likely to impact on the findings. In future updates, we will explore the impact of the level of bias through undertaking sensitivity analyses (see Sensitivity analysis).
Assessment of the quality of the evidence using the GRADE approach
For this update, the quality of the evidence was assessed using the GRADE approach, as outlined in the GRADE handbook in order to assess the quality of the body of evidence relating to the following outcomes for the main comparisons.
-
Any perinatal death after randomisation.
-
Serious neonatal morbidity.
-
Stillbirth.
-
Caesarean section (elective and emergency).
-
Induction of labour.
-
Apgar less than seven at five minutes.
-
Long‐term infant neurodevelopmental outcome.
GRADEpro Guideline Development Tool was used to import data from Review Manager 5 (RevMan 2014) in order to create ’Summary of findings’ tables. A summary of the intervention effect and a measure of quality for each of the above outcomes was produced using the GRADE approach. The GRADE approach uses five considerations (study limitations, consistency of effect, imprecision, indirectness, and publication bias) to assess the quality of the body of evidence for each outcome. The evidence can be downgraded from 'high quality' by one level for serious (or by two levels for very serious) limitations, depending on assessments for risk of bias, indirectness of evidence, serious inconsistency, imprecision of effect estimates, or potential publication bias.
Measures of treatment effect
Dichotomous data
For dichotomous data, we presented results as summary risk ratios with 95% confidence intervals.
Continuous data
We used the mean difference if outcomes were measured in the same way between trials. If appropriate, we would have used the standardised mean difference to combine trials that measured the same outcome, but used different methods.
Unit of analysis issues
Cluster‐randomised trials
We planned to include cluster‐randomised trials in the analyses along with individually‐randomised trials. We planned to adjust their sample sizes using the methods described in the Cochrane Handbook for Systematic Reviews of Interventions using an estimate of the intracluster correlation coefficient (ICC) derived from the trial (if possible), from a similar trial, or from a study of a similar population. If we had used ICCs from other sources, we planned to report this and conduct sensitivity analyses to investigate the effect of variation in the ICC. If we had identified both cluster‐randomised trials and individually‐randomised trials, we planned to synthesise the relevant information. We considered it reasonable to combine the results from both if there was little heterogeneity between the study designs and the interaction between the effect of intervention and the choice of randomisation unit was considered to be unlikely.
We also planned to acknowledge heterogeneity in the randomisation unit and perform a sensitivity analysis to investigate the effects of the randomisation unit.
Cross‐over trials
Cross‐over trials were not considered eligible for inclusion.
Multiple pregnancies
Trials of multiple pregnancies were eligible for inclusion. We planned to adjust for clustering to take into account the non‐independence of babies from the same pregnancy (Gates 2004), however, we were unable to do this because of the lack of reported intercorrelation coefficients (ICC). Treating babies from multiple pregnancies as if they were independent, when they are more likely to have similar outcomes than babies from different pregnancies, would overestimate the sample size and give confidence intervals that were too narrow. Each woman can be considered a cluster in multiple pregnancy, with the number of individuals in the cluster being equal to the number of fetuses in her pregnancy. Analysis using cluster trial methods allows calculation of relative risk and adjustment of confidence intervals. Usually, this will mean that the confidence intervals get wider. Although this may make little difference to the conclusion of a trial, it avoids misleading results in those trials where the difference may be substantial.
In future updates, if information on ICCs are reported, we will adjust for clustering in the analyses, wherever possible, and use the inverse variance method for adjusted analyses, as described in the Cochrane Handbook for Systematic Reviews of Interventions (Higgins 2011).
Studies with multiple treatment groups
Trials with multiple treatment groups were eligible for inclusion. In trials with multiple intervention groups, we planned to select one pair of interventions and exclude the others and to include two or more independent comparisons, as described in section 16.5.4 of the Cochrane Handbook for Systematic Reviews of Interventions (Higgins 2011). One of the included trials, (Lees 2013), included three relevant intervention groups and all were included in three separate independent comparisons: early ductus venosus Doppler ultrasound versus CTG; late ductus venosus Doppler ultrasound versus CTG; and early ductus venosus Doppler ultrasound versus late.
Dealing with missing data
For included studies, levels of attrition were noted. In future updates, if more eligible studies are included, the impact of including studies with high levels of missing data in the overall assessment of treatment effect will be explored by using sensitivity analysis.
For all outcomes, analyses were carried out, as far as possible, on an intention‐to‐treat basis, i.e. we attempted to include all participants randomised to each group in the analyses. The denominator for each outcome in each trial was the number randomised minus any participants whose outcomes were known to be missing.
Assessment of heterogeneity
We assessed statistical heterogeneity in each meta‐analysis using the Tau², and the I² and Chi² statistics. We regarded heterogeneity as substantial if I² was greater than 30% and either Tau² was greater than zero, or there was a low P value (less than 0.10) in the Chi² test for heterogeneity. If we identified substantial heterogeneity (above 30%), we planned to explore it by prespecified subgroup analysis.
Assessment of reporting biases
If there were 10 or more studies in the meta‐analysis, we investigated reporting biases (such as publication bias) using funnel plots. We assessed funnel plot asymmetry visually. If asymmetry was suggested by a visual assessment, we planned to perform exploratory analyses to investigate it (Harbord 2006).
Data synthesis
We carried out statistical analysis using the Review Manager software (RevMan 2014). We used fixed‐effect meta‐analysis for combining data where it was reasonable to assume that studies were estimating the same underlying treatment effect: i.e. where trials were examining the same intervention, and the trials’ populations and methods were judged sufficiently similar.
If there was clinical heterogeneity sufficient to expect that the underlying treatment effects differed between trials, or if substantial statistical heterogeneity was detected, we used random‐effects meta‐analysis to produce an overall summary, if an average treatment effect across trials was considered clinically meaningful. The random‐effects summary was treated as the average range of possible treatment effects and we discussed the clinical implications of treatment effects differing between trials. If we did not consider that the average treatment effect was clinically meaningful, we did not combine trials. If we used random‐effects analyses, the results were presented as the average treatment effect with 95% confidence intervals, and the estimates of Tau² and the I² statistic.
Subgroup analysis and investigation of heterogeneity
Where we identified substantial heterogeneity, we investigated it using subgroup analyses and sensitivity analyses. We considered whether an overall summary was meaningful, and if it was, we used random‐effects analysis to produce it.
We planned the following a priori subgroup analyses for all outcomes, rather than undertaking separate reviews on singleton and multiple pregnancies:
-
singleton pregnancies versus multiple pregnancies;
-
monochorionic twins versus dichorionic twins.
We presented separate data for singleton versus multiple pregnancies, but there was insufficient information in the trial reports to carry out planned subgroup analysis for monochorionic versus dichorionic twins.
We carried out the following additional a priori subgroup analyses for the primary outcomes:
-
where the fetus was suspected small‐for‐gestational age;
-
where the woman had hypertension or pre‐eclampsia;
-
where the woman had diabetes;
-
prolonged pregnancy;
-
where there had been previous pregnancy loss.
We assessed subgroup differences by interaction tests available within RevMan 5 (RevMan 2014). We reported the results of subgroup analyses quoting the Chi² statistic and P value, and the interaction test I² value.
Sensitivity analysis
We planned sensitivity analyses to explore the effect of trial quality assessed by adequate labelled sequence generation and adequate allocation concealment, with poor‐quality studies (unclear or high risk of bias) being excluded from the analyses in order to assess whether this made any difference to the overall result.
Results
Description of studies
Results of the search
In the previous version of the review, the search identified 29 studies, of which 18 were included, and one study was ongoing; results for this trial have now been published and were included in this updated version of the review (Lees 2013; Lees 2015) (search date 31 March 2017, see: Figure 1). Findings were therefore based on 19 trials involving 10,667 women. In the previous version of the review, 10 trials were excluded and no further trials have been excluded in this update. For further details of trial characteristics, please refer to the tables of Characteristics of included studies and Characteristics of excluded studies.

Study flow diagram.
Included studies
Most studies included Doppler assessments of umbilical artery in both experimental and control groups, with the Doppler results being revealed to clinicians only in the 'Doppler group' (Biljan 1992; Burke 1992; De Rochambeau 1992; Giles 2003; Johnstone 1993; Lees 2013; Lees 2015; Neales 1994 [pers comm]; Newnham 1991; Nienhuis 1997; Nimrod 1992; Norman 1992; Ott 1998; Pattinson 1994; Trudinger 1987; Tyrrell 1990). Doppler ultrasound of the umbilical artery was used as an addition to the standard fetal monitoring (e.g. cardiotocography (CTG), biophysical profile, fetal biometry).
Eight of these studies involved singleton pregnancies only (Biljan 1992; De Rochambeau 1992; Lees 2013; Neales 1994 [pers comm]; Nienhuis 1997; Ott 1998; Trudinger 1987; Tyrrell 1990) and one study of 539 women involved twin pregnancies only (Giles 2003). Two studies assessed a mixture of singleton and multiple pregnancies with 40/2289 (1.7%) being twin pregnancies in Johnstone 1993 and 40/505 (7.9%) being twin pregnancies in Newnham 1991. Four studies did not state whether they included just singleton pregnancies or not (Burke 1992; Nimrod 1992; Norman 1992; Pattinson 1994).
Four studies compared Doppler ultrasound alone versus CTG alone in women whose pregnancies were considered at increased risk of problems (Almstrom 1992; Haley 1997; Hofmeyr 1991; Williams 2003). Of these, three involved singleton pregnancies only (Almstrom 1992; Haley 1997; Williams 2003) and one study did not specify (Hofmeyr 1991).
Gestational age for inclusion in studies was not reported in six studies, and the remainder of the studies varied in the gestational ages they included, from 24 weeks' gestation to those studies looking at the value of Doppler ultrasound when women had gone beyond 40 weeks (Characteristics of included studies).
One study compared three different monitoring strategies to trigger delivery in mothers with early fetal growth restriction: early changes in ductus venosus (pulsatility index > 95th percentile) versus late changes in ductus venosus (absent or negative A‐wave) versus short term variation from computerised CTG (cCTG) (Lees 2013). However, all women were monitored by cCTG and safety net criteria for delivery based on cCTG applied to all women, irrespective of randomised group.
Excluded studies
Ten of the 29 potentially eligible studies were excluded. In five studies, the participants were described as 'unselected populations' (Davies 1992; Newnham 1993; Omtzigt 1994; Schneider 1992; Whittle 1994); in one study, the participants were women considered at low risk of complications (Mason 1993); one study was not a randomised study (McCowan 1996); in one study, the full report was not available and there were no data in the conference abstract (Gonsoulin 1991), and in two studies the information was considered unreliable (McParland 1988; Pearce 1992).
Risk of bias in included studies
The quality of the 19 completed included studies was difficult to assess due to lack of information, particularly in terms of randomisation and concealment of allocation (Figure 2). For this reason, we did not carry out planned sensitivity analysis excluding studies at high risk of bias.
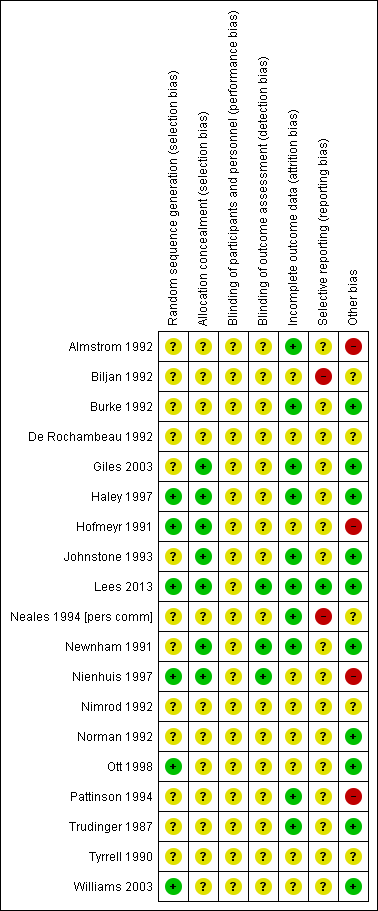
Methodological quality summary: review authors' judgements about each methodological quality item for each included study.
Allocation
Only four studies had adequate sequence generation and allocation concealment (Haley 1997; Hofmeyr 1991; Lees 2013; Nienhuis 1997). Two studies had adequate sequence generation but allocation concealment was unclear (Ott 1998; Williams 2003) and in two studies allocation concealment was adequate, but sequence generation was unclear (Giles 2003; Newnham 1991). In three studies, concealment allocation was judged as adequate, but sequence generation was unclear (Giles 2003; Johnstone 1993; Newnham 1991). The remaining 10 studies had both unclear sequence generation and unclear concealment allocation (Almstrom 1992; Biljan 1992; Burke 1992; De Rochambeau 1992; Neales 1994 [pers comm]; Nimrod 1992; Norman 1992; Pattinson 1994; Trudinger 1987; Tyrrell 1990).
Blinding
Blinding women and/or staff in these trials was not generally feasible. Even in the studies where Doppler ultrasound was either revealed or concealed, some outcomes, such as induction of labour and caesarean section were clearly going to be influenced by the knowledge of Doppler results, but it might have been possible to avoid bias in neonatal assessment. Unfortunately, the information on the attempts to protect against biased assessment was often not available. In three studies (Lees 2013; Newnham 1991; Nienhuis 1997), assessors of neonatal outcomes were indeed blind to Doppler results.
Incomplete outcome data
Incomplete outcome data were addressed adequately in 10 studies (Almstrom 1992; Burke 1992; Giles 2003; Haley 1997; Johnstone 1993; Lees 2013; Neales 1994 [pers comm]; Newnham 1991; Pattinson 1994; Trudinger 1987) and unclear in nine studies (Biljan 1992; De Rochambeau 1992; Hofmeyr 1991; Nienhuis 1997; Nimrod 1992; Norman 1992; Ott 1998; Tyrrell 1990; Williams 2003). Only a few studies provided full information on the number of women approached to take part in the studies, the numbers eligible for inclusion, and the overall refusal rate. While not sources of bias as such, high exclusion and refusal rates might affect the generalisability of the findings and the interpretation of the results.
Selective reporting
Almost all the studies, except three, were assessed as at unclear risk of selective reporting bias because we did not assess the trial protocols. Two studies were considered to have some degree of selective reporting bias (Biljan 1992; Neales 1994 [pers comm]). In one multiple‐intervention study, the protocol was available, there was no evidence of reporting bias, and each group to which participants were randomised was presented (Lees 2013).
Other potential sources of bias
Ten studies were judged to be free of other sources of bias (Burke 1992; Giles 2003; Haley 1997; Johnstone 1993; Lees 2013; Newnham 1991; Norman 1992; Ott 1998; Trudinger 1987; Williams 2003); five studies were unclear (Biljan 1992; De Rochambeau 1992; Neales 1994 [pers comm]; Nimrod 1992; Tyrrell 1990); and four studies were considered to have some other source of bias, mainly baseline imbalances (Almstrom 1992; Hofmeyr 1991; Nienhuis 1997; Pattinson 1994).
Sensitivity analyses
For sensitivity analyses by quality of studies, we used both adequately labelled sequence generation and adequate allocation concealment as essential criteria for high quality. Only three of the 18 studies in the main comparison for umbilical artery met these criteria (Haley 1997; Hofmeyr 1991; Nienhuis 1997), see Figure 2.
Effects of interventions
This review included 19 studies involving 10,667 women.
1) Umbilical artery Doppler ultrasound versus no Doppler ultrasound (18 studies, 10,156 women)
We included all completed studies examining umbilical artery Doppler ultrasound, including those that compared Doppler ultrasound alone versus CTG alone, as we wished to get an overall assessment of whether using Doppler ultrasound was beneficial. Findings for important outcomes for this overall assessment are set out in summary of findings Table for the main comparison.
A separate comparison of studies where Doppler was used as an alternative to CTG was also undertaken, and these findings are reported below under 3) 'Umbilical Doppler ultrasound alone versus CTG alone'.
As mentioned above, the quality of the studies included in this comparison was often unclear due to lack of information, particularly in terms of randomisation and concealment allocation.
Main outcomes
It is important to emphasise that this review still remains underpowered to detect clinically important differences in serious neonatal morbidity.
Any perinatal mortality after randomisation (16 studies, 10,225 babies)
There was a clear difference in perinatal mortality between the two groups (risk ratio (RR) 0.71, 95% confidence interval (CI) 0.52 to 0.98, 16 studies, 10,225 babies, 1.2% versus 1.7%, number needed to treat (NNT) 203, 95% CI 103 to 4352, Analysis 1.1, evidence graded moderate). A sensitivity analysis including only the three studies of high quality (low risk of bias for sequence generation and concealment allocation) (Haley 1997; Hofmeyr 1991; Nienhuis 1997) showed no clear difference, though the numbers were small and this analysis lacked the power of the overall analysis (RR 0.61, 95% CI 0.24 to 1.53, three studies, 1197 babies) (data not shown).
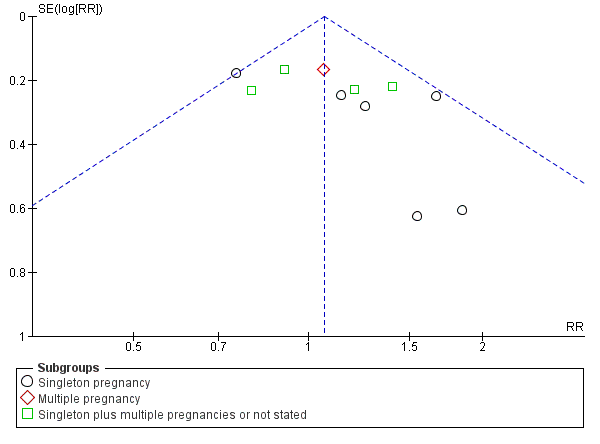
There was no evidence that the treatment effect varied between subgroups as the CIs overlapped (as indicated by the subgroup interaction test (test for subgroup differences: Chi² = 0.80, df = 2 (P = 0.67), I² = 0%; Analysis 1.1)), although the RR for the singleton subgroup was somewhat lower compared with the others (RR 0.59 compared with 0.88, 0.78 and 0.71). There was evidence of funnel plot asymmetry ('small‐study effects', P = 0.057, using Harbord 2006) which might indicate publication bias. We noted that the results of individual studies all crossed the line of no effect and there was overall low heterogeneity for this outcome, therefore, we did not downgrade the evidence (Figure 3). However, possible publication bias was a concern given that the result of the pooled meta‐analysis was borderline.

Funnel plot of comparison: 1 Doppler ultrasound versus no Doppler ultrasound, outcome: 1.1 Any perinatal death after randomisation.
It is also important to note that we did not adjust for the nonindependence of twins because of the lack of reported intercorrelation coefficients (ICC).
Serious neonatal morbidity (three studies, 1098 babies)
Only three studies reported relevant neonatal morbidity data (Newnham 1991; Norman 1992; Tyrrell 1990); one study reported no events and the two studies which contributed data showed no clear differences in serious perinatal morbidity between women having Doppler ultrasound and those monitored by standard methods (Analysis 1.2, evidence graded very low). The heterogeneity was high (Tau² = 3.84, Chi²: P = 0.04, I² = 76%) and the numbers of babies with serious morbidity were too small to be able to say anything with any degree of certainty. Thus, we decided, on the advice of our statistician, not to pool the data for this outcome. No studies reported serious neonatal morbidity in multiple pregnancies.
Additional outcomes
The data for stillbirths (RR 0.65, 95% CI 0.41 to 1.04, 9560 babies, 15 studies, Analysis 1.3, evidence graded low), neonatal deaths (RR 0.81, 95% CI 0.53 to 1.24, 8167 babies, 13 studies, Analysis 1.4) and low Apgar score (RR 0.92, 95% CI 0.69 to 1.24; 6321 babies, 7 studies, I² = 30%, Analysis 1.6, evidence graded low) were consistent with the overall picture showing fewer adverse outcomes in the Doppler group, but the CIs crossed the line of no effect.
The clear difference favouring the Doppler group in perinatal deaths, seen in Analysis 1.1, was also present when the analysis focused just on potentially preventable perinatal deaths (RR 0.67, 95% CI 0.46 to 0.98, 16 studies, 10,225 babies, Analysis 1.5).
The reduction in elective and emergency caesarean sections with the use of Doppler ultrasound was clear (RR 0.90, 95% CI 0.84 to 0.97, 14 studies, 7918 women, Analysis 1.7, evidence graded moderate), though the upper limit of the CI was close to one. When caesarean sections were reported as either elective or emergency, the reduction in caesareans appeared to be confined to the emergency procedures (elective only: RR 1.07, 95% CI 0.93 to 1.22; 6627 women; 11 studies; Analysis 1.8; emergency only: average RR 0.81, 95% CI 0.67 to 0.98, 6175 women, 10 studies, Tau² = 0.04; Chi² = 16.21, P = 0.06, I² = 44%, Analysis 1.9). This is something that will be explored in a meta‐regression in future updates if more data become available.
There was also some evidence of possible publication bias in the funnel plots (Figure 4; Figure 5; Figure 6). The Harbord test (Harbord 2006) for all caesarean sections did not suggest evidence of asymmetry (P = 0.12) but there did appear to be asymmetry by visual inspection indicating that there might have been some small studies missing, although none of the individual published studies showed clear differences between the groups. Possible publication bias is of concern because the pooled meta‐analysis CI was close to the line of no effect . With elective caesarean sections, there was evidence of asymmetry (P = 0.1) and the visual assessment indicating the 'missing' studies were those below a relative risk of one, so the pooled result is likely to be even closer to the null. For emergency caesarean sections, there was evidence of asymmetry (P = 0.09), again this being a small‐study effect. Heterogeneity can sometimes contribute to funnel plot asymmetry, so overall we should be cautious about the significance of the pooled result.

Funnel plot of comparison: 1 Doppler ultrasound versus no Doppler ultrasound, outcome: 1.8 Cesarean section (elective and emergency).
Funnel plot of comparison: 1 Doppler ultrasound versus no Doppler ultrasound, outcome: 1.9 Cesarean section ‐ elective.

Funnel plot of comparison: 1 Doppler ultrasound versus no Doppler ultrasound, outcome: 1.10 Cesarean section ‐ emergency.
Caesarean section results for subgroups based on the populations (singletons, multiples, not specified) were consistent with the overall effect in terms of the direction and size. However, the heterogeneity in the subgroup of emergency caesarean section was high and, therefore, a random‐effects model was used for pooling (average RR 0.81, 95% CI 0.67 to 0.98; test for subgroup differences: Chi² = 7.47, df = 2 (P = 0.02), I² = 73.2%; Analysis 1.9). This analysis provided evidence that the average RR across studies was clearly less than one, indicating a reduction in emergency caesarean section. However, we also calculated the 95% prediction interval (PI) for the underlying effect in any future studies (PI = 0.49 to 1.35); this indicated that the underlying RR may be greater than one in an individual study, due to the between‐study heterogeneity.
Overall, there were no clear differences identified in spontaneous vaginal births (RR 1.04, 95% CI 0.98 to 1.10; 2504 women; 5 studies, Analysis 1.10) and operative vaginal births (RR 0.95, 95% CI 0.80 to 1.14; 2813 women; 4 studies; Analysis 1.11) for women having the umbilical artery Doppler ultrasound compared with women not having the Doppler ultrasound.
There was, however, an average reduction in induction of labour for women with the umbilical artery Doppler intervention (average RR 0.89, 95% CI 0.80 to 0.99, 10 studies, 5633 women, random‐effects (Tau² = 0.01, Chi²: P = 0.08, I² = 41%), PI 0.68 to 1.16, Analysis 1.12, evidence graded moderate). Although the average effect across studies was evident, the prediction interval suggested that, due to the between‐study heterogeneity, we could not rule out the possibility that the underlying effect in a future study might actually increase induction of labour. There might be some clinical heterogeneity around the assessment of induction of labour due to the varying methods and timings of this intervention.
There was no difference identified overall in intubation or ventilation (average RR 1.42, 95% CI 0.87 to 2.30, six studies, 3136 babies, Analysis 1.13). Again, random‐effects were used because of high heterogeneity (Tau² = 0.14, Chi²: P = 0.09, I² = 47%) and a wide prediction interval was estimated due to the large heterogeneity and small number of studies in the meta‐analysis (PI 0.41 to 4.94, Analysis 1.13).
There was evidence of a difference between subgroups (interaction test for inverse variance analysis: Chi² = 8.67, df = 2 (P = 0.01)) suggesting that there might be an effect in singletons, but not in multiple pregnancies. The data were limited because there is only one trial in multiples and one with singleton and multiples combined. Further studies are needed to confirm if there is a difference here or not.
There was no clear difference identified in neonatal fitting/seizures (RR 0.35, 95% CI 0.01 to 8.49, 150 babies, 1 study, Analysis 1.14), or preterm labour (RR 1.12, 95% CI 0.72 to 1.75; 626 women, 2 studies Analysis 1.15), though sample sizes were small for both outcomes.
Overall, there was a small increase in gestational age (weeks) for babies exposed to umbilical artery Doppler ultrasound (average mean difference (MD) 0.21, 95% CI ‐0.02 to 0.43, eight studies, 4066 babies, random‐effects (Tau²= 0.04, Chi²: P = 0.11, I² = 40%, Analysis 1.16). However, the prediction interval suggested that, due to between‐study heterogeneity, we cannot rule out that a future study might show a decrease in gestational age. This finding should, therefore, be interpreted with caution.
There were no clear differences found in risk of infant respiratory distress syndrome (RDS) in singleton pregnancies (no study reported multiples) (RR 1.06, 95% CI 0.07 to 16.48, 107 babies; 1 study; Analysis 1.17), neonatal admission to special care baby unit (SCBU) and/or neonatal intensive care unit (NICU) (RR 0.95, 95% CI 0.89 to 1.03, 9334 babies, 12 studies, Analysis 1.18) , hypoxic ischaemic encephalopathy (average RR 0.65, 95% CI 0.01 to 33.07, 1045 babies, 2 studies, I² = 72%, Analysis 1.19), intraventricular haemorrhage (RR 1.42, 95% CI 0.47 to 4.30, 2008 babies, 4 studies, Analysis 1.20), or birthweight (MD 31.33, 95% CI ‐8.70 to 71.37; 3887 babies; 7 studies; Analysis 1.21).
There was a reduction in the length of infant hospital stay (days) in singleton pregnancies that had umbilical artery Doppler intervention, (standardised MD (SMD) ‐0.28, 95% CI ‐0.40 to ‐0.16, three studies, 1076 babies, Analysis 1.22).
We also included reported data for all other prespecified secondary outcomes when available, none of which conclusively showed clinically important differences between groups.
Non‐prespecified outcomes
For completeness, we also included the graphs for eight clinically relevant outcomes that were not prespecified in our protocol. There were fewer antenatal admissions in the Doppler group (RR 0.72, 95% CI 0.60 to 0.88, 893 women, 2 studies, Analysis 1.24) but all other outcomes showed no clear difference between the groups.
-
Birth less than 34 weeks (RR 2.04, 95% CI 0.62 to 6.69, 976 women, 2 studies, I² = 52%, Analysis 1.23);
-
Phototherapy for neonatal jaundice (RR 0.15, 95% CI 0.01 to 2.87, 150 babies, 1 study, Analysis 1.25);
-
Abnormal neurological development at 9 months (RR 0.61, 95% CI 0.26 to 1.45, 137 babies, 1 study, Analysis 1.26);
-
Hospitalisation for IUGR neonatal (RR 1.03, 95% CI 0.75 to 1.41, 142 babies, 1 study, Analysis 1.27);
-
Fetal distress in labour (RR 0.35, 95% CI 0.10 to 1.22, 289 women, 1 study, Analysis 1.28);
-
Birthweight < 5 percentile (RR 1.16, 95% CI 0.51 to 2.64; 289 babies, 1 study, Analysis 1.29);
-
Periventricular leucomalacia (RR 0.33, 95% CI 0.01 to 8.00, 545 babies, 1 study, Analysis 1.30);
-
Antenatal hospital stay (days) (MD ‐0.60, 95% CI ‐2.39 to 1.19, 426 women, 1 study, Analysis 1.31).
Oxytocin augmentation, requirement for neonatal resuscitation, preterm labour (onset of labour before 37 completed weeks of pregnancy), meconium aspiration, bronchopulmonary dysplasia (BPD), necrotising enterocolitis (NEC), long‐term infant/child neurodevelopmental outcome, and women's views of their care were not reported in any trial under this comparison.
2) Umbilical artery Doppler ultrasound versus no Doppler ultrasound (all subgroups)
Six studies reported main outcomes by subgroups.
Any perinatal mortality after randomisation
Five studies assessed women with suspected small‐for‐gestational age (SGA)/IUGR (Almstrom 1992; Haley 1997; Neales 1994 [pers comm]; Nienhuis 1997; Pattinson 1994) (RR 0.72, 95% CI 0.38 to 1.35; 1292 women; 5 studies), one study assessed women with hypertension/pre‐eclampsia (Pattinson 1994) (RR 3.57, 95% CI 0.42 to 30.73; 89 women; 1 study) and one study assessed women with a previous pregnancy loss (Norman 1992) (RR 0.26, 95% CI 0.03 to 2.17; 53 women; 1 study). Findings are reported in Analysis 2.1. No clear differences were found in any of the subgroups. As only one study assessed women with hypertension/pre‐eclampsia, and women with a previous pregnancy loss, there were not enough data to perform a meaningful subgroup analysis and therefore data were not pooled for this analysis.
One small study (Norman 1992) assessed serious neonatal morbidity in women with a previous pregnancy loss but did not report any morbidity in either group (Analysis 2.2). We were unable to carry out planned subgroup analysis examining monochorionic twins versus dichorionic twins due to lack of data.
No additional outcomes were reported under this comparison.
3) Umbilical artery Doppler ultrasound as an alternative to CTG monitoring (four studies, 2834 women)
Four trials were included in this comparison (Almstrom 1992; Haley 1997; Hofmeyr 1991; Williams 2003). Unfortunately, this analysis had much less power for assessing main clinical outcomes than the main comparison (which included 12 studies where additional methods of fetal monitoring were used in both groups).
In terms of quality, two of the four studies were judged to be at low risk of bias (Haley 1997; Hofmeyr 1991) whilst the rest were classified as 'unclear' because of the lack of information on randomisation and the allocation process.
Main outcomes
Any perinatal mortality after randomisation
Overall, there was no clear difference identified in perinatal mortality (RR 0.45, 95% CI 0.17 to 1.15, four studies, 2813 babies, Analysis 3.1). Only two studies were judged to have adequate sequence generation and allocation concealment (Haley 1997; Hofmeyr 1991) and using only these in a sensitivity analysis similarly showed no clear difference identified in perinatal mortality (RR 0.58, 95% CI 0.20 to 1.73, two studies, 1047 babies, data not shown).
There was no evidence that the treatment effect varied between subgroups as the CIs overlapped.
None of the studies provided data on serious perinatal morbidity.
Additional outcomes
There were no clear differences between groups for stillbirths (RR 0.48, 95% CI 0.14 to 1.71, four studies, 2813 babies, Analysis 3.2), neonatal death (RR 0.52, 95% CI 0.16 to 1.72, three studies, 1473 babies, Analysis 3.3), potentially preventable deaths (RR 0.38, 95% CI 0.12 to 1.18, four studies, 2813 babies, Analysis 3.4), and Apgar score < 7 at five minutes (RR 0.86, 95% CI 0.54 to 1.37; 2663 babies; three studies; Analysis 3.5). The same was true for all other additional outcomes, with the exception of caesarean section rate and length of hospital stay for neonates.
Overall rates of caesarean section, when both elective and emergency caesareans were combined, showed fewer caesareans in the umbilical artery Doppler group (RR 0.89, 95% CI 0.79 to 1.01, four studies, 2813 babies, Analysis 3.6). Interestingly, the results from three studies that reported emergency and elective caesareans separately showed fewer emergency caesareans (RR 0.66, 95% CI 0.52 to 0.84, three studies, 1473 women, Analysis 3.8) and more elective caesareans (RR 1.53, 95% CI 1.12 to 2.09, three studies, 1473 women, Analysis 3.7) in the umbilical artery Doppler group. There were too few studies to explore this differential effect in a formal meta‐regression, but lack of heterogeneity for these outcomes suggested that the effect of the umbilical artery Doppler studies on the type of caesareans was real.
There were no clear differences between the groups for spontaneous vaginal birth (RR 1.06, 95% CI 0.97 to 1.15, 1323 women, 2 studies, Analysis 3.9), operative vaginal birth (RR 0.98, 95% CI 0.81 to 1.17, 2663 women, 3 studies, Analysis 3.10), induction of labour (RR 0.67, 95% CI 0.32 to 1.40, 576 women, 2 studies, I² = 74%, Analysis 3.11), infant requiring intubation/ventilation (RR 1.54, 95% CI 0.26 to 9.08, 576 babies, 2 studies, Analysis 3.12), neonatal fitting/seizures (RR 0.35, 95% CI 0.01 to 8.49, 150 babies, 1 study, Analysis 3.13), gestational age at birth (MD 0.23, 95% CI ‐0.00 to 0.47; 1473 babies, 3 studies, Analysis 3.14), neonatal admission to SCBU and/or NICU (RR 0.87, 95% CI 0.73 to 1.03, 2813 babies, 4 studies, Analysis 3.15), and infant birthweight (MD 38.41, 95% CI ‐6.14 to 82.97, 2813 babies, 4 studies, Analysis 3.16).
There was a reduction in the length of infant hospital stay with umbilical artery Doppler ultrasound compared with CTG (SMD ‐0.25, 95% CI ‐0.41 to ‐0.08, two studies, 576 babies, Analysis 3.17). The two studies that reported this outcome included just singleton pregnancies. However, the number of babies involved was too small to be able to say anything with any degree of certainty.
Fetal acidosis, oxytocin augmentation, requirement for neonatal resuscitation, preterm labour (onset of labour before 37 completed weeks of pregnancy), infant respiratory distress syndrome, meconium aspiration, hypoxic ischaemic encephalopathy (a condition of injury to the brain), intraventricular haemorrhage (IVH), bronchopulmonary dysplasia (BPD), necrotising enterocolitis (NEC), long‐term infant/child neurodevelopmental outcome, and women's views of their care were not reported in any trial under this outcome.
Non‐prespecified outcomes
For completeness, we also included the graphs for three clinically relevant outcomes that were not prespecified in our protocol. There were fewer antenatal admissions in the Doppler group (RR 0.70, 95% CI 0.55 to 0.90, 426 women, 1 study, Analysis 3.18), but no clear difference between groups in phototherapy rates for neonatal jaundice (RR 0.15, 95% CI 0.01 to 2.87, 150 babies, 1 study, Analysis 3.19), or antenatal hospital stay (days) (MD ‐0.60, 95% CI ‐2.39 to 1.19, 426 women, 1 study, Analysis 3.20).
4) Umbilical artery Doppler ultrasound as an alternative to CTG monitoring (all subgroups)
Three studies reported primary outcomes by subgroups. Two studies assessed women with suspected SGA/IUGR (Almstrom 1992; Haley 1997) and one study assessed women with hypertension/pre‐eclampsia (Pattinson 1994). There was no clear difference in perinatal mortality between groups for women with suspected SGA/IUGR (RR 0.33, 95% CI 0.05 to 2.09; 572 women; 2 studies) or women with hypertension/pre‐eclampsia (RR 3.57, 95% CI 0.42 to 30.73, 89 women,1 study). Findings were reported in Analysis 4.1. Studies assessed only perinatal mortality and none assessed serious neonatal morbidity. It was not possible to carry out any meaningful subgroup analysis due to a lack of data.
No additional outcomes were reported in any trials under this comparison.
5) Early ductus venosus Doppler ultrasound versus computerised CTG (one study, 333 women)
Two arms of a three‐arm trial recruiting women with singleton pregnancies compared these interventions (Lees 2013). This study was of high quality (low risk of bias for sequence generation and concealment allocation).
Main outcomes
There was no clear difference in any perinatal death after randomisation (RR 0.84, 95% CI 0.39 to 1.82; 333 infants, Analysis 5.1). Serious neonatal morbidity was reported separately as death or survival following severe morbidity; for the infants surviving following severe morbidity, there was no clear evidence of a difference between groups (RR 1.10, 95% CI 0.75 to 1.61; 333 women, Analysis 5.2).
Additional outcomes
There were insufficient data to show clear differences between early ductus venosus Doppler ultrasound versus CTG for stillbirth (RR 1.99, 95% CI 0.37 to 10.71, 333 babies, 1 study, Analysis 5.3), neonatal death (RR 0.60, 95% CI 0.22 to 1.60, 333 babies, 1 study, Analysis 5.4), any potentially preventable perinatal death (RR 0.83, 95% CI 0.37 to 1.86, 333 babies, 1 study, Analysis 5.5), fetal acidosis (RR 0.25, 95% CI 0.03 to 2.20, 333 babies, 1 study, Analysis 5.6), Apgar less than seven at five minutes (RR 0.87, 95% CI 0.44 to 1.72, 333 babies, 1 study, Analysis 5.7), infant requiring intubation/ventilation (RR 0.87, 95% CI 0.67 to 1.13, 333 babies, 1 study, Analysis 5.8), intraventricular haemorrhage (RR 8.95, 95% CI 0.49 to 164.87, 333 babies, 1 study, Analysis 5.9), bronchopulmonary dysplasia (RR 0.87, 95% CI 0.55 to 1.38, 333 babies, 1 study, Analysis 5.10), necrotising enterocolitis (RR 0.33, 95% CI 0.03 to 3.15; 333 babies, 1 study, Analysis 5.11), infant birthweight (grams) (MD 38.00, 95% CI ‐31.53 to 107.53, 333 babies, 1 study, Analysis 5.12), long‐term infant neurodevelopmental outcome (impairment at two years) (RR 0.60, 95% CI 0.30 to 1.18; 333 infants, 1 study, Analysis 5.13), long‐term infant neurodevelopmental outcome (cerebral palsy at two years) (RR 0.20, 95% CI 0.02 to 1.68, 333 infants, 1 study, Analysis 5.14), infant survival at two years without neurodevelopmental impairment (RR 1.07, 95% CI 0.92 to 1.23, 333 infants, 1 study, Analysis 5.15), and sepsis (proven) (RR 0.93, 95% CI 0.60 to 1.45, 333 babies, 1 study, Analysis 5.16).
Caesarean section (both elective and emergency), spontaneous vaginal birth, operative vaginal birth, induction of labour, oxytocin augmentation, requirement for neonatal resuscitation, neonatal fitting/seizures, preterm labour (onset of labour before 37 completed weeks of pregnancy), gestational age at birth, infant respiratory distress syndrome, meconium aspiration, neonatal admission to special care or intensive care unit, or both, hypoxic ischaemic encephalopathy (a condition of injury to the brain), length of infant hospital stay, and women's views of their care were not reported in this trial.
6) Late ductus venosus Doppler ultrasound versus computerised CTG (one study, 336 women)
Two arms of a three‐arm trial compared these interventions (Lees 2013). This trial recruited women with singleton pregnancies only. The study was of high quality (low risk of bias for sequence generation and concealment allocation).
Main outcomes
There was no clear difference in any perinatal death after randomisation (RR 1.28, 95% CI 0.64 to 2.55, 336 infants, 1 study Analysis 6.1). For the infants surviving following severe morbidity, there was no clear evidence of difference between groups (RR 0.98, 95% CI 0.66 to 1.45; 336 infants, 1 study, Analysis 6.2).
Additional outcomes
Fewer infants whose birth was triggered by late ductus venosus Doppler ultrasound had long‐term infant neurodevelopmental impairment at two years (RR 0.34, 95% CI 0.15 to 0.79; 336 infants, 1 study, Analysis 6.13).
There were insufficient data to show clear differences between late ductus venosus Doppler ultrasound versus CTG for stillbirth (RR 2.93, 95% CI 0.60 to 14.31, 336 babies; 1 study, Analysis 6.3), neonatal death (RR 1.07, 95% CI 0.47 to 2.46, 336 babies, 1 study, Analysis 6.4), any potentially preventable perinatal death (RR 1.22, 95% CI 0.59 to 2.53, 336 babies, 1 study, Analysis 6.5), fetal acidosis (RR 0.11, 95% CI 0.01 to 2.00; 336 babies; 1 study; Analysis 6.6), Apgar less than seven at five minutes (RR 1.28, 95% CI 0.69 to 2.37, 336 babies, 1 study, Analysis 6.7), infant requiring intubation/ventilation (RR 0.94, 95% CI 0.73 to 1.20, 336 babies, 1 study, Analysis 6.8), intraventricular haemorrhage (RR 16.60, 95% CI 0.97 to 285.35, 336 babies, 1 study, Analysis 6.9), bronchopulmonary dysplasia (RR 0.95, 95% CI 0.61 to 1.48; 336 babies, 1 study, Analysis 6.10), necrotising enterocolitis (RR 0.98, 95% CI 0.20 to 4.77; 336 babies, 1 study, Analysis 6.11), infant birthweight (grams) (MD 25.00, 95% CI ‐40.06 to 90.06; 336 babies, 1 study, Analysis 6.12), long‐term infant neurodevelopmental outcome (cerebral palsy at two years) (RR 0.09, 95% CI 0.00 to 1.59, 336 infants, 1 study, Analysis 6.14), infant survival at two years without neurodevelopmental impairment (RR 1.17, 95% CI 1.02 to 1.34, 336 infants, 1 study, Analysis 6.15), and sepsis (proven) (RR 0.68, 95% CI 0.42 to 1.11, 336 babies, 1 study, Analysis 6.16).
Caesarean section (both elective and emergency), spontaneous vaginal birth, operative vaginal birth, induction of labour, oxytocin augmentation, requirement for neonatal resuscitation, neonatal fitting/seizures, preterm labour (onset of labour before 37 completed weeks of pregnancy), gestational age at birth, infant respiratory distress syndrome, meconium aspiration, neonatal admission to special care or intensive care unit, or both, hypoxic ischaemic encephalopathy (a condition of injury to the brain), length of infant hospital stay, and women's views of their care were not reported in this trial.
7) Early ductus venosus Doppler ultrasound versus late ductus venosus Doppler ultrasound (one study, 337 women)
The three‐arm trial by Lees 2013, including women with singleton pregnancies, allowed comparison of early versus late ductus venosus Doppler ultrasound. The study was of high quality (low risk of bias for sequence generation and concealment allocation).
Main outcomes
There was no clear difference in any perinatal death after randomisation (RR 0.66, 95% CI 0.32 to 1.36; one study, 337 infants, Analysis 7.1). For the infants surviving following severe morbidity, there was no clear evidence of any difference between groups (RR 1.13, 95% CI 0.77 to 1.65, 337 infants, Analysis 7.2).
Additional outcomes
There were insufficient data to show clear differences between early ductus venosus Doppler ultrasound changes versus late changes for stillbirth (RR 0.68, 95% CI 0.20 to 2.36; 337 babies; 1 study, Analysis 7.3), neonatal death (RR 0.56, 95% CI 0.21 to 1.47, 337 babies, 1 study, Analysis 7.4), any potentially preventable perinatal death (RR 0.68, 95% CI 0.31 to 1.47, 337 babies, 1 study, Analysis 7.5), fetal acidosis (RR 3.05, 95% CI 0.13 to 74.43; 337 babies; 1 study, Analysis 7.6), Apgar less than seven at five minutes (RR 0.68, 95% CI 0.36 to 1.29, 337 babies, 1 study, Analysis 7.7), infant requiring intubation/ventilation (RR 0.93, 95% CI 0.71 to 1.21; 337 babies, 1 study, Analysis 7.8), intraventricular haemorrhage (RR 0.51, 95% CI 0.16 to 1.66; 337 babies, 1 study, Analysis 7.9), bronchopulmonary dysplasia (RR 0.92, 95% CI 0.58 to 1.46; 337 babies, 1 study, Analysis 7.10), necrotising enterocolitis (RR 0.34, 95% CI 0.04 to 3.23, 337 babies, 1 study, Analysis 7.11), infant birthweight (grams) (MD 13.00, 95% CI ‐59.31 to 85.31, 337 babies, 1 study, Analysis 7.12), long‐term infant neurodevelopmental outcome (any impairment at two years) (RR 1.75, 95% CI 0.70 to 4.32, 337 infants, 1 study, Analysis 7.13), cerebral palsy at two years (RR 3.05, 95% CI 0.13 to 74.43, 337 babies, 1 study, Analysis 7.14)), infant survival at two years without neurodevelopmental impairment (RR 0.91, 95% CI 0.80 to 1.03, 337 infants, 1 study, Analysis 7.15), and sepsis (proven) (RR 1.37, 95% CI 0.84 to 2.25, 337 babies, 1 study, Analysis 7.16).
Caesarean section (both elective and emergency), spontaneous vaginal birth, operative vaginal birth, induction of labour, oxytocin augmentation, requirement for neonatal resuscitation, neonatal fitting/seizures, preterm labour (onset of labour before 37 completed weeks of pregnancy), gestational age at birth, infant respiratory distress syndrome, meconium aspiration, neonatal admission to special care or intensive care unit, or both, hypoxic ischaemic encephalopathy (a condition of injury to the brain), length of infant hospital stay, and women's views of their care were not reported in this trial.
Subgroup analysis
A single study examined early or late ductus venosus Doppler ultrasound changes compared with CTG and no data were available to examine outcomes in clinical subgroups.
Discussion
Summary of main results
Nineteen trials involving 10,667 women were included in this update of the review.
Overall, the use of Doppler ultrasound versus no Doppler ultrasound in high‐risk pregnancy was associated with a reduction in perinatal deaths. There were also fewer inductions of labour and fewer caesarean sections. No clear difference was found in stillbirth, operative vaginal births, nor in Apgar score less than seven at five minutes. Serious neonatal morbidity was not pooled due to high heterogeneity between the three studies that reported it.
Four of the trials included in the main comparison compared the use of umbilical artery Doppler ultrasound with CTG. In these studies there was insufficient evidence to detect a clear difference in perinatal mortality. There were no clear differences between groups for other primary or secondary outcomes, apart from length of hospital stay which appeared to be reduced in the umbilical artery Doppler ultrasound group although the number of babies involved was too small to be able to say anything with any degree of certainty.
This update included one new three‐arm trial (Lees 2013) examining early and late ductus venosus Doppler changes, which was not incorporated into the main meta‐analyses. This study was at low risk of bias and included follow‐up to age two, however, it was underpowered to detect clinically important differences in the main outcomes of this review. The observed improvement in long‐term neurological outcomes in the cohort of babies in whom triggers for delivery were late changes in ductus venosus are of considerable interest. Ideally, this observation should be replicated in adequately powered studies. It is important to stress that all randomised women in Lees 2013 were also monitored with computerised cardiotocography and there were clearly defined safety net criteria. In effect, the beneficial effect in this high‐risk group of fetuses, if present, came from a comprehensive and serial assessment of fetal well‐being that included combination of Doppler ultrasound and computerised cardiotocography.
Overall completeness and applicability of evidence
The first meta‐analysis showing that Doppler studies of the umbilical artery, when used in singleton high‐risk pregnancies, resulted in the reduction in perinatal deaths without an increase in obstetric interventions was published in 1995 (Alfirevic 1995). This Cochrane review update confirms these results, although formal quality assessment of the included studies revealed very few studies of high quality by today's standards. An international agreement on how best to report clinical trials is relatively recent (CONSORT 2001) and most studies simply did not report information on random sequence generation and allocation blinding that is nowadays considered essential for quality assessment. This makes formal quality assessment of older studies very imprecise, resulting in most them being labelled as 'of unclear quality'.
The other criticism of the current evidence is lack of a hitherto agreed intervention(s) that should follow an abnormal Doppler finding. Doppler ultrasound can be regarded as a screening or diagnostic test and as such cannot, by itself, influence clinically important outcomes. It is the clinical decisions influenced by Doppler findings that may or may not change the outcome. The evidence from this review suggested that better timing of caesarean sections may be the 'cause' of reduced perinatal mortality. An overall decrease in caesarean sections appeared to be confined to emergency procedures which led us to believe that clinicians with no access to Doppler studies are more often faced with a seriously compromised baby in labour.
It is difficult to say to what extent this review constitutes the 'definitive' evidence of benefit (and absence of harm) for Doppler ultrasound. Some may argue that this meta‐analysis is an ideal example of the epidemiological evidence that should trigger a definitive, high‐quality large multi‐centre clinical trial with an agreed treatment protocol that follows an abnormal Doppler finding in the umbilical artery. Most clinicians feel that a window of opportunity for such a trial is long gone, at least in singleton pregnancies with suspected 'placental insufficiency'. However, it is quite possible that for some 'high‐risk' groups, Doppler of the umbilical artery does not offer any protection (e.g. post‐term pregnancy, uncomplicated dichorionic pregnancy). Large enough clinical trials of umbilical artery Doppler in these groups of women are unlikely to be funded as clinical attention focuses on more sophisticated use of Doppler ultrasound. It is hoped that more clinical trials evaluating such techniques (e.g. Doppler studies of the fetal ductus venosus and cerebroplacental ratio) will be of high quality, with adequate power to detect important differences in neonatal morbidity.
Quality of the evidence
The trials were generally at unclear risk of bias due to incomplete reporting of methods (see Figure 2), and there was evidence of possible publication bias, shown by asymmetric funnel plots for some analyses (see Figure 3; Figure 4; Figure 5; Figure 6).
GRADE assessments of the evidence were moderate for three outcomes: perinatal death, caesarean section, and induction of labour, low for stillbirth and Apgar score less than seven at five minutes, and very low for serious neonatal mortality for singletons. No trials reported serious neonatal morbidity for multiples. Overall, the evidence was downgraded due to missing information on trial methods (all outcomes), heterogeneity (neonatal morbidity) and imprecision (neonatal morbidity, stillbirth, Apgar score less than seven at five minutes), and we also suspected possible publication bias for several outcomes, although we did not downgrade for this reason (perinatal death, caesarean section, induction of labour, and Apgar score less than seven at five minutes) (seesummary of findings Table for the main comparison).
Only three studies in the main comparison (Haley 1997; Hofmeyr 1991; Nienhuis 1997) and one study in an additional comparison (Lees 2013) had adequate sequence generation and allocation concealment. Blinding women and/or staff in these trials was not generally feasible, and may have biased treatment decisions. In just three studies (Lees 2013; Newnham 1991; Nienhuis 1997), assessors of neonatal outcomes were blind to Doppler results. Full information on the number of women approached to take part in the studies, the numbers eligible for inclusion, and the overall refusal rate were not provided in most studies. While not sources of bias as such, high exclusion and refusal rates may affect the generalisability of the findings and the interpretation of the results.
These limitations in the current evidence mean that the results should be interpreted with some caution. Future research may change the results and our certainty about them.
To try to avoid bias associated with uneven post‐randomisation exclusions, we used the number of randomised women as our denominators. Where there is loss to follow‐up or missing data, using the number randomised as the denominator results in a more conservative effect estimate. If trial investigators used other denominators (e.g. the numbers included at different stages of follow‐up), it would mean that results in this review and those in published trial reports might differ slightly.
Potential biases in the review process
The assessment of risk of bias involves subjective judgements. This potential limitation is minimised by following the procedures in the Cochrane Handbook for Systematic Reviews of Interventions (Higgins 2011), with two or more review authors independently assessing studies and resolving any disagreement through discussion, and, if required, involving a third assessor in the decision. We undertook a comprehensive, systematic search of databases to reduce the potential for publication bias, without language or publication status restrictions.
Agreements and disagreements with other studies or reviews
Systematic reviews and meta‐analysis
Imdad 2011 reviewed published literature on the effectiveness of fetal movement monitoring and Doppler velocimetry for the detection and surveillance of high risk pregnancies, and their effect in the prevention of stillbirths. Pooled results from sixteen studies showed that Doppler velocimetry of umbilical and fetal arteries in high risk pregnancies leads to a reduction of 29% in perinatal mortality compared with no Doppler velocimetry (RR 0.71, 95% CI 0.52 to 0.98). The pooled results for impact of Doppler ultrasound versus no ultrasound on stillbirths showed a reduction of 35% (RR 0.65, 95% CI 0.41 to 1.04), although the result did not reach statistical significance. These results are in agreement with our findings.
In a critical appraisal of the use of umbilical artery Doppler ultrasound in high risk pregnancies, Westergaard 2001 aimed to determine which high‐risk pregnancies benefit from the use of Doppler velocimetry. Thirteen randomised controlled trials were divided into a "well‐defined studies", meaning studies that included pregnancies with strictly defined IUGR and/or hypertensive disease of pregnancy (six studies), and "general risk studies", meaning studies that included a variety of high‐risk pregnancies.
The Odds Ratio (OR) for perinatal mortality (singleton pregnancies and not‐malformed fetuses) was 0.66 (95% CI 0.36 to 1.22) in "well‐defined studies", and 0.68 (95% CI 0.43 to 1.08) in "general risk studies", respectively. (The same paper reported an audit of perinatal deaths by 32 international experts which concluded that more perinatal deaths were potentially avoidable by use of Doppler velocimetry in "well‐defined studies" than in "general risk studies".)
In the meta‐analysis for the "well‐defined studies" there was a significant reduction in antenatal admission (OR 0.56; 95% CI 0.43 to 0.72), inductions of labor and elective caesarean sections (OR 0.73; 95% CI 0.61 to 0.88), and overall caesarean sections (OR 0.78; 95% CI 0.65 to 0.94) respectively. Thus, the authors concluded that only in pregnancies with suspected IUGR and/or hypertensive disease of pregnancy would the use of umbilical artery Doppler velocimetry reduce the number of perinatal deaths and unnecessary obstetric interventions.
In the meta‐analysis in this review subgroup analysis for primary outcomes only was defined a priori in the protocol. We considered separately pregnancies with small for gestational age fetuses from those with hypertensive disease of pregnancy (Analysis 2.1). We did not include data from the study by Johnstone (Johnstone 1993) in the subgroup analysis, as this trial included pregnancies as being at risk by referral, although there was a subset of women with hypertension or suspected IUGR (754/2289).
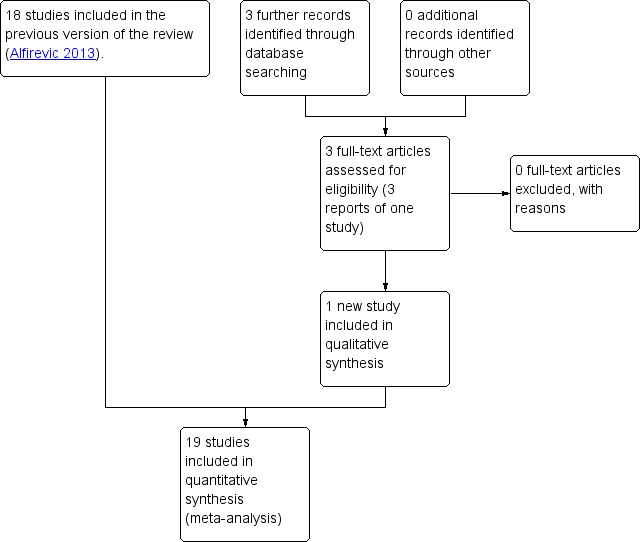
Study flow diagram.

Methodological quality summary: review authors' judgements about each methodological quality item for each included study.

Funnel plot of comparison: 1 Doppler ultrasound versus no Doppler ultrasound, outcome: 1.1 Any perinatal death after randomisation.

Funnel plot of comparison: 1 Doppler ultrasound versus no Doppler ultrasound, outcome: 1.8 Cesarean section (elective and emergency).

Funnel plot of comparison: 1 Doppler ultrasound versus no Doppler ultrasound, outcome: 1.9 Cesarean section ‐ elective.
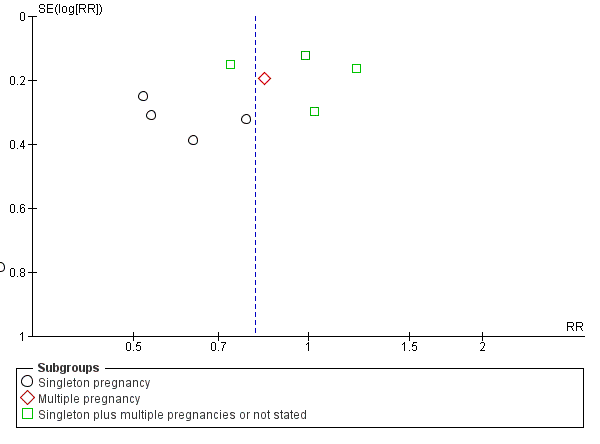
Funnel plot of comparison: 1 Doppler ultrasound versus no Doppler ultrasound, outcome: 1.10 Cesarean section ‐ emergency.

Comparison 1 Umbilical artery Doppler ultrasound versus no Doppler ultrasound, Outcome 1 Any perinatal death after randomisation.
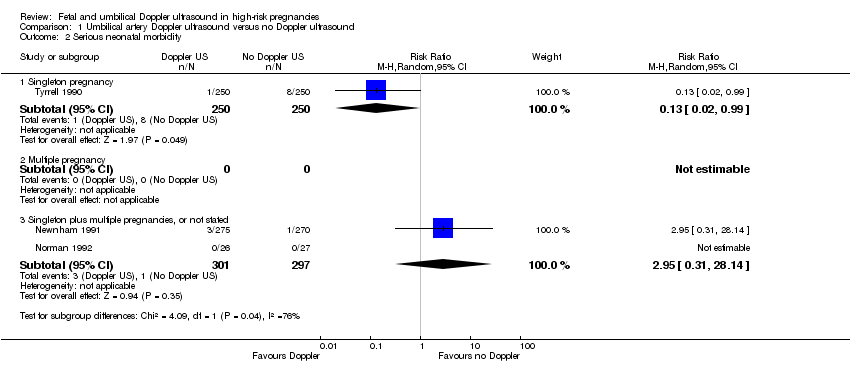
Comparison 1 Umbilical artery Doppler ultrasound versus no Doppler ultrasound, Outcome 2 Serious neonatal morbidity.

Comparison 1 Umbilical artery Doppler ultrasound versus no Doppler ultrasound, Outcome 3 Stillbirth.

Comparison 1 Umbilical artery Doppler ultrasound versus no Doppler ultrasound, Outcome 4 Neonatal death.

Comparison 1 Umbilical artery Doppler ultrasound versus no Doppler ultrasound, Outcome 5 Any potentially preventable perinatal death*.

Comparison 1 Umbilical artery Doppler ultrasound versus no Doppler ultrasound, Outcome 6 Apgar < 7 at 5 minutes.

Comparison 1 Umbilical artery Doppler ultrasound versus no Doppler ultrasound, Outcome 7 Caesarean section (elective and emergency).

Comparison 1 Umbilical artery Doppler ultrasound versus no Doppler ultrasound, Outcome 8 Caesarean section ‐ elective.
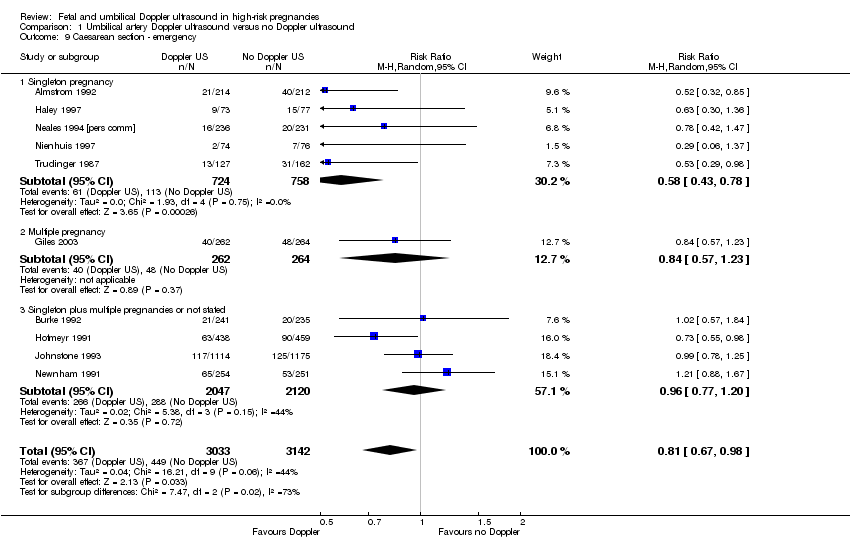
Comparison 1 Umbilical artery Doppler ultrasound versus no Doppler ultrasound, Outcome 9 Caesarean section ‐ emergency.

Comparison 1 Umbilical artery Doppler ultrasound versus no Doppler ultrasound, Outcome 10 Spontaneous vaginal birth.

Comparison 1 Umbilical artery Doppler ultrasound versus no Doppler ultrasound, Outcome 11 Operative vaginal birth.
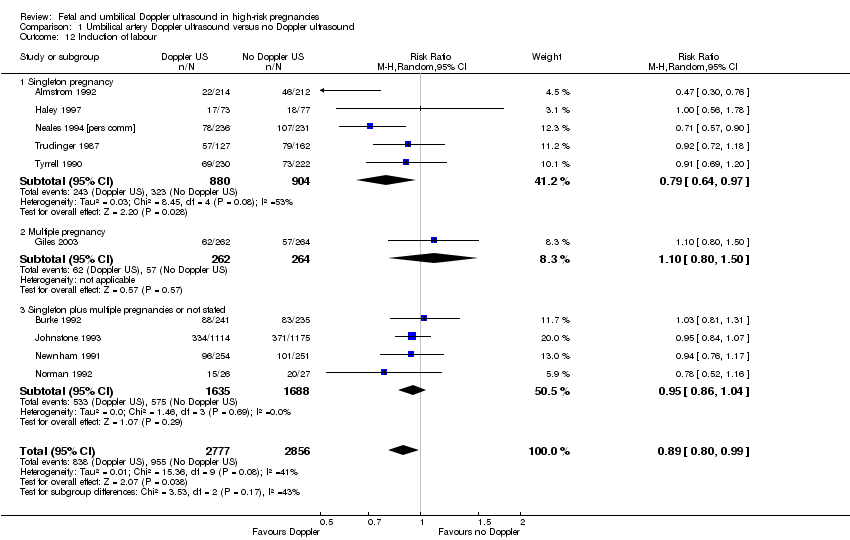
Comparison 1 Umbilical artery Doppler ultrasound versus no Doppler ultrasound, Outcome 12 Induction of labour.
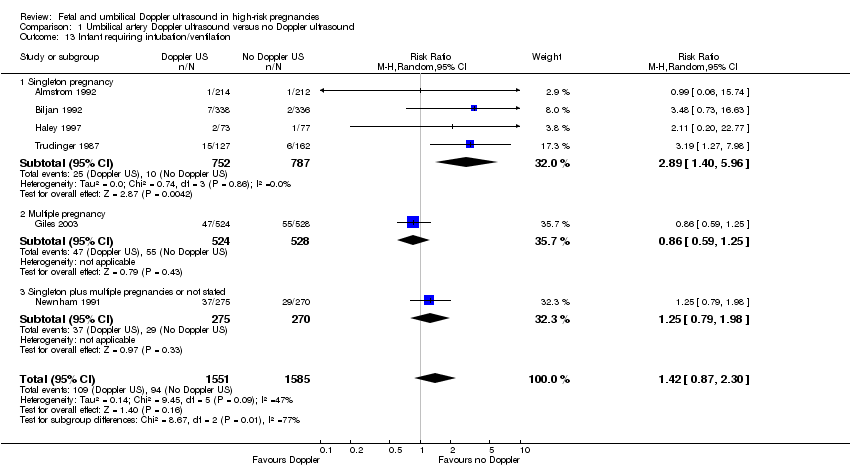
Comparison 1 Umbilical artery Doppler ultrasound versus no Doppler ultrasound, Outcome 13 Infant requiring intubation/ventilation.

Comparison 1 Umbilical artery Doppler ultrasound versus no Doppler ultrasound, Outcome 14 Neonatal fitting/seizures.

Comparison 1 Umbilical artery Doppler ultrasound versus no Doppler ultrasound, Outcome 15 Preterm labour.
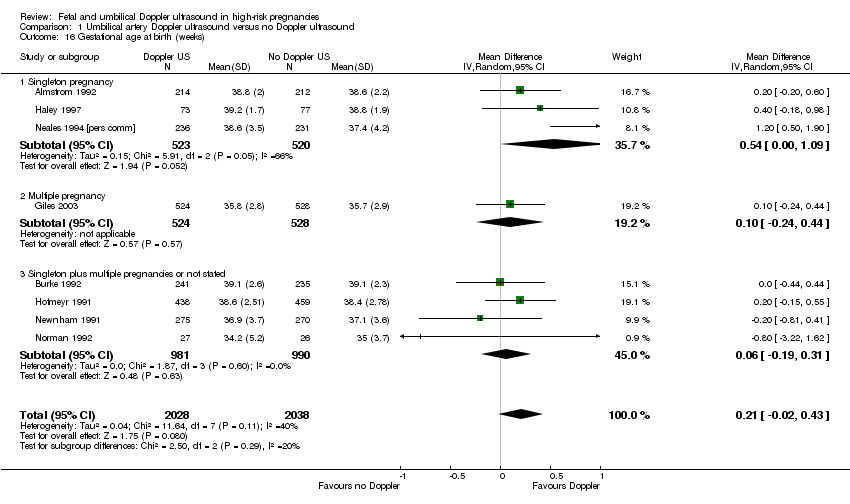
Comparison 1 Umbilical artery Doppler ultrasound versus no Doppler ultrasound, Outcome 16 Gestational age at birth (weeks).

Comparison 1 Umbilical artery Doppler ultrasound versus no Doppler ultrasound, Outcome 17 Infant respiratory distress syndrome (RDS).
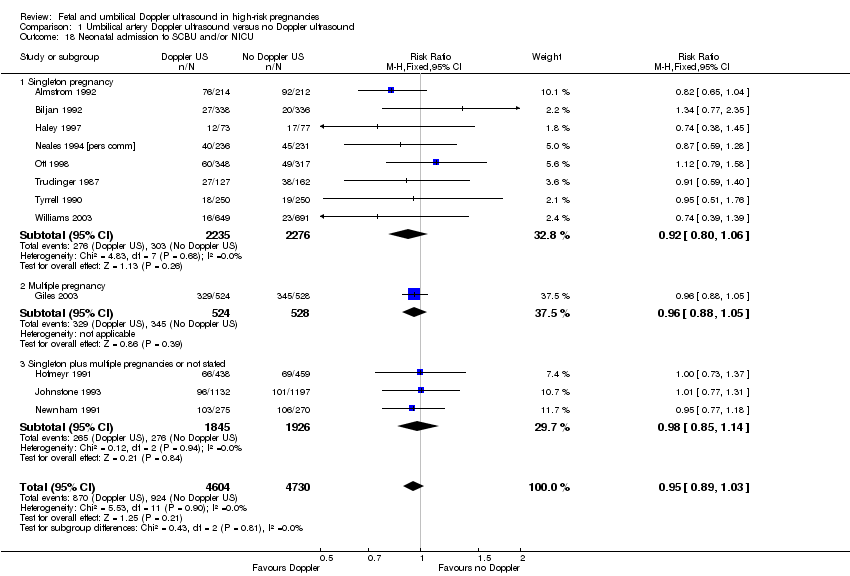
Comparison 1 Umbilical artery Doppler ultrasound versus no Doppler ultrasound, Outcome 18 Neonatal admission to SCBU and/or NICU.

Comparison 1 Umbilical artery Doppler ultrasound versus no Doppler ultrasound, Outcome 19 Hypoxic ischaemic encephalopathy.

Comparison 1 Umbilical artery Doppler ultrasound versus no Doppler ultrasound, Outcome 20 Intraventricular haemorrhage.

Comparison 1 Umbilical artery Doppler ultrasound versus no Doppler ultrasound, Outcome 21 Birthweight (grams).
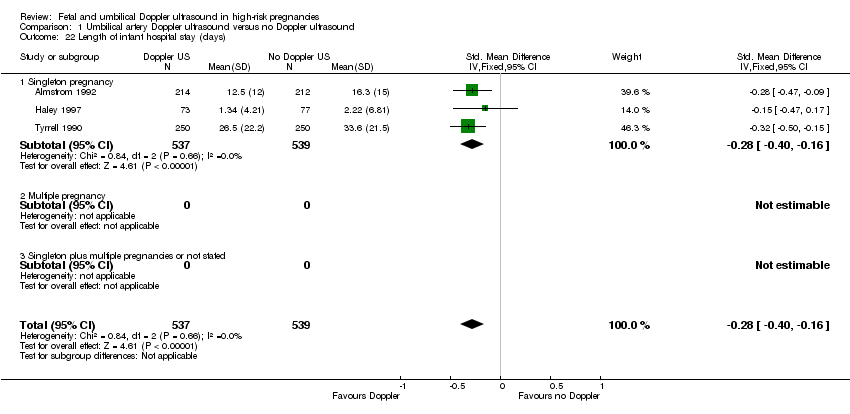
Comparison 1 Umbilical artery Doppler ultrasound versus no Doppler ultrasound, Outcome 22 Length of infant hospital stay (days).
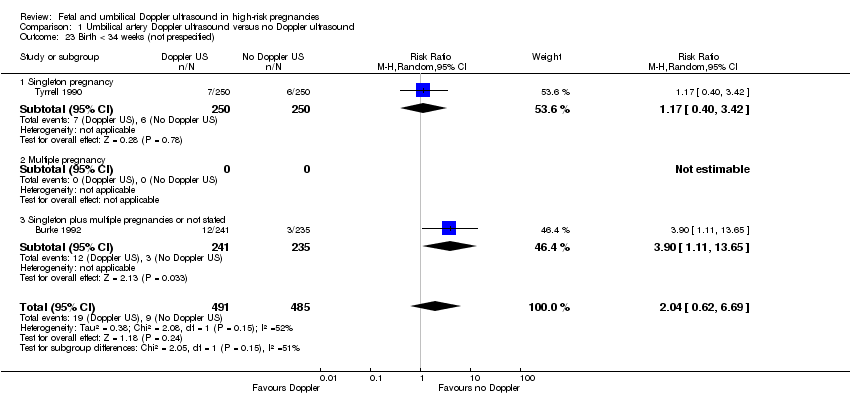
Comparison 1 Umbilical artery Doppler ultrasound versus no Doppler ultrasound, Outcome 23 Birth < 34 weeks (not prespecified).

Comparison 1 Umbilical artery Doppler ultrasound versus no Doppler ultrasound, Outcome 24 Antenatal admissions (not prespecified).

Comparison 1 Umbilical artery Doppler ultrasound versus no Doppler ultrasound, Outcome 25 Phototherapy for neonatal jaundice (not prespecified).

Comparison 1 Umbilical artery Doppler ultrasound versus no Doppler ultrasound, Outcome 26 Abnormal neurological development at 9 months (not prespecified).
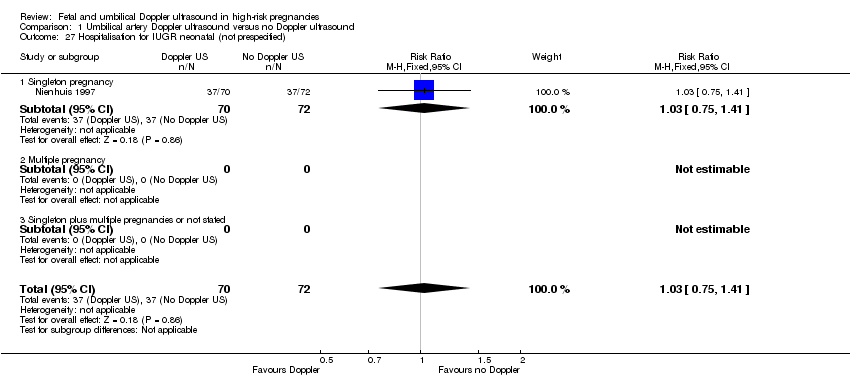
Comparison 1 Umbilical artery Doppler ultrasound versus no Doppler ultrasound, Outcome 27 Hospitalisation for IUGR neonatal (not prespecified).

Comparison 1 Umbilical artery Doppler ultrasound versus no Doppler ultrasound, Outcome 28 Fetal distress in labour (not prespecified).

Comparison 1 Umbilical artery Doppler ultrasound versus no Doppler ultrasound, Outcome 29 Birthweight < 5 percentile (not prespecified).

Comparison 1 Umbilical artery Doppler ultrasound versus no Doppler ultrasound, Outcome 30 Periventricular leucomalacia (not prespecified).

Comparison 1 Umbilical artery Doppler ultrasound versus no Doppler ultrasound, Outcome 31 Antenatal hospital stay (days) (not prespecified).

Comparison 2 Umbilical artery Doppler ultrasound versus no Doppler ultrasound (all subgroups), Outcome 1 Any perinatal death after randomisation.

Comparison 2 Umbilical artery Doppler ultrasound versus no Doppler ultrasound (all subgroups), Outcome 2 Serious neonatal morbidity.

Comparison 3 Umbilical artery Doppler ultrasound alone versus CTG alone, Outcome 1 Any perinatal death after randomisation.

Comparison 3 Umbilical artery Doppler ultrasound alone versus CTG alone, Outcome 2 Stillbirth.

Comparison 3 Umbilical artery Doppler ultrasound alone versus CTG alone, Outcome 3 Neonatal death.
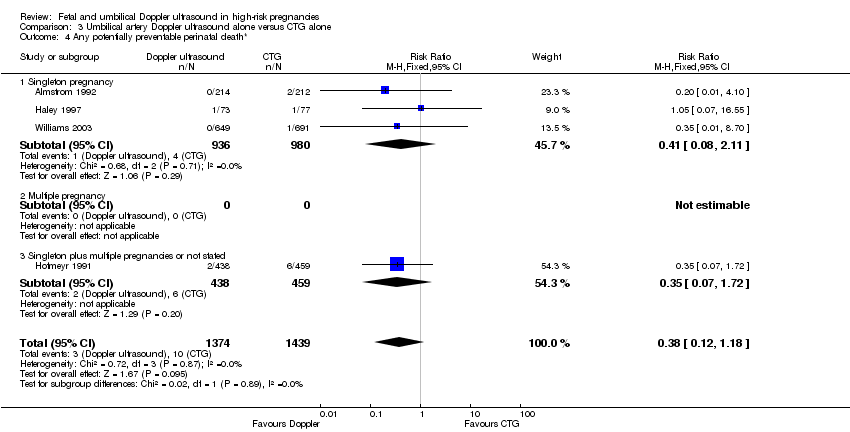
Comparison 3 Umbilical artery Doppler ultrasound alone versus CTG alone, Outcome 4 Any potentially preventable perinatal death*.

Comparison 3 Umbilical artery Doppler ultrasound alone versus CTG alone, Outcome 5 Apgar < 7 at 5 minutes.

Comparison 3 Umbilical artery Doppler ultrasound alone versus CTG alone, Outcome 6 Caesarean section (elective and emergency).

Comparison 3 Umbilical artery Doppler ultrasound alone versus CTG alone, Outcome 7 Caesarean section ‐ elective.
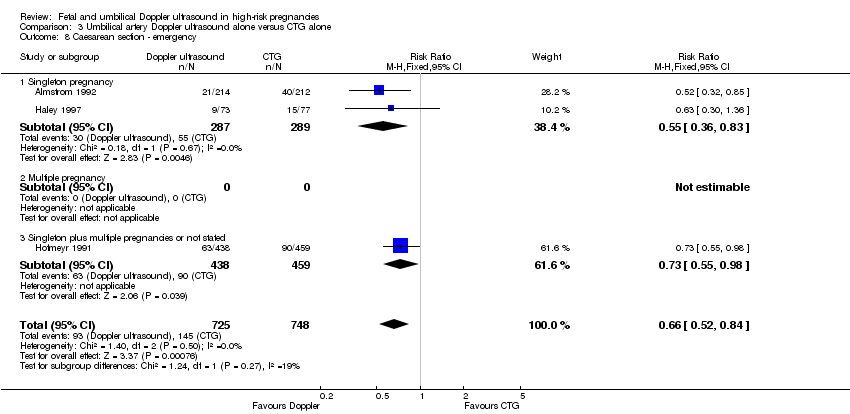
Comparison 3 Umbilical artery Doppler ultrasound alone versus CTG alone, Outcome 8 Caesarean section ‐ emergency.
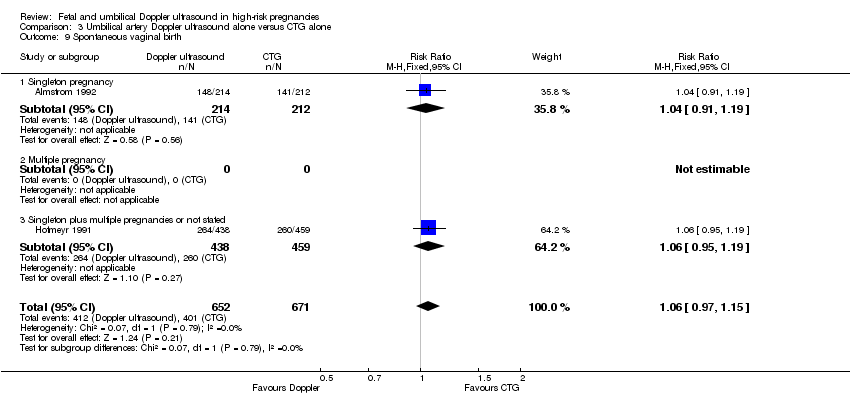
Comparison 3 Umbilical artery Doppler ultrasound alone versus CTG alone, Outcome 9 Spontaneous vaginal birth.
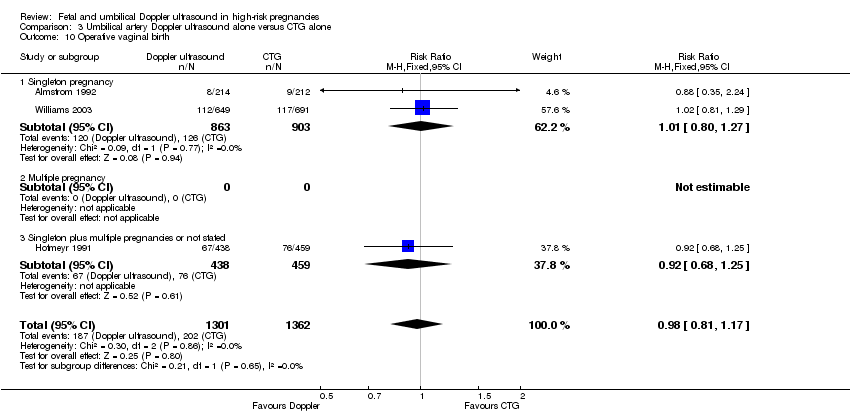
Comparison 3 Umbilical artery Doppler ultrasound alone versus CTG alone, Outcome 10 Operative vaginal birth.

Comparison 3 Umbilical artery Doppler ultrasound alone versus CTG alone, Outcome 11 Induction of labour.
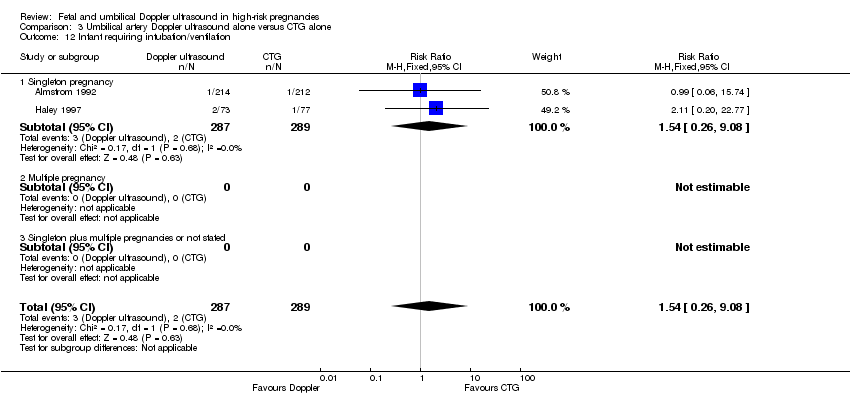
Comparison 3 Umbilical artery Doppler ultrasound alone versus CTG alone, Outcome 12 Infant requiring intubation/ventilation.
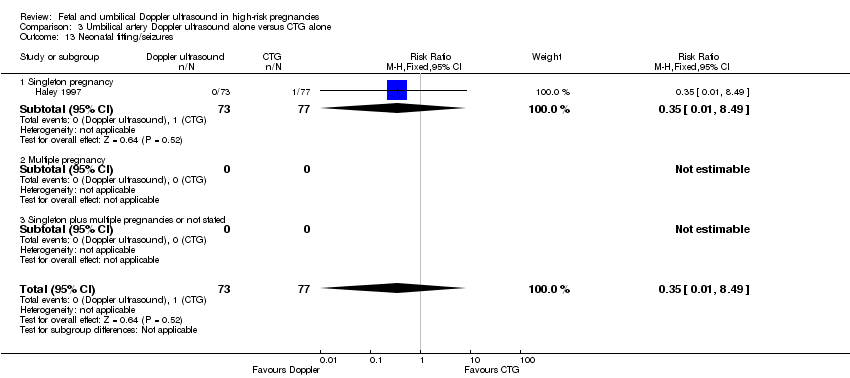
Comparison 3 Umbilical artery Doppler ultrasound alone versus CTG alone, Outcome 13 Neonatal fitting/seizures.

Comparison 3 Umbilical artery Doppler ultrasound alone versus CTG alone, Outcome 14 Gestational age at birth.

Comparison 3 Umbilical artery Doppler ultrasound alone versus CTG alone, Outcome 15 Neonatal admission to SCBU and/or NICU.

Comparison 3 Umbilical artery Doppler ultrasound alone versus CTG alone, Outcome 16 Infant birthweight (grams).
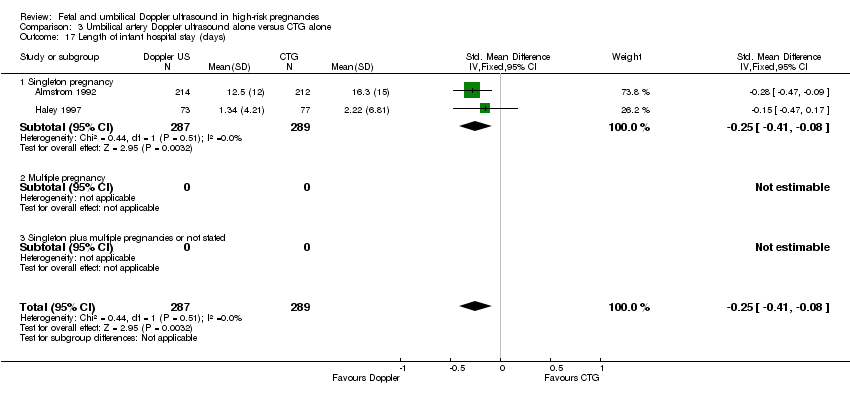
Comparison 3 Umbilical artery Doppler ultrasound alone versus CTG alone, Outcome 17 Length of infant hospital stay (days).
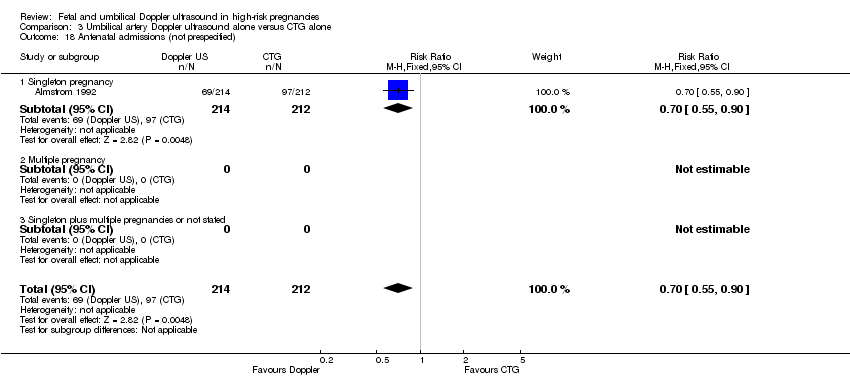
Comparison 3 Umbilical artery Doppler ultrasound alone versus CTG alone, Outcome 18 Antenatal admissions (not prespecified).

Comparison 3 Umbilical artery Doppler ultrasound alone versus CTG alone, Outcome 19 Phototherapy for neonatal jaundice (not prespecified).

Comparison 3 Umbilical artery Doppler ultrasound alone versus CTG alone, Outcome 20 Antenatal hospital stay (days) (not prespecified).

Comparison 4 Umbilical artery Doppler ultrasound alone versus CTG alone (all subgroups), Outcome 1 Any perinatal death after randomisation.

Comparison 5 Early ductus venosus Doppler ultrasound versus CTG, Outcome 1 Any perinatal death after randomisation.
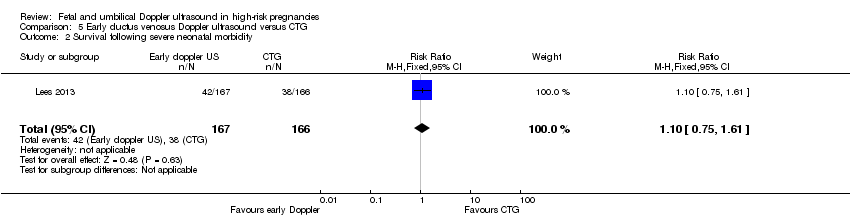
Comparison 5 Early ductus venosus Doppler ultrasound versus CTG, Outcome 2 Survival following severe neonatal morbidity.

Comparison 5 Early ductus venosus Doppler ultrasound versus CTG, Outcome 3 Stillbirth.
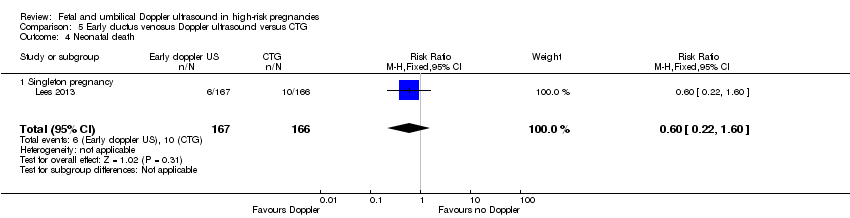
Comparison 5 Early ductus venosus Doppler ultrasound versus CTG, Outcome 4 Neonatal death.

Comparison 5 Early ductus venosus Doppler ultrasound versus CTG, Outcome 5 Any potentially preventable perinatal death*.

Comparison 5 Early ductus venosus Doppler ultrasound versus CTG, Outcome 6 Fetal acidosis.

Comparison 5 Early ductus venosus Doppler ultrasound versus CTG, Outcome 7 Apgar < 7 at 5 minutes.

Comparison 5 Early ductus venosus Doppler ultrasound versus CTG, Outcome 8 Infant requiring intubation/ventilation.
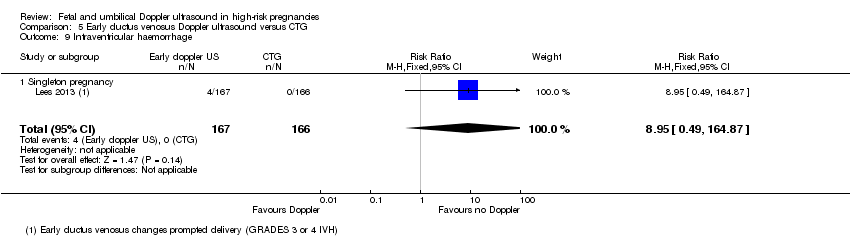
Comparison 5 Early ductus venosus Doppler ultrasound versus CTG, Outcome 9 Intraventricular haemorrhage.

Comparison 5 Early ductus venosus Doppler ultrasound versus CTG, Outcome 10 Bronchopulmonary dysplasia.

Comparison 5 Early ductus venosus Doppler ultrasound versus CTG, Outcome 11 Necrotising enterocolitis.

Comparison 5 Early ductus venosus Doppler ultrasound versus CTG, Outcome 12 Infant birthweight (grams).

Comparison 5 Early ductus venosus Doppler ultrasound versus CTG, Outcome 13 Long‐term infant neurodevelopmental outcome (impairment at 2 years).

Comparison 5 Early ductus venosus Doppler ultrasound versus CTG, Outcome 14 Long‐term infant neurodevelopmental outcome (cerebral palsy at 2 years).

Comparison 5 Early ductus venosus Doppler ultrasound versus CTG, Outcome 15 Infant survival at 2 years without neurodevelopmental impairment (not prespecified).

Comparison 5 Early ductus venosus Doppler ultrasound versus CTG, Outcome 16 Sepsis (proven) (not prespecified).

Comparison 6 Late ductus venosus Doppler ultrasound versus CTG, Outcome 1 Any perinatal death after randomisation.

Comparison 6 Late ductus venosus Doppler ultrasound versus CTG, Outcome 2 Survival following severe neonatal morbidity.
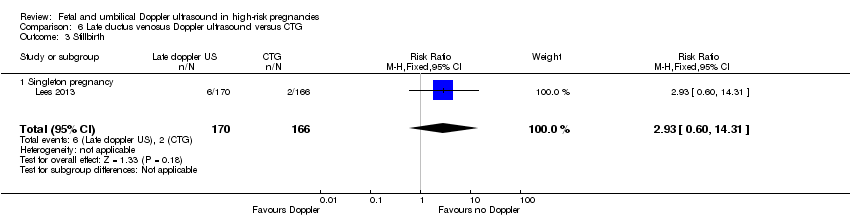
Comparison 6 Late ductus venosus Doppler ultrasound versus CTG, Outcome 3 Stillbirth.

Comparison 6 Late ductus venosus Doppler ultrasound versus CTG, Outcome 4 Neonatal death.

Comparison 6 Late ductus venosus Doppler ultrasound versus CTG, Outcome 5 Any potentially preventable perinatal death*.

Comparison 6 Late ductus venosus Doppler ultrasound versus CTG, Outcome 6 Fetal acidosis.
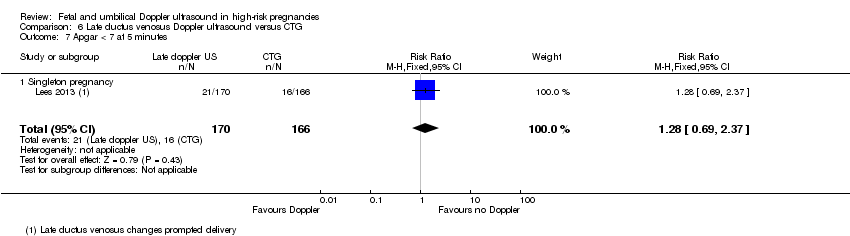
Comparison 6 Late ductus venosus Doppler ultrasound versus CTG, Outcome 7 Apgar < 7 at 5 minutes.
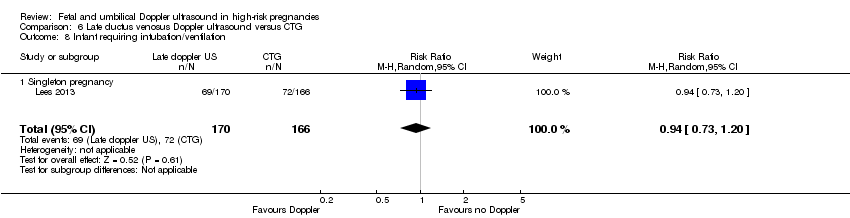
Comparison 6 Late ductus venosus Doppler ultrasound versus CTG, Outcome 8 Infant requiring intubation/ventilation.

Comparison 6 Late ductus venosus Doppler ultrasound versus CTG, Outcome 9 Intraventricular haemorrhage.

Comparison 6 Late ductus venosus Doppler ultrasound versus CTG, Outcome 10 Bronchopulmonary dysplasia.

Comparison 6 Late ductus venosus Doppler ultrasound versus CTG, Outcome 11 Necrotising enterocolitis.

Comparison 6 Late ductus venosus Doppler ultrasound versus CTG, Outcome 12 Infant birthweight (grams).

Comparison 6 Late ductus venosus Doppler ultrasound versus CTG, Outcome 13 Long‐term infant neurodevelopmental outcome (impairment at 2 years).

Comparison 6 Late ductus venosus Doppler ultrasound versus CTG, Outcome 14 Long‐term infant neurodevelopmental outcome (cerebral palsy at 2 years).
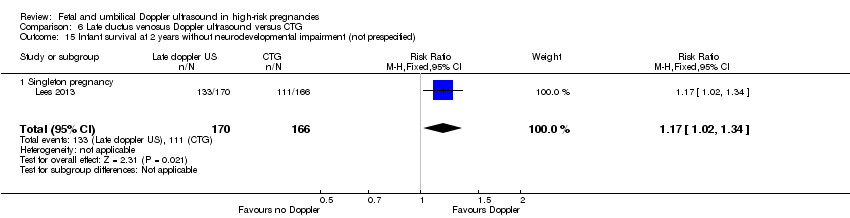
Comparison 6 Late ductus venosus Doppler ultrasound versus CTG, Outcome 15 Infant survival at 2 years without neurodevelopmental impairment (not prespecified).

Comparison 6 Late ductus venosus Doppler ultrasound versus CTG, Outcome 16 Sepsis (proven) (not prespecified).

Comparison 7 Early ductus venosus Doppler ultrasound versus late, Outcome 1 Any perinatal death after randomisation.

Comparison 7 Early ductus venosus Doppler ultrasound versus late, Outcome 2 Survival following severe neonatal morbidity.

Comparison 7 Early ductus venosus Doppler ultrasound versus late, Outcome 3 Stillbirth.

Comparison 7 Early ductus venosus Doppler ultrasound versus late, Outcome 4 Neonatal death.
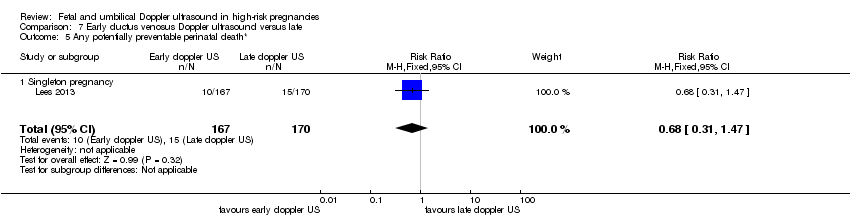
Comparison 7 Early ductus venosus Doppler ultrasound versus late, Outcome 5 Any potentially preventable perinatal death*.

Comparison 7 Early ductus venosus Doppler ultrasound versus late, Outcome 6 Fetal acidosis.

Comparison 7 Early ductus venosus Doppler ultrasound versus late, Outcome 7 Apgar < 7 at 5 minutes.

Comparison 7 Early ductus venosus Doppler ultrasound versus late, Outcome 8 Infant requiring intubation/ventilation.

Comparison 7 Early ductus venosus Doppler ultrasound versus late, Outcome 9 Intraventricular haemorrhage.

Comparison 7 Early ductus venosus Doppler ultrasound versus late, Outcome 10 Bronchopulmonary dysplasia.

Comparison 7 Early ductus venosus Doppler ultrasound versus late, Outcome 11 Necrotising enterocolitis.
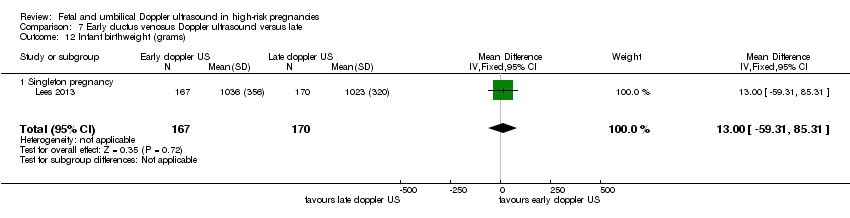
Comparison 7 Early ductus venosus Doppler ultrasound versus late, Outcome 12 Infant birthweight (grams).

Comparison 7 Early ductus venosus Doppler ultrasound versus late, Outcome 13 Long‐term infant neurodevelopmental outcome (impairment at 2 years).

Comparison 7 Early ductus venosus Doppler ultrasound versus late, Outcome 14 Long‐term infant neurodevelopmental outcome (cerebral palsy at 2 years).
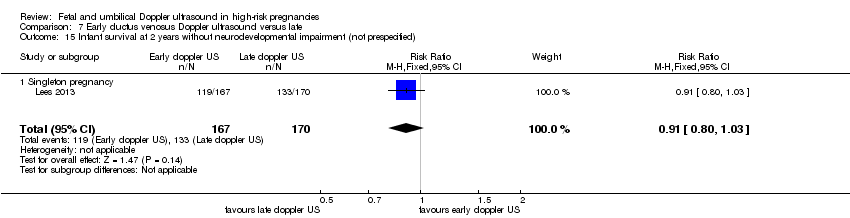
Comparison 7 Early ductus venosus Doppler ultrasound versus late, Outcome 15 Infant survival at 2 years without neurodevelopmental impairment (not prespecified).
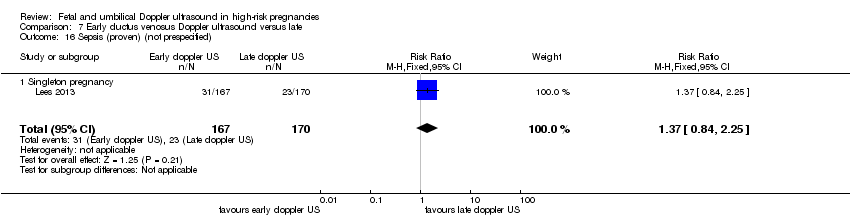
Comparison 7 Early ductus venosus Doppler ultrasound versus late, Outcome 16 Sepsis (proven) (not prespecified).
| Umbilical artery Doppler ultrasound compared to no Doppler ultrasound in high‐risk pregnancies | ||||||
| Patient or population: pregnant women at increased risk of fetal complications | ||||||
| Outcomes | Anticipated absolute effects* (95% CI) | Relative effect | № of participants | Quality of the evidence | Comments | |
| Risk with no Doppler ultrasound | Risk with umbilical artery Doppler ultrasound | |||||
| Any perinatal death after randomisation | Study population | RR 0.71 | 10225 | ⊕⊕⊕⊝ | ||
| 17 per 1000 | 12 per 1000 | |||||
| Serious neonatal morbidity | Study population | 1098 | ⊕⊝⊝⊝ | We did not pool the data for this outcome due to high heterogeneity (the direction of effect in the 2 studies contributing data were not consistent). | ||
| Stillbirth | Study population | RR 0.65 | 9560 | ⊕⊕⊝⊝ | ||
| 9 per 1000 | 6 per 1000 | |||||
| Apgar < 7 at 5 minutes | Study population | RR 0.92 | 6321 | ⊕⊕⊝⊝ | ||
| 29 per 1000 | 26 per 1000 | |||||
| Caesarean section (elective and emergency) | Study population | RR 0.90 | 7918 | ⊕⊕⊕⊝ | ||
| 263 per 1000 | 237 per 1000 | |||||
| Induction of labour | Study population | RR 0.89 | 5633 | ⊕⊕⊕⊝ | ||
| 334 per 1000 | 298 per 1000 | |||||
| Long‐term infant neurodevelopmental outcome (impairment at 2 years) | Study population | ‐ | (0 studies) | ‐ | There has been no comparative long‐term follow‐up of babies exposed to Doppler ultrasound in pregnancy in women at increased risk of complications. | |
| see comment | see comment | |||||
| *The risk in the intervention group (and its 95% confidence interval) is based on the assumed risk in the comparison group and the relative effect of the intervention (and its 95% CI). | ||||||
| GRADE Working Group grades of evidence | ||||||
| 1 All studies assessed as having design limitations due to lack of information. 2 Although there was some evidence of funnel plot asymmetry suggesting small‐study effect (with studies with smaller sample sizes appearing to have a more pronounced effect), we did not downgrade for publication bias because, for our selected outcomes, individual studies did not reach statistical significance and there was low heterogeneity across all studies for this outcome. 3 High heterogeneity (I² statistic 76%) with direction of effect different in the 2 studies contributing data. 4 95% CI crossing the line of no effect. Low event rate. 5 Wide 95% CI crossing the line of no effect. | ||||||
| Outcome or subgroup title | No. of studies | No. of participants | Statistical method | Effect size |
| 1 Any perinatal death after randomisation Show forest plot | 16 | 10225 | Risk Ratio (M‐H, Fixed, 95% CI) | 0.71 [0.52, 0.98] |
| 1.1 Singleton pregnancy | 9 | 4661 | Risk Ratio (M‐H, Fixed, 95% CI) | 0.59 [0.35, 1.01] |
| 1.2 Multiple pregnancy | 1 | 1052 | Risk Ratio (M‐H, Fixed, 95% CI) | 0.88 [0.32, 2.41] |
| 1.3 Singleton plus multiple pregnancies, or not stated | 6 | 4512 | Risk Ratio (M‐H, Fixed, 95% CI) | 0.78 [0.51, 1.19] |
| 2 Serious neonatal morbidity Show forest plot | 3 | Risk Ratio (M‐H, Random, 95% CI) | Subtotals only | |
| 2.1 Singleton pregnancy | 1 | 500 | Risk Ratio (M‐H, Random, 95% CI) | 0.13 [0.02, 0.99] |
| 2.2 Multiple pregnancy | 0 | 0 | Risk Ratio (M‐H, Random, 95% CI) | 0.0 [0.0, 0.0] |
| 2.3 Singleton plus multiple pregnancies, or not stated | 2 | 598 | Risk Ratio (M‐H, Random, 95% CI) | 2.95 [0.31, 28.14] |
| 3 Stillbirth Show forest plot | 15 | 9560 | Risk Ratio (M‐H, Fixed, 95% CI) | 0.65 [0.41, 1.04] |
| 3.1 Singleton pregnancy | 8 | 3996 | Risk Ratio (M‐H, Fixed, 95% CI) | 0.61 [0.31, 1.19] |
| 3.2 Multiple pregnancy | 1 | 1052 | Risk Ratio (M‐H, Fixed, 95% CI) | 0.67 [0.11, 4.00] |
| 3.3 Singleton plus multiple pregnancy, or not stated | 6 | 4512 | Risk Ratio (M‐H, Fixed, 95% CI) | 0.70 [0.35, 1.39] |
| 4 Neonatal death Show forest plot | 13 | 8167 | Risk Ratio (M‐H, Fixed, 95% CI) | 0.81 [0.53, 1.24] |
| 4.1 Singleton pregnancy | 7 | 2656 | Risk Ratio (M‐H, Fixed, 95% CI) | 0.69 [0.31, 1.53] |
| 4.2 Multiple pregnancy | 1 | 1052 | Risk Ratio (M‐H, Fixed, 95% CI) | 1.01 [0.29, 3.46] |
| 4.3 Singleton plus multiple pregnancies, or not stated | 5 | 4459 | Risk Ratio (M‐H, Fixed, 95% CI) | 0.84 [0.48, 1.45] |
| 5 Any potentially preventable perinatal death* Show forest plot | 16 | 10225 | Risk Ratio (M‐H, Fixed, 95% CI) | 0.67 [0.46, 0.98] |
| 5.1 Singleton pregnancy | 9 | 4661 | Risk Ratio (M‐H, Fixed, 95% CI) | 0.58 [0.30, 1.13] |
| 5.2 Multiple pregnancy | 1 | 1052 | Risk Ratio (M‐H, Fixed, 95% CI) | 0.88 [0.32, 2.41] |
| 5.3 Singleton plus multiple pregnancies or not stated | 6 | 4512 | Risk Ratio (M‐H, Fixed, 95% CI) | 0.69 [0.41, 1.15] |
| 6 Apgar < 7 at 5 minutes Show forest plot | 7 | 6321 | Risk Ratio (M‐H, Fixed, 95% CI) | 0.92 [0.69, 1.24] |
| 6.1 Singleton pregnancy | 4 | 2555 | Risk Ratio (M‐H, Fixed, 95% CI) | 0.70 [0.45, 1.09] |
| 6.2 Multiple pregnancy | 0 | 0 | Risk Ratio (M‐H, Fixed, 95% CI) | 0.0 [0.0, 0.0] |
| 6.3 Singleton plus multiple pregnancies or not stated | 3 | 3766 | Risk Ratio (M‐H, Fixed, 95% CI) | 1.16 [0.77, 1.73] |
| 7 Caesarean section (elective and emergency) Show forest plot | 14 | 7918 | Risk Ratio (M‐H, Fixed, 95% CI) | 0.90 [0.84, 0.97] |
| 7.1 Singleton pregnancy | 7 | 2929 | Risk Ratio (M‐H, Fixed, 95% CI) | 0.84 [0.75, 0.95] |
| 7.2 Multiple pregnancy | 1 | 526 | Risk Ratio (M‐H, Fixed, 95% CI) | 0.96 [0.77, 1.19] |
| 7.3 Singleton plus multiple pregnancies or not stated | 6 | 4463 | Risk Ratio (M‐H, Fixed, 95% CI) | 0.94 [0.84, 1.05] |
| 8 Caesarean section ‐ elective Show forest plot | 11 | 6627 | Risk Ratio (M‐H, Fixed, 95% CI) | 1.07 [0.93, 1.22] |
| 8.1 Singleton pregnancy | 6 | 1934 | Risk Ratio (M‐H, Fixed, 95% CI) | 1.11 [0.90, 1.38] |
| 8.2 Multiple pregnancy | 1 | 526 | Risk Ratio (M‐H, Fixed, 95% CI) | 1.06 [0.77, 1.47] |
| 8.3 Singleton plus multiple pregnancies or not stated | 4 | 4167 | Risk Ratio (M‐H, Fixed, 95% CI) | 1.03 [0.84, 1.26] |
| 9 Caesarean section ‐ emergency Show forest plot | 10 | 6175 | Risk Ratio (M‐H, Random, 95% CI) | 0.81 [0.67, 0.98] |
| 9.1 Singleton pregnancy | 5 | 1482 | Risk Ratio (M‐H, Random, 95% CI) | 0.58 [0.43, 0.78] |
| 9.2 Multiple pregnancy | 1 | 526 | Risk Ratio (M‐H, Random, 95% CI) | 0.84 [0.57, 1.23] |
| 9.3 Singleton plus multiple pregnancies or not stated | 4 | 4167 | Risk Ratio (M‐H, Random, 95% CI) | 0.96 [0.77, 1.20] |
| 10 Spontaneous vaginal birth Show forest plot | 5 | 2504 | Risk Ratio (M‐H, Fixed, 95% CI) | 1.04 [0.98, 1.10] |
| 10.1 Singleton pregnancy | 2 | 576 | Risk Ratio (M‐H, Fixed, 95% CI) | 1.07 [0.96, 1.18] |
| 10.2 Multiple pregnancy | 1 | 526 | Risk Ratio (M‐H, Fixed, 95% CI) | 1.03 [0.90, 1.19] |
| 10.3 Singleton plus multiple pregnancies or not stated | 2 | 1402 | Risk Ratio (M‐H, Fixed, 95% CI) | 1.03 [0.95, 1.12] |
| 11 Operative vaginal birth Show forest plot | 4 | 2813 | Risk Ratio (M‐H, Fixed, 95% CI) | 0.95 [0.80, 1.14] |
| 11.1 Singleton pregnancy | 3 | 1916 | Risk Ratio (M‐H, Fixed, 95% CI) | 0.97 [0.78, 1.22] |
| 11.2 Multiple pregnancy | 0 | 0 | Risk Ratio (M‐H, Fixed, 95% CI) | 0.0 [0.0, 0.0] |
| 11.3 Singleton plus multiple pregnancies or not stated | 1 | 897 | Risk Ratio (M‐H, Fixed, 95% CI) | 0.92 [0.68, 1.25] |
| 12 Induction of labour Show forest plot | 10 | 5633 | Risk Ratio (M‐H, Random, 95% CI) | 0.89 [0.80, 0.99] |
| 12.1 Singleton pregnancy | 5 | 1784 | Risk Ratio (M‐H, Random, 95% CI) | 0.79 [0.64, 0.97] |
| 12.2 Multiple pregnancy | 1 | 526 | Risk Ratio (M‐H, Random, 95% CI) | 1.10 [0.80, 1.50] |
| 12.3 Singleton plus multiple pregnancies or not stated | 4 | 3323 | Risk Ratio (M‐H, Random, 95% CI) | 0.95 [0.86, 1.04] |
| 13 Infant requiring intubation/ventilation Show forest plot | 6 | 3136 | Risk Ratio (M‐H, Random, 95% CI) | 1.42 [0.87, 2.30] |
| 13.1 Singleton pregnancy | 4 | 1539 | Risk Ratio (M‐H, Random, 95% CI) | 2.89 [1.40, 5.96] |
| 13.2 Multiple pregnancy | 1 | 1052 | Risk Ratio (M‐H, Random, 95% CI) | 0.86 [0.59, 1.25] |
| 13.3 Singleton plus multiple pregnancies or not stated | 1 | 545 | Risk Ratio (M‐H, Random, 95% CI) | 1.25 [0.79, 1.98] |
| 14 Neonatal fitting/seizures Show forest plot | 1 | 150 | Risk Ratio (M‐H, Fixed, 95% CI) | 0.35 [0.01, 8.49] |
| 14.1 Singleton pregnancy | 1 | 150 | Risk Ratio (M‐H, Fixed, 95% CI) | 0.35 [0.01, 8.49] |
| 14.2 Multiple pregnancy | 0 | 0 | Risk Ratio (M‐H, Fixed, 95% CI) | 0.0 [0.0, 0.0] |
| 14.3 Singleton plus multiple pregnancies or not stated | 0 | 0 | Risk Ratio (M‐H, Fixed, 95% CI) | 0.0 [0.0, 0.0] |
| 15 Preterm labour Show forest plot | 2 | 626 | Risk Ratio (M‐H, Fixed, 95% CI) | 1.12 [0.72, 1.75] |
| 15.1 Singleton pregnancy | 1 | 150 | Risk Ratio (M‐H, Fixed, 95% CI) | 1.03 [0.51, 2.07] |
| 15.2 Multiple pregnancy | 0 | 0 | Risk Ratio (M‐H, Fixed, 95% CI) | 0.0 [0.0, 0.0] |
| 15.3 Singleton plus multiple pregnancy or not stated | 1 | 476 | Risk Ratio (M‐H, Fixed, 95% CI) | 1.18 [0.66, 2.11] |
| 16 Gestational age at birth (weeks) Show forest plot | 8 | 4066 | Mean Difference (IV, Random, 95% CI) | 0.21 [‐0.02, 0.43] |
| 16.1 Singleton pregnancy | 3 | 1043 | Mean Difference (IV, Random, 95% CI) | 0.54 [‐0.00, 1.09] |
| 16.2 Multiple pregnancy | 1 | 1052 | Mean Difference (IV, Random, 95% CI) | 0.10 [‐0.24, 0.44] |
| 16.3 Singleton plus multiple pregnancies or not stated | 4 | 1971 | Mean Difference (IV, Random, 95% CI) | 0.06 [‐0.19, 0.31] |
| 17 Infant respiratory distress syndrome (RDS) Show forest plot | 1 | 107 | Risk Ratio (M‐H, Fixed, 95% CI) | 1.06 [0.07, 16.48] |
| 17.1 Singleton pregnancy | 1 | 107 | Risk Ratio (M‐H, Fixed, 95% CI) | 1.06 [0.07, 16.48] |
| 17.2 Multiple pregnancy | 0 | 0 | Risk Ratio (M‐H, Fixed, 95% CI) | 0.0 [0.0, 0.0] |
| 17.3 Singleton plus multiple pregnancies or not stated | 0 | 0 | Risk Ratio (M‐H, Fixed, 95% CI) | 0.0 [0.0, 0.0] |
| 18 Neonatal admission to SCBU and/or NICU Show forest plot | 12 | 9334 | Risk Ratio (M‐H, Fixed, 95% CI) | 0.95 [0.89, 1.03] |
| 18.1 Singleton pregnancy | 8 | 4511 | Risk Ratio (M‐H, Fixed, 95% CI) | 0.92 [0.80, 1.06] |
| 18.2 Multiple pregnancy | 1 | 1052 | Risk Ratio (M‐H, Fixed, 95% CI) | 0.96 [0.88, 1.05] |
| 18.3 Singleton plus multiple pregnancies or not stated | 3 | 3771 | Risk Ratio (M‐H, Fixed, 95% CI) | 0.98 [0.85, 1.14] |
| 19 Hypoxic ischaemic encephalopathy Show forest plot | 2 | 1045 | Risk Ratio (M‐H, Random, 95% CI) | 0.65 [0.01, 33.07] |
| 19.1 Singleton pregnancy | 1 | 500 | Risk Ratio (M‐H, Random, 95% CI) | 0.09 [0.01, 1.64] |
| 19.2 Multiple pregnancy | 0 | 0 | Risk Ratio (M‐H, Random, 95% CI) | 0.0 [0.0, 0.0] |
| 19.3 Singleton plus multiple pregnancies or not stated | 1 | 545 | Risk Ratio (M‐H, Random, 95% CI) | 4.91 [0.24, 101.79] |
| 20 Intraventricular haemorrhage Show forest plot | 4 | 2008 | Risk Ratio (M‐H, Fixed, 95% CI) | 1.42 [0.47, 4.30] |
| 20.1 Singleton pregnancy | 3 | 1463 | Risk Ratio (M‐H, Fixed, 95% CI) | 1.26 [0.38, 4.16] |
| 20.2 Multiple pregnancy | 0 | 0 | Risk Ratio (M‐H, Fixed, 95% CI) | 0.0 [0.0, 0.0] |
| 20.3 Singleton plus multiple pregnancies or not stated | 1 | 545 | Risk Ratio (M‐H, Fixed, 95% CI) | 2.95 [0.12, 71.99] |
| 21 Birthweight (grams) Show forest plot | 7 | 3887 | Mean Difference (IV, Fixed, 95% CI) | 31.33 [‐8.70, 71.37] |
| 21.1 Singleton pregnancy | 3 | 1916 | Mean Difference (IV, Fixed, 95% CI) | 49.34 [‐0.62, 99.31] |
| 21.2 Multiple pregnancy | 0 | 0 | Mean Difference (IV, Fixed, 95% CI) | 0.0 [0.0, 0.0] |
| 21.3 Singleton plus multiple pregnancies or not stated | 4 | 1971 | Mean Difference (IV, Fixed, 95% CI) | ‐0.95 [‐67.84, 65.95] |
| 22 Length of infant hospital stay (days) Show forest plot | 3 | 1076 | Std. Mean Difference (IV, Fixed, 95% CI) | ‐0.28 [‐0.40, ‐0.16] |
| 22.1 Singleton pregnancy | 3 | 1076 | Std. Mean Difference (IV, Fixed, 95% CI) | ‐0.28 [‐0.40, ‐0.16] |
| 22.2 Multiple pregnancy | 0 | 0 | Std. Mean Difference (IV, Fixed, 95% CI) | 0.0 [0.0, 0.0] |
| 22.3 Singleton plus multiple pregnancies or not stated | 0 | 0 | Std. Mean Difference (IV, Fixed, 95% CI) | 0.0 [0.0, 0.0] |
| 23 Birth < 34 weeks (not prespecified) Show forest plot | 2 | 976 | Risk Ratio (M‐H, Random, 95% CI) | 2.04 [0.62, 6.69] |
| 23.1 Singleton pregnancy | 1 | 500 | Risk Ratio (M‐H, Random, 95% CI) | 1.17 [0.40, 3.42] |
| 23.2 Multiple pregnancy | 0 | 0 | Risk Ratio (M‐H, Random, 95% CI) | 0.0 [0.0, 0.0] |
| 23.3 Singleton plus multiple pregnancies or not stated | 1 | 476 | Risk Ratio (M‐H, Random, 95% CI) | 3.90 [1.11, 13.65] |
| 24 Antenatal admissions (not prespecified) Show forest plot | 2 | 893 | Risk Ratio (M‐H, Fixed, 95% CI) | 0.72 [0.60, 0.88] |
| 24.1 Singleton pregnancy | 2 | 893 | Risk Ratio (M‐H, Fixed, 95% CI) | 0.72 [0.60, 0.88] |
| 24.2 Multiple pregnancy | 0 | 0 | Risk Ratio (M‐H, Fixed, 95% CI) | 0.0 [0.0, 0.0] |
| 24.3 Singleton plus multiple pregnancies or not stated | 0 | 0 | Risk Ratio (M‐H, Fixed, 95% CI) | 0.0 [0.0, 0.0] |
| 25 Phototherapy for neonatal jaundice (not prespecified) Show forest plot | 1 | 150 | Risk Ratio (M‐H, Fixed, 95% CI) | 0.15 [0.01, 2.87] |
| 25.1 Singleton pregnancy | 1 | 150 | Risk Ratio (M‐H, Fixed, 95% CI) | 0.15 [0.01, 2.87] |
| 25.2 Multiple pregnancy | 0 | 0 | Risk Ratio (M‐H, Fixed, 95% CI) | 0.0 [0.0, 0.0] |
| 25.3 Singleton plus multiple pregnancies or not stated | 0 | 0 | Risk Ratio (M‐H, Fixed, 95% CI) | 0.0 [0.0, 0.0] |
| 26 Abnormal neurological development at 9 months (not prespecified) Show forest plot | 1 | 137 | Risk Ratio (M‐H, Fixed, 95% CI) | 0.61 [0.26, 1.45] |
| 26.1 Singleton pregnancy | 1 | 137 | Risk Ratio (M‐H, Fixed, 95% CI) | 0.61 [0.26, 1.45] |
| 26.2 Multiple pregnancy | 0 | 0 | Risk Ratio (M‐H, Fixed, 95% CI) | 0.0 [0.0, 0.0] |
| 26.3 Singleton plus multiple pregnancies or not stated | 0 | 0 | Risk Ratio (M‐H, Fixed, 95% CI) | 0.0 [0.0, 0.0] |
| 27 Hospitalisation for IUGR neonatal (not prespecified) Show forest plot | 1 | 142 | Risk Ratio (M‐H, Fixed, 95% CI) | 1.03 [0.75, 1.41] |
| 27.1 Singleton pregnancy | 1 | 142 | Risk Ratio (M‐H, Fixed, 95% CI) | 1.03 [0.75, 1.41] |
| 27.2 Multiple pregnancy | 0 | 0 | Risk Ratio (M‐H, Fixed, 95% CI) | 0.0 [0.0, 0.0] |
| 27.3 Singleton plus multiple pregnancies or not stated | 0 | 0 | Risk Ratio (M‐H, Fixed, 95% CI) | 0.0 [0.0, 0.0] |
| 28 Fetal distress in labour (not prespecified) Show forest plot | 1 | 289 | Risk Ratio (M‐H, Fixed, 95% CI) | 0.35 [0.10, 1.22] |
| 28.1 Singleton pregnancy | 1 | 289 | Risk Ratio (M‐H, Fixed, 95% CI) | 0.35 [0.10, 1.22] |
| 28.2 Multiple pregnancy | 0 | 0 | Risk Ratio (M‐H, Fixed, 95% CI) | 0.0 [0.0, 0.0] |
| 28.3 Singleton plus multiple pregnancies or not stated | 0 | 0 | Risk Ratio (M‐H, Fixed, 95% CI) | 0.0 [0.0, 0.0] |
| 29 Birthweight < 5 percentile (not prespecified) Show forest plot | 1 | 289 | Risk Ratio (M‐H, Fixed, 95% CI) | 1.16 [0.51, 2.64] |
| 29.1 Singleton pregnancy | 1 | 289 | Risk Ratio (M‐H, Fixed, 95% CI) | 1.16 [0.51, 2.64] |
| 29.2 Multiple pregnancy | 0 | 0 | Risk Ratio (M‐H, Fixed, 95% CI) | 0.0 [0.0, 0.0] |
| 29.3 Singleton plus multiple pregnancies or not stated | 0 | 0 | Risk Ratio (M‐H, Fixed, 95% CI) | 0.0 [0.0, 0.0] |
| 30 Periventricular leucomalacia (not prespecified) Show forest plot | 1 | 545 | Risk Ratio (M‐H, Fixed, 95% CI) | 0.33 [0.01, 8.00] |
| 30.1 Singleton pregnancy | 0 | 0 | Risk Ratio (M‐H, Fixed, 95% CI) | 0.0 [0.0, 0.0] |
| 30.2 Multiple pregnancy | 0 | 0 | Risk Ratio (M‐H, Fixed, 95% CI) | 0.0 [0.0, 0.0] |
| 30.3 Singleton plus multiple pregnancies or not stated | 1 | 545 | Risk Ratio (M‐H, Fixed, 95% CI) | 0.33 [0.01, 8.00] |
| 31 Antenatal hospital stay (days) (not prespecified) Show forest plot | 1 | 426 | Mean Difference (IV, Fixed, 95% CI) | ‐0.60 [‐2.39, 1.19] |
| 31.1 Singleton pregnancy | 1 | 426 | Mean Difference (IV, Fixed, 95% CI) | ‐0.60 [‐2.39, 1.19] |
| 31.2 Multiple pregnancy | 0 | 0 | Mean Difference (IV, Fixed, 95% CI) | 0.0 [0.0, 0.0] |
| 31.3 Singleton plus multiple pregnancies or not stated | 0 | 0 | Mean Difference (IV, Fixed, 95% CI) | 0.0 [0.0, 0.0] |
| Outcome or subgroup title | No. of studies | No. of participants | Statistical method | Effect size |
| 1 Any perinatal death after randomisation Show forest plot | 6 | Risk Ratio (M‐H, Fixed, 95% CI) | Subtotals only | |
| 1.1 SGA/IUGR | 5 | 1292 | Risk Ratio (M‐H, Fixed, 95% CI) | 0.72 [0.38, 1.35] |
| 1.2 Hypertension/pre‐eclampsia | 1 | 89 | Risk Ratio (M‐H, Fixed, 95% CI) | 3.57 [0.42, 30.73] |
| 1.3 Diabetes | 0 | 0 | Risk Ratio (M‐H, Fixed, 95% CI) | 0.0 [0.0, 0.0] |
| 1.4 Prolonged pregnancy | 0 | 0 | Risk Ratio (M‐H, Fixed, 95% CI) | 0.0 [0.0, 0.0] |
| 1.5 Previous pregnancy loss | 1 | 53 | Risk Ratio (M‐H, Fixed, 95% CI) | 0.26 [0.03, 2.17] |
| 2 Serious neonatal morbidity Show forest plot | 1 | 53 | Risk Ratio (M‐H, Random, 95% CI) | 0.0 [0.0, 0.0] |
| 2.1 SGA/IUGR | 0 | 0 | Risk Ratio (M‐H, Random, 95% CI) | 0.0 [0.0, 0.0] |
| 2.2 Hypertension/pre‐eclampsia | 0 | 0 | Risk Ratio (M‐H, Random, 95% CI) | 0.0 [0.0, 0.0] |
| 2.3 Diabetes | 0 | 0 | Risk Ratio (M‐H, Random, 95% CI) | 0.0 [0.0, 0.0] |
| 2.4 Prolonged pregnancy | 0 | 0 | Risk Ratio (M‐H, Random, 95% CI) | 0.0 [0.0, 0.0] |
| 2.5 Previous pregnancy loss | 1 | 53 | Risk Ratio (M‐H, Random, 95% CI) | 0.0 [0.0, 0.0] |
| Outcome or subgroup title | No. of studies | No. of participants | Statistical method | Effect size |
| 1 Any perinatal death after randomisation Show forest plot | 4 | 2813 | Risk Ratio (M‐H, Fixed, 95% CI) | 0.45 [0.17, 1.15] |
| 1.1 Singleton pregnancy | 3 | 1916 | Risk Ratio (M‐H, Fixed, 95% CI) | 0.34 [0.07, 1.68] |
| 1.2 Multiple pregnancy | 0 | 0 | Risk Ratio (M‐H, Fixed, 95% CI) | 0.0 [0.0, 0.0] |
| 1.3 Singleton plus multiple pregnancies or not stated | 1 | 897 | Risk Ratio (M‐H, Fixed, 95% CI) | 0.52 [0.16, 1.73] |
| 2 Stillbirth Show forest plot | 4 | 2813 | Risk Ratio (M‐H, Fixed, 95% CI) | 0.48 [0.14, 1.71] |
| 2.1 Singleton pregnancy | 3 | 1916 | Risk Ratio (M‐H, Fixed, 95% CI) | 0.28 [0.05, 1.70] |
| 2.2 Multiple pregnancy | 0 | 0 | Risk Ratio (M‐H, Fixed, 95% CI) | 0.0 [0.0, 0.0] |
| 2.3 Singleton plus multiple pregnancies or not stated | 1 | 897 | Risk Ratio (M‐H, Fixed, 95% CI) | 1.05 [0.15, 7.41] |
| 3 Neonatal death Show forest plot | 3 | 1473 | Risk Ratio (M‐H, Fixed, 95% CI) | 0.52 [0.16, 1.72] |
| 3.1 Singleton pregnancy | 2 | 576 | Risk Ratio (M‐H, Fixed, 95% CI) | 1.02 [0.15, 7.10] |
| 3.2 Multiple pregnancy | 0 | 0 | Risk Ratio (M‐H, Fixed, 95% CI) | 0.0 [0.0, 0.0] |
| 3.3 Singleton plus multiple pregnancies or not stated | 1 | 897 | Risk Ratio (M‐H, Fixed, 95% CI) | 0.35 [0.07, 1.72] |
| 4 Any potentially preventable perinatal death* Show forest plot | 4 | 2813 | Risk Ratio (M‐H, Fixed, 95% CI) | 0.38 [0.12, 1.18] |
| 4.1 Singleton pregnancy | 3 | 1916 | Risk Ratio (M‐H, Fixed, 95% CI) | 0.41 [0.08, 2.11] |
| 4.2 Multiple pregnancy | 0 | 0 | Risk Ratio (M‐H, Fixed, 95% CI) | 0.0 [0.0, 0.0] |
| 4.3 Singleton plus multiple pregnancies or not stated | 1 | 897 | Risk Ratio (M‐H, Fixed, 95% CI) | 0.35 [0.07, 1.72] |
| 5 Apgar < 7 at 5 minutes Show forest plot | 3 | 2663 | Risk Ratio (M‐H, Fixed, 95% CI) | 0.86 [0.54, 1.37] |
| 5.1 Singleton pregnancy | 2 | 1766 | Risk Ratio (M‐H, Fixed, 95% CI) | 0.83 [0.49, 1.43] |
| 5.2 Multiple pregnancy | 0 | 0 | Risk Ratio (M‐H, Fixed, 95% CI) | 0.0 [0.0, 0.0] |
| 5.3 Singleton plus multiple pregnancies or not stated | 1 | 897 | Risk Ratio (M‐H, Fixed, 95% CI) | 0.93 [0.36, 2.39] |
| 6 Caesarean section (elective and emergency) Show forest plot | 4 | 2813 | Risk Ratio (M‐H, Fixed, 95% CI) | 0.89 [0.79, 1.01] |
| 6.1 Singleton pregnancy | 3 | 1916 | Risk Ratio (M‐H, Fixed, 95% CI) | 0.89 [0.77, 1.02] |
| 6.2 Multiple pregnancy | 0 | 0 | Risk Ratio (M‐H, Fixed, 95% CI) | 0.0 [0.0, 0.0] |
| 6.3 Singleton plus multiple pregnancies or not stated | 1 | 897 | Risk Ratio (M‐H, Fixed, 95% CI) | 0.91 [0.73, 1.14] |
| 7 Caesarean section ‐ elective Show forest plot | 3 | 1473 | Risk Ratio (M‐H, Fixed, 95% CI) | 1.53 [1.12, 2.09] |
| 7.1 Singleton pregnancy | 2 | 576 | Risk Ratio (M‐H, Fixed, 95% CI) | 1.69 [1.07, 2.67] |
| 7.2 Multiple pregnancy | 0 | 0 | Risk Ratio (M‐H, Fixed, 95% CI) | 0.0 [0.0, 0.0] |
| 7.3 Singleton plus multiple pregnancies or not stated | 1 | 897 | Risk Ratio (M‐H, Fixed, 95% CI) | 1.40 [0.91, 2.15] |
| 8 Caesarean section ‐ emergency Show forest plot | 3 | 1473 | Risk Ratio (M‐H, Fixed, 95% CI) | 0.66 [0.52, 0.84] |
| 8.1 Singleton pregnancy | 2 | 576 | Risk Ratio (M‐H, Fixed, 95% CI) | 0.55 [0.36, 0.83] |
| 8.2 Multiple pregnancy | 0 | 0 | Risk Ratio (M‐H, Fixed, 95% CI) | 0.0 [0.0, 0.0] |
| 8.3 Singleton plus multiple pregnancies or not stated | 1 | 897 | Risk Ratio (M‐H, Fixed, 95% CI) | 0.73 [0.55, 0.98] |
| 9 Spontaneous vaginal birth Show forest plot | 2 | 1323 | Risk Ratio (M‐H, Fixed, 95% CI) | 1.06 [0.97, 1.15] |
| 9.1 Singleton pregnancy | 1 | 426 | Risk Ratio (M‐H, Fixed, 95% CI) | 1.04 [0.91, 1.19] |
| 9.2 Multiple pregnancy | 0 | 0 | Risk Ratio (M‐H, Fixed, 95% CI) | 0.0 [0.0, 0.0] |
| 9.3 Singleton plus multiple pregnancies or not stated | 1 | 897 | Risk Ratio (M‐H, Fixed, 95% CI) | 1.06 [0.95, 1.19] |
| 10 Operative vaginal birth Show forest plot | 3 | 2663 | Risk Ratio (M‐H, Fixed, 95% CI) | 0.98 [0.81, 1.17] |
| 10.1 Singleton pregnancy | 2 | 1766 | Risk Ratio (M‐H, Fixed, 95% CI) | 1.01 [0.80, 1.27] |
| 10.2 Multiple pregnancy | 0 | 0 | Risk Ratio (M‐H, Fixed, 95% CI) | 0.0 [0.0, 0.0] |
| 10.3 Singleton plus multiple pregnancies or not stated | 1 | 897 | Risk Ratio (M‐H, Fixed, 95% CI) | 0.92 [0.68, 1.25] |
| 11 Induction of labour Show forest plot | 2 | 576 | Risk Ratio (M‐H, Random, 95% CI) | 0.67 [0.32, 1.40] |
| 11.1 Singleton pregnancy | 2 | 576 | Risk Ratio (M‐H, Random, 95% CI) | 0.67 [0.32, 1.40] |
| 11.2 Multiple pregnancy | 0 | 0 | Risk Ratio (M‐H, Random, 95% CI) | 0.0 [0.0, 0.0] |
| 11.3 Singleton plus multiple pregnancies or not stated | 0 | 0 | Risk Ratio (M‐H, Random, 95% CI) | 0.0 [0.0, 0.0] |
| 12 Infant requiring intubation/ventilation Show forest plot | 2 | 576 | Risk Ratio (M‐H, Fixed, 95% CI) | 1.54 [0.26, 9.08] |
| 12.1 Singleton pregnancy | 2 | 576 | Risk Ratio (M‐H, Fixed, 95% CI) | 1.54 [0.26, 9.08] |
| 12.2 Multiple pregnancy | 0 | 0 | Risk Ratio (M‐H, Fixed, 95% CI) | 0.0 [0.0, 0.0] |
| 12.3 Singleton plus multiple pregnancies or not stated | 0 | 0 | Risk Ratio (M‐H, Fixed, 95% CI) | 0.0 [0.0, 0.0] |
| 13 Neonatal fitting/seizures Show forest plot | 1 | 150 | Risk Ratio (M‐H, Fixed, 95% CI) | 0.35 [0.01, 8.49] |
| 13.1 Singleton pregnancy | 1 | 150 | Risk Ratio (M‐H, Fixed, 95% CI) | 0.35 [0.01, 8.49] |
| 13.2 Multiple pregnancy | 0 | 0 | Risk Ratio (M‐H, Fixed, 95% CI) | 0.0 [0.0, 0.0] |
| 13.3 Singleton plus multiple pregnancies or not stated | 0 | 0 | Risk Ratio (M‐H, Fixed, 95% CI) | 0.0 [0.0, 0.0] |
| 14 Gestational age at birth Show forest plot | 3 | 1473 | Mean Difference (IV, Fixed, 95% CI) | 0.23 [‐0.00, 0.47] |
| 14.1 Singleton pregnancy | 2 | 576 | Mean Difference (IV, Fixed, 95% CI) | 0.26 [‐0.06, 0.59] |
| 14.2 Multiple pregnancy | 0 | 0 | Mean Difference (IV, Fixed, 95% CI) | 0.0 [0.0, 0.0] |
| 14.3 Singleton plus multiple pregnancies or not stated | 1 | 897 | Mean Difference (IV, Fixed, 95% CI) | 0.20 [‐0.15, 0.55] |
| 15 Neonatal admission to SCBU and/or NICU Show forest plot | 4 | 2813 | Risk Ratio (M‐H, Fixed, 95% CI) | 0.87 [0.73, 1.03] |
| 15.1 Singleton pregnancy | 3 | 1916 | Risk Ratio (M‐H, Fixed, 95% CI) | 0.80 [0.64, 0.99] |
| 15.2 Multiple pregnancy | 0 | 0 | Risk Ratio (M‐H, Fixed, 95% CI) | 0.0 [0.0, 0.0] |
| 15.3 Singleton plus multiple pregnancies or not stated | 1 | 897 | Risk Ratio (M‐H, Fixed, 95% CI) | 1.00 [0.73, 1.37] |
| 16 Infant birthweight (grams) Show forest plot | 4 | 2813 | Mean Difference (IV, Fixed, 95% CI) | 38.41 [‐6.14, 82.97] |
| 16.1 Singleton pregnancy | 3 | 1916 | Mean Difference (IV, Fixed, 95% CI) | 49.34 [‐0.62, 99.31] |
| 16.2 Multiple pregnancy | 0 | 0 | Mean Difference (IV, Fixed, 95% CI) | 0.0 [0.0, 0.0] |
| 16.3 Singleton plus multiple pregnancies or not stated | 1 | 897 | Mean Difference (IV, Fixed, 95% CI) | ‐4.0 [‐102.42, 94.42] |
| 17 Length of infant hospital stay (days) Show forest plot | 2 | 576 | Std. Mean Difference (IV, Fixed, 95% CI) | ‐0.25 [‐0.41, ‐0.08] |
| 17.1 Singleton pregnancy | 2 | 576 | Std. Mean Difference (IV, Fixed, 95% CI) | ‐0.25 [‐0.41, ‐0.08] |
| 17.2 Multiple pregnancy | 0 | 0 | Std. Mean Difference (IV, Fixed, 95% CI) | 0.0 [0.0, 0.0] |
| 17.3 Singleton plus multiple pregnancies or not stated | 0 | 0 | Std. Mean Difference (IV, Fixed, 95% CI) | 0.0 [0.0, 0.0] |
| 18 Antenatal admissions (not prespecified) Show forest plot | 1 | 426 | Risk Ratio (M‐H, Fixed, 95% CI) | 0.70 [0.55, 0.90] |
| 18.1 Singleton pregnancy | 1 | 426 | Risk Ratio (M‐H, Fixed, 95% CI) | 0.70 [0.55, 0.90] |
| 18.2 Multiple pregnancy | 0 | 0 | Risk Ratio (M‐H, Fixed, 95% CI) | 0.0 [0.0, 0.0] |
| 18.3 Singleton plus multiple pregnancies or not stated | 0 | 0 | Risk Ratio (M‐H, Fixed, 95% CI) | 0.0 [0.0, 0.0] |
| 19 Phototherapy for neonatal jaundice (not prespecified) Show forest plot | 1 | 150 | Risk Ratio (M‐H, Fixed, 95% CI) | 0.15 [0.01, 2.87] |
| 19.1 Singleton pregnancy | 1 | 150 | Risk Ratio (M‐H, Fixed, 95% CI) | 0.15 [0.01, 2.87] |
| 19.2 Multiple pregnancy | 0 | 0 | Risk Ratio (M‐H, Fixed, 95% CI) | 0.0 [0.0, 0.0] |
| 19.3 Singleton plus multiple pregnancies or not stated | 0 | 0 | Risk Ratio (M‐H, Fixed, 95% CI) | 0.0 [0.0, 0.0] |
| 20 Antenatal hospital stay (days) (not prespecified) Show forest plot | 1 | 426 | Mean Difference (IV, Fixed, 95% CI) | ‐0.60 [‐2.39, 1.19] |
| 20.1 Singleton pregnancy | 1 | 426 | Mean Difference (IV, Fixed, 95% CI) | ‐0.60 [‐2.39, 1.19] |
| 20.2 Multiple pregnancy | 0 | 0 | Mean Difference (IV, Fixed, 95% CI) | 0.0 [0.0, 0.0] |
| 20.3 Singleton plus multiple pregnancies or not stated | 0 | 0 | Mean Difference (IV, Fixed, 95% CI) | 0.0 [0.0, 0.0] |
| Outcome or subgroup title | No. of studies | No. of participants | Statistical method | Effect size |
| 1 Any perinatal death after randomisation Show forest plot | 3 | Risk Ratio (M‐H, Fixed, 95% CI) | Subtotals only | |
| 1.1 SGA/IUGR | 2 | 572 | Risk Ratio (M‐H, Fixed, 95% CI) | 0.33 [0.05, 2.09] |
| 1.2 Hypertension/pre‐eclampsia | 1 | 89 | Risk Ratio (M‐H, Fixed, 95% CI) | 3.57 [0.42, 30.73] |
| 1.3 Diabetes | 0 | 0 | Risk Ratio (M‐H, Fixed, 95% CI) | 0.0 [0.0, 0.0] |
| 1.4 Prolonged pregnancy | 0 | 0 | Risk Ratio (M‐H, Fixed, 95% CI) | 0.0 [0.0, 0.0] |
| 1.5 Previous pregnancy loss | 0 | 0 | Risk Ratio (M‐H, Fixed, 95% CI) | 0.0 [0.0, 0.0] |
| Outcome or subgroup title | No. of studies | No. of participants | Statistical method | Effect size |
| 1 Any perinatal death after randomisation Show forest plot | 1 | 333 | Risk Ratio (M‐H, Fixed, 95% CI) | 0.84 [0.39, 1.82] |
| 1.1 Singleton pregnancy | 1 | 333 | Risk Ratio (M‐H, Fixed, 95% CI) | 0.84 [0.39, 1.82] |
| 2 Survival following severe neonatal morbidity Show forest plot | 1 | 333 | Risk Ratio (M‐H, Fixed, 95% CI) | 1.10 [0.75, 1.61] |
| 3 Stillbirth Show forest plot | 1 | 333 | Risk Ratio (M‐H, Fixed, 95% CI) | 1.99 [0.37, 10.71] |
| 3.1 Singleton pregnancy | 1 | 333 | Risk Ratio (M‐H, Fixed, 95% CI) | 1.99 [0.37, 10.71] |
| 4 Neonatal death Show forest plot | 1 | 333 | Risk Ratio (M‐H, Fixed, 95% CI) | 0.60 [0.22, 1.60] |
| 4.1 Singleton pregnancy | 1 | 333 | Risk Ratio (M‐H, Fixed, 95% CI) | 0.60 [0.22, 1.60] |
| 5 Any potentially preventable perinatal death* Show forest plot | 1 | 333 | Risk Ratio (M‐H, Fixed, 95% CI) | 0.83 [0.37, 1.86] |
| 5.1 Singleton pregnancy | 1 | 333 | Risk Ratio (M‐H, Fixed, 95% CI) | 0.83 [0.37, 1.86] |
| 6 Fetal acidosis Show forest plot | 1 | 333 | Risk Ratio (M‐H, Fixed, 95% CI) | 0.25 [0.03, 2.20] |
| 6.1 Singleton pregnancy | 1 | 333 | Risk Ratio (M‐H, Fixed, 95% CI) | 0.25 [0.03, 2.20] |
| 7 Apgar < 7 at 5 minutes Show forest plot | 1 | 333 | Risk Ratio (M‐H, Fixed, 95% CI) | 0.87 [0.44, 1.72] |
| 7.1 Singleton pregnancy | 1 | 333 | Risk Ratio (M‐H, Fixed, 95% CI) | 0.87 [0.44, 1.72] |
| 8 Infant requiring intubation/ventilation Show forest plot | 1 | 333 | Risk Ratio (M‐H, Random, 95% CI) | 0.87 [0.67, 1.13] |
| 8.1 Singleton pregnancy | 1 | 333 | Risk Ratio (M‐H, Random, 95% CI) | 0.87 [0.67, 1.13] |
| 9 Intraventricular haemorrhage Show forest plot | 1 | 333 | Risk Ratio (M‐H, Fixed, 95% CI) | 8.95 [0.49, 164.87] |
| 9.1 Singleton pregnancy | 1 | 333 | Risk Ratio (M‐H, Fixed, 95% CI) | 8.95 [0.49, 164.87] |
| 10 Bronchopulmonary dysplasia Show forest plot | 1 | 333 | Risk Ratio (M‐H, Fixed, 95% CI) | 0.87 [0.55, 1.38] |
| 10.1 Singleton pregnancy | 1 | 333 | Risk Ratio (M‐H, Fixed, 95% CI) | 0.87 [0.55, 1.38] |
| 11 Necrotising enterocolitis Show forest plot | 1 | 333 | Risk Ratio (M‐H, Fixed, 95% CI) | 0.33 [0.03, 3.15] |
| 11.1 Singleton pregnancy | 1 | 333 | Risk Ratio (M‐H, Fixed, 95% CI) | 0.33 [0.03, 3.15] |
| 12 Infant birthweight (grams) Show forest plot | 1 | 333 | Mean Difference (IV, Fixed, 95% CI) | 38.0 [‐31.53, 107.53] |
| 12.1 Singleton pregnancy | 1 | 333 | Mean Difference (IV, Fixed, 95% CI) | 38.0 [‐31.53, 107.53] |
| 13 Long‐term infant neurodevelopmental outcome (impairment at 2 years) Show forest plot | 1 | 333 | Risk Ratio (M‐H, Fixed, 95% CI) | 0.60 [0.30, 1.18] |
| 13.1 Singleton pregnancy | 1 | 333 | Risk Ratio (M‐H, Fixed, 95% CI) | 0.60 [0.30, 1.18] |
| 14 Long‐term infant neurodevelopmental outcome (cerebral palsy at 2 years) Show forest plot | 1 | 333 | Risk Ratio (M‐H, Fixed, 95% CI) | 0.20 [0.02, 1.68] |
| 14.1 Singleton pregnancy | 1 | 333 | Risk Ratio (M‐H, Fixed, 95% CI) | 0.20 [0.02, 1.68] |
| 15 Infant survival at 2 years without neurodevelopmental impairment (not prespecified) Show forest plot | 1 | 333 | Risk Ratio (M‐H, Fixed, 95% CI) | 1.07 [0.92, 1.23] |
| 15.1 Singleton pregnancy | 1 | 333 | Risk Ratio (M‐H, Fixed, 95% CI) | 1.07 [0.92, 1.23] |
| 16 Sepsis (proven) (not prespecified) Show forest plot | 1 | 333 | Risk Ratio (M‐H, Fixed, 95% CI) | 0.93 [0.60, 1.45] |
| 16.1 Singleton pregnancy | 1 | 333 | Risk Ratio (M‐H, Fixed, 95% CI) | 0.93 [0.60, 1.45] |
| Outcome or subgroup title | No. of studies | No. of participants | Statistical method | Effect size |
| 1 Any perinatal death after randomisation Show forest plot | 1 | 336 | Risk Ratio (M‐H, Fixed, 95% CI) | 1.28 [0.64, 2.55] |
| 1.1 Singleton pregnancy | 1 | 336 | Risk Ratio (M‐H, Fixed, 95% CI) | 1.28 [0.64, 2.55] |
| 2 Survival following severe neonatal morbidity Show forest plot | 1 | 336 | Risk Ratio (M‐H, Fixed, 95% CI) | 0.98 [0.66, 1.45] |
| 3 Stillbirth Show forest plot | 1 | 336 | Risk Ratio (M‐H, Fixed, 95% CI) | 2.93 [0.60, 14.31] |
| 3.1 Singleton pregnancy | 1 | 336 | Risk Ratio (M‐H, Fixed, 95% CI) | 2.93 [0.60, 14.31] |
| 4 Neonatal death Show forest plot | 1 | 336 | Risk Ratio (M‐H, Fixed, 95% CI) | 1.07 [0.47, 2.46] |
| 4.1 Singleton pregnancy | 1 | 336 | Risk Ratio (M‐H, Fixed, 95% CI) | 1.07 [0.47, 2.46] |
| 5 Any potentially preventable perinatal death* Show forest plot | 1 | 336 | Risk Ratio (M‐H, Fixed, 95% CI) | 1.22 [0.59, 2.53] |
| 5.1 Singleton pregnancy | 1 | 336 | Risk Ratio (M‐H, Fixed, 95% CI) | 1.22 [0.59, 2.53] |
| 6 Fetal acidosis Show forest plot | 1 | 336 | Risk Ratio (M‐H, Fixed, 95% CI) | 0.11 [0.01, 2.00] |
| 6.1 Singleton pregnancy | 1 | 336 | Risk Ratio (M‐H, Fixed, 95% CI) | 0.11 [0.01, 2.00] |
| 7 Apgar < 7 at 5 minutes Show forest plot | 1 | 336 | Risk Ratio (M‐H, Fixed, 95% CI) | 1.28 [0.69, 2.37] |
| 7.1 Singleton pregnancy | 1 | 336 | Risk Ratio (M‐H, Fixed, 95% CI) | 1.28 [0.69, 2.37] |
| 8 Infant requiring intubation/ventilation Show forest plot | 1 | 336 | Risk Ratio (M‐H, Random, 95% CI) | 0.94 [0.73, 1.20] |
| 8.1 Singleton pregnancy | 1 | 336 | Risk Ratio (M‐H, Random, 95% CI) | 0.94 [0.73, 1.20] |
| 9 Intraventricular haemorrhage Show forest plot | 1 | 336 | Risk Ratio (M‐H, Fixed, 95% CI) | 16.60 [0.97, 285.35] |
| 9.1 Singleton pregnancy | 1 | 336 | Risk Ratio (M‐H, Fixed, 95% CI) | 16.60 [0.97, 285.35] |
| 10 Bronchopulmonary dysplasia Show forest plot | 1 | 336 | Risk Ratio (M‐H, Fixed, 95% CI) | 0.95 [0.61, 1.48] |
| 10.1 Singleton pregnancy | 1 | 336 | Risk Ratio (M‐H, Fixed, 95% CI) | 0.95 [0.61, 1.48] |
| 11 Necrotising enterocolitis Show forest plot | 1 | 336 | Risk Ratio (M‐H, Fixed, 95% CI) | 0.98 [0.20, 4.77] |
| 11.1 Singleton pregnancy | 1 | 336 | Risk Ratio (M‐H, Fixed, 95% CI) | 0.98 [0.20, 4.77] |
| 12 Infant birthweight (grams) Show forest plot | 1 | 336 | Mean Difference (IV, Fixed, 95% CI) | 25.0 [‐40.06, 90.06] |
| 12.1 Singleton pregnancy | 1 | 336 | Mean Difference (IV, Fixed, 95% CI) | 25.0 [‐40.06, 90.06] |
| 13 Long‐term infant neurodevelopmental outcome (impairment at 2 years) Show forest plot | 1 | 336 | Risk Ratio (M‐H, Fixed, 95% CI) | 0.34 [0.15, 0.79] |
| 13.1 Singleton pregnancy | 1 | 336 | Risk Ratio (M‐H, Fixed, 95% CI) | 0.34 [0.15, 0.79] |
| 14 Long‐term infant neurodevelopmental outcome (cerebral palsy at 2 years) Show forest plot | 1 | 336 | Risk Ratio (M‐H, Fixed, 95% CI) | 0.09 [0.00, 1.59] |
| 14.1 Singleton pregnancy | 1 | 336 | Risk Ratio (M‐H, Fixed, 95% CI) | 0.09 [0.00, 1.59] |
| 15 Infant survival at 2 years without neurodevelopmental impairment (not prespecified) Show forest plot | 1 | 336 | Risk Ratio (M‐H, Fixed, 95% CI) | 1.17 [1.02, 1.34] |
| 15.1 Singleton pregnancy | 1 | 336 | Risk Ratio (M‐H, Fixed, 95% CI) | 1.17 [1.02, 1.34] |
| 16 Sepsis (proven) (not prespecified) Show forest plot | 1 | 336 | Risk Ratio (M‐H, Fixed, 95% CI) | 0.68 [0.42, 1.11] |
| 16.1 Singleton pregnancy | 1 | 336 | Risk Ratio (M‐H, Fixed, 95% CI) | 0.68 [0.42, 1.11] |
| Outcome or subgroup title | No. of studies | No. of participants | Statistical method | Effect size |
| 1 Any perinatal death after randomisation Show forest plot | 1 | 337 | Risk Ratio (M‐H, Fixed, 95% CI) | 0.66 [0.32, 1.36] |
| 1.1 Singleton pregnancy | 1 | 337 | Risk Ratio (M‐H, Fixed, 95% CI) | 0.66 [0.32, 1.36] |
| 2 Survival following severe neonatal morbidity Show forest plot | 1 | 337 | Risk Ratio (M‐H, Fixed, 95% CI) | 1.13 [0.77, 1.65] |
| 3 Stillbirth Show forest plot | 1 | 337 | Risk Ratio (M‐H, Fixed, 95% CI) | 0.68 [0.20, 2.36] |
| 3.1 Singleton pregnancy | 1 | 337 | Risk Ratio (M‐H, Fixed, 95% CI) | 0.68 [0.20, 2.36] |
| 4 Neonatal death Show forest plot | 1 | 337 | Risk Ratio (M‐H, Fixed, 95% CI) | 0.56 [0.21, 1.47] |
| 4.1 Singleton pregnancy | 1 | 337 | Risk Ratio (M‐H, Fixed, 95% CI) | 0.56 [0.21, 1.47] |
| 5 Any potentially preventable perinatal death* Show forest plot | 1 | 337 | Risk Ratio (M‐H, Fixed, 95% CI) | 0.68 [0.31, 1.47] |
| 5.1 Singleton pregnancy | 1 | 337 | Risk Ratio (M‐H, Fixed, 95% CI) | 0.68 [0.31, 1.47] |
| 6 Fetal acidosis Show forest plot | 1 | 337 | Risk Ratio (M‐H, Fixed, 95% CI) | 3.05 [0.13, 74.43] |
| 6.1 Singleton pregnancy | 1 | 337 | Risk Ratio (M‐H, Fixed, 95% CI) | 3.05 [0.13, 74.43] |
| 7 Apgar < 7 at 5 minutes Show forest plot | 1 | 337 | Risk Ratio (M‐H, Fixed, 95% CI) | 0.68 [0.36, 1.29] |
| 7.1 Singleton pregnancy | 1 | 337 | Risk Ratio (M‐H, Fixed, 95% CI) | 0.68 [0.36, 1.29] |
| 8 Infant requiring intubation/ventilation Show forest plot | 1 | 337 | Risk Ratio (M‐H, Random, 95% CI) | 0.93 [0.71, 1.21] |
| 8.1 Singleton pregnancy | 1 | 337 | Risk Ratio (M‐H, Random, 95% CI) | 0.93 [0.71, 1.21] |
| 9 Intraventricular haemorrhage Show forest plot | 1 | 337 | Risk Ratio (M‐H, Fixed, 95% CI) | 0.51 [0.16, 1.66] |
| 9.1 Singleton pregnancy | 1 | 337 | Risk Ratio (M‐H, Fixed, 95% CI) | 0.51 [0.16, 1.66] |
| 10 Bronchopulmonary dysplasia Show forest plot | 1 | 337 | Risk Ratio (M‐H, Fixed, 95% CI) | 0.92 [0.58, 1.46] |
| 10.1 Singleton pregnancy | 1 | 337 | Risk Ratio (M‐H, Fixed, 95% CI) | 0.92 [0.58, 1.46] |
| 11 Necrotising enterocolitis Show forest plot | 1 | 337 | Risk Ratio (M‐H, Fixed, 95% CI) | 0.34 [0.04, 3.23] |
| 11.1 Singleton pregnancy | 1 | 337 | Risk Ratio (M‐H, Fixed, 95% CI) | 0.34 [0.04, 3.23] |
| 12 Infant birthweight (grams) Show forest plot | 1 | 337 | Mean Difference (IV, Fixed, 95% CI) | 13.0 [‐59.31, 85.31] |
| 12.1 Singleton pregnancy | 1 | 337 | Mean Difference (IV, Fixed, 95% CI) | 13.0 [‐59.31, 85.31] |
| 13 Long‐term infant neurodevelopmental outcome (impairment at 2 years) Show forest plot | 1 | 337 | Risk Ratio (M‐H, Fixed, 95% CI) | 1.75 [0.70, 4.32] |
| 13.1 Singleton pregnancy | 1 | 337 | Risk Ratio (M‐H, Fixed, 95% CI) | 1.75 [0.70, 4.32] |
| 14 Long‐term infant neurodevelopmental outcome (cerebral palsy at 2 years) Show forest plot | 1 | 337 | Risk Ratio (M‐H, Fixed, 95% CI) | 3.05 [0.13, 74.43] |
| 14.1 Singleton pregnancy | 1 | 337 | Risk Ratio (M‐H, Fixed, 95% CI) | 3.05 [0.13, 74.43] |
| 15 Infant survival at 2 years without neurodevelopmental impairment (not prespecified) Show forest plot | 1 | 337 | Risk Ratio (M‐H, Fixed, 95% CI) | 0.91 [0.80, 1.03] |
| 15.1 Singleton pregnancy | 1 | 337 | Risk Ratio (M‐H, Fixed, 95% CI) | 0.91 [0.80, 1.03] |
| 16 Sepsis (proven) (not prespecified) Show forest plot | 1 | 337 | Risk Ratio (M‐H, Fixed, 95% CI) | 1.37 [0.84, 2.25] |
| 16.1 Singleton pregnancy | 1 | 337 | Risk Ratio (M‐H, Fixed, 95% CI) | 1.37 [0.84, 2.25] |