改善脑卒中后活动能力的循环训练法
摘要
研究背景
循环训练法(Circuit class therapy, CCT)为脑卒中患者提供一个监督小组论坛来练习任务,从而在不增加人员配备的情况下增加练习时间。这是对2010年发表综述的更新。
研究目的
确定循环训练法对成年脑卒中患者活动能力的有效性和安全性。
检索策略
我们检索了Cochrane中风组试验注册库( Cochrane Stroke Group Trials Register)(检索截至2017年1月)、CENTRAL(Cochrane Library,第12期,2016年),MEDLINE(1950年至2017年1月),Embase(1980年到2017年1月),CINAHL(1982至2017年1月),以及14个其他电子数据库(至2017年1月)。我们还检索了相关会议记录、参考文献列表和尚未发表论文;联系已发表的试验的作者和该领域的其他专家;并检索了相关的临床试验和研究注册库。
纳入排除标准
随机对照试验,纳入18岁以上、任何严重程度、任何阶段或任何环境的脑卒中患者,接受循环训练法。
资料收集与分析
两位作者独立地筛选了可纳入的试验,评估偏倚风险和提取资料。
主要结果
我们纳入了17项随机对照试验,涉及1297名受试者。受试者是生活在社区或接受住院康复的脑卒中幸存者。大多数人可以在没有帮助的情况下步行10米。十项研究(835名受试者)测量了行走能力(测量受试者在6分钟内可以行走的距离),证明循环训练法优于对照干预(6分钟步行测试:平均差(MD),固定效应,60.86米,95%CI[44.55, 77.17],GRADE:中等)。八项研究(744名受试者)测量了步态速度,再次发现循环训练优于其他干预措施,(MD=0.15 m/s,95%CI[0.10, 0.19],GRADE:中等)。这两种作用都被认为具有临床意义。我们能够合并其他测量,以证明循环训练法在行走和平衡方面的优越效果(起立‐行走试验:五项研究,488名受试者,MD=‐3.62秒,95%CI[‐6.09, ‐1.16];活动平衡自信量表:两项研究,103名受试者,MD=7.76,95%CI[0.66, 14.87]。另外两个合并的平衡测量未能显示出优越的效果(伯格平衡量表和台阶试验)。独立活动能力,根据Stroke Impact Scale, Functional Ambulation Classification and the Rivermead Mobility Index测量结果,在循环训练干预中也比其他指标改善更多。循环训练对住院时间没有显著影响(两项试验,217名受试者,MD=‐16.35,95%CI[‐37.69, 4.99]。八项试验(815名受试者)测量了不良事件(治疗期间跌倒):没有显著影响循环训练组跌倒风险的增加(RD=0.03,95%CI [‐0.02, 0.08],GRADE:极低质量证据)。脑卒中后的时间、试验的质量或规模对阳性结局没有影响。异质性普遍较低;研究的偏倚风险不一,在一些试验中,研究行为的报告不佳。
作者结论
有中等质量证据表明,循环训练法能有效改善脑卒中后人们的活动能力——他们也许能够走得更远、更快,并对自己的平衡有更多的独立性和信心。对脑卒中后的影响可能更大,并且具有临床意义。需要进一步的高质量研究,将循环训练法与标准照护进行比较调查生活质量、参与程度和成本效益,并调查脑卒中严重程度和年龄等因素的影响。需要监测循环训练期间摔倒增加的潜在风险。
PICO
简语概要
改善脑卒中后活动能力的循环训练法
系统综述问题
循环训练法是否比传统的物理疗法更好地改善脑卒中后人们的行走能力?
研究背景
脑卒中后,人们可能会有行走障碍。他们可能行走速度会变慢,只能短距离行走,并且可能需要帮助。他们可能更容易失去平衡,更加容易疲劳。这可能意味着他们行走更少,所以行走能力会恶化。康复可以帮助改善行走能力,但很难实现,特别是在脑卒中后。循环训练法包括分组工作(而非单独与治疗师),做有意义的具体实践任务,并可能提供一个更容易实现的解决方案。
研究特征
这是对2010年发表综述的更新。我们考虑了将循环训练法与脑卒中患者常规疗法进行比较的研究,只纳入了具有低偏倚风险的高质量研究。我们关注的是比较这两种方法及其对人们行走方式,走多远,走多快以及独立性影响的研究。我们也检索了调查循环训练法是否比传统方法有更多或更少伤害的研究。目前证据检索到2017年1月。
主要结果
我们发现有17项研究,涉及1297名受试者,将循环训练康复与常规疗法或假康复进行比较。大多数试验都报道了循环训练对提高行走能力的获益。更具体地说,我们综合了研究结果,发现有中等质量证据表明,循环训练与其他类型的治疗相比,在提高人走得更远、更独立、更快行走的能力方面更为有效,在某些情况下,可以更容易地、自信地保持平衡。有一种说法是,人们在参加循环训练时可能会更频繁地摔倒,他们从康复医院回家的速度也可能更快,但这两个方面没有得到统计数据的证实。我们还发现,与一年内发生脑卒中的人相比,至少一年前发生脑卒中的人同样感受到了循环训练法的积极作用。这意味着人们在脑卒中后可以继续改善的时间比之前报道的要长。需要更多的研究,去确定它是否适用于脑卒中不同病情严重度的人,以及某些任务是否比其他任务更适合练习。
证据质量
整体研究的质量是可以接受的,因为在康复研究中很难严格控制某些方面。然而,我们已将证据质量下调至“中等”,以承认某些试验存在潜在的偏倚。
Authors' conclusions
Summary of findings
| Circuit class therapy compared with other intervention for improving mobility | ||||||
| Patient or population: people with stroke Settings: in hospital or community Intervention: mobility‐related circuit class therapy Comparison: any other intervention | ||||||
| Outcomes | Illustrative comparative effects (95% CI) | Relative effect | No of participants | Quality of the evidence | Comments | |
| Assumed effect | Absolute effect | |||||
| Other intervention | Mobility‐related circuit class therapy | |||||
| Walking capacity: 6mWT Continous measure of distance walked in 6 minutes in m | The mean 6mWT distance ranged across control groups from 106 m to 441 m | The mean 6mWT distance in the intervention groups was (44.55 to 77.17) | 835 (10) | ⊕⊕⊕⊝ | Applicable: difference greater than minimal clinically important difference (MDC) = 34.4m Eng 2004, and 95% CI of difference does not cross MDC Test for differences between subgroups 'early' versus 'later' (< 1 year vs > 1 year post stroke) were not significant. Some studies have unclear risk of bias (downgraded) | |
| Walking speed Continuous measure of walking speed measured over a short distance in m/s | The mean gait speed ranged across control groups from 0.43 m/s to 1.3 m/s | The mean gait speed in the intervention groups was 0.15 m/s faster (0.10 to 0.19) | 744 (8) | ⊕⊕⊕⊝ | Applicable: difference greater than MDC = 0.06 m/s Perera 2006, and 95% CI of difference does not cross MDC Some studies have unclear risk of bias (downgraded) | |
| Balance and mobility Timed up and go test. Standing up, walking, returning to sit down in seconds | The mean speed ranged across control groups from 15 s to 28.6 s. | The mean speed in the intervention group was 3.62 s faster (‐6.06 to ‐1.16) | 488 (5) | ⊕⊕⊝⊝ low | Applicable: somewhat as difference is not greater than MDC (8 s or 28%) (downgraded). Some studies have unclear risk of bias (downgraded) | |
| Independence in mobility Functional ambulation classification. Indicates need for assistance/not to safely mobilise | The number of independent participants ranged across the control groups from 2 to 92 | The odds ratio of independent classifications in favour of the intervention group was 1.91 (1.01 to 3.6) | 469 (3) | ⊕⊕⊕⊝ | Applicable: better odds of independence in walking is clinically useful. Some studies have unclear risk of bias (downgraded) | |
| Physical ability Stroke Impact Scale. A self report of overall physical ability (subscale of total Impact) | The mean score for the control groups ranged from 55.4 to 83.73 points (higher is better) | The mean score for the intervention groups was 2.91 points higher (0.00 to 5.82) | 437 (2) | ⊕⊕⊝⊝ low | Applicable: only somewhat as the mean change score should be 4.5 points to be regarded as clinically important (downgraded) Only two trials (downgraded) | |
| Adverse events (falls) from all available trials Counts of numbers of falls | High risk population | RD 0.03 (‐0.02 to 0.08) | 815 (8) | ⊕⊝⊝⊝ | Applicable: 8 out of 17 studies reported falls; 4 of these studies reported no falls in either group. Only small number of studies reported that falls occurred (low event rate with low reporting), wide CIs Difference not statistically significant (downgraded) Some studies have unclear risk of bias (downgraded) Heterogeneity I2 > 50%, (downgraded) | |
| 91.4 per 1000 | 134 per 1000 | |||||
| CI: confidence interval; RD: risk difference; MDC: minimal detectable change | ||||||
| GRADE Working Group grades of evidence | ||||||
Background
Description of the condition
Stroke is the second most common cause of death globally, and was the third most common cause of disability‐adjusted life‐years worldwide in 2010 (Feigin 2014). The absolute numbers of people with stroke and the overall global burden of stroke are high and, despite medical advances in high‐income countries, these numbers are increasing steadily (Feigin 2014). Disability from stroke can negatively affect people's relationships (Lynch 2008a), the ability to live in the community, and the ability to participate in work and leisure activities. Stroke rehabilitation has been described as a holistic management plan, which is directed towards "enabling a person with impairment to reach their optimal physical, cognitive, emotional, communicative and/or social functional level" (Dawson 2013, p4). In terms of physical function, there are clear benefits from the provision of physical rehabilitation after stroke (Pollock 2014). With increasing numbers of people having strokes, post‐stroke rehabilitation services are in high demand.
Rehabilitation after stroke can be provided in inpatient settings, in peoples' homes, or in community clinics. The financial costs associated with stroke are substantial: for instance, the average per‐person costs of stroke in 2012 in Australia was AUD 27,709 (Deloitte Access Economics 2013), and the burden of disease costs in the USA has been estimated at USD 34 billion per year (Mozaffarian 2015). While there is evidence that rehabilitation at home may be more cost‐effective than other models of service delivery (Hillier 2010), this is not a feasible service for many people with stroke. Given the high demand for services and high costs associated with delivering post‐stroke care, there is pressure on rehabilitation services to provide evidence‐based therapies that are also cost effective.
Description of the intervention
Group circuit class therapy (CCT) is a model of physical therapy delivery wherein participants are given the opportunity to practice active task‐specific exercises (i.e. functional activities) in an intensive manner. The first trials investigating the feasibility of providing physical therapy to patients in groups rather than the traditional one‐therapist‐to‐one‐patient model were published in the late 1990s (Taskinen 1999; Teixeira‐Salmela 1999). The key components of CCT are that physical therapy is provided in groups (more than two participants per therapist) and there is a focus on repetitive practise of functional tasks and exercises that are continually progressed as the participant's function improves (English 2007; Van de Port 2012; Wevers 2009). CCT may comprise either a series of workstations arranged in a circuit (Van de Port 2012; Wevers 2009) or a series of individualised activities within a group setting (English 2007; English 2015). CCT differs from physiological exercise programmes designed to improve strength or aerobic fitness because, although many CCT exercises may have a strength or fitness component, the primary focus is on specific training of everyday motor tasks.
CCT can be directed towards a range of post‐stroke impairments and has been used to improve the use of hemiparetic upper limbs (Blennerhassett 2004), or to improve both mobility and upper limb impairments within the one circuit class session (English 2007; English 2015). However, the majority of studies have investigated the use of CCT for improving mobility (the ability to stand, walk, or run) so mobility‐tailored CCT is the focus of this review.
How the intervention might work
Physical therapy provided to people with stroke for 30 minutes to 60 minutes per day, five to seven days per week, results in significant improvements in independence and motor function compared with no therapy (Pollock 2014). Accordingly, many national clinical guidelines for stroke recommend that people with stroke spend a minimum of between 30 minutes and three hours per day in therapy during inpatient rehabilitation (Intercollegiate Stroke Working Party 2012; Jauch 2013; Lindsay 2010; National Stroke Foundation 2010; Stroke Foundation of New Zealand 2010). Data modelling work has demonstrated that increased time scheduled for therapy is associated with significant post‐stroke improvements in function (Lohse 2014). Further evidence regarding the benefits of increased time in therapy was provided from a recently updated meta‐analysis of clinical trials of physiotherapy after stroke (Verbeek 2014). The meta‐analysis included 80 trials that investigated the effect of providing increased intensity (hours spent) of physiotherapy, and found that increasing time in therapy after stroke is associated with significant, positive effects on walking speed, balance, and activities of daily living. In order to achieve significant positive effects at the body‐function level as well as the activities and participation level, an increase of 17 hours of therapy provided over 10 weeks is necessary (Verbeek 2014). The group nature of CCT interventions potentially allows a greater amount of therapy to be provided to patients within a finite period of time without increasing staffing requirements.
A recent Cochrane Review on physiotherapy for improving mobility after stroke reported that no approach of physiotherapy is clearly more effective than other approaches (Pollock 2014). The review also found that physiotherapy appears to be most beneficial when a mixture of different approaches are provided that are tailored for each patient. Interventions that have proven effectiveness in improving mobility outcomes for people with stroke include balance training (Verbeek 2014), combined strength and cardiovascular training (Verbeek 2014), and treadmill training for people who are able to walk independently (Mehrholz 2014). CCT can potentially improve mobility outcomes as the aforementioned interventions can be incorporated into CCT, and all activities prescribed within CCT are routinely tailored to each participant.
There may be benefits of CCT related to the peer support and social interaction provided by the group environment. Depression after stroke is common, affecting one third of people in the first year following stroke (Hackett 2008). Several small qualitative studies have found benefits to stroke survivors from participating in group activities with peers in terms of learning new coping mechanisms (Morris 2012), experiencing an increased sense of independence and well‐being (Morris 2012), and reducing post‐stroke depression (Stroke Recovery Canada 2009).
The format of CCT is conducive for optimal motor learning after stroke. Given the group nature of the CCT format, participants will usually be prescribed certain activities to perform semi‐supervised or independently, and other activities to perform with assistance of a therapist. When participants are performing the independent activities, the nature of the task‐specific exercise should ensure their attention is on the overall movement outcome (external focus) rather than the individual body part or joint movements (internal focus). Attention to external foci has been associated with better motor‐learning outcomes (Van Vliet 2006; Wulf 2010). The presence of a therapist at each CCT session allows for extrinsic feedback to be given to participants, which is an important contributor for optimal motor learning (Sigrist 2013; Wulf 2010). Further, CCT allows participants to observe other stroke survivors who are learning new motor tasks, which is another mechanism to facilitate motor learning (Wulf 2010).
Why it is important to do this review
Given the fiscal constraints of healthcare systems, rehabilitation services cannot simply increase the amount of therapy provided to people with stroke by scheduling more frequent or longer one‐to‐one therapy sessions, because this involves significant increases in staffing costs. Instead, it is important that novel cost‐effective models of providing increased intensity of therapy are developed, researched, and implemented. CCT has the potential to be an effective means of providing a greater amount of physical therapy for people with stroke both in hospital and community settings. When the clinical effectiveness of CCT is established, then cost implications of this model of therapy provision can be investigated. This is an update of the original review in 2010 which found that there was evidence to support the use of CCT for improving mobility after stroke.
Objectives
To examine the effectiveness and safety of CCT on mobility in adults with stroke.
Methods
Criteria for considering studies for this review
Types of studies
Randomised controlled trials (RCTs) comparing CCT with no therapy, sham therapy, or another therapy modality. The earlier review included quasi‐randomised trials due to the paucity of studies. This was not necessary in this update.
Types of participants
We included studies of adults (18 years and older) with stroke (all types, severity, and stages of stroke/rehabilitation).
Types of interventions
We defined CCT as an intervention that involves participants receiving physical rehabilitation in a group environment, with a staff‐to‐client ratio of no greater than 1:3 (that is, no more than one staff member per three clients). We included studies that provided a minimum of once‐weekly CCT sessions for a minimum of four weeks. We only included studies that reported interventions with a focus on repetitive (within session) practise of functional tasks arranged in a circuit, with the aim of improving mobility. We excluded studies of interventions that included exercises solely aimed at improving impairment (such as strengthening, range of motion, or cardiovascular fitness).
Types of outcome measures
We evaluated outcome measures at post‐intervention and at follow‐up wherever available (e.g. three to six months post‐intervention). We did not consider outcomes taken after a single circuit class.
Primary outcomes
In this update the primary outcome of interest was walking capacity as measured using the Six Minute Walk Test (distance walked in six minutes: 6mWT). This is a clinically‐sensitive measure with demonstrated functional benefit for the person with stroke.
Secondary outcomes
Other measures of walking and standing ability including:
-
walking speed measured over a short distance (e.g. 5 m or 10 m walk test);
-
functional mobility measures such as the Timed Up and Go (TUG) or the Rivermead Mobility Index (RMI);
-
measures of standing balance, including the Step Test, Berg Balance Scale or Functional Reach Test.
Measures of impairment, such as:
-
lower limb strength; and
-
range of motion.
Measures of activity limitation, such as:
-
instrumental activities of daily living; and
-
personal care.
Measures of participation restriction, such as:
-
health‐related quality of life.
Other measures, such as:
-
length of hospital stay;
-
adverse events (including mortality);
-
self‐reported satisfaction;
-
locus of control;
-
economic indicators.
Summary of inclusion criteria
-
Human participants diagnosed with stroke (haemorrhage or infarct), of any severity/stage/setting (e.g. early: less than six months; or later: more than six months)
-
Eighteen years of age or older
-
Receiving CCT as defined
-
Outcomes evaluated in domains as defined
-
RCT
Search methods for identification of studies
See the 'Specialized register' section in the Cochrane Stroke Group module. We included all languages, and did not impose any date limits. To improve sensitivity we did not include a trials filter. We arranged for the translation of articles where necessary.
Electronic searches
We searched the Cochrane Stroke Group Trials Register, which was last searched by the Managing Editor in January 2017. We searched for additional articles published since the previous Cochrane systematic review on this topic from January 2008 onwards. Databases searched include the Cochrane Central Register of Controlled Trials (CENTRAL) (in the Cochrane Library 2016, Issue 12, Appendix 1), MEDLINE (in OVID, 1950 to January 2017, Appendix 2), Embase (1980 to January 2017, Appendix 3), CINAHL (1982 to January 2017, Appendix 4), PsycINFO (last searched January 2017, Appendix 5), AMED (1985 to January 2017, Appendix 6), SPORTDiscus (1949 to January 2017, Appendix 7), AGELINE (1978 to March 2015), Current Contents (last searched January 2017), Australasian Medical Index (AMI, 1968 to June 2016), NLM GATEWAY (gateway.nlm.nih.gov, last searched June 2016 for 2014 update), Latin American & Caribbean Health Sciences Literature (LILACS, 1982 to June 2016), IndMed (1985 to January 2017), Educational Resources Information Center (ERIC, 1967 to June 2016), and the Physiotherapy Evidence Database (PEDro, www.pedro.org.au, last searched January 2017). Unique search strings are included in the Appendices, and where not included are adaptations.
Searching other resources
We used the MEDLINE (Ovid) search developed by the Cochrane Stroke Group Information Specialist and adapted it to search the other databases. We included all languages, and imposed no date limits. As the subject area of this review is quite specific we did not include a trials filter. This increased the sensitivity of the search.
In an effort to identify further published, unpublished and ongoing studies, we:
-
searched for proceedings from stroke‐related conferences that were peer‐reviewed and published in the above databases until 2016;
-
searched reference lists (from salient articles, journals and books) and unpublished theses;
-
contacted authors of published trials and other experts in the field;
-
searched the following clinical trials and research registers:
-
World Health Organization (WHO) International Clinical Trials Registry Platform (ICTRP) (apps.who.int/trialsearch/);
-
US National Institutes of Health Ongoing Trials Register, ClinicalTrials.gov (www.clinicaltrials.gov/);
-
Computer Retrieval of Information on Scientific Projects (commons.era.nih.gov/common);
-
ISRCTN Registry www.isrctn.com/ (formerly the Current Controlled Trials);
-
National Institute of Neurological Disorders and Stroke (www.ninds.nih.gov/);
-
National Rehabilitation Information Centre (Naric) (including REHABDATA) (www.naric.com/);
-
Stroke Trials Directory ‐ the Internet Stroke Center (www.strokecenter.org/trials).
-
Data collection and analysis
Selection of studies
We retrieved papers from the identified lists on the basis of title/abstract, reviewing them against the established criteria for inclusion. If all criteria were met (that is, answers to the five criteria were 'yes' or 'unsure') we retrieved the study in full and reviewed it for final inclusion and then for methodological quality and data extraction. If we disagreed on any aspect of study inclusion we reached consensus through discussion and had a third review author available for consultation if consensus could not be reached.
Data extraction and management
We independently entered data into the Review Manager software, RevMan 5.3 (RevMan 2014), and included full citation details of the study, objectives, design, length, assessment time points, number and characteristics of participants (inclusion and exclusion criteria), description of the intervention, outcome measures, intention‐to‐treat analysis, withdrawals and loss to follow‐up, and adverse events. If we disagreed on any aspect of data extraction or quality evaluation, we reached consensus through discussion and had a third review author available for consultation if consensus could not be reached.
Assessment of risk of bias in included studies
We independently assessed the quality of the studies to be included. We assessed the methodological quality of the included studies for risk of bias using the criteria recommended in section 8 of the Cochrane Handbook for Systematic Reviews of Interventions (Higgins 2011) in six domains: sequence generation, allocation concealment, blinding of participants, personnel and outcome assessors, incomplete outcome data, selective reporting and 'other'. We defined 'other' as adequate sample size, based on supplied power calculations. We gave studies an overall summary of the risk of bias for each important outcome (across domains), as well as within and across studies using three levels: low, unclear, or high risk of bias. We also gave a descriptive report on the overall risk of bias in relation to the findings from the meta‐analyses.
Measures of treatment effect
We extracted and analysed data to calculate risk ratio (RR) or mean difference (MD) and 95% confidence intervals (CI). This required the identification of the number of participants in each group in each trial and the total number (for dichotomous data), and the number of participants plus the mean and standard deviations for each group (for continuous data).
Unit of analysis issues
We considered studies with non‐standard designs, for example, cluster randomised trials, if they were assessed as having a low risk of bias. We only considered randomised cross‐over trials prior to cross over (irrespective of wash‐out periods as the changes are assumed to be permanent) and if the study authors provided an analysis of results for the first phase.
Dealing with missing data
We contacted study authors to request appropriate data for meta‐analyses if these were not adequately reported in the retrieved paper. We considered intention‐to‐treat analysis as part of the risk of bias assessment and recorded loss to follow‐up.
Assessment of heterogeneity
We assessed statistical heterogeneity both visually and using the I2 statistic (Higgins 2003). Where I2 was greater than 50% we used random‐effects rather than a fixed‐effect analysis. We also evaluated clinical heterogeneity (clinical and methodological diversity).
Assessment of reporting biases
We minimised reporting biases by the comprehensive search strategies, which had no date or language limits. However, where appropriate we could also examine this statistically via funnel plots and tests for asymmetry if there were sufficient studies (recommended more than 10; Sterne 2011).
Data synthesis
We conducted a meta‐analysis with appropriate data. We considered the degree of heterogeneity to determine whether to use fixed‐effect or random‐effects analyses.
Subgroup analysis and investigation of heterogeneity
We considered performing subgroup analyses to establish effectiveness relative to gender, chronicity, age or stroke severity (respectively men versus women; early (less than one year post‐stroke) versus late (more than one year post‐stroke); young adults versus older; mild/moderate versus severe stroke, if sufficient data were available.
Sensitivity analysis
We conducted sensitivity analyses to determine if pooling results from large trials (more than 100 participants) led to different results compared with pooling data from small trials (fewer than 100 participants), or if trials with low versus high risk of bias influenced the results, when a sufficient number of trials were available.
GRADE assessment and 'Summary of findings' tables
We presented the main results of the review in summary of findings Table for the main comparison for the comparison of CCT versus 'other' interventions. We reported the outcome measure of walking capacity (6mWT) as the primary outcome; we also included other secondary outcomes in the table that had a sufficient body of evidence (number of trials/number of participants) in recognition that low numbers in either or both of these inevitably leads to a 'very low' GRADE designation.
A 'Summary of findings' table presents information about the certainty of the evidence, the size of the effect of the intervention examined, and the sum of available data for the main outcomes. The 'Summary of findings' table also includes an overall grading of the evidence related to each of the main outcomes using the GRADE approach (GRADE 2013). This defines the certainty or confidence in a body of evidence that an estimate of effect or association is close to the true quantity of specific interest. This certainty involves consideration of within‐trial risk of bias (methodological quality), applicability of evidence, heterogeneity, precision of effect estimates, and risk of publication bias (Higgins 2011). When making decisions for the risk of bias, we downgraded only when we had classed studies as being at high risk of bias for one or more domains or they were classed as being at unclear risk of bias for both domains that contribute to selection bias, or both (GRADE 2013).
Results
Description of studies
See Characteristics of included studies and Characteristics of excluded studies
Results of the search
We retrieved 101 potential trials in full from the search, of which we included 17 in this review (Figure 1). Twelve were new studies published between 2010 and 2015. Five studies were included from the previous review (Blennerhassett 2004; Dean 2000; Marigold 2005; Mudge 2009a; Pang 2005). We excluded one study from the previous review in this update as it was a pseudo‐randomised trial (English 2007).

PRISMA flow diagram
Included studies
The 17 included trials were all conducted between 2000 and 2015; four in Australia (Blennerhassett 2004; English 2015; Dean 2012; Marsden 2010), four in Canada (Dean 2000; Marigold 2005; Pang 2005; Tang 2014), two in Korea (Song 2015; Kim 2016a) and the UK (Harrington 2010; Moore 2015) , and one each in Germany (Outermans 2010), India (Verma 2011), , the Netherlands (Van de Port 2012), New Zealand (Mudge 2009a), and Sweden (Holmgren 2010). Four trials were conducted in an inpatient hospital setting (Blennerhassett 2004; English 2015; Song 2015; Verma 2011). The remaining 13 trials were conducted in community settings. A total of 1297 participants were included with sample sizes varying from 12 to 250 participants. Time since stroke onset varied with studies including participants within one month (three trials: Blennerhassett 2004; English 2015; Outermans 2010), three months (three trials: Kim 2016a, Van de Port 2012; Verma 2011), six months (one trial: Holmgren 2010), one year (one trial: Harrington 2010), and more than one year post stroke (eight trials: Dean 2012; Moore 2015; Tang 2014; Dean 2000; Marigold 2005; Marsden 2010; Mudge 2009a; Pang 2005). One trial did not report the exact time since stroke (Song 2015). Only two studies collected objective measures of stroke severity, both of which used the National Institutes of Stroke Scale (Tang 2014; Verma 2011). For the majority of the other studies, stroke severity could be inferred as being mild to moderate, as their inclusion criteria for functional ability was only participants who were able to walk at least 5 m (Tang 2014) or 10 m independently, with or without a walking aid. Two studies included people living at home in the community with no reference to walking ability (Harrington 2010; Marsden 2010), and one included people in the moderate band of stroke severity according to score ranges on the Functional Independence Measure (FIM) (English 2015).
All studies investigated the effects of CCT (workstation‐based, task‐specific practise in a group with a ratio of staff to client of 1:3 or higher) with the aim of improving mobility in people post stroke. Two studies also explicitly aimed to improve cardiorespiratory fitness and included a target heart rate zone within their intervention (Outermans 2010; Tang 2014). Three studies combined CCT with education sessions (Harrington 2010; Holmgren 2010; Marsden 2010) and one combined CCT with mental imagery (Verma 2011). The length of therapy sessions, frequency (sessions per week), and duration of the intervention period varied somewhat between studies but were relatively homogeneous in terms of staffing and content ‐ see Table 1 for a summary of all CCT formats. Five studies reported the percentage of therapy sessions attended and this ranged from 63% (Dean 2012) to 92% (Mudge 2009a), with Harrington 2010 reporting that 61% of participants attended at least 75% of therapy sessions. English 2015 reported the mean total amount of therapy time received per participant (37.3 hours) and Van de Port 2012 reported the total number and average duration of therapy sessions delivered to intervention participants (4461 sessions, mean 72 minutes' duration).
| Study ID | What (CCT content) | Who | How (timing, number and duration of sessions) | Where |
| Mobility CCT in addition to usual care; functional tasks, strengthening exercises | Physiotherapist | 1‐hour sessions 5 days per week for 4 weeks | Inpatient rehabilitation unit | |
| Multiple task‐specific training strengthening LL; practice locomotor‐related tasks | Physiotherapists | 1‐hour sessions, 3 days per week for 4 weeks | Community setting | |
| Progressive balance and strengthening exercises; walking and stair climbing. Home exercise programme and advice to increase walking | Physiotherapist | 45 to 60 minutes per week for 40 weeks over a one‐year period | Community setting | |
| Task‐specific, part‐ as well as whole‐practice of tasks; emphasis on repetition and feedback | Physiotherapists, assistants, and physiotherapy students | 90‐minute sessions, 5 times per week for 4 weeks | Inpatient rehabilitation | |
| Individual, easily progressed; balance, endurance, strength, flexibility, function and well‐being. Home exercise manuals and encouraged for on‐going exercise | Instructor and physiotherapist with support from volunteers (partners, carers, family members) | 2 sessions per week for 8 weeks. (1 hour exercise plus 1 hour interactive education | Community setting | |
| Individualised physical activity, functional performance; educational group discussions about fall risk and security | Physiotherapist and occupational therapist | 7 sessions per week divided over 3 days for 5 weeks | Community setting | |
| Progressive, focused on mobility and gait training as well as physical fitness | Physiotherapist | 90‐minute sessions, 5 days per week for 4 weeks | Inpatient rehabilitation | |
| Focused on walking, standing, balance, and sit‐to‐stand tasks | Physical therapist, kinesiologist, and recreation therapist | 1‐hour sessions, 3 times per week for 10 weeks | Community setting | |
| Education and exercises for LL function: functional tasks, strength training and balance training | Multidisciplinary team including a physiotherapist, social worker, dietician, clinical nurse consultant, speech pathologist and occupational therapist | 2‐hour sessions (1 hour education + 1 hour exercise) weekly for 7 weeks | Community setting | |
| Functional movement including stretching, functional strengthening, balance, agility and fitness | Physiotherapist and physical activity instructor | 3 x 45‐ to 60‐minute sessions per week for 19 weeks | Community setting | |
| Task‐oriented gait or standing balance activity, strengthening LL | Physiotherapist and 2 physiotherapy students | 50‐ to 60‐minute sessions, 3 times a week for 4 weeks | Community setting | |
| Postural control and gait‐related activities: stair climbing, walking and turning | Therapists | 45‐minute sessions, 3 times per week for 4 weeks | Inpatient and outpatient settings | |
| Fitness and mobility exercise: cardiorespiratory fitness, mobility, leg muscle strength, balance, and hip bone mineral density | Physical therapist, occupational therapist, and exercise instructor | 1‐hour sessions, 3 times per week for 19 weeks | Community setting | |
| Functional training tasks | Physiotherapists | 30‐minute sessions, 3 times per week for 4 weeks | Inpatient rehabilitation | |
| Brisk level and inclined overground walking, upright and recumbent cycle ergometry, functional movements | 3 instructors | 60‐minute classes, 3 times per week for 6 months | Community setting | |
| Meaningful tasks related to walking competency | Physiotherapist and sports therapists | 90‐minute sessions, 2 times per week for 12 weeks | Community setting | |
| Meaningful tasks related to walking competency: balance control, stair walking, turning, transfers, and speed walking | Physiotherapist or occupational therapist 1 caretaker to ensure safety | 40‐minute sessions, 7 days per week for 2 weeks | Inpatient and outpatient settings |
CCT: circuit class therapy
LL: lower limb
Twelve studies had a comparison group involving alternate 'other interventions', which was matched for length of sessions, frequency, and duration of intervention for eight studies. The description of the comparison 'other interventions' ranged from usual care (English 2015; Kim 2016a; Song 2015; Van de Port 2012; Verma 2011), CCT involving upper limb training only (Blennerhassett 2004; Dean 2000; Dean 2012; Pang 2005), non‐specific exercises such as stretching (Marigold 2005; Moore 2015) or education/social groups (Mudge 2009a). Three studies compared CCT combined with education versus no therapy (Harrington 2010; Holmgren 2010; Marsden 2010). In two studies the comparison group also received mobility‐related CCT but at a lower intensity (without a target heart rate) (Outermans 2010; Tang 2014).
All studies used a composite of measures related to mobility including tests of walking ability (gait speed and capacity), and balance (TUG, Berg Balance Scale (BBS), Step test). Some studies used measures of quality of life, upper limb function, balance self‐efficacy, tests for impairment (strength, VO2max, kinematic data), free‐living walking ability (steps per day using an activity monitor), numbers of adverse events (falls during therapy), satisfaction, and length of stay. Only one study included measures of economic indicators (Harrington 2010). A total of 62 different outcome measures were reported in the included studies.
Excluded studies
We excluded the remaining studies for a variety of reasons including inappropriate methods, or interventions that were either not task‐specific (that is to say the interventions addressed impairments not functional tasks) or not in a group (staff‐to‐client ratio was less than 1:3). See Characteristics of excluded studies for individual reasons for exclusions.
Risk of bias in included studies
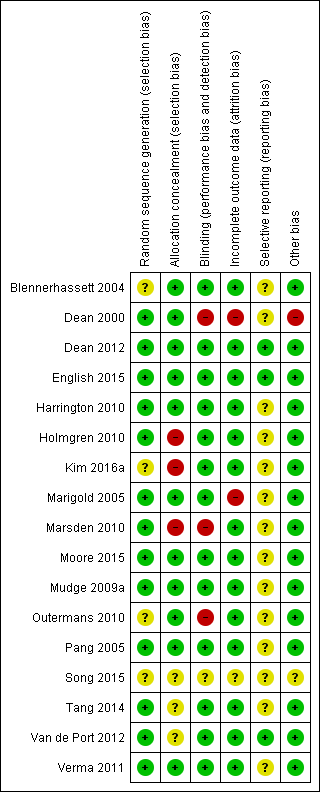
Figure 2 summarises the trials together with risk of bias in the six domains, with the most likely risk in the area of selective reporting of outcome data, which was frequently rated as unclear because the majority of included studies did not publish a trial protocol or register their trials. Figure 3 shows the trials individually across the six domains. Three of the 17 trials demonstrated adequate control of risk across all six domains (Dean 2012; English 2015; Mudge 2009a).
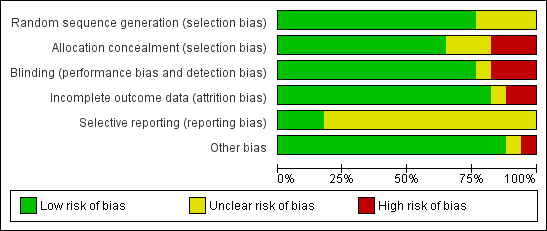
Risk of bias graph: review authors' judgements about each risk of bias item presented as percentages across all included studies.

Methodological quality summary: review authors' judgements about each methodological quality item for each included study.
Allocation
Thirteen studies stated the allocation method for randomising, with the remaining four studies stating that random allocation occurred but not how (Blennerhassett 2004; Kim 2016a; Outermans 2010; Song 2015). Six studies either did not conceal or did not state whether or how allocation was concealed to the administrator of the randomisation process (Holmgren 2010; Kim 2016a; Marsden 2010; Song 2015; Tang 2014; Van de Port 2012).
Blinding
Four studies did not report blinding of assessors involved in the trial (Dean 2000; Marsden 2010; Outermans 2010; Song 2015).
Incomplete outcome data
Three studies did not adequately report and/or account for attrition across the trial groups (Dean 2000; Marigold 2005; Song 2015).
Selective reporting
Only three studies provided a reference to the trial registration or study protocol with all three studies demonstrating complete reporting (Dean 2012; English 2015; Van de Port 2012).
Other potential sources of bias
We noted other potential sources of bias, such as small numbers (Dean 2000), and cursory reporting across all aspects of trial conduct (Song 2015).
Effects of interventions
CCT versus 'other interventions'
Sufficient clinical homogeneity allowed us to pool study data, comparing CCT for mobility versus 'other intervention(s)'.
Primary outcome
Ten studies (835 participants, 64% of total sample) measured walking capacity using the 6mWT (Blennerhassett 2004; Dean 2000; Dean 2012; English 2015; Kim 2016a; Moore 2015; Mudge 2009a; Pang 2005; Van de Port 2012; Verma 2011). Meta‐analysis demonstrated that overall CCT was superior to the comparison intervention (MD 60.86, 95% CI 44.55 to 77.17; I2 = 27%, Analysis 1.1). Subgroup analysis between trials with participants who were early versus late after stroke onset showed a greater mean difference (improvement) for the later group but failed to reach a significant difference between these subgroups (P = 0.14).
Using the GRADE criteria based on the number of participants, the significant effect and relatively narrow CIs, we applied an overall rating of 'moderate', however we downgraded due to uncertain risk of bias across several studies.
Secondary outcomes
Eight studies (744 participants, 57% of total sample) measured gait speed (Dean 2000; Dean 2012; English 2015; Moore 2015; Mudge 2009a; Song 2015; Van de Port 2012; Verma 2011), with meta‐analysis showing a difference between the two groups that reached significance in favour of CCT (MD 0.15, 95% CI 0.10 to 0.19; I2 = 14%, Analysis 1.2). Using the GRADE criteria based on the number of participants, the significant effect and relatively narrow CIs, we applied an overall rating of 'moderate', however we downgraded due to uncertain risk of bias across several studies.
Two studies (50 participants) measured cadence in steps per minute and found a significant effect in favour of CCT (Song 2015; Verma 2011: MD 13.57, 95% CI 7.52 to 19.62; I2 = 0%, Analysis 1.3).
Five studies (488 participants) used the TUG test to measure the ability to stand up, walk, and turn around, and meta‐analysis showed a difference between the two groups that reached significance in favour of CCT ((Blennerhassett 2004; Dean 2000; Dean 2012; Marigold 2005; Van de Port 2012: MD ‐3.62, 95% CI ‐6.09 to ‐1.16; I2 = 0%, Analysis 1.4). Two studies (296 participants) measured mobility using the Rivermead Mobility Index (Mudge 2009a; Van de Port 2012). The meta‐analysis showed a significant effect in favour of CCT (MD 0.56, 95% CI 0.17 to 0.95; I2 = 7%, Analysis 1.5). Three studies (469 participants) measured independence in walking using the Functional Ambulation Classification (English 2015; Van de Port 2012; Verma 2011) and found a significant effect in favour of CCT (OR 1.91, 95% CI 1.01 to 3.62; I2 = 34%, Analysis 1.6).
Four studies (171 participants) applied the Berg Balance Scale with meta‐analysis showing no significant between‐group differences (Kim 2016a; Moore 2015; Marigold 2005; Pang 2005: MD 1.21, 95% CI ‐0.62 to 3.04; I2 = 30%, Analysis 1.7). Three studies (190 participants) used the Step Test to measure balance with no significant between‐group differences (Blennerhassett 2004; Dean 2000; Dean 2012: MD 0.98, 95% CI ‐0.40 to 2.37; I2 = 21%, Analysis 1.8). Two studies (103 participants) measured balance self‐efficacy using the Activities‐specific Balance Confidence Scale (ABC) with meta‐analysis showing a significant effect in favour of CCT ((Marigold 2005; Mudge 2009a: MD 7.76, 95% CI 0.66 to 14.87; I2 = 0%, Analysis 1.9).
Two studies (437 participants) used the Stroke Impact Scale ‐ physical sub‐scale to measure self‐reported physical ability (English 2015; Van de Port 2012). The meta‐analysis demonstrated a favourable effect for CCT that just met significance (MD 2.91, 95% CI 0.00 to 5.82; I2 = 0%, Analysis 1.10).
Two studies measured fitness using VO2 peak (Moore 2015; Pang 2005, 103 participants). A significant favourable effect was found for CCT participants (MD 2.81, 95% CI 0.90 to 4.72; I2 = 0%, Analysis 1.11). Two studies (206 participants) included measures of average daily step counts and found significant effect in favour of CCT (Mudge 2009a; Dean 2012: MD 1325.66, 95% CI 411.09 to 2240.22; I2 = 29%, Analysis 1.12).
Two trials (217 participants) measured length of stay (Blennerhassett 2004; English 2015). A shorter length of stay was reported for participants receiving CCT (MD ‐16.35, 95% CI ‐37.69 to 4.99; I2 = 51% ), but this was not significant when random effects were applied (given the high heterogeneity) (Analysis 1.13).
CCT + education versus no intervention
Sufficient clinical homogeneity allowed us to pool study data, comparing CCT + education versus no intervention. Two studies measured balance using the TUG (269 participants) with no significant between group differences found (Harrington 2010; Marsden 2010: MD 0.90, 95% CI ‐0.94 to 2.75; I2 = 0%, Analysis 2.1). The same two studies measured carer burden using the Carer Strain Index (Harrington 2010; Marsden 2010, 174 participants). The meta‐analysis showed a negative effect of the intervention with higher Carer Strain Index (worse functioning) reported by carers of participants in the CCT + education group (MD 1.06, 95% CI 0.39 to 1.73; I2 = 0%, Analysis 2.2).
CCT versus a different CCT
Two studies compared mobility‐related CCT provided at high intensity (with target heart rate zones) versus the same exercises at low intensity (Outermans 2010; Tang 2014). The 6mWT was the only outcome in common between these trials, but due to the differences in the duration of the intervention there was insufficient clinical homogeneity to pool data (six months in Tang 2014 versus four weeks in Outermans 2010).
All comparisons
Eight studies (836 participants) reported monitoring adverse events including falls. Of these, four studies reported that there were no falls, and the other four reported between six falls (Pang 2005) and 55 falls (Van de Port 2012). There was a higher risk of falls in the CCT groups (risk difference 0.03, 95% CI ‐0.02, 0.08; I2 = 60%) but this did not reach significance (Analysis 3.1).
Sensitivity analyses: primary outcome
We conducted a sensitivity analysis based on the size of the trial, considering large trials to be those with 100 or more participants (Dean 2012; English 2015; Harrington 2010; Van de Port 2012) and small trials to be those with fewer than 100 participants (Blennerhassett 2004; Dean 2000; Holmgren 2010; Kim 2016a; Marigold 2005; Marsden 2010; Moore 2015; Mudge 2009a; Outermans 2010; Pang 2005; Song 2015; Tang 2014; Verma 2011). The size of effect for the 6mWT was smaller but still significant when pooling only data from large trials (MD 46.31, 95% CI 22.90 to 69.72; participants = 588; studies = 3; I2 = 11%) compared with small trials (MD 74.59, 95% CI 51.85 to 97.32; participants = 247; studies = 7; I2 = 17%).
We also conducted a sensitivity analysis based on risk of bias where the three studies with no/low assessed risk of bias in the six domains confirmed a positive effect in favour of CCT for the 6mWT (Dean 2012; English 2015; Mudge 2009a: MD 46.32, 95% CI 17.40 to 75.24; I2 = 38%) (Analysis 1.14).
Discussion
Summary of main results
The primary aim of this review was to investigate the effectiveness of group CCT for improving mobility after stroke. For our primary outcome measure of gait capacity, we found CCT to be superior to other interventions for improving the distance walked on the 6mWT. The minimal clinically‐meaningful improvement on the 6mWT has been estimated at 34.4 m for people later after stroke (Eng 2004) and 61 m for people early after stroke (Perera 2006). Thus, we can be confident that the mean improvement found in the meta‐analysis of 60.86 m represents a real and applicable clinical change. The positive finding for the 6mWT is of functional relevance as it has been shown to be a stronger predictor of the community walking ability than measures of walking speed (Fulk 2010; Mudge 2009b; Rand 2009), which may overestimate community ambulatory ability (Taylor 2006). Furthermore, the 6mWT has been shown to correlate significantly with quality of life after stroke (Muren 2008). We also confirmed that the positive effects were present for people both early and late after stroke suggesting potential for improvement does not necessarily decline. A further positive feature of the primary outcome analyses was that heterogeneity was low. However, we downgraded the GRADE designation to 'moderate' because of the potential for risk of bias in some included studies.
We also found a small favourable effect of CCT in regards to improvements in walking speed, with the magnitude of the between‐group difference (0.15 m per second) being greater than the estimated smallest worthwhile effect of 0.06 m per second (Perera 2006). Perera 2006 suggest that a difference of greater than 0.14 m per second represents a substantial meaningful change for people after stroke. Thus, we can be confident that our results represent real clinical change. Our results suggest that CCT as an intervention has a positive effect on improving independence in walking, with the odds of being fully independent in walking (Functional Ambulation Scale score of 5) after the intervention being significantly greater for intervention participants compared with people allocated to the control intervention.
The evidence for the effectiveness of CCT in improving walking ability after stroke can be considered robust as it is consistently positive across a range of clinic‐based walking measures (6mWT, walking speed, Functional Ambulation Classification) and self‐reported physical function (Stroke Impact Scale ‐ Physical, Rivermead Mobiity Index). The intervention across all studies included a strong emphasis on continuous walking practice. Therefore, the positive results are in line with evidence for intensity and task‐specificity of training, that is to say 'what is trained is what is gained' (Verbeek 2014).
There is some evidence that improvements in walking capacity and ability gained through CCT may also translate into behaviour change. In this updated review, two studies included measures of daily step counts, measured using either a pedometer (Dean 2012) or an ankle‐worn accelerometer (Mudge 2009a). Both trials found that participants who received CCT increased their daily step count to a significantly greater degree than control participants. This is important, as lack of adequate physical activity is linked to increased all‐cause morbidity and mortality (Lollgen 2009) and cardiovascular disease‐specific morbidity and mortality (Thompson 2003), as well as increased risk of stroke (Feigin 2014; McDonnell 2013).
Importantly, CCT may also be an effective method of training for improving cardiorespiratory fitness for people later after stroke. Many studies (Marsden 2013; Marsden 2016; Smith 2012) have reported fitness levels of stroke survivors at less than the minimum requirement for activities of daily living in older adults, that is, 15 mL/kg/min to 18 mL/kg/min (Shephard 2009). An improvement in fitness in the order of magnitude found in our meta‐analysis (2.8 mL/kg/min) is similar to that conferred by exercise interventions with an aerobic component (Marsden 2013). This amount is clinically important as it can improve the exercise reserve of stroke survivors (Ivey 2006) and has the potential to reduce the risk of death (Kodama 2009).
The effectiveness of CCT for improving postural control is less clear. We found significant between‐group differences in favour of CCT for the Activities‐specific Balance Confidence scale and the TUG that exceeded the minimal detectable difference on these measures (Flansbjer 2005; Salbach 2006). However, between‐group differences were non‐significant for the step test, and too small to be clinically worthwhile on the Berg Balance Scale: MD of 1.36 points compared with minimal detectable change of 6.9 points early after stroke (Stevenson 2001), and 4.13 points later after stroke (Flansbjer 2012).
There is some suggestion that providing CCT to people receiving in‐hospital rehabilitation after stroke may reduce length of hospital stay with a mean between‐group difference of 16.35 days. However, the heterogeneity in the study results was higher (I2 = 51%) and the difference just failed to reach significance using random effects in the analysis. There are many factors that influence length of hospital stay. A recent individual patient meta‐analysis was conducted where data were pooled from two large multicentre trials investigating the effect of additional weekend therapy for people with stroke. The meta‐analysis identified a range of factors that significantly contributed to length of rehabilitation hospital stay, including age and degree of disability at admission (English 2016). Interestingly, this paper also reported considerable variability in length of stay between individual hospital sites, highlighting the complexity of factors that influence how long people with stroke spend in inpatient rehabilitation. However, a secondary analysis of data from the CIRCIT trial (English 2015) found that when controlling for other influencing factors, receiving CCT as the sole method of physiotherapy service delivery (as compared to usual care physiotherapy) was an independent predictor of a shorter length of stay, in the order of ‐11.6 days (95% CI ‐21.3 to ‐1.9, P = 0.019) (Abstracts Asian Pacific Stroke Congress p6). Reducing length of stay has the potential for significant savings to the healthcare system, but we currently lack high‐quality economic data to establish the cost effectiveness of such an approach.
With regards to adverse events, there were more falls (albeit not statistically different) reported among participants receiving CCT compared with other interventions. Any intervention aimed at improving mobility and balance after stroke carries an inherent risk of causing falls because it is necessary for participants to undertake activities at the limits of their abilities for the interventions to be effective. The greater falls rate in the intervention group is perhaps not surprising considering that the control group was either undertaking interventions that did not expose the participants to an increased risk of falls; for example, seated upper extremity exercise programmes (Blennerhassett 2004; Dean 2000; Pang 2005), stretching (Marigold 2005; Moore 2015), education (Holmgren 2010; Mudge 2009a), or had significantly less risk exposure because they spent significantly less time engaged in physical therapy sessions (English 2015). Nevertheless, it would be pertinent for future studies to more closely examine the link between CCT and falls in therapy.
Carer burden was reported as increased in two studies comparing CCT plus education against no intervention (Harrington 2010; Marsden 2010). It is unknown how the burden was generated and whether it was simply because of receipt of an intervention per se ‐ this requires clarification in future studies.
Based on the results of the two available trials, there is currently no evidence for superior effectiveness of CCT when combined with education. Similarly, there is insufficient evidence for the relative effectiveness of CCT delivered at higher versus lower intensity (based on heart rate targets).
Overall completeness and applicability of evidence
The content of the intervention provided was similar across all studies with many of the same exercises and activities included (see Characteristics of included studies and Table 1). The majority (11) of the trials were conducted with participants later after stroke (more than one year), compared with earlier after stroke (less than one year, six trials) and whilst our subgroup analyses failed to show a significant difference in effect between the two time frames, there was a larger improvement noted in the later group for several measures. The influence of time alone on recovery after stroke remains largely unknown, although it has been estimated to account for between 16% and 42% of improvements in function in the first six to 10 weeks after stroke (Kwakkel 2004). This may mask any potential benefits of CCT over and above usual care in studies conducted with people earlier after stroke.
There were insufficient data available to examine the impact of CCT on sensorimotor impairment after stroke. No studies included measures of movement kinematics or stroke recovery biomarkers such as imaging. Therefore, we cannot determine the degree to which improvements in mobility measures are related to recovery of motor function, specifically 'true neurological recovery' (Levin 2009) versus compensation and overcoming deconditioning.
This updated review included four trials with sample sizes greater than 100 participants. When we pooled data from only these trials, the magnitude of effect for CCT was smaller, but remained statistically significant for the 6mWT. Smaller trials tend to over‐estimate treatment effects (Pereira 2012). The implications of population heterogeneity across large and small trials need to be considered. Furthermore, our 6mWT results were upheld after a sensitivity analysis for trials with low versus unclear/high risk of bias.
The ability to pool data across trials was somewhat limited by the diversity in outcome measures used. Across the 17 included trials, a total of 62 different outcome measures were used. Lack of commonality in outcome measures is a major issue hampering the progress of stroke rehabilitation and recovery research. An analysis of 38 trials in the Virtual International Stroke Archives in 2012 found at least 44 reported outcome measures, with age being the only common metric across trials (Ali 2013). A group of international experts is currently working on addressing this issue with consensus statements being produced as a result (Bernhardt 2016).
Quality of the evidence
The trials were of varying levels of assessed risk of bias. Most commonly, failure to report one or two domains led to a greater overall risk and it remains to be seen if standards of trial conduct and reporting improve in the future. We cannot differentiate between failure to report versus failure to control the risk and this is a potential source of bias in the review process. Hence we downgraded all GRADE determinations as a result of this uncertainty. Three studies achieved 'low' risk ratings in all six domains, confirming that stroke rehabilitation studies can be conducted and reported in an acceptable manner.
Potential biases in the review process
Potential biases in the review process need to be considered in that the three review authors are stroke rehabilitation trialists and take a pragmatic stand on trial design. For example, we did not assess trials as having a risk of bias where the therapist or the participants were not blinded, as we did not consider this possible in these kinds of clinical trials (other than to maintain the participant naive as to which arm of the trial was of interest to the researchers). The definition of CCT was relatively prescriptive and it may be that studies using an alternate circuit format were not included. For example, Kim 2016b compared group CCT with individualised CCT ‐ however their definition of individualised CCT met the criteria for this review's group CCT, thus not offering a useful comparator. It is important that studies such as this are considered in future, as they may help ascertain which aspects of CCT are effective.
Agreements and disagreements with other studies or reviews
This updated review strengthens the findings of our previous review and the systematic review of Wevers 2009, that CCT is an effective intervention for improving walking ability in people after stroke. The updated findings highlight that the benefit of CCT is reported regardless of time after stroke. This update also provides new evidence that CCT may be an effective method of improving cardiorespiratory fitness and increased daily physical activity (step counts).

PRISMA flow diagram

Risk of bias graph: review authors' judgements about each risk of bias item presented as percentages across all included studies.
Methodological quality summary: review authors' judgements about each methodological quality item for each included study.

Comparison 1 Circuit class therapy versus other, Outcome 1 6mWT early and late.

Comparison 1 Circuit class therapy versus other, Outcome 2 Gait speed early and late.

Comparison 1 Circuit class therapy versus other, Outcome 3 Cadence.

Comparison 1 Circuit class therapy versus other, Outcome 4 Timed Up and Go.
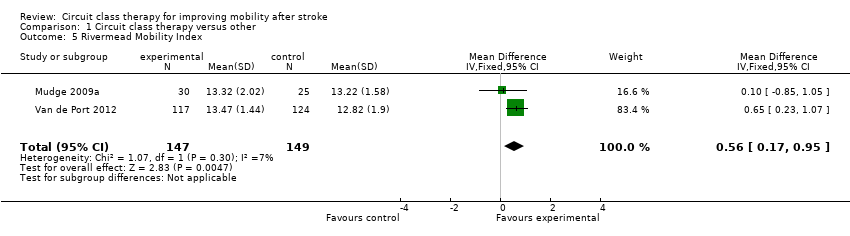
Comparison 1 Circuit class therapy versus other, Outcome 5 Rivermead Mobility Index.

Comparison 1 Circuit class therapy versus other, Outcome 6 Functional Ambulation Classification.

Comparison 1 Circuit class therapy versus other, Outcome 7 Berg Balance Scale.
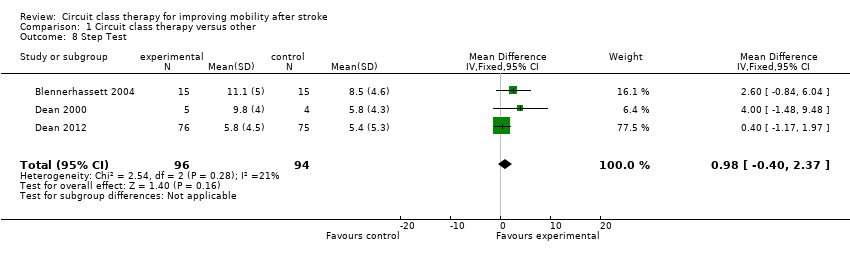
Comparison 1 Circuit class therapy versus other, Outcome 8 Step Test.

Comparison 1 Circuit class therapy versus other, Outcome 9 Activities‐specific Balance Confidence Scale.
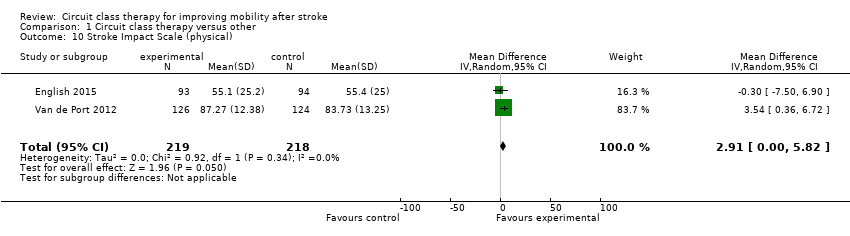
Comparison 1 Circuit class therapy versus other, Outcome 10 Stroke Impact Scale (physical).

Comparison 1 Circuit class therapy versus other, Outcome 11 VO2 peak.

Comparison 1 Circuit class therapy versus other, Outcome 12 Steps per day.

Comparison 1 Circuit class therapy versus other, Outcome 13 Length of stay.
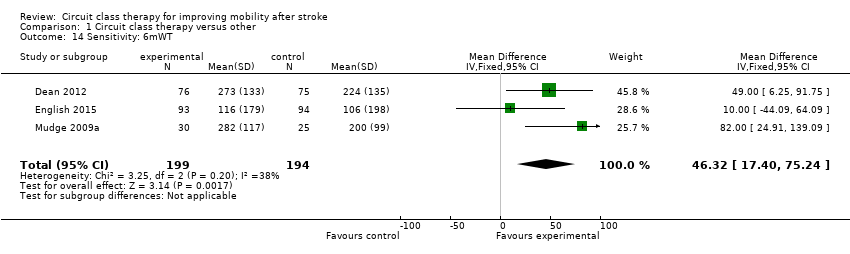
Comparison 1 Circuit class therapy versus other, Outcome 14 Sensitivity: 6mWT.

Comparison 2 CCT + education versus no therapy, Outcome 1 Timed Up and Go.

Comparison 2 CCT + education versus no therapy, Outcome 2 Carer Strain Index.

Comparison 3 CCT +/‐ education versus any other intervention, Outcome 1 Adverse events (falls).
| Circuit class therapy compared with other intervention for improving mobility | ||||||
| Patient or population: people with stroke Settings: in hospital or community Intervention: mobility‐related circuit class therapy Comparison: any other intervention | ||||||
| Outcomes | Illustrative comparative effects (95% CI) | Relative effect | No of participants | Quality of the evidence | Comments | |
| Assumed effect | Absolute effect | |||||
| Other intervention | Mobility‐related circuit class therapy | |||||
| Walking capacity: 6mWT Continous measure of distance walked in 6 minutes in m | The mean 6mWT distance ranged across control groups from 106 m to 441 m | The mean 6mWT distance in the intervention groups was (44.55 to 77.17) | 835 (10) | ⊕⊕⊕⊝ | Applicable: difference greater than minimal clinically important difference (MDC) = 34.4m Eng 2004, and 95% CI of difference does not cross MDC Test for differences between subgroups 'early' versus 'later' (< 1 year vs > 1 year post stroke) were not significant. Some studies have unclear risk of bias (downgraded) | |
| Walking speed Continuous measure of walking speed measured over a short distance in m/s | The mean gait speed ranged across control groups from 0.43 m/s to 1.3 m/s | The mean gait speed in the intervention groups was 0.15 m/s faster (0.10 to 0.19) | 744 (8) | ⊕⊕⊕⊝ | Applicable: difference greater than MDC = 0.06 m/s Perera 2006, and 95% CI of difference does not cross MDC Some studies have unclear risk of bias (downgraded) | |
| Balance and mobility Timed up and go test. Standing up, walking, returning to sit down in seconds | The mean speed ranged across control groups from 15 s to 28.6 s. | The mean speed in the intervention group was 3.62 s faster (‐6.06 to ‐1.16) | 488 (5) | ⊕⊕⊝⊝ low | Applicable: somewhat as difference is not greater than MDC (8 s or 28%) (downgraded). Some studies have unclear risk of bias (downgraded) | |
| Independence in mobility Functional ambulation classification. Indicates need for assistance/not to safely mobilise | The number of independent participants ranged across the control groups from 2 to 92 | The odds ratio of independent classifications in favour of the intervention group was 1.91 (1.01 to 3.6) | 469 (3) | ⊕⊕⊕⊝ | Applicable: better odds of independence in walking is clinically useful. Some studies have unclear risk of bias (downgraded) | |
| Physical ability Stroke Impact Scale. A self report of overall physical ability (subscale of total Impact) | The mean score for the control groups ranged from 55.4 to 83.73 points (higher is better) | The mean score for the intervention groups was 2.91 points higher (0.00 to 5.82) | 437 (2) | ⊕⊕⊝⊝ low | Applicable: only somewhat as the mean change score should be 4.5 points to be regarded as clinically important (downgraded) Only two trials (downgraded) | |
| Adverse events (falls) from all available trials Counts of numbers of falls | High risk population | RD 0.03 (‐0.02 to 0.08) | 815 (8) | ⊕⊝⊝⊝ | Applicable: 8 out of 17 studies reported falls; 4 of these studies reported no falls in either group. Only small number of studies reported that falls occurred (low event rate with low reporting), wide CIs Difference not statistically significant (downgraded) Some studies have unclear risk of bias (downgraded) Heterogeneity I2 > 50%, (downgraded) | |
| 91.4 per 1000 | 134 per 1000 | |||||
| CI: confidence interval; RD: risk difference; MDC: minimal detectable change | ||||||
| GRADE Working Group grades of evidence | ||||||
| Study ID | What (CCT content) | Who | How (timing, number and duration of sessions) | Where |
| Mobility CCT in addition to usual care; functional tasks, strengthening exercises | Physiotherapist | 1‐hour sessions 5 days per week for 4 weeks | Inpatient rehabilitation unit | |
| Multiple task‐specific training strengthening LL; practice locomotor‐related tasks | Physiotherapists | 1‐hour sessions, 3 days per week for 4 weeks | Community setting | |
| Progressive balance and strengthening exercises; walking and stair climbing. Home exercise programme and advice to increase walking | Physiotherapist | 45 to 60 minutes per week for 40 weeks over a one‐year period | Community setting | |
| Task‐specific, part‐ as well as whole‐practice of tasks; emphasis on repetition and feedback | Physiotherapists, assistants, and physiotherapy students | 90‐minute sessions, 5 times per week for 4 weeks | Inpatient rehabilitation | |
| Individual, easily progressed; balance, endurance, strength, flexibility, function and well‐being. Home exercise manuals and encouraged for on‐going exercise | Instructor and physiotherapist with support from volunteers (partners, carers, family members) | 2 sessions per week for 8 weeks. (1 hour exercise plus 1 hour interactive education | Community setting | |
| Individualised physical activity, functional performance; educational group discussions about fall risk and security | Physiotherapist and occupational therapist | 7 sessions per week divided over 3 days for 5 weeks | Community setting | |
| Progressive, focused on mobility and gait training as well as physical fitness | Physiotherapist | 90‐minute sessions, 5 days per week for 4 weeks | Inpatient rehabilitation | |
| Focused on walking, standing, balance, and sit‐to‐stand tasks | Physical therapist, kinesiologist, and recreation therapist | 1‐hour sessions, 3 times per week for 10 weeks | Community setting | |
| Education and exercises for LL function: functional tasks, strength training and balance training | Multidisciplinary team including a physiotherapist, social worker, dietician, clinical nurse consultant, speech pathologist and occupational therapist | 2‐hour sessions (1 hour education + 1 hour exercise) weekly for 7 weeks | Community setting | |
| Functional movement including stretching, functional strengthening, balance, agility and fitness | Physiotherapist and physical activity instructor | 3 x 45‐ to 60‐minute sessions per week for 19 weeks | Community setting | |
| Task‐oriented gait or standing balance activity, strengthening LL | Physiotherapist and 2 physiotherapy students | 50‐ to 60‐minute sessions, 3 times a week for 4 weeks | Community setting | |
| Postural control and gait‐related activities: stair climbing, walking and turning | Therapists | 45‐minute sessions, 3 times per week for 4 weeks | Inpatient and outpatient settings | |
| Fitness and mobility exercise: cardiorespiratory fitness, mobility, leg muscle strength, balance, and hip bone mineral density | Physical therapist, occupational therapist, and exercise instructor | 1‐hour sessions, 3 times per week for 19 weeks | Community setting | |
| Functional training tasks | Physiotherapists | 30‐minute sessions, 3 times per week for 4 weeks | Inpatient rehabilitation | |
| Brisk level and inclined overground walking, upright and recumbent cycle ergometry, functional movements | 3 instructors | 60‐minute classes, 3 times per week for 6 months | Community setting | |
| Meaningful tasks related to walking competency | Physiotherapist and sports therapists | 90‐minute sessions, 2 times per week for 12 weeks | Community setting | |
| Meaningful tasks related to walking competency: balance control, stair walking, turning, transfers, and speed walking | Physiotherapist or occupational therapist 1 caretaker to ensure safety | 40‐minute sessions, 7 days per week for 2 weeks | Inpatient and outpatient settings | |
| CCT: circuit class therapy | ||||
| Outcome or subgroup title | No. of studies | No. of participants | Statistical method | Effect size |
| 1 6mWT early and late Show forest plot | 10 | 835 | Mean Difference (IV, Fixed, 95% CI) | 60.86 [44.55, 77.17] |
| 1.1 Early | 4 | 487 | Mean Difference (IV, Fixed, 95% CI) | 46.56 [21.35, 71.77] |
| 1.2 Late | 6 | 348 | Mean Difference (IV, Fixed, 95% CI) | 71.15 [49.76, 92.54] |
| 2 Gait speed early and late Show forest plot | 8 | 744 | Mean Difference (IV, Fixed, 95% CI) | 0.15 [0.10, 0.19] |
| 2.1 Early | 2 | 437 | Mean Difference (IV, Fixed, 95% CI) | 0.17 [0.10, 0.25] |
| 2.2 Late | 6 | 307 | Mean Difference (IV, Fixed, 95% CI) | 0.13 [0.07, 0.19] |
| 3 Cadence Show forest plot | 2 | 50 | Mean Difference (IV, Random, 95% CI) | 13.57 [7.52, 19.62] |
| 4 Timed Up and Go Show forest plot | 5 | 488 | Mean Difference (IV, Fixed, 95% CI) | ‐3.62 [‐6.09, ‐1.16] |
| 5 Rivermead Mobility Index Show forest plot | 2 | 296 | Mean Difference (IV, Fixed, 95% CI) | 0.56 [0.17, 0.95] |
| 6 Functional Ambulation Classification Show forest plot | 3 | 469 | Odds Ratio (M‐H, Random, 95% CI) | 1.91 [1.01, 3.60] |
| 7 Berg Balance Scale Show forest plot | 4 | 171 | Mean Difference (IV, Random, 95% CI) | 1.21 [‐0.62, 3.04] |
| 8 Step Test Show forest plot | 3 | 190 | Mean Difference (IV, Fixed, 95% CI) | 0.98 [‐0.40, 2.37] |
| 9 Activities‐specific Balance Confidence Scale Show forest plot | 2 | 103 | Mean Difference (IV, Fixed, 95% CI) | 7.76 [0.66, 14.87] |
| 10 Stroke Impact Scale (physical) Show forest plot | 2 | 437 | Mean Difference (IV, Random, 95% CI) | 2.91 [0.00, 5.82] |
| 11 VO2 peak Show forest plot | 2 | 103 | Mean Difference (IV, Fixed, 95% CI) | 2.81 [0.90, 4.72] |
| 12 Steps per day Show forest plot | 2 | 206 | Mean Difference (IV, Fixed, 95% CI) | 1325.66 [411.09, 2240.22] |
| 13 Length of stay Show forest plot | 2 | 217 | Mean Difference (IV, Random, 95% CI) | ‐16.35 [‐37.69, 4.99] |
| 14 Sensitivity: 6mWT Show forest plot | 3 | 393 | Mean Difference (IV, Fixed, 95% CI) | 46.32 [17.40, 75.24] |
| Outcome or subgroup title | No. of studies | No. of participants | Statistical method | Effect size |
| 1 Timed Up and Go Show forest plot | 2 | 269 | Mean Difference (IV, Fixed, 95% CI) | 0.90 [‐0.94, 2.75] |
| 2 Carer Strain Index Show forest plot | 2 | 174 | Mean Difference (IV, Fixed, 95% CI) | 1.06 [0.39, 1.73] |
| Outcome or subgroup title | No. of studies | No. of participants | Statistical method | Effect size |
| 1 Adverse events (falls) Show forest plot | 8 | 815 | Risk Difference (M‐H, Random, 95% CI) | 0.03 [‐0.02, 0.08] |