Deferasirox para el tratamiento de la sobrecarga transfusional de hierro en pacientes con drepanocitosis
Información
- DOI:
- https://doi.org/10.1002/14651858.CD007477.pub3Copiar DOI

- Base de datos:
-
- Cochrane Database of Systematic Reviews
- Versión publicada:
-
- 04 junio 2014see what's new
- Tipo:
-
- Intervention
- Etapa:
-
- Review
- Grupo Editorial Cochrane:
-
Grupo Cochrane de Fibrosis quística y enfermedades genéticas
- Copyright:
-
- Copyright © 2017 The Cochrane Collaboration. Published by John Wiley & Sons, Ltd.
Cifras del artículo
Altmetric:
Citado por:
Autores
Contributions of authors
Joerg Meerpohl: Conception, design and coordination of the review. Data collection and data management as well as analysis and interpretation of the data. Writing of the review and approval of the final version.
Lisa Schell: Data collection and data management. Involvement in writing the review. Verification of data entries for discrepancies.
Gerta Ruecker: Statistical advice and methodological support. General advice on the review and approval of the final version.
Edith Motschall: Advice on the initial search strategy and literature searches for the current version of this review .
Nigel Fleeman: Co‐author of the HTA report by McLeod (McLeod 2009). General advice on the review and approval of the final version.
Charlotte Niemeyer: Interpretation of the data, clinical expertise, providing general advice on the review and approval of the final version.
Dirk Bassler: Data collection and data management. Analysis and interpretation of data. Involvement in writing the review and approval of the final version.
Declarations of interest
Joerg Meerpohl enrolled two adolescents with thalassaemia and one with Diamond‐Blackfan anaemia in a post marketing surveillance study on deferasirox and participated once in a Novartis advisory board meeting on paediatric iron overload. None declared for other authors.
Acknowledgements
We thank the peer reviewers for their valuable comments which helped us to improve protocol and review. We would also like to thank the editorial team, namely Tracey Remnington and Nikki Jahnke, for their great support in preparing the protocol and this review. Christina Reese helped with the literature search and retrieval of full articles for the first version of this review. Claire McLeod gave valuable input at the protocol stage.
Version history
| Published | Title | Stage | Authors | Version |
| 2014 Jun 04 | Deferasirox for managing transfusional iron overload in people with sickle cell disease | Review | Joerg J Meerpohl, Lisa K Schell, Gerta Rücker, Edith Motschall, Nigel Fleeman, Charlotte M Niemeyer, Dirk Bassler | |
| 2010 Aug 04 | Deferasirox for managing transfusional iron overload in people with sickle cell disease | Review | Joerg J Meerpohl, Gerd Antes, Gerta Rücker, Nigel Fleeman, Charlotte M Niemeyer, Dirk Bassler | |
| 2008 Oct 08 | Deferasirox for managing transfusional iron overload in people with sickle cell disease | Protocol | Joerg J Meerpohl, Gerd Antes, Gerta Rücker, Claire McLeod, Nigel Fleeman, Charlotte Niemeyer, Dirk Bassler | |
Keywords
MeSH
Medical Subject Headings (MeSH) Keywords
- Anemia, Sickle Cell [blood, *therapy];
- Benzoates [adverse effects, *therapeutic use];
- Chelation Therapy [adverse effects, *methods];
- Deferasirox;
- Deferoxamine [adverse effects, therapeutic use];
- Erythrocyte Transfusion [adverse effects];
- Ferritins [blood];
- Iron Chelating Agents [adverse effects, *therapeutic use];
- Iron Overload [*drug therapy, etiology];
- Randomized Controlled Trials as Topic;
- Triazoles [adverse effects, *therapeutic use];
Medical Subject Headings Check Words
Humans;
PICO
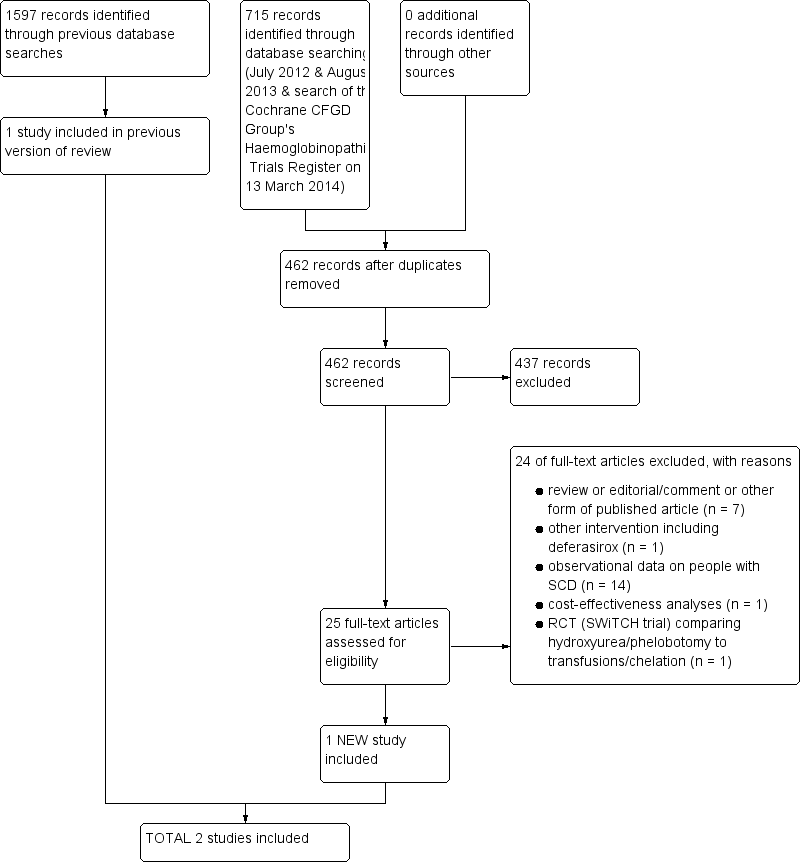
Study flow diagram combining first search & update searches (most recent search of databases: August 2013; most recent search of the Cochrane CFGD Group's Trials Register: 13 March 2014)

Risk of bias graph: review authors' judgements about each risk of bias item presented as percentages across all included studies.

Risk of bias summary: review authors' judgements about each risk of bias item for each included study.

Comparison 1 Deferasirox versus deferoxamine, Outcome 1 Mortality.
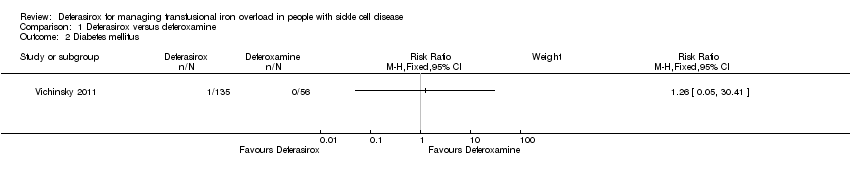
Comparison 1 Deferasirox versus deferoxamine, Outcome 2 Diabetes mellitus.

Comparison 1 Deferasirox versus deferoxamine, Outcome 3 Elevated ALT levels (> 5 UNL) on two consecutive visits.

Comparison 1 Deferasirox versus deferoxamine, Outcome 4 Abnormal liver function tests.

Comparison 1 Deferasirox versus deferoxamine, Outcome 5 Serum ferritin (µg/l).
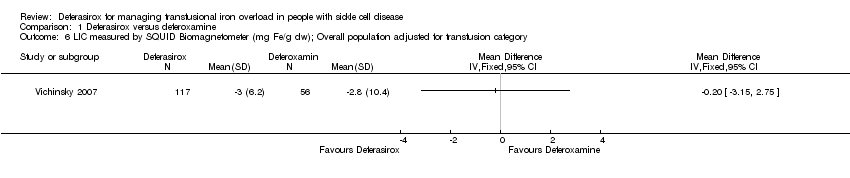
Comparison 1 Deferasirox versus deferoxamine, Outcome 6 LIC measured by SQUID Biomagnetometer (mg Fe/g dw); Overall population adjusted for transfusion category.

Comparison 1 Deferasirox versus deferoxamine, Outcome 7 LIC measured by SQUID Biomagnetometer (mg Fe/g dw); Per transfusion category subgroup.
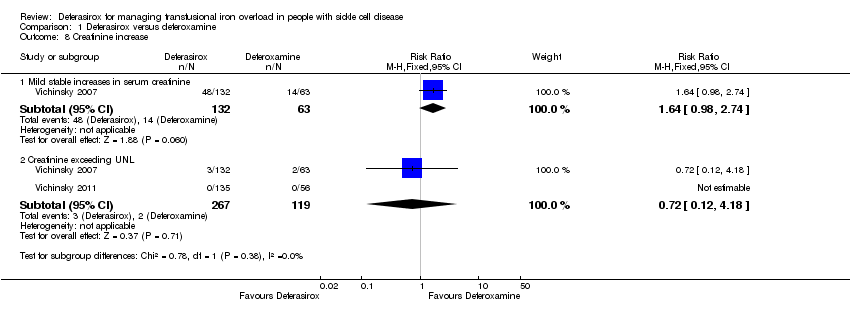
Comparison 1 Deferasirox versus deferoxamine, Outcome 8 Creatinine increase.
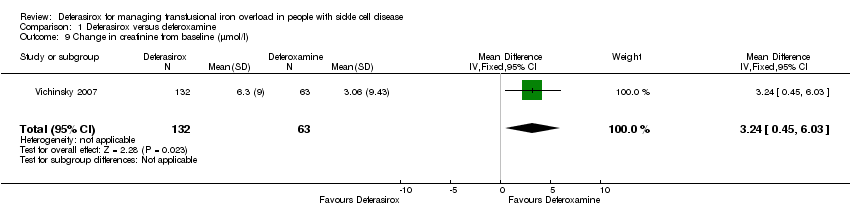
Comparison 1 Deferasirox versus deferoxamine, Outcome 9 Change in creatinine from baseline (µmol/l).

Comparison 1 Deferasirox versus deferoxamine, Outcome 10 Other adverse events (fixed‐effect model).
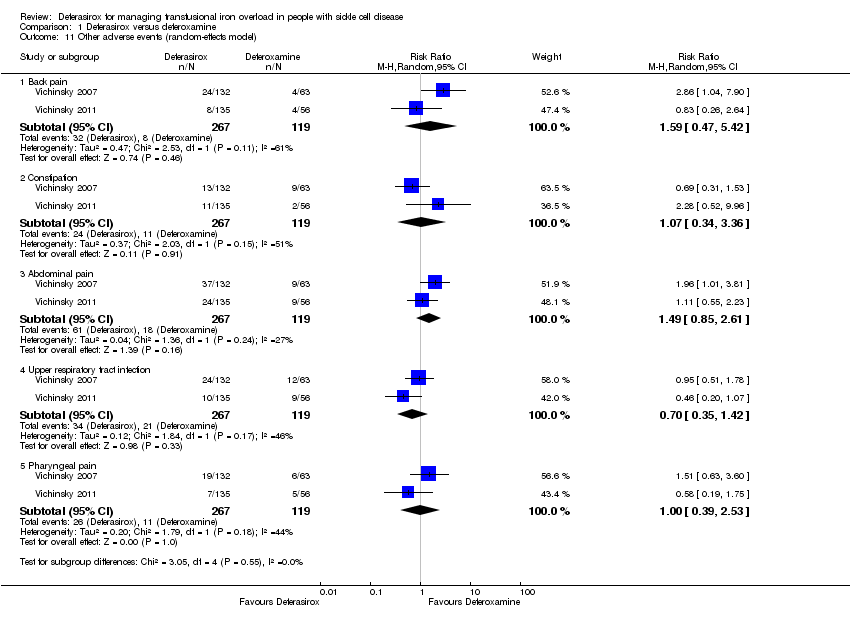
Comparison 1 Deferasirox versus deferoxamine, Outcome 11 Other adverse events (random‐effects model).

Comparison 1 Deferasirox versus deferoxamine, Outcome 12 Growth velocity (cm/year).

Comparison 1 Deferasirox versus deferoxamine, Outcome 13 Satisfaction.
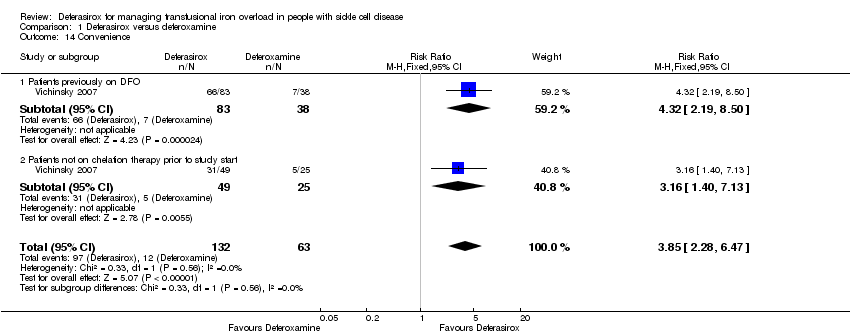
Comparison 1 Deferasirox versus deferoxamine, Outcome 14 Convenience.
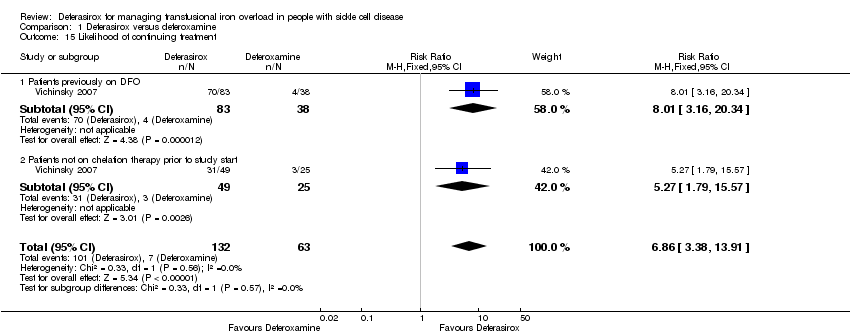
Comparison 1 Deferasirox versus deferoxamine, Outcome 15 Likelihood of continuing treatment.

Comparison 1 Deferasirox versus deferoxamine, Outcome 16 Discontinuations.
| Deferasirox versus deferoxamine for managing transfusional iron overload in people with sickle cell disease | ||||||
| Patient or population: patients with sickle cell disease and transfusional iron overload Comparison: deferoxamine | ||||||
| Outcomes | Illustrative comparative risks* (95% CI) | Relative effect | No of Participants | Quality of the evidence | Comments | |
| Assumed risk | Corresponding risk | |||||
| Deferoxamine | Deferasirox | |||||
| Mortality | not estimable (event rate in study 0/56) | not estimable (event rate in study 1/135) | RR 1.26 | 191 | ⊕⊝⊝⊝ | |
| End‐organ damage (incidence of diabetes) | not estimable (event rate in study 0/56) | not estimable (event rate in study 1/135) | RR 1.26 | 191 | ⊕⊝⊝⊝ | |
| LIC measured by SQUID biomagnetometer (mg Fe/g dw); overall population adjusted for transfusion category | The mean LIC measured by SQUID biomagnetometer (mg Fe/g dw) in the intervention group was 0.2 lower (3.15 lower to 2.75 higher) | 173 | ⊕⊕⊕⊝ | |||
| Serum ferritin (µg/l) | The mean serum ferritin (µg/l) in the intervention groups was | 283 | ⊕⊕⊕⊝ | |||
| AE: Change in creatinine from baseline (µmol/l) | The mean creatinine change from baseline in the intervention group was 3.24 higher (0.45 to 6.03 higher) | 195 | ⊕⊕⊕⊝ | |||
| Discontinuations | 168 per 1000 | 89 per 1000 | RR 0.53 | 398 | ⊕⊕⊝⊝ | |
| Satisfaction | 238 per 1000 | 745 per 1000 | RR 3.13 | 195 | ⊕⊕⊕⊝ | |
| *The basis for the assumed risk (e.g. the median control group risk across studies) is provided in footnotes. The corresponding risk (and its 95% confidence interval) is based on the assumed risk in the comparison group and the relative effect of the intervention (and its 95% CI). AE: adverse events; CI: confidence interval; dw: dry weight; Fe: iron; LIC: liver iron concentration; RR: risk ratio; SQUID: superconducting quantum interference device | ||||||
| GRADE Working Group grades of evidence | ||||||
| 1 No ITT analysis with regard to efficacy. Unclear risk of other bias due to involvement of sponsor and possibility of selective reporting. See also risk of bias table. | ||||||
| Deferasirox (n = 132) | Deferoxamine (n = 63) | All patients (n = 195) | |
| Age, years | |||
| Median | 15 | 16 | 15 |
| Range | 3 ‐ 54 | 3 ‐ 51 | 3 ‐ 54 |
| Age group, # of patients (%) | |||
| < 6 years | 4 (3.0) | 3 (4.8) | 7 (3.6) |
| 6 to < 12 years | 30 (22.7) | 15 (23.8) | 45 (23.1) |
| 12 to < 16 years | 33 (25.0) | 13 (20.6) | 46 (23.6) |
| 16 to < 50 years | 63 (47.7) | 31 (49.2) | 94 (48.2) |
| 50 to < 65 years | 2 (1.5) | 1 (1.6) | 3 (1.5) |
| Sex, # of patients (%) | |||
| Female | 80 (60.6) | 35 (55.6) | 115 (59.0) |
| Male | 52 (39.4) | 28 (44.4) | 80 (41.0) |
| Race, # of patients (%) | |||
| Caucasian | 8 (6.1) | 3 (4.8) | 11 (5.6) |
| Black | 118 (89.4) | 59 (93.7) | 177 (90.8) |
| Others | 6 (4.5) | 1 (1.6) | 7 (3.6) |
| Ferritin, μg/l | |||
| Median | 3'460 | 2'834 | 3'298 |
| Range | 1'082 ‐ 12'901 | 1'015 ‐ 15'578 | 1'015 ‐ 15'578 |
| Baseline ALT, # of patients (%) | |||
| ≤ 2.5 ULN | 110 (83.3) | 58 (92.1) | 168 (86.2) |
| > 2.5 ULN | 21 (15.9) | 5 (7.9) | 26 (13.3) |
| Missing | 1 (0.8) | ‐ | 1 (0.5) |
| History of HAV and/or HBV, # of patients (%) | |||
| Present | 10 (7.6) | 4 (6.3) | 14 (7.2) |
| Absent | 122 (92.4) | 59 (93.7) | 181 (92.8) |
| Prior chelation therapy, # of patients (%) | |||
| Deferoxamine or deferiprone | 83 (62.9) | 38 (60.3) | 121 (62.1) |
| No prior chelation therapy | 49 (37.1) | 25 (39.7) | 74 (37.9) |
| Blood transfusions during study (units of packed RBCs) | |||
| Median | 12 | 12 | 12 |
| Range | 0 ‐ 24 | 1 ‐ 22 | 0 ‐ 24 |
| ALT: alanine aminotransferase HAV: hepatitis A virus HBV: hepatitis B virus RBCs: red blood cells ULN: upper limit of normal | |||
| Baseline LIC (mg Fe / g dw) | ||||
| Baseline LIC group | ≤ 3 | > 3 ‐ ≤ 7 | > 7 ‐ ≤ 14 | > 14 |
| Deferasirox (n = 132) | (n = 4) | (n = 64) | (n = 46) | (n = 18) |
| Protocol assigned dose | 5 mg/kg | 10 mg/kg | 20 mg/kg | 30 mg/kg |
| Reported mean LIC ± SD | 2.5 ± 0.4 | 7.9 ± 5.5 | 9.8 ± 1.9 | 17.5 ± 3.0 |
| Adjusted mean LIC ± SD | 5.0 ± 0.8 | 15.8 ± 11.0 | 19.6 ± 3.8 | 35.0 ± 6.0 |
| Deferasirox dose (mg/kg) | 9.5 ± 3.2 | 13.0 ± 3.1 | 19.7 ± 2.1 | 28.0 ± 2.8 |
| Min ‐ Max deferasirox dose | 5.0 ‐ 12.3 | 8.4 ‐ 23.9 | 10.0 ‐ 24.5 | 22.8 ‐ 30.0 |
| Deferoxamine (n = 63) | (n = 6) | (n = 21) | (n = 20) | (n = 16) |
| Protocol assigned dose | 20 ‐ 30 mg/kg | 25 ‐ 35 mg/kg | 35 ‐ 50 mg/kg | ≥ 50 mg/kg |
| Reported mean LIC ± SD | 3.9 ± 3.5 | 5.2 ± 2.1 | 8.6 ± 3.0 | 14.3 ± 5.4 |
| Adjusted mean LIC ± SD | 7.8 ± 7.0 | 10.4 ± 4.2 | 17.2 ± 6.0 | 28.6 ± 10.8 |
| Deferoxamine dose (mg/kg) | 22.9 ± 3.9 | 28.7 ± 3.2 | 36.6 ± 9.5 | 50.0 ± 7.3 |
| Min ‐ Max deferoxamine dose | 20.0 ‐ 29.5 | 21.6 ‐ 34.4 | 7.0 ‐ 52.6 | 32.4 ‐ 62.0 |
| Deferasirox / Deferoxamine dose ratio | 1 : 2.4 | 1 : 2.2 | 1 : 1.85 | 1 : 1.8 |
| dw: dry weight | ||||
| Deferasirox (n = 135) | Deferoxamine (n = 68) | All Patients (n = 203) | |
| Age, years | |||
| Mean ± Standard deviation | 16.4 ± 10.31 | 16.2 ± 10.15 | 16.3 ± 10.23 |
| Age group, # patients (%) | |||
| 2 to < 6 years | 6 (4.4) | 4 (5.9) | 10 (4.9) |
| 6 to < 12 years | 42 (31.1) | 21 (30.9) | 63 (31.0) |
| 12 to < 16 years | 35 (25.9) | 18 (26.5) | 53 (26.1) |
| 16 to < 50 years | 50 (37.0) | 24 (35.3) | 74 (36.5) |
| 50 to < 65 years | 2 (1.5) | 1 (1.5) | 3 (1.5) |
| = 65 years | 0 | 0 | 0 |
| Gender, # patients (%) | |||
| Female | 56 (41.5) | 33 (48.5) | 89 (43.8) |
| Male | 79 (58.5) | 35 (51.5) | 114 (56.2) |
| Race, # patients (5) | |||
| Caucasian | 2 (1.5) | 0 | 2 (1.0) |
| Black | 130 (96.3) | 65 (95.6) | 195 (96.1) |
| Oriental | 0 | 0 | 0 |
| Other | 3 (2.2) | 3 (4.4) | 6 (3.0) |
| Weight group, # patients (%) | |||
| < 15 kg | 0 | 0 | 0 |
| 15 to < 35 kg | 39 (28.9) | 23 (33.8) | 62 (30.5) |
| 35 to < 55 kg | 43 (31.9) | 18 (26.5) | 61 (30.0) |
| 55 to < 75 kg | 42 (31.1) | 22 (32.4) | 64 (31.5) |
| =75 kg | 10 (7.4) | 3 (4.4) | 13 (6.4) |
| Missing | 1 (0.7) | 2 (2.9) | 3 (1.5) |
| History of splenectomy, #patients (%) | |||
| Yes | 22 (16.3) | 10 (14.7) | 32 (15.8) |
| No | 113 (83.7) | 58 (85.3) | 171 (84.2 ) |
| Serum ferritin, ng/mL | |||
| Median | 3406 | 3300 | n.a. |
| Range | 920 ‐ 12535 | 1178 ‐ 16535 | n.a. |
| Serum ferritin category, # of patients (%) | |||
| ≤ 1000 ng/mL | 4 (3.0) | 0 | 4 (2.0) |
| > 1000 ‐ ≤ 2500 ng/mL | 34 (25.2) | 28 (41.2) | 62 (30.5) |
| > 2500 ‐ ≤ 4000 ng/mL | 45 (33.3) | 16 (23.5) | 61 (30.0) |
| > 4000 ng/mL | 52 (38.5) | 24 (35.3) | 76 (37.4) |
| Transfusional iron intake, mL RBC/kg/day | |||
| Median | 0.3 | 0.3 | n.a. |
| Range | 0.1 ‐ 2.4 | ‐0.1 ‐ 0.8 | n.a. |
| Dose of iron chelating drug, mean (SD) | |||
| Planned dose (mg/kg/day) | 19.8 (2.0) | 41.1 (4.6) * | n.a. |
| Received dose (mg/kg/day) | 19.6 (2.2) | 34.1 (4.7) * | n.a. |
| * based on dose per day over 5 days/week | |||
| Outcome or subgroup title | No. of studies | No. of participants | Statistical method | Effect size |
| 1 Mortality Show forest plot | 1 | Risk Ratio (M‐H, Fixed, 95% CI) | Subtotals only | |
| 2 Diabetes mellitus Show forest plot | 1 | Risk Ratio (M‐H, Fixed, 95% CI) | Subtotals only | |
| 3 Elevated ALT levels (> 5 UNL) on two consecutive visits Show forest plot | 2 | 386 | Risk Ratio (M‐H, Fixed, 95% CI) | 3.66 [0.47, 28.65] |
| 4 Abnormal liver function tests Show forest plot | 1 | Risk Ratio (M‐H, Fixed, 95% CI) | Totals not selected | |
| 5 Serum ferritin (µg/l) Show forest plot | 2 | 283 | Mean Difference (IV, Fixed, 95% CI) | 440.69 [11.73, 869.64] |
| 6 LIC measured by SQUID Biomagnetometer (mg Fe/g dw); Overall population adjusted for transfusion category Show forest plot | 1 | Mean Difference (IV, Fixed, 95% CI) | Totals not selected | |
| 7 LIC measured by SQUID Biomagnetometer (mg Fe/g dw); Per transfusion category subgroup Show forest plot | 1 | 129 | Mean Difference (IV, Fixed, 95% CI) | ‐1.29 [‐2.85, 0.28] |
| 7.1 receiving simple transfusions | 1 | 97 | Mean Difference (IV, Fixed, 95% CI) | ‐0.20 [‐1.97, 1.57] |
| 7.2 receiving exchange transfusions | 1 | 32 | Mean Difference (IV, Fixed, 95% CI) | ‐5.20 [‐8.56, ‐1.84] |
| 8 Creatinine increase Show forest plot | 2 | Risk Ratio (M‐H, Fixed, 95% CI) | Subtotals only | |
| 8.1 Mild stable increases in serum creatinine | 1 | 195 | Risk Ratio (M‐H, Fixed, 95% CI) | 1.64 [0.98, 2.74] |
| 8.2 Creatinine exceeding UNL | 2 | 386 | Risk Ratio (M‐H, Fixed, 95% CI) | 0.72 [0.12, 4.18] |
| 9 Change in creatinine from baseline (µmol/l) Show forest plot | 1 | 195 | Mean Difference (IV, Fixed, 95% CI) | 3.24 [0.45, 6.03] |
| 10 Other adverse events (fixed‐effect model) Show forest plot | 2 | Risk Ratio (M‐H, Fixed, 95% CI) | Subtotals only | |
| 10.1 Serious adverse events | 2 | 386 | Risk Ratio (M‐H, Fixed, 95% CI) | 0.97 [0.74, 1.27] |
| 10.2 Serious adverse events suspected to be related to study drug | 1 | 191 | Risk Ratio (M‐H, Fixed, 95% CI) | 1.66 [0.19, 14.52] |
| 10.3 Any adverse event | 1 | 191 | Risk Ratio (M‐H, Fixed, 95% CI) | 0.88 [0.79, 0.98] |
| 10.4 Adverse events suspected to be related to study drug | 1 | 191 | Risk Ratio (M‐H, Fixed, 95% CI) | 0.93 [0.57, 1.54] |
| 10.5 Sickle cell anaemia with crisis | 2 | 386 | Risk Ratio (M‐H, Fixed, 95% CI) | 1.20 [0.82, 1.74] |
| 10.6 Headache | 2 | 386 | Risk Ratio (M‐H, Fixed, 95% CI) | 0.80 [0.58, 1.12] |
| 10.7 Abdominal pain | 2 | 386 | Risk Ratio (M‐H, Fixed, 95% CI) | 1.52 [0.95, 2.46] |
| 10.8 Nausea | 2 | 386 | Risk Ratio (M‐H, Fixed, 95% CI) | 2.06 [1.11, 3.80] |
| 10.9 Pyrexia | 2 | 386 | Risk Ratio (M‐H, Fixed, 95% CI) | 1.06 [0.66, 1.70] |
| 10.10 Vomiting | 2 | 386 | Risk Ratio (M‐H, Fixed, 95% CI) | 1.16 [0.71, 1.88] |
| 10.11 Diarrhoea | 2 | 386 | Risk Ratio (M‐H, Fixed, 95% CI) | 3.09 [1.53, 6.26] |
| 10.12 Back pain | 2 | 386 | Risk Ratio (M‐H, Fixed, 95% CI) | 1.82 [0.87, 3.82] |
| 10.13 Upper respiratory tract infection | 2 | 386 | Risk Ratio (M‐H, Fixed, 95% CI) | 0.74 [0.45, 1.21] |
| 10.14 Arthralgia | 2 | 386 | Risk Ratio (M‐H, Fixed, 95% CI) | 1.25 [0.63, 2.48] |
| 10.15 Pain in extremity | 2 | 386 | Risk Ratio (M‐H, Fixed, 95% CI) | 1.20 [0.62, 2.32] |
| 10.16 Pharyngeal pain | 2 | 386 | Risk Ratio (M‐H, Fixed, 95% CI) | 1.08 [0.55, 2.10] |
| 10.17 Cough | 2 | 386 | Risk Ratio (M‐H, Fixed, 95% CI) | 0.64 [0.38, 1.08] |
| 10.18 Nasopharyngitis | 2 | 386 | Risk Ratio (M‐H, Fixed, 95% CI) | 0.64 [0.35, 1.16] |
| 10.19 Nasal congestion | 1 | 191 | Risk Ratio (M‐H, Fixed, 95% CI) | 0.62 [0.18, 2.12] |
| 10.20 Rash | 2 | 386 | Risk Ratio (M‐H, Fixed, 95% CI) | 2.39 [1.03, 5.55] |
| 10.21 Pruritus | 1 | 191 | Risk Ratio (M‐H, Fixed, 95% CI) | 0.58 [0.19, 1.75] |
| 10.22 Constipation | 2 | 386 | Risk Ratio (M‐H, Fixed, 95% CI) | 0.99 [0.50, 1.96] |
| 10.23 Chest pain | 2 | 386 | Risk Ratio (M‐H, Fixed, 95% CI) | 0.66 [0.34, 1.29] |
| 10.24 Viral infection | 1 | 195 | Risk Ratio (M‐H, Fixed, 95% CI) | 0.41 [0.14, 1.17] |
| 10.25 Urinary tract infection | 1 | 191 | Risk Ratio (M‐H, Fixed, 95% CI) | 7.96 [0.47, 134.53] |
| 10.26 Insomnia | 1 | 191 | Risk Ratio (M‐H, Fixed, 95% CI) | 0.41 [0.09, 1.99] |
| 10.27 Dizziness | 1 | 191 | Risk Ratio (M‐H, Fixed, 95% CI) | 0.28 [0.05, 1.61] |
| 10.28 Injection site pain | 1 | 191 | Risk Ratio (M‐H, Fixed, 95% CI) | 0.06 [0.00, 1.14] |
| 10.29 Cardio‐respiratory arrest | 1 | 191 | Risk Ratio (M‐H, Fixed, 95% CI) | 1.26 [0.05, 30.41] |
| 11 Other adverse events (random‐effects model) Show forest plot | 2 | Risk Ratio (M‐H, Random, 95% CI) | Subtotals only | |
| 11.1 Back pain | 2 | 386 | Risk Ratio (M‐H, Random, 95% CI) | 1.59 [0.47, 5.42] |
| 11.2 Constipation | 2 | 386 | Risk Ratio (M‐H, Random, 95% CI) | 1.07 [0.34, 3.36] |
| 11.3 Abdominal pain | 2 | 386 | Risk Ratio (M‐H, Random, 95% CI) | 1.49 [0.85, 2.61] |
| 11.4 Upper respiratory tract infection | 2 | 386 | Risk Ratio (M‐H, Random, 95% CI) | 0.70 [0.35, 1.42] |
| 11.5 Pharyngeal pain | 2 | 386 | Risk Ratio (M‐H, Random, 95% CI) | 1.00 [0.39, 2.53] |
| 12 Growth velocity (cm/year) Show forest plot | 1 | Mean Difference (IV, Fixed, 95% CI) | Totals not selected | |
| 12.1 < 6 years | 1 | Mean Difference (IV, Fixed, 95% CI) | 0.0 [0.0, 0.0] | |
| 12.2 6 to < 12 years | 1 | Mean Difference (IV, Fixed, 95% CI) | 0.0 [0.0, 0.0] | |
| 12.3 12 ‐ 16 years | 1 | Mean Difference (IV, Fixed, 95% CI) | 0.0 [0.0, 0.0] | |
| 13 Satisfaction Show forest plot | 1 | 195 | Risk Ratio (M‐H, Fixed, 95% CI) | 3.13 [1.99, 4.93] |
| 13.1 Patients previously on DFO | 1 | 121 | Risk Ratio (M‐H, Fixed, 95% CI) | 3.56 [2.00, 6.35] |
| 13.2 Patients not on chelation therapy prior to study start | 1 | 74 | Risk Ratio (M‐H, Fixed, 95% CI) | 2.47 [1.18, 5.14] |
| 14 Convenience Show forest plot | 1 | 195 | Risk Ratio (M‐H, Fixed, 95% CI) | 3.85 [2.28, 6.47] |
| 14.1 Patients previously on DFO | 1 | 121 | Risk Ratio (M‐H, Fixed, 95% CI) | 4.32 [2.19, 8.50] |
| 14.2 Patients not on chelation therapy prior to study start | 1 | 74 | Risk Ratio (M‐H, Fixed, 95% CI) | 3.16 [1.40, 7.13] |
| 15 Likelihood of continuing treatment Show forest plot | 1 | 195 | Risk Ratio (M‐H, Fixed, 95% CI) | 6.86 [3.38, 13.91] |
| 15.1 Patients previously on DFO | 1 | 121 | Risk Ratio (M‐H, Fixed, 95% CI) | 8.01 [3.16, 20.34] |
| 15.2 Patients not on chelation therapy prior to study start | 1 | 74 | Risk Ratio (M‐H, Fixed, 95% CI) | 5.27 [1.79, 15.57] |
| 16 Discontinuations Show forest plot | 2 | Risk Ratio (M‐H, Fixed, 95% CI) | Subtotals only | |
| 16.1 Discontinuations due to AEs | 2 | 398 | Risk Ratio (M‐H, Fixed, 95% CI) | 1.03 [0.29, 3.63] |
| 16.2 Overall Discontinuations | 2 | 398 | Risk Ratio (M‐H, Fixed, 95% CI) | 0.53 [0.31, 0.92] |