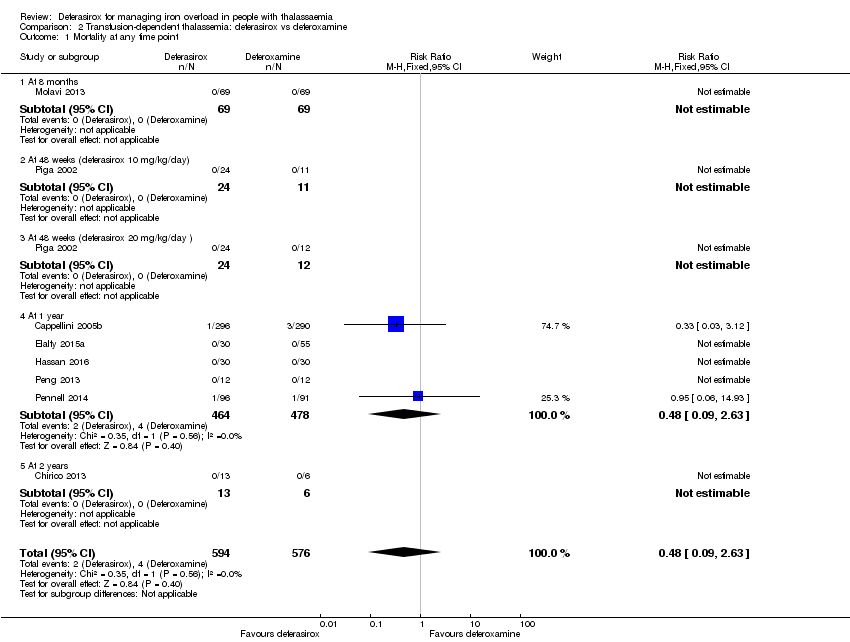
| 1 Mortality at any time point Show forest plot | 8 | 1170 | Risk Ratio (M‐H, Fixed, 95% CI) | 0.48 [0.09, 2.63] |
|
| 1.1 At 8 months | 1 | 138 | Risk Ratio (M‐H, Fixed, 95% CI) | 0.0 [0.0, 0.0] |
| 1.2 At 48 weeks (deferasirox 10 mg/kg/day) | 1 | 35 | Risk Ratio (M‐H, Fixed, 95% CI) | 0.0 [0.0, 0.0] |
| 1.3 At 48 weeks (deferasirox 20 mg/kg/day ) | 1 | 36 | Risk Ratio (M‐H, Fixed, 95% CI) | 0.0 [0.0, 0.0] |
| 1.4 At 1 year | 5 | 942 | Risk Ratio (M‐H, Fixed, 95% CI) | 0.48 [0.09, 2.63] |
| 1.5 At 2 years | 1 | 19 | Risk Ratio (M‐H, Fixed, 95% CI) | 0.0 [0.0, 0.0] |
| 2 LVEF (%): least squares mean change from baseline Show forest plot | 1 | | Mean Difference (IV, Fixed, 95% CI) | Totals not selected |
|
| 3 LVEF (# participants affected) Show forest plot | 1 | | Risk Ratio (M‐H, Fixed, 95% CI) | Totals not selected |
|
| 3.1 Improvement from abnormal LVEF to normal range | 1 | | Risk Ratio (M‐H, Fixed, 95% CI) | 0.0 [0.0, 0.0] |
| 3.2 Decrease from normal LVEF to below LLN | 1 | | Risk Ratio (M‐H, Fixed, 95% CI) | 0.0 [0.0, 0.0] |
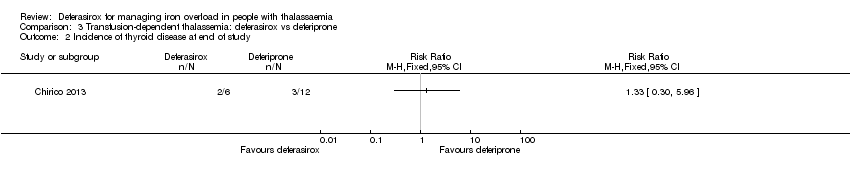
| 4 Incidence of thyroid disease at end of study Show forest plot | 1 | | Risk Ratio (M‐H, Fixed, 95% CI) | Totals not selected |
|
| 5 ALT (# participants affected): improvement from abnormal to normal range Show forest plot | 1 | | Risk Ratio (M‐H, Fixed, 95% CI) | Totals not selected |
|
| 6 ALT (U/L) at end of study Show forest plot | 1 | | Mean Difference (IV, Fixed, 95% CI) | Totals not selected |
|
| 7 AST (U/L) at end of study Show forest plot | 1 | | Mean Difference (IV, Fixed, 95% CI) | Totals not selected |
|
| 8 Serum creatinine (mg/dL) at end of study Show forest plot | 1 | | Mean Difference (IV, Fixed, 95% CI) | Totals not selected |
|
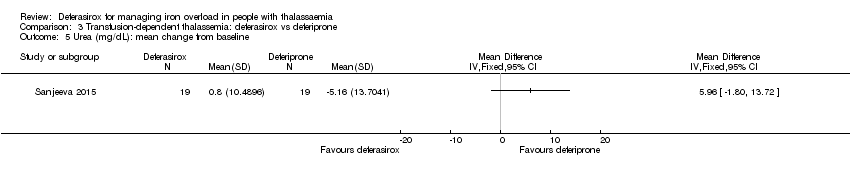
| 9 Blood urea (mg/dL): mean at end of study Show forest plot | 1 | | Mean Difference (IV, Fixed, 95% CI) | Totals not selected |
|
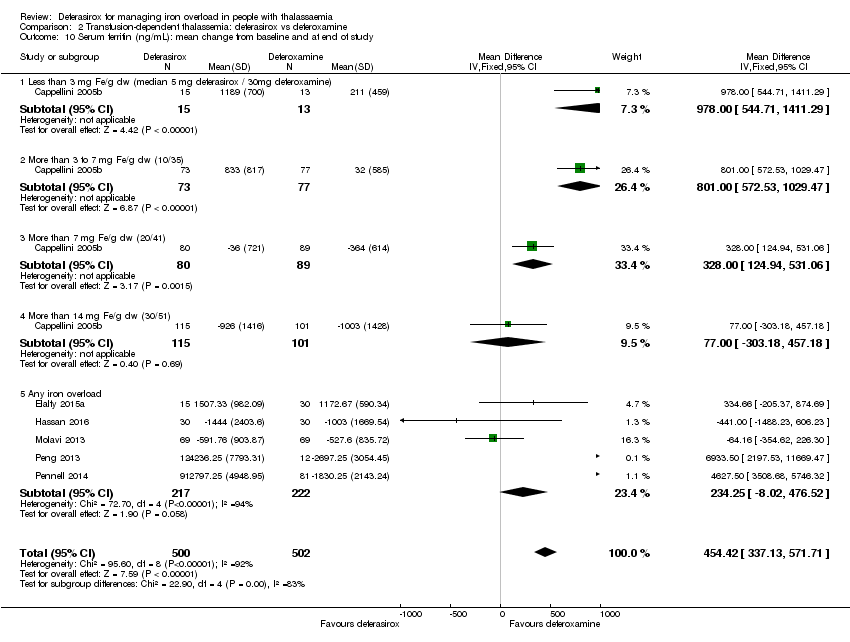
| 10 Serum ferritin (ng/mL): mean change from baseline and at end of study Show forest plot | 6 | 1002 | Mean Difference (IV, Fixed, 95% CI) | 454.42 [337.13, 571.71] |
|
| 10.1 Less than 3 mg Fe/g dw (median 5 mg deferasirox / 30mg deferoxamine) | 1 | 28 | Mean Difference (IV, Fixed, 95% CI) | 978.0 [544.71, 1411.29] |
| 10.2 More than 3 to 7 mg Fe/g dw (10/35) | 1 | 150 | Mean Difference (IV, Fixed, 95% CI) | 801.0 [572.53, 1029.47] |
| 10.3 More than 7 mg Fe/g dw (20/41) | 1 | 169 | Mean Difference (IV, Fixed, 95% CI) | 328.0 [124.94, 531.06] |
| 10.4 More than 14 mg Fe/g dw (30/51) | 1 | 216 | Mean Difference (IV, Fixed, 95% CI) | 77.0 [‐303.18, 457.18] |
| 10.5 Any iron overload | 5 | 439 | Mean Difference (IV, Fixed, 95% CI) | 234.25 [‐8.02, 476.52] |
| 11 Sensitivity analysis: serum ferritin (ng/mL): mean change from baseline Show forest plot | 2 | 701 | Mean Difference (IV, Fixed, 95% CI) | 418.94 [297.23, 540.65] |
|
| 11.1 Less than 3 mg Fe/g dw (median 5 mg deferasirox / 30 mg deferoxamine) | 1 | 28 | Mean Difference (IV, Fixed, 95% CI) | 978.0 [544.71, 1411.29] |
| 11.2 More than 3 to 7 mg Fe/g dw (10/35) | 1 | 150 | Mean Difference (IV, Fixed, 95% CI) | 801.0 [572.53, 1029.47] |
| 11.3 More than 7 mg Fe/g dw (20/41) | 1 | 169 | Mean Difference (IV, Fixed, 95% CI) | 328.0 [124.94, 531.06] |
| 11.4 More than 14 mg Fe/g dw (30/51) | 1 | 216 | Mean Difference (IV, Fixed, 95% CI) | 77.0 [‐303.18, 457.18] |
| 11.5 Any iron overload | 1 | 138 | Mean Difference (IV, Fixed, 95% CI) | ‐64.16 [‐354.62, 226.30] |
| 12 Liver R2* (Hz): mean change from baseline Show forest plot | 1 | | Mean Difference (IV, Fixed, 95% CI) | Totals not selected |
|
| 13 LIC (mg/g) evaluated by MRI (R2/R2*): mean change from baseline Show forest plot | 2 | 217 | Mean Difference (IV, Fixed, 95% CI) | 0.36 [‐1.01, 1.72] |
|
| 14 LIC (mg Fe/g dw) evaluated by biopsy or SQUID: mean change from baseline Show forest plot | 1 | 541 | Mean Difference (IV, Fixed, 95% CI) | 2.37 [1.68, 3.07] |
|
| 14.1 LIC 3 mg Fe/g dw or less (5/30) | 1 | 28 | Mean Difference (IV, Fixed, 95% CI) | 4.3 [2.30, 6.30] |
| 14.2 LIC more than 3 mg to 7 mg (10/35) Fe/g dw | 1 | 143 | Mean Difference (IV, Fixed, 95% CI) | 3.80 [2.74, 4.86] |
| 14.3 LIC more than 7 mg to 14 mg Fe/g dw (20/41) | 1 | 164 | Mean Difference (IV, Fixed, 95% CI) | 1.5 [0.28, 2.72] |
| 14.4 LIC more than 14 mg Fe/g dw (30/51) | 1 | 206 | Mean Difference (IV, Fixed, 95% CI) | ‐2.5 [‐4.55, ‐0.45] |
| 15 Responder analysis I (responder: fall in LIC > 10%) Show forest plot | 1 | | Risk Ratio (M‐H, Fixed, 95% CI) | Totals not selected |
|
| 15.1 Response at 48 weeks (deferasirox 10 mg/kg/day) | 1 | | Risk Ratio (M‐H, Fixed, 95% CI) | 0.0 [0.0, 0.0] |
| 15.2 Response at 48 weeks (deferasirox 20 mg/kg/day) | 1 | | Risk Ratio (M‐H, Fixed, 95% CI) | 0.0 [0.0, 0.0] |
| 16 Responder analysis II (responder: LIC 1 to < 7 mg Fe/g dw) Show forest plot | 1 | 553 | Risk Ratio (M‐H, Fixed, 95% CI) | 0.80 [0.69, 0.92] |
|
| 16.1 Response at 1 year (LIC below 7 mg Fe/g dw) | 1 | 172 | Risk Ratio (M‐H, Fixed, 95% CI) | 0.48 [0.37, 0.64] |
| 16.2 Response at 1 year (LIC at least 7 mg Fe/g dw) | 1 | 381 | Risk Ratio (M‐H, Fixed, 95% CI) | 0.99 [0.84, 1.18] |
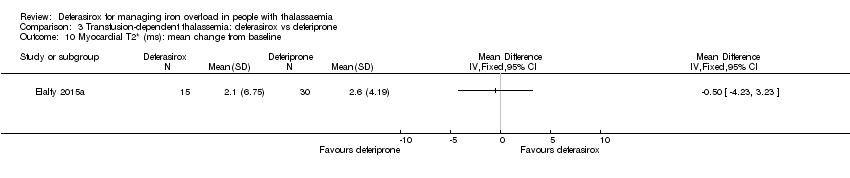
| 17 Myocardial T2* (ms): mean change from baseline Show forest plot | 1 | | Mean Difference (IV, Fixed, 95% CI) | Totals not selected |
|
| 18 Myocardial iron concentration derived from T2* value (mg Fe/g dw): change from baseline Show forest plot | 1 | | Mean Difference (IV, Fixed, 95% CI) | Totals not selected |
|
| 18.1 All participants | 1 | | Mean Difference (IV, Fixed, 95% CI) | 0.0 [0.0, 0.0] |
| 18.2 Participants with T2* <10 ms | 1 | | Mean Difference (IV, Fixed, 95% CI) | 0.0 [0.0, 0.0] |
| 18.3 Participants with T2* ≥10 ms | 1 | | Mean Difference (IV, Fixed, 95% CI) | 0.0 [0.0, 0.0] |
| 19 Myocardial T2* (# participants affected) Show forest plot | 1 | | Risk Ratio (M‐H, Fixed, 95% CI) | Totals not selected |
|
| 19.1 Normalization | 1 | | Risk Ratio (M‐H, Fixed, 95% CI) | 0.0 [0.0, 0.0] |
| 19.2 Improvement (from 6 ‐ < 10 ms to 10 ‐ ≤ 20 ms) | 1 | | Risk Ratio (M‐H, Fixed, 95% CI) | 0.0 [0.0, 0.0] |
| 19.3 Worsening (from 10‐ ≤ 20 ms to 6 ‐ < 10 ms) | 1 | | Risk Ratio (M‐H, Fixed, 95% CI) | 0.0 [0.0, 0.0] |
| 20 Iron excretion‐intake ratio Show forest plot | 1 | 541 | Mean Difference (IV, Fixed, 95% CI) | ‐0.18 [‐0.24, ‐0.12] |
|
| 20.1 Less than 3 mg Fe/g dw (median 5 mg deferasirox / 30 mg deferoxamine) | 1 | 28 | Mean Difference (IV, Fixed, 95% CI) | ‐0.37 [‐0.54, ‐0.20] |
| 20.2 More than 3 to 7 mg Fe/g dw (10/35) | 1 | 143 | Mean Difference (IV, Fixed, 95% CI) | ‐0.31 [‐0.41, ‐0.21] |
| 20.3 More than 7 mg Fe/g dw (20/41) | 1 | 164 | Mean Difference (IV, Fixed, 95% CI) | ‐0.11 [‐0.21, ‐0.01] |
| 20.4 More than 14 mg Fe/g dw (30/51) | 1 | 206 | Mean Difference (IV, Fixed, 95% CI) | 0.23 [0.05, 0.41] |
| 21 Any serious AEs (# participants affected) Show forest plot | 2 | 773 | Risk Ratio (M‐H, Fixed, 95% CI) | 0.88 [0.42, 1.86] |
|
| 22 Serious AEs Show forest plot | 1 | | Risk Ratio (M‐H, Fixed, 95% CI) | Totals not selected |
|
| 22.1 Cardiac disorders ‐ arrhythmia | 1 | | Risk Ratio (M‐H, Fixed, 95% CI) | 0.0 [0.0, 0.0] |
| 22.2 Endocrine disorders ‐ hypogonadism | 1 | | Risk Ratio (M‐H, Fixed, 95% CI) | 0.0 [0.0, 0.0] |
| 22.3 GI disorders abdominal abscess | 1 | | Risk Ratio (M‐H, Fixed, 95% CI) | 0.0 [0.0, 0.0] |
| 22.4 GI disorders amoebiasis | 1 | | Risk Ratio (M‐H, Fixed, 95% CI) | 0.0 [0.0, 0.0] |
| 22.5 GI disorders ‐ appendicitis | 1 | | Risk Ratio (M‐H, Fixed, 95% CI) | 0.0 [0.0, 0.0] |
| 22.6 GI disorders ‐ colitis | 1 | | Risk Ratio (M‐H, Fixed, 95% CI) | 0.0 [0.0, 0.0] |
| 22.7 GI disorders ‐ diarrhoea | 1 | | Risk Ratio (M‐H, Fixed, 95% CI) | 0.0 [0.0, 0.0] |
| 22.8 GI disorders ‐ gastric haemorrhage | 1 | | Risk Ratio (M‐H, Fixed, 95% CI) | 0.0 [0.0, 0.0] |
| 22.9 GI disorders ‐ gastroenteritis | 1 | | Risk Ratio (M‐H, Fixed, 95% CI) | 0.0 [0.0, 0.0] |
| 22.10 GI disorders ‐ ileus | 1 | | Risk Ratio (M‐H, Fixed, 95% CI) | 0.0 [0.0, 0.0] |
| 22.11 GI disorders ‐ upper abdominal pain | 1 | | Risk Ratio (M‐H, Fixed, 95% CI) | 0.0 [0.0, 0.0] |
| 22.12 GI disorders ‐ vomiting | 1 | | Risk Ratio (M‐H, Fixed, 95% CI) | 0.0 [0.0, 0.0] |
| 22.13 GI disorders ‐ GI infection | 1 | | Risk Ratio (M‐H, Fixed, 95% CI) | 0.0 [0.0, 0.0] |
| 22.14 General disorders and administration site conditions ‐ pyrexia | 1 | | Risk Ratio (M‐H, Fixed, 95% CI) | 0.0 [0.0, 0.0] |
| 22.15 General disorders and administration site conditions ‐ local swelling | 1 | | Risk Ratio (M‐H, Fixed, 95% CI) | 0.0 [0.0, 0.0] |
| 22.16 Hepatobiliary disorders ‐ liver abscess | 1 | | Risk Ratio (M‐H, Fixed, 95% CI) | 0.0 [0.0, 0.0] |
| 22.17 Hepatobiliary disorders ‐ cholelithiasis | 1 | | Risk Ratio (M‐H, Fixed, 95% CI) | 0.0 [0.0, 0.0] |
| 22.18 Immune system disorders ‐ face oedema | 1 | | Risk Ratio (M‐H, Fixed, 95% CI) | 0.0 [0.0, 0.0] |
| 22.19 Infections and infestations ‐ herpes zoster | 1 | | Risk Ratio (M‐H, Fixed, 95% CI) | 0.0 [0.0, 0.0] |
| 22.20 Infections and infestations ‐ tooth infection | 1 | | Risk Ratio (M‐H, Fixed, 95% CI) | 0.0 [0.0, 0.0] |
| 22.21 Infections and infestations ‐ urinary tract infection | 1 | | Risk Ratio (M‐H, Fixed, 95% CI) | 0.0 [0.0, 0.0] |
| 22.22 Injury, poisoning and procedural complications ‐ oesophageal rupture | 1 | | Risk Ratio (M‐H, Fixed, 95% CI) | 0.0 [0.0, 0.0] |
| 22.23 Injury, poisoning and procedural complications ‐ haemosiderosis | 1 | | Risk Ratio (M‐H, Fixed, 95% CI) | 0.0 [0.0, 0.0] |
| 22.24 Injury, poisoning and procedural complications ‐ iron overload | 1 | | Risk Ratio (M‐H, Fixed, 95% CI) | 0.0 [0.0, 0.0] |
| 22.25 Metabolism and nutrition disorders ‐ hyperglycaemia | 1 | | Risk Ratio (M‐H, Fixed, 95% CI) | 0.0 [0.0, 0.0] |
| 22.26 Musculoskeletal and connective tissue disorders ‐ back pain | 1 | | Risk Ratio (M‐H, Fixed, 95% CI) | 0.0 [0.0, 0.0] |
| 22.27 Musculoskeletal and connective tissue disorders ‐ pain in jaw | 1 | | Risk Ratio (M‐H, Fixed, 95% CI) | 0.0 [0.0, 0.0] |
| 22.28 Nervous system disorders ‐ grand mal convulsion | 1 | | Risk Ratio (M‐H, Fixed, 95% CI) | 0.0 [0.0, 0.0] |
| 22.29 Nervous system disorders ‐ meningitis | 1 | | Risk Ratio (M‐H, Fixed, 95% CI) | 0.0 [0.0, 0.0] |
| 22.30 Respiratory, thoracic and mediastinal disorders ‐ acute tonsilitis | 1 | | Risk Ratio (M‐H, Fixed, 95% CI) | 0.0 [0.0, 0.0] |
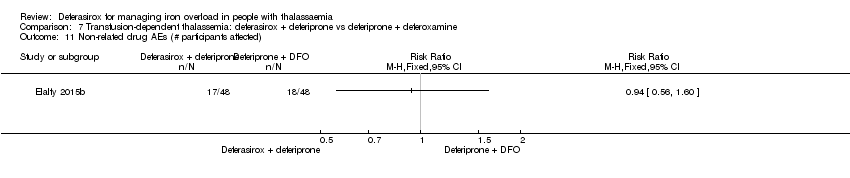
| 23 Any AE (# participants affected) Show forest plot | 2 | 258 | Risk Ratio (M‐H, Fixed, 95% CI) | 0.94 [0.83, 1.08] |
|
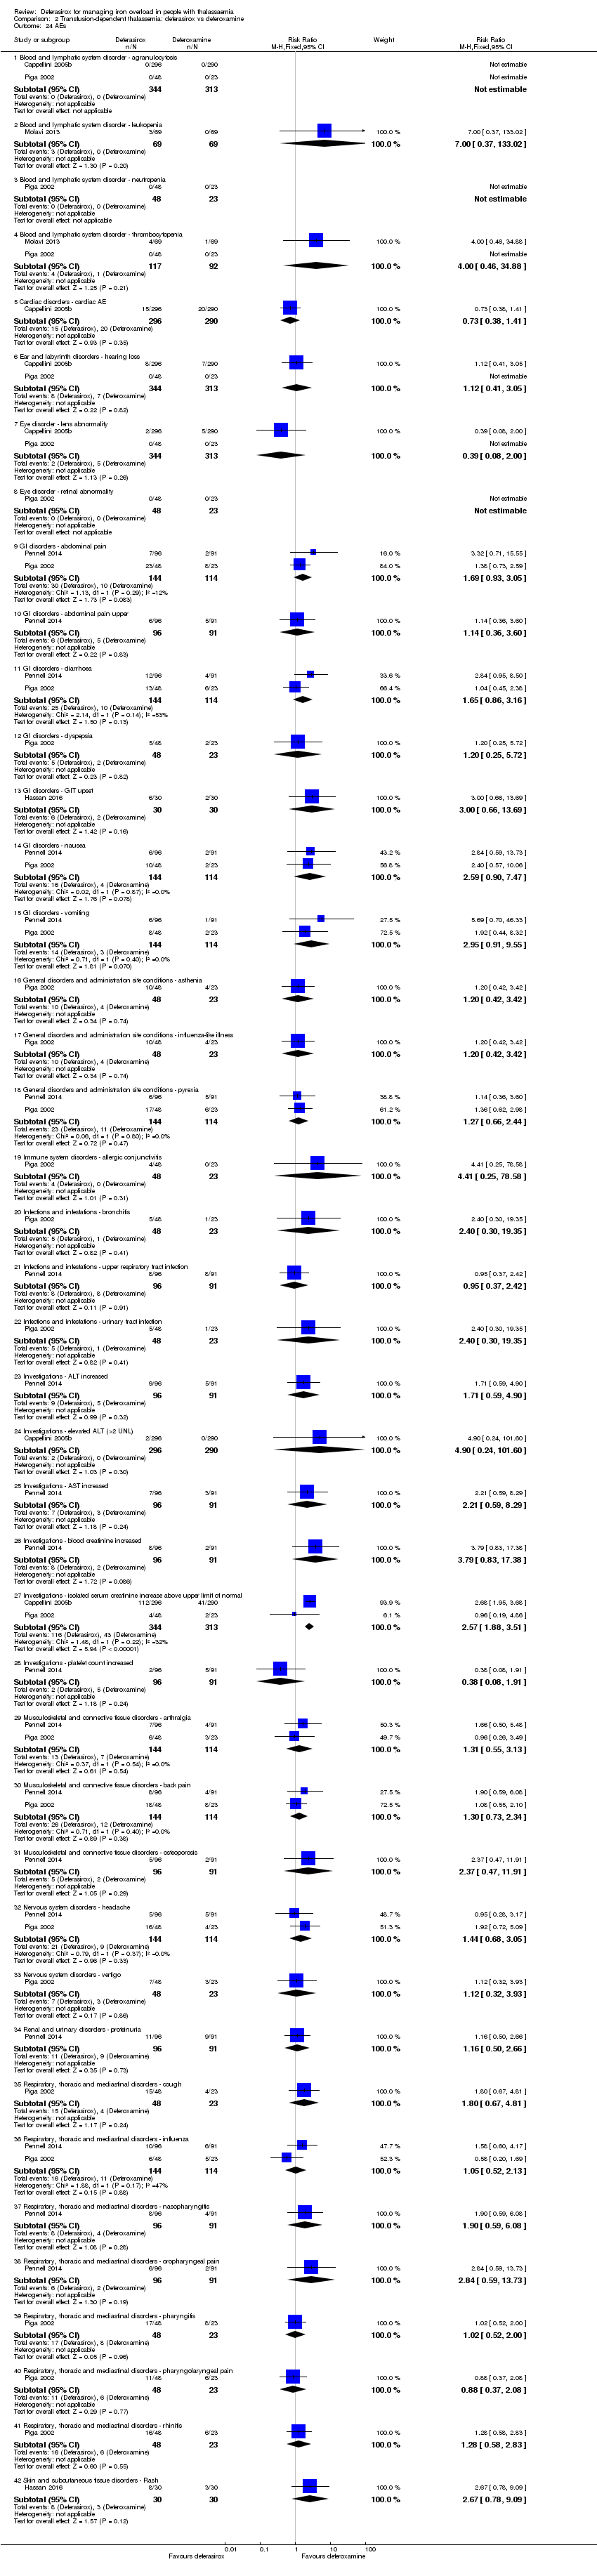
| 24 AEs Show forest plot | 5 | | Risk Ratio (M‐H, Fixed, 95% CI) | Subtotals only |
|
| 24.1 Blood and lymphatic system disorder ‐ agranulocytosis | 2 | 657 | Risk Ratio (M‐H, Fixed, 95% CI) | 0.0 [0.0, 0.0] |
| 24.2 Blood and lymphatic system disorder ‐ leukopenia | 1 | 138 | Risk Ratio (M‐H, Fixed, 95% CI) | 7.0 [0.37, 133.02] |
| 24.3 Blood and lymphatic system disorder ‐ neutropenia | 1 | 71 | Risk Ratio (M‐H, Fixed, 95% CI) | 0.0 [0.0, 0.0] |
| 24.4 Blood and lymphatic system disorder ‐ thrombocytopenia | 2 | 209 | Risk Ratio (M‐H, Fixed, 95% CI) | 4.0 [0.46, 34.88] |
| 24.5 Cardiac disorders ‐ cardiac AE | 1 | 586 | Risk Ratio (M‐H, Fixed, 95% CI) | 0.73 [0.38, 1.41] |
| 24.6 Ear and labyrinth disorders ‐ hearing loss | 2 | 657 | Risk Ratio (M‐H, Fixed, 95% CI) | 1.12 [0.41, 3.05] |
| 24.7 Eye disorder ‐ lens abnormality | 2 | 657 | Risk Ratio (M‐H, Fixed, 95% CI) | 0.39 [0.08, 2.00] |
| 24.8 Eye disorder ‐ retinal abnormality | 1 | 71 | Risk Ratio (M‐H, Fixed, 95% CI) | 0.0 [0.0, 0.0] |
| 24.9 GI disorders ‐ abdominal pain | 2 | 258 | Risk Ratio (M‐H, Fixed, 95% CI) | 1.69 [0.93, 3.05] |
| 24.10 GI disorders ‐ abdominal pain upper | 1 | 187 | Risk Ratio (M‐H, Fixed, 95% CI) | 1.14 [0.36, 3.60] |
| 24.11 GI disorders ‐ diarrhoea | 2 | 258 | Risk Ratio (M‐H, Fixed, 95% CI) | 1.65 [0.86, 3.16] |
| 24.12 GI disorders ‐ dyspepsia | 1 | 71 | Risk Ratio (M‐H, Fixed, 95% CI) | 1.20 [0.25, 5.72] |
| 24.13 GI disorders ‐ GIT upset | 1 | 60 | Risk Ratio (M‐H, Fixed, 95% CI) | 3.0 [0.66, 13.69] |
| 24.14 GI disorders ‐ nausea | 2 | 258 | Risk Ratio (M‐H, Fixed, 95% CI) | 2.59 [0.90, 7.47] |
| 24.15 GI disorders ‐ vomiting | 2 | 258 | Risk Ratio (M‐H, Fixed, 95% CI) | 2.95 [0.91, 9.55] |
| 24.16 General disorders and administration site conditions ‐ asthenia | 1 | 71 | Risk Ratio (M‐H, Fixed, 95% CI) | 1.20 [0.42, 3.42] |
| 24.17 General disorders and administration site conditions ‐ influenza‐like illness | 1 | 71 | Risk Ratio (M‐H, Fixed, 95% CI) | 1.20 [0.42, 3.42] |
| 24.18 General disorders and administration site conditions ‐ pyrexia | 2 | 258 | Risk Ratio (M‐H, Fixed, 95% CI) | 1.27 [0.66, 2.44] |
| 24.19 Immune system disorders ‐ allergic conjunctivitis | 1 | 71 | Risk Ratio (M‐H, Fixed, 95% CI) | 4.41 [0.25, 78.58] |
| 24.20 Infections and infestations ‐ bronchitis | 1 | 71 | Risk Ratio (M‐H, Fixed, 95% CI) | 2.40 [0.30, 19.35] |
| 24.21 Infections and infestations ‐ upper respiratory tract infection | 1 | 187 | Risk Ratio (M‐H, Fixed, 95% CI) | 0.95 [0.37, 2.42] |
| 24.22 Infections and infestations ‐ urinary tract infection | 1 | 71 | Risk Ratio (M‐H, Fixed, 95% CI) | 2.40 [0.30, 19.35] |
| 24.23 Investigations ‐ ALT increased | 1 | 187 | Risk Ratio (M‐H, Fixed, 95% CI) | 1.71 [0.59, 4.90] |
| 24.24 Investigations ‐ elevated ALT (>2 UNL) | 1 | 586 | Risk Ratio (M‐H, Fixed, 95% CI) | 4.90 [0.24, 101.60] |
| 24.25 Investigations ‐ AST increased | 1 | 187 | Risk Ratio (M‐H, Fixed, 95% CI) | 2.21 [0.59, 8.29] |
| 24.26 Investigations ‐ blood creatinine increased | 1 | 187 | Risk Ratio (M‐H, Fixed, 95% CI) | 3.79 [0.83, 17.38] |
| 24.27 Investigations ‐ isolated serum creatinine increase above upper limit of normal | 2 | 657 | Risk Ratio (M‐H, Fixed, 95% CI) | 2.57 [1.88, 3.51] |
| 24.28 Investigations ‐ platelet count increased | 1 | 187 | Risk Ratio (M‐H, Fixed, 95% CI) | 0.38 [0.08, 1.91] |
| 24.29 Musculoskeletal and connective tissue disorders ‐ arthralgia | 2 | 258 | Risk Ratio (M‐H, Fixed, 95% CI) | 1.31 [0.55, 3.13] |
| 24.30 Musculoskeletal and connective tissue disorders ‐ back pain | 2 | 258 | Risk Ratio (M‐H, Fixed, 95% CI) | 1.30 [0.73, 2.34] |
| 24.31 Musculoskeletal and connective tissue disorders ‐ osteoporosis | 1 | 187 | Risk Ratio (M‐H, Fixed, 95% CI) | 2.37 [0.47, 11.91] |
| 24.32 Nervous system disorders ‐ headache | 2 | 258 | Risk Ratio (M‐H, Fixed, 95% CI) | 1.44 [0.68, 3.05] |
| 24.33 Nervous system disorders ‐ vertigo | 1 | 71 | Risk Ratio (M‐H, Fixed, 95% CI) | 1.12 [0.32, 3.93] |
| 24.34 Renal and urinary disorders ‐ proteinuria | 1 | 187 | Risk Ratio (M‐H, Fixed, 95% CI) | 1.16 [0.50, 2.66] |
| 24.35 Respiratory, thoracic and mediastinal disorders ‐ cough | 1 | 71 | Risk Ratio (M‐H, Fixed, 95% CI) | 1.80 [0.67, 4.81] |
| 24.36 Respiratory, thoracic and mediastinal disorders ‐ influenza | 2 | 258 | Risk Ratio (M‐H, Fixed, 95% CI) | 1.05 [0.52, 2.13] |
| 24.37 Respiratory, thoracic and mediastinal disorders ‐ nasopharyngitis | 1 | 187 | Risk Ratio (M‐H, Fixed, 95% CI) | 1.90 [0.59, 6.08] |
| 24.38 Respiratory, thoracic and mediastinal disorders ‐ oropharyngeal pain | 1 | 187 | Risk Ratio (M‐H, Fixed, 95% CI) | 2.84 [0.59, 13.73] |
| 24.39 Respiratory, thoracic and mediastinal disorders ‐ pharyngitis | 1 | 71 | Risk Ratio (M‐H, Fixed, 95% CI) | 1.02 [0.52, 2.00] |
| 24.40 Respiratory, thoracic and mediastinal disorders ‐ pharyngolaryngeal pain | 1 | 71 | Risk Ratio (M‐H, Fixed, 95% CI) | 0.88 [0.37, 2.08] |
| 24.41 Respiratory, thoracic and mediastinal disorders ‐ rhinitis | 1 | 71 | Risk Ratio (M‐H, Fixed, 95% CI) | 1.28 [0.58, 2.83] |
| 24.42 Skin and subcutaneous tissue disorders ‐ Rash | 1 | 60 | Risk Ratio (M‐H, Fixed, 95% CI) | 2.67 [0.78, 9.09] |
| 25 Any drug‐related AE (# participants affected) Show forest plot | 1 | | Risk Ratio (M‐H, Fixed, 95% CI) | Totals not selected |
|
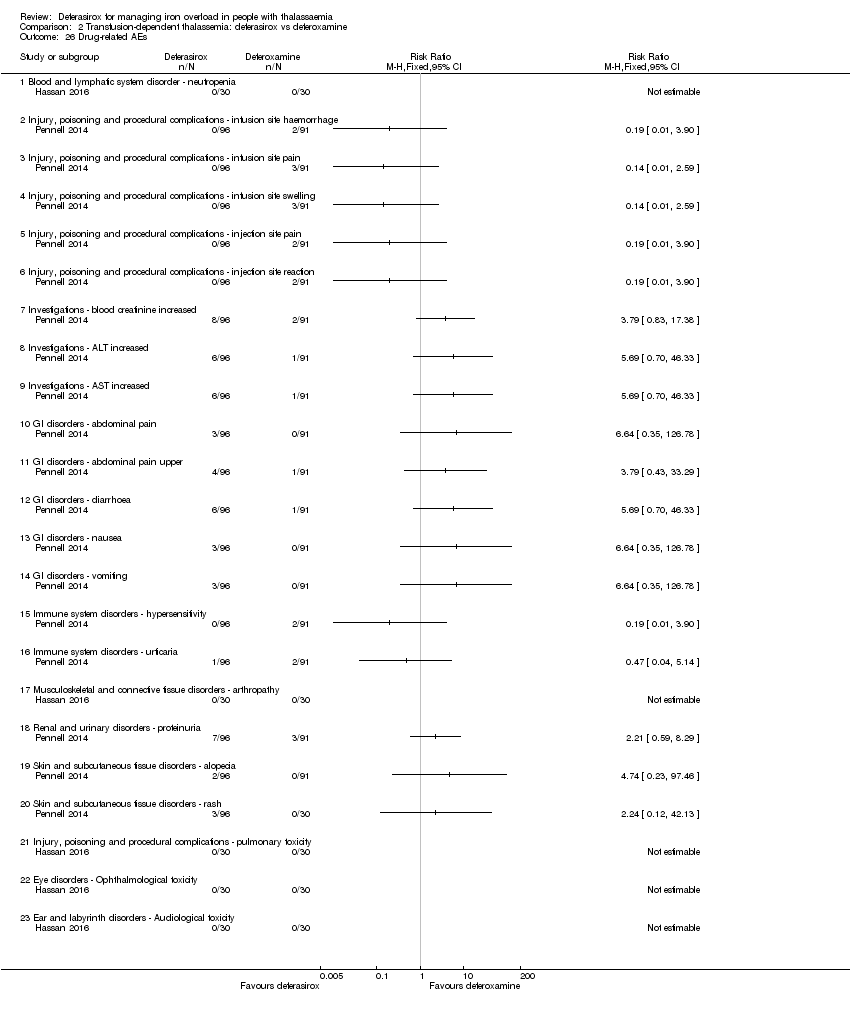
| 26 Drug‐related AEs Show forest plot | 2 | | Risk Ratio (M‐H, Fixed, 95% CI) | Totals not selected |
|
| 26.1 Blood and lymphatic system disorder ‐ neutropenia | 1 | | Risk Ratio (M‐H, Fixed, 95% CI) | 0.0 [0.0, 0.0] |
| 26.2 Injury, poisoning and procedural complications ‐ infusion site haemorrhage | 1 | | Risk Ratio (M‐H, Fixed, 95% CI) | 0.0 [0.0, 0.0] |
| 26.3 Injury, poisoning and procedural complications ‐ infusion site pain | 1 | | Risk Ratio (M‐H, Fixed, 95% CI) | 0.0 [0.0, 0.0] |
| 26.4 Injury, poisoning and procedural complications ‐ infusion site swelling | 1 | | Risk Ratio (M‐H, Fixed, 95% CI) | 0.0 [0.0, 0.0] |
| 26.5 Injury, poisoning and procedural complications ‐ injection site pain | 1 | | Risk Ratio (M‐H, Fixed, 95% CI) | 0.0 [0.0, 0.0] |
| 26.6 Injury, poisoning and procedural complications ‐ injection site reaction | 1 | | Risk Ratio (M‐H, Fixed, 95% CI) | 0.0 [0.0, 0.0] |
| 26.7 Investigations ‐ blood creatinine increased | 1 | | Risk Ratio (M‐H, Fixed, 95% CI) | 0.0 [0.0, 0.0] |
| 26.8 Investigations ‐ ALT increased | 1 | | Risk Ratio (M‐H, Fixed, 95% CI) | 0.0 [0.0, 0.0] |
| 26.9 Investigations ‐ AST increased | 1 | | Risk Ratio (M‐H, Fixed, 95% CI) | 0.0 [0.0, 0.0] |
| 26.10 GI disorders ‐ abdominal pain | 1 | | Risk Ratio (M‐H, Fixed, 95% CI) | 0.0 [0.0, 0.0] |
| 26.11 GI disorders ‐ abdominal pain upper | 1 | | Risk Ratio (M‐H, Fixed, 95% CI) | 0.0 [0.0, 0.0] |
| 26.12 GI disorders ‐ diarrhoea | 1 | | Risk Ratio (M‐H, Fixed, 95% CI) | 0.0 [0.0, 0.0] |
| 26.13 GI disorders ‐ nausea | 1 | | Risk Ratio (M‐H, Fixed, 95% CI) | 0.0 [0.0, 0.0] |
| 26.14 GI disorders ‐ vomiting | 1 | | Risk Ratio (M‐H, Fixed, 95% CI) | 0.0 [0.0, 0.0] |
| 26.15 Immune system disorders ‐ hypersensitivity | 1 | | Risk Ratio (M‐H, Fixed, 95% CI) | 0.0 [0.0, 0.0] |
| 26.16 Immune system disorders ‐ urticaria | 1 | | Risk Ratio (M‐H, Fixed, 95% CI) | 0.0 [0.0, 0.0] |
| 26.17 Musculoskeletal and connective tissue disorders ‐ arthropathy | 1 | | Risk Ratio (M‐H, Fixed, 95% CI) | 0.0 [0.0, 0.0] |
| 26.18 Renal and urinary disorders ‐ proteinuria | 1 | | Risk Ratio (M‐H, Fixed, 95% CI) | 0.0 [0.0, 0.0] |
| 26.19 Skin and subcutaneous tissue disorders ‐ alopecia | 1 | | Risk Ratio (M‐H, Fixed, 95% CI) | 0.0 [0.0, 0.0] |
| 26.20 Skin and subcutaneous tissue disorders ‐ rash | 1 | | Risk Ratio (M‐H, Fixed, 95% CI) | 0.0 [0.0, 0.0] |
| 26.21 Injury, poisoning and procedural complications ‐ pulmonary toxicity | 1 | | Risk Ratio (M‐H, Fixed, 95% CI) | 0.0 [0.0, 0.0] |
| 26.22 Eye disorders ‐ Ophthalmological toxicity | 1 | | Risk Ratio (M‐H, Fixed, 95% CI) | 0.0 [0.0, 0.0] |
| 26.23 Ear and labyrinth disorders ‐ Audiological toxicity | 1 | | Risk Ratio (M‐H, Fixed, 95% CI) | 0.0 [0.0, 0.0] |
| 27 Satisfaction with treatment (very satisfied or satisfied) Show forest plot | 1 | | Risk Ratio (M‐H, Fixed, 95% CI) | Totals not selected |
|
| 27.1 Week 4 ‐ participants previously treated with DFO | 1 | | Risk Ratio (M‐H, Fixed, 95% CI) | 0.0 [0.0, 0.0] |
| 27.2 Week 24 ‐ participants previously treated with DFO | 1 | | Risk Ratio (M‐H, Fixed, 95% CI) | 0.0 [0.0, 0.0] |
| 27.3 End of study (1 year) ‐ participants previously treated with DFO | 1 | | Risk Ratio (M‐H, Fixed, 95% CI) | 0.0 [0.0, 0.0] |
| 27.4 Week 4 ‐ DFO‐naive participants | 1 | | Risk Ratio (M‐H, Fixed, 95% CI) | 0.0 [0.0, 0.0] |
| 27.5 Week 24 ‐ DFO‐naive participants | 1 | | Risk Ratio (M‐H, Fixed, 95% CI) | 0.0 [0.0, 0.0] |
| 27.6 End of study (1 year) ‐ DFO‐naive participants | 1 | | Risk Ratio (M‐H, Fixed, 95% CI) | 0.0 [0.0, 0.0] |
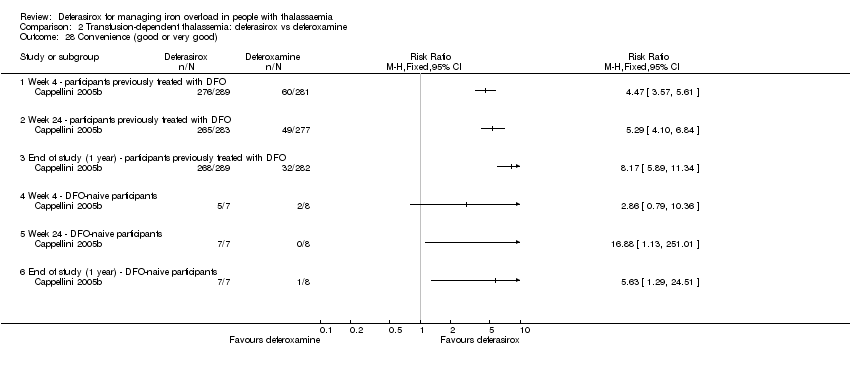
| 28 Convenience (good or very good) Show forest plot | 1 | | Risk Ratio (M‐H, Fixed, 95% CI) | Totals not selected |
|
| 28.1 Week 4 ‐ participants previously treated with DFO | 1 | | Risk Ratio (M‐H, Fixed, 95% CI) | 0.0 [0.0, 0.0] |
| 28.2 Week 24 ‐ participants previously treated with DFO | 1 | | Risk Ratio (M‐H, Fixed, 95% CI) | 0.0 [0.0, 0.0] |
| 28.3 End of study (1 year) ‐ participants previously treated with DFO | 1 | | Risk Ratio (M‐H, Fixed, 95% CI) | 0.0 [0.0, 0.0] |
| 28.4 Week 4 ‐ DFO‐naive participants | 1 | | Risk Ratio (M‐H, Fixed, 95% CI) | 0.0 [0.0, 0.0] |
| 28.5 Week 24 ‐ DFO‐naive participants | 1 | | Risk Ratio (M‐H, Fixed, 95% CI) | 0.0 [0.0, 0.0] |
| 28.6 End of study (1 year) ‐ DFO‐naive participants | 1 | | Risk Ratio (M‐H, Fixed, 95% CI) | 0.0 [0.0, 0.0] |
| 29 Willingness to continue treatment Show forest plot | 1 | | Risk Ratio (M‐H, Fixed, 95% CI) | Totals not selected |
|
| 29.1 Participants treated previously with DFO | 1 | | Risk Ratio (M‐H, Fixed, 95% CI) | 0.0 [0.0, 0.0] |
| 29.2 DFO‐naive participants | 1 | | Risk Ratio (M‐H, Fixed, 95% CI) | 0.0 [0.0, 0.0] |
| 30 Time lost from normal activities due to treatment (hours/month): participants treated previously with DFO Show forest plot | 1 | | Mean Difference (IV, Fixed, 95% CI) | Totals not selected |
|
| 30.1 week 4 ‐ patients treated previously with DFO | 1 | | Mean Difference (IV, Fixed, 95% CI) | 0.0 [0.0, 0.0] |
| 30.2 week 24 ‐ patients treated previously with DFO | 1 | | Mean Difference (IV, Fixed, 95% CI) | 0.0 [0.0, 0.0] |
| 30.3 end of study (1 year) ‐ patients treated previously with DFO | 1 | | Mean Difference (IV, Fixed, 95% CI) | 0.0 [0.0, 0.0] |
| 30.4 week 4 ‐ DFO‐naive patients | 1 | | Mean Difference (IV, Fixed, 95% CI) | 0.0 [0.0, 0.0] |
| 30.5 week 24 ‐ DFO‐naive patients | 1 | | Mean Difference (IV, Fixed, 95% CI) | 0.0 [0.0, 0.0] |
| 30.6 end of study (1 year) ‐ DFO‐naive patients | 1 | | Mean Difference (IV, Fixed, 95% CI) | 0.0 [0.0, 0.0] |
| 31 Adherence (% of planned dose) Show forest plot | 1 | | Mean Difference (IV, Fixed, 95% CI) | Totals not selected |
|
| 32 Discontinuations Show forest plot | 8 | 1211 | Risk Ratio (M‐H, Fixed, 95% CI) | 0.95 [0.60, 1.50] |
|
| 32.1 Deferasirox 10 mg/kg/day | 1 | 35 | Risk Ratio (M‐H, Fixed, 95% CI) | 0.16 [0.01, 3.64] |
| 32.2 Deferasirox 20 mg/kg/day | 2 | 174 | Risk Ratio (M‐H, Fixed, 95% CI) | 1.0 [0.10, 9.96] |
| 32.3 Deferasirox 25 mg/kg/day | 1 | 120 | Risk Ratio (M‐H, Fixed, 95% CI) | 0.09 [0.01, 1.61] |
| 32.4 Deferasirox 40 mg/kg/day | 2 | 211 | Risk Ratio (M‐H, Fixed, 95% CI) | 1.02 [0.51, 2.05] |
| 32.5 Deferasirox ‐ variable dosage | 2 | 646 | Risk Ratio (M‐H, Fixed, 95% CI) | 1.39 [0.67, 2.85] |
| 32.6 Deferasirox dosing unknown | 1 | 25 | Risk Ratio (M‐H, Fixed, 95% CI) | 0.0 [0.0, 0.0] |
| 33 Dose adjustments and dose interruptions Show forest plot | 1 | | Risk Ratio (M‐H, Fixed, 95% CI) | Totals not selected |
|
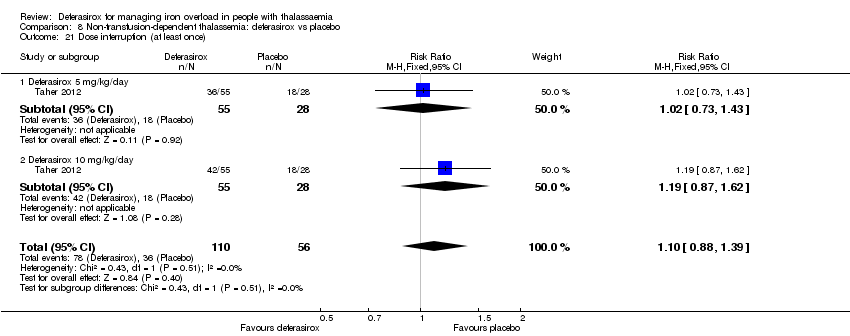
| 34 Dose interruptions (interrupted at least once) Show forest plot | 1 | | Risk Ratio (M‐H, Fixed, 95% CI) | Totals not selected |
|
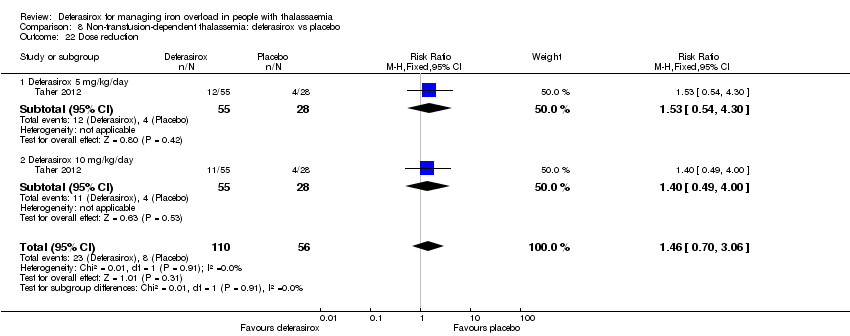
| 35 Dose reduction (at least once) Show forest plot | 1 | | Risk Ratio (M‐H, Fixed, 95% CI) | Totals not selected |
|
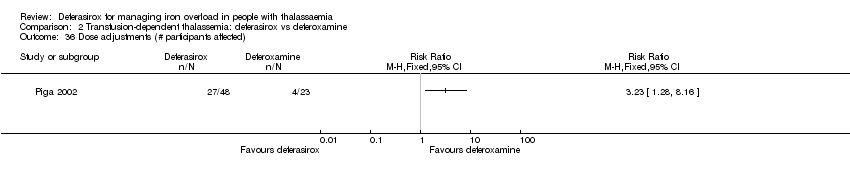
| 36 Dose adjustments (# participants affected) Show forest plot | 1 | | Risk Ratio (M‐H, Fixed, 95% CI) | Totals not selected |
|
| 37 Dose interruptions due to an AE (# participants affected) Show forest plot | 1 | | Risk Ratio (M‐H, Fixed, 95% CI) | Totals not selected |
|
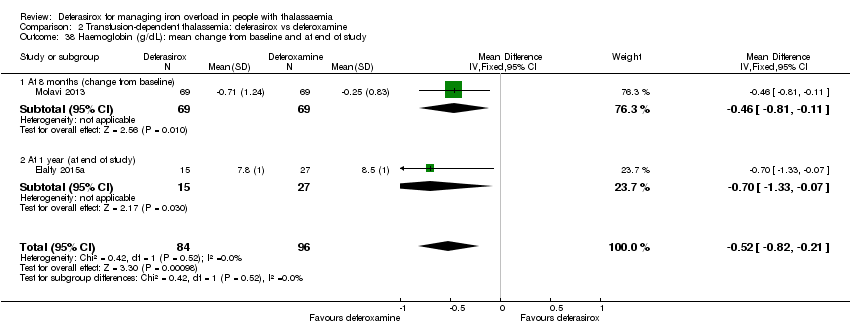
| 38 Haemoglobin (g/dL): mean change from baseline and at end of study Show forest plot | 2 | 180 | Mean Difference (IV, Fixed, 95% CI) | ‐0.52 [‐0.82, ‐0.21] |
|
| 38.1 At 8 months (change from baseline) | 1 | 138 | Mean Difference (IV, Fixed, 95% CI) | ‐0.46 [‐0.81, ‐0.11] |
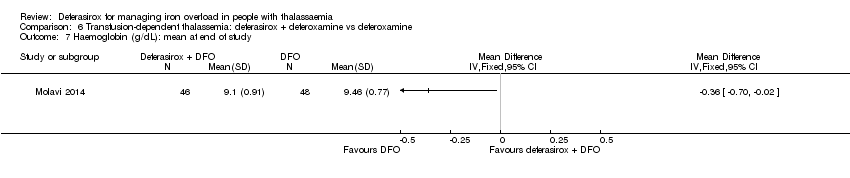
| 38.2 At 1 year (at end of study) | 1 | 42 | Mean Difference (IV, Fixed, 95% CI) | ‐0.70 [‐1.33, ‐0.07] |
| 39 Transfusion index (mL/kg/year): mean at end of study Show forest plot | 1 | | Mean Difference (IV, Fixed, 95% CI) | Totals not selected |
|
| 40 Transferrin saturation (%): mean at end of study Show forest plot | 1 | | Mean Difference (IV, Fixed, 95% CI) | Totals not selected |
|
| 41 Platelet count (x10³/mm³): mean at end of study Show forest plot | 1 | | Mean Difference (IV, Fixed, 95% CI) | Totals not selected |
|
| 42 Absolute neutrophilic count (/mm³): mean at end of study Show forest plot | 1 | | Mean Difference (IV, Fixed, 95% CI) | Totals not selected |
|