Deferasirox zur Behandlung von Eisenüberladung bei Menschen mit Thalassämie
Abstract
Background
Thalassaemia is a hereditary anaemia due to ineffective erythropoiesis. In particular, people with thalassaemia major develop secondary iron overload resulting from regular red blood cell transfusions. Iron chelation therapy is needed to prevent long‐term complications.
Both deferoxamine and deferiprone are effective; however, a review of the effectiveness and safety of the newer oral chelator deferasirox in people with thalassaemia is needed.
Objectives
To assess the effectiveness and safety of oral deferasirox in people with thalassaemia and iron overload.
Search methods
We searched the Cystic Fibrosis and Genetic Disorders Group's Haemoglobinopathies Trials Register: 12 August 2016.
We also searched MEDLINE, Embase, the Cochrane Library, Biosis Previews, Web of Science Core Collection and three trial registries: ClinicalTrials.gov; the WHO International Clinical Trials Registry Platform; and the Internet Portal of the German Clinical Trials Register: 06 and 07 August 2015.
Selection criteria
Randomised controlled studies comparing deferasirox with no therapy or placebo or with another iron‐chelating treatment.
Data collection and analysis
Two authors independently assessed risk of bias and extracted data. We contacted study authors for additional information.
Main results
Sixteen studies involving 1807 randomised participants (range 23 to 586 participants) were included. Twelve two‐arm studies compared deferasirox to placebo (two studies) or deferoxamine (seven studies) or deferiprone (one study) or the combination of deferasirox and deferoxamine to deferoxamine alone (one study). One study compared the combination of deferasirox and deferiprone to deferiprone in combination with deferoxamine. Three three‐arm studies compared deferasirox to deferoxamine and deferiprone (two studies) or the combination of deferasirox and deferiprone to deferiprone and deferasirox monotherapy respectively (one study). One four‐arm study compared two different doses of deferasirox to matching placebo groups.
The two studies (a pharmacokinetic and a dose‐escalation study) comparing deferasirox to placebo (n = 47) in people with transfusion‐dependent thalassaemia showed that deferasirox leads to net iron excretion. In these studies, safety was acceptable and further investigation in phase II and phase III studies was warranted.
Nine studies (1251 participants) provided data for deferasirox versus standard treatment with deferoxamine. Data suggest that a similar efficacy can be achieved depending on the ratio of doses of deferoxamine and deferasirox being compared. In the phase III study, similar or superior efficacy for the intermediate markers ferritin and liver iron concentration (LIC) could only be achieved in the highly iron‐overloaded subgroup at a mean ratio of 1 mg of deferasirox to 1.8 mg of deferoxamine corresponding to a mean dose of 28.2 mg per day and 51.6 mg per day respectively. The pooled effects across the different dosing ratios are: serum ferritin, mean difference (MD) 454.42 ng/mL (95% confidence interval (CI) 337.13 to 571.71) (moderate quality evidence); LIC evaluated by biopsy or SQUID, MD 2.37 mg Fe/g dry weight (95% CI 1.68 to 3.07) (moderate quality evidence) and responder analysis, LIC 1 to < 7 mg Fe/g dry weight, risk ratio (RR) 0.80 (95% CI 0.69 to 0.92) (moderate quality evidence). The substantial heterogeneity observed could be explained by the different dosing ratios. Data on mortality (low quality evidence) and on safety at the presumably required doses for effective chelation therapy are limited. Patient satisfaction was better with deferasirox among those who had previously received deferoxamine treatment, RR 2.20 (95% CI 1.89 to 2.57) (moderate quality evidence). The rate of discontinuations was similar for both drugs (low quality evidence).
For the remaining comparisons in people with transfusion‐dependent thalassaemia, the quality of the evidence for outcomes assessed was low to very low, mainly due to the very small number of participants included. Four studies (205 participants) compared deferasirox to deferiprone; one of which (41 participants) revealed a higher number of participants experiencing arthralgia in the deferiprone group, but due to the large number of different types of adverse events reported and compared this result is uncertain. One study (96 participants) compared deferasirox combined with deferiprone to deferiprone with deferoxamine. Participants treated with the combination of the oral iron chelators had a higher adherence compared to those treated with deferiprone and deferoxamine, but no participants discontinued the study. In the comparisons of deferasirox versus combined deferasirox and deferiprone and that of deferiprone versus combined deferasirox and deferiprone (one study, 40 participants), and deferasirox and deferoxamine versus deferoxamine alone (one study, 94 participants), only a few patient‐relevant outcomes were reported and no significant differences were observed.
One study (166 participants) included people with non‐transfusion dependent thalassaemia and compared two different doses of deferasirox to placebo. Deferasirox treatment reduced serum ferritin, MD ‐306.74 ng/mL (95% CI ‐398.23 to ‐215.24) (moderate quality evidence) and LIC, MD ‐3.27 mg Fe/g dry weight (95% CI ‐4.44 to ‐2.09) (moderate quality evidence), while the number of participants experiencing adverse events and rate of discontinuations (low quality evidence) was similar in both groups. No participant died, but data on mortality were limited due to a follow‐up period of only one year (moderate quality evidence).
Authors' conclusions
Deferasirox offers an important treatment option for people with thalassaemia and secondary iron overload. Based on the available data, deferasirox does not seem to be superior to deferoxamine at the usually recommended ratio of 1 mg of deferasirox to 2 mg of deferoxamine. However, similar efficacy seems to be achievable depending on the dose and ratio of deferasirox compared to deferoxamine. Whether this will result in similar efficacy and will translate to similar benefits in the long term, as has been shown for deferoxamine, needs to be confirmed. Data from randomised controlled trials on rare toxicities and long‐term safety are still limited. However, after a detailed discussion of the potential benefits and risks, deferasirox could be offered as the first‐line option to individuals who show a strong preference for deferasirox, and may be a reasonable treatment option for people showing an intolerance or poor adherence to deferoxamine.
PICO
Laienverständliche Zusammenfassung
Deferasirox zur Behandlung von Eisenüberladung bei Menschen mit Thalassämie
Hintergrund
Thalassämie ist eine erbliche Anämie, die auf mangelhafter Produktion von Hämoglobin beruht. Regelmäßige rote Blutzelltransfusionen sind notwendig, insbesondere für Thalassaemia major, die schwere Form der Erkrankung. Dies führt zu Eisenüberladung. Da der menschliche Körper nicht über die Mittel verfügt, übermäßiges Eisen zu beseitigen, ist eine medikamentöse Behandlung (eisen‐chelatbildende Medikamente) erforderlich. Vor mehreren Jahren wurde ein neuer oraler Eisenchelator, Deferasirox, zugelassen.
Review‐Frage
Bietet Deferasirox Vorteile im Vergleich zu Placebo oder den anderen Eisenchelatoren Deferoxamin oder Deferipron bei Menschen mit Thalassämie hinsichtlich Wirksamkeit und Sicherheit?
Studienmerkmale
Die Evidenz ist auf dem Stand vom 12. August 2016. Dieser aktualisierte Review umfasst 16 randomisierte kontrollierte Studien (1807 Teilnehmer), die 20 Vergleiche von Deferasirox mit einer anderen Behandlung enthalten.
Bei Patienten mit transfusionsabhängiger Thalassämie verglichen zwei Studien Deferasirox mit Placebo und neun Studien (1251 Teilnehmer) verglichen Deferasirox mit der Standardbehandlung Deferoxamin. Vier Studien (205 Teilnehmer) verglichen Deferasirox mit Deferipron. Eine Studie verglich Deferasirox und Deferipron jeweils mit Deferasirox‐ und Deferipron‐Kombinationstherapie (40 Teilnehmer), Deferasirox‐ und Deferoxamin‐Kombinationstherapie mit nur Deferoxamin (94 Teilnehmer) und Deferasirox und Deferipron‐Kombinationstherapie mit Deferipron und Deferoxamin‐Kombinationstherapie (96 Teilnehmer).
Bei Patienten mit nicht‐transfusionsabhängiger Thalassämie (Personen, die keine regelmäßigen Bluttransfusionen benötigen) verglich eine Studie (166 Teilnehmer) Deferasirox mit Placebo. Die Dauer der eingeschlossenen Studien reichte von 12 Tagen bis zwei Jahren.
Hauptergebnisse
Zwei Studien, die Deferasirox mit Placebo bei Patienten mit transfusionsabhängiger Thalassämie verglichen, zeigten, dass Deferasirox beim Entfernen von Eisen wirksam war. Neun weitere Studien verglichen Deferasirox mit der Standardbehandlung Deferoxamin. Eine ähnliche Wirksamkeit scheint je nach Dosierung der beiden Medikamente möglich zu sein. Es muss bestätigt werden, ob es langfristig zu ähnlichen Verbesserungen bei patientenrelevanten Endpunkten führt. Die Sicherheit von Deferasirox war akzeptabel; allerdings konnten seltenere unerwünschte Ereignisse oder langfristige Nebenwirkungen aufgrund der begrenzten Teilnehmerzahl und der relativ kurzen Dauer der Studien nicht ausreichend untersucht werden. Die Behandlungszufriedenheit war mit Deferasirox bei Patienten, die zuvor mit Deferoxamin behandelt worden waren, signifikant besser. Die Rate der Therapieabbrüche war bei beiden Medikamenten ähnlich. Deferasirox könnte eine Alternative für Personen sein, die Deferoxamin nicht vertragen oder die Behandlung damit nicht sorgfältig einhalten. Bei Menschen mit einer starken Vorliebe für Deferasirox sollten mögliche Vorteile und Risiken diskutiert werden.
Eine Studie (41 Teilnehmer) berichtete, dass mehr Personen mit transfusionsabhängiger Thalassämie Gelenkschmerzen erlitten, wenn sie mit Deferipron behandelt wurden als mit Deferasirox, aber aufgrund der großen Anzahl verschiedener Arten von unerwünschten Ereignissen, die berichtet und verglichen wurden, könnte dieses Ergebnis auf Zufall zurückzuführen sein. Eine Studie ergab, dass die Einhaltung der Behandlung besser war, wenn beide orale Eisenchelatoren, Deferasirox und Deferipron angewendet wurden als die Kombination von Deferipron und Deferoxamin, aber kein Teilnehmer brach die Studie ab. Wir fanden keine Evidenz für Unterschiede bei Vergleichen von Deferasirox oder Deferipron alleine mit einer kombinierten Deferasirox‐ und Deferipron‐Behandlung oder Deferasirox‐ und Deferoxamin‐Kombination mit Deferoxamin alleine, aber die Anzahl der Patienten in den Studien waren klein und verfügbare Daten waren sehr begrenzt.
Eine Studie an Patienten mit nicht‐transfusionsabhängiger Thalassämie zeigte, dass Deferasirox bei der Verringerung der Ferritinkonzentration im Serum und der Leber‐eisenkonzentration im Vergleich zu Placebo besser war. Es gibt jedoch keine Evidenz zu den Auswirkungen auf patientenrelevante Endpunkte oder langfristige Daten zur Sicherheit in dieser Population.
Qualität der Evidenz
Die Qualität der eingeschlossenen Studien, in denen Deferasirox mit Deferoxamin bei Patienten mit transfusionsabhängiger Thalassämie verglichen wurde, war moderat bis niedrig, hauptsächlich aufgrund der Tatsache, dass die Forscher und Teilnehmer wussten, welche Interventionen den Teilnehmern zugeteilt wurden, der geringen Anzahl der Teilnehmer, die in den Studien eingeschlossen wurden, und der Verwendung eines Surrogatmarkers (Messwert, der anstelle eines harten klinischen Endpunktes verwendet wurde) statt der patientenrelevanten Endpunkte. Für den Vergleich von Deferasirox zu Placebo bei Patienten mit nicht‐transfusionsabhängiger Thalassämie war die Qualität der Evidenz moderat bis sehr niedrig, basierend auf nur einer kleinen Studie. Für die anderen Vergleiche war die Qualität der Evidenz niedrig bis sehr niedrig, vor allem aufgrund der Aufnahme von noch weniger Teilnehmern. Idealerweise sollten weitere randomisierte Studien, die patientenrelevante, langfristige Endpunkte und seltenere unerwünschte Ereignisse untersuchen, durchgeführt werden.
Authors' conclusions
Summary of findings
| Deferasirox compared to deferoxamine in people with transfusion‐dependent thalassemia | ||||||
| Patient or population: people with transfusion‐dependent thalassemia | ||||||
| Outcomes | Anticipated absolute effects* (95% CI) | Relative effect | № of participants | Quality of the evidence | Comments | |
| Risk with deferoxamine | Risk with deferasirox | |||||
| Mortality at any time point | Study population | RR 0.48 | 1170 | ⊕⊕⊝⊝ | ||
| 7 per 1.000 | 3 per 1.000 | |||||
| Responder analysis II (responder: LIC 1 to less than 7 mg Fe/g dw) | Study population | RR 0.80 | 553 | ⊕⊕⊕⊝ | ||
| 664 per 1.000 | 531 per 1.000 | |||||
| Serum ferritin (ng/mL): mean change from baseline and at end of study | MD 454.42 higher | ‐ | 1002 | ⊕⊕⊕⊝ | ||
| LIC (mg Fe/g dw) evaluated by biopsy or SQUID: mean change from baseline | MD 2.37 higher | ‐ | 541 | ⊕⊕⊕⊝ | ||
| Satisfaction with treatment (very satisfied or satisfied): participants previously treated with DFO | Study population | RR 2.20 | 571 | ⊕⊕⊕⊝ | ||
| 1.330 per 1.000 | 1000 per 1.000 | |||||
| Adherence: discontinuations | Study population | RR 0.95 | 1211 | ⊕⊕⊝⊝ | ||
| 54 per 1.000 | 52 per 1.000 | |||||
| AE: investigations ‐ isolated serum creatinine increase above ULN | Study population | RR 2.57 | 657 | ⊕⊕⊝⊝ | ||
| 137 per 1.000 | 353 per 1.000 | |||||
| *The risk in the intervention group (and its 95% CI) is based on the assumed risk in the comparison group and the relative effect of the intervention (and its 95% CI). | ||||||
| GRADE Working Group grades of evidence | ||||||
| 1 Serious risk of bias: studies that carry large weight for the overall effect estimate rated as high risk of bias due to lack of blinding and selective reporting. | ||||||
| Deferasirox compared to deferiprone in people with transfusion‐dependent thalassemia | ||||||
| Patient or population:people with transfusion‐dependent thalassemia | ||||||
| Outcomes | Anticipated absolute effects* (95% CI) | Relative effect | № of participants | Quality of the evidence | Comments | |
| Risk with deferiprone | Risk with deferasirox | |||||
| Mortality at any time point | Study population | not estimable | 146 | ⊕⊝⊝⊝ | ||
| 0 per 1.000 | 0 per 1.000 | |||||
| Responder analysis | Not measured | NA | ||||
| Serum ferritin (ng/mL): mean change from baseline and at end of study | MD 229.99 ng/mL higher | ‐ | 83 | ⊕⊝⊝⊝ | ||
| LIC (mg/g) evaluated by MRI R2*: mean change from baseline | MD 0.8 mg/g lower | ‐ | 45 | ⊕⊝⊝⊝ | ||
| Satisfaction | Not measured | NA | ||||
| Adherence: discontinuations | Study population | RR 0.16 | 179 | ⊕⊕⊝⊝ | ||
| 32 per 1.000 | 5 per 1.000 | |||||
| Renal failure | Study population | not estimable | 38 | ⊕⊝⊝⊝ | ||
| 0 per 1.000 | 0 per 1.000 | |||||
| *The risk in the intervention group (and its 95% CI) is based on the assumed risk in the comparison group and the relative effect of the intervention (and its 95% CI). | ||||||
| GRADE Working Group grades of evidence | ||||||
| 1 Very serious imprecision: only very few number of included participants. | ||||||
| Deferasirox alone compared to combined deferasirox and deferiprone in people with transfusion‐dependent thalassaemia | ||||||
| Patient or population: people with transfusion‐dependent thalassaemia | ||||||
| Outcomes | Anticipated absolute effects* (95% CI) | Relative effect | № of participants | Quality of the evidence | Comments | |
| Risk with deferasirox and deferiprone | Risk with deferasirox | |||||
| Mortality at any time point | Not reported1 | NA | ||||
| Responder analysis | Not measured1 | NA | ||||
| Serum ferritin (ng/mL) | Not reported1 | NA | ||||
| LIC (mg Fe/g dry weight) | Not reported1 | NA | ||||
| Satisfaction with treatment | Not measured1 | NA | ||||
| Adherence | Not reported1 | NA | ||||
| AE: serum creatinine increase | Not measured1 | NA | ||||
| *The risk in the intervention group (and its 95% CI) is based on the assumed risk in the comparison group and the relative effect of the intervention (and its 95% CI). | ||||||
| GRADE Working Group grades of evidence | ||||||
| 1 One RCT (40 participants) contributed to this comparison, but no relevant outcome data to this table are available (Kakkar 2014). | ||||||
| Combined deferasirox and deferiprone compared to deferiprone alone in people with transfusion‐dependent thalassaemia | ||||||
| Patient or population: people with transfusion‐dependent thalassemia | ||||||
| Outcomes | Anticipated absolute effects* (95% CI) | Relative effect | № of participants | Quality of the evidence | Comments | |
| Risk with deferasirox and deferiprone | Risk with deferasirox | |||||
| Mortality at any time point | Not reported1 | NA | ||||
| Responder analysis | Not measured1 | NA | ||||
| Serum ferritin (ng/mL) | Not reported1 | NA | ||||
| LIC (mg Fe/g dry weight) | Not reported1 | NA | ||||
| Satisfaction with treatment | Not measured1 | NA | ||||
| Adherence | Not reported1 | NA | ||||
| AE: Serum creatinine increase | Not measured1 | NA | ||||
| *The risk in the intervention group (and its 95% CI) is based on the assumed risk in the comparison group and the relative effect of the intervention (and its 95% CI). | ||||||
| GRADE Working Group grades of evidence | ||||||
| 1 One RCT (40 participants) contributed to this comparison, but no relevant outcome data to this table are available (Kakkar 2014). | ||||||
| Deferasirox and deferoxamine compared to deferoxamine in people with transfusion‐dependent thalassemia | ||||||
| Patient or population: people with transfusion‐dependent thalassemia | ||||||
| Outcomes | Anticipated absolute effects* (95% CI) | Relative effect | № of participants | Quality of the evidence | Comments | |
| Risk with deferoxamine | Risk with deferasirox and deferoxamine | |||||
| Mortality at any time point | Study population | not estimable | 94 | ⊕⊕⊝⊝ | ||
| 0 per 1.000 | 0 per 1.000 | |||||
| Responder analysis | Not measured | NA | ||||
| Serum ferritin (ng/mL) ‐ mean at end of study | MD 87.84 ng/mL higher | ‐ | 94 | ⊕⊝⊝⊝ | ||
| LIC | Not measured | NA | ||||
| Satisfaction with treatment | Not measured | NA | ||||
| Adherence: Discontinuations | Study population | not estimable | 94 | ⊕⊝⊝⊝ | ||
| 0 per 1.000 | 0 per 1.000 | |||||
| AE: serum creatinine increased | Not reported | NA | Serum creatinine was measured in Molavi 2014, but no results were reported. | |||
| *The risk in the intervention group (and its 95% CI) is based on the assumed risk in the comparison group and the relative effect of the intervention (and its 95% CI). | ||||||
| GRADE Working Group grades of evidence | ||||||
| 1 Very serious imprecision: only very few participants included. | ||||||
| Deferasirox and deferiprone compared to deferiprone and deferoxamine in people with transfusion‐dependent thalassemia | ||||||
| Patient or population: people with transfusion‐dependent thalassemia | ||||||
| Outcomes | Anticipated absolute effects* (95% CI) | Relative effect | № of participants | Quality of the evidence | Comments | |
| Risk with deferiprone and deferoxamine | Risk with deferasirox and deferiprone | |||||
| Mortality at any time point | Study population | not estimable | 96 | ⊕⊕⊝⊝ | "All the included patients continued till the end of study with no patients were lost follow‐up." (Elalfy 2015b) | |
| 0 per 1.000 | 0 per 1.000 | |||||
| Responder analysis | Not measured | NA | ||||
| Serum ferritin (ng/mL): mean change from baseline | MD 315.9 ng/mL lower | ‐ | 96 | ⊕⊝⊝⊝ | ||
| LIC evaluated by MRI R2*: mean change from baseline | MD 0.62 mg/g lower | ‐ | 96 | ⊕⊕⊝⊝ | ||
| Satisfaction | Not reported | NA | "Compared to baseline, patient‐reported satisfaction associated with ICT was significantly higher in group B [DFX and DFP] compared to group A [DFP and DFO] (p<0.01)" (Elalfy 2015b) | |||
| Adherence: Discontinuations | Study population | not estimable | 96 | ⊕⊝⊝⊝ | ||
| 0 per 1.000 | 0 per 1.000 | |||||
| Drug‐related AE: serum creatinine increased (≥ 33%) above baseline in 2 consecutive occasions | Study population | RR 3.00 | 96 | ⊕⊝⊝⊝ | ||
| 21 per 1.000 | 63 per 1.000 | |||||
| *The risk in the intervention group (and its 95% CI) is based on the assumed risk in the comparison group and the relative effect of the intervention (and its 95% CI). | ||||||
| GRADE Working Group grades of evidence | ||||||
| 1 Very serious imprecision: very few participants included. | ||||||
| Deferasirox compared to placebo in people with non‐transfusion‐dependent thalassemia | ||||||
| Patient or population: people with non‐transfusion‐dependent thalassemia | ||||||
| Outcomes | Anticipated absolute effects* (95% CI) | Relative effect | № of participants | Quality of the evidence | Comments | |
| Risk with placebo | Risk with deferasirox | |||||
| Mortality at any time point | Study population | not estimable | 148 | ⊕⊕⊕⊝ | "No deaths occurred during the study in any group" (Taher 2012) | |
| 0 per 1.000 | 0 per 1.000 | |||||
| Responder analysis | Not measured | NA | ||||
| Serum ferritin (ng/mL): mean change from baseline | MD 306.74 ng/mL lower | ‐ | 154 | ⊕⊕⊕⊝ | ||
| LIC (mg Fe/g dry weight) evaluated by MRI R2: least squares mean change from baseline | MD 3.27 mg Fe/g dry weight lower | ‐ | 159 | ⊕⊕⊕⊝ | ||
| Satisfaction with treatment | Not measured | NA | ||||
| Adherence: Discontinuations | Study population | RR 1.32 | 166 | ⊕⊕⊝⊝ | ||
| 89 per 1.000 | 118 per 1.000 | |||||
| AE: abnormal serum creatinine (post‐baseline) | Study population | RR 3.59 | 166 | ⊕⊝⊝⊝ | ||
| 0 per 1.000 | 0 per 1.000 | |||||
| *The risk in the intervention group (and its 95% CI) is based on the assumed risk in the comparison group and the relative effect of the intervention (and its 95% CI). | ||||||
| GRADE Working Group grades of evidence | ||||||
| 1 Serious imprecision: only few patients included. | ||||||
Background
Description of the condition
Thalassaemia, first described by Cooley and Lee in 1925 (Cooley 1925), is a hereditary anaemia resulting from a defect in haemoglobin production (Weatherall 2000). The disruption in the synthesis of either the α‐ or β‐chains of haemoglobin, classified in α‐ and β‐thalassaemia, leads to an ineffective erythropoiesis (i.e. the process by which red blood cells are produced) (Rund 2005). The worldwide birth rate for symptomatic thalassaemia is about 0.44 per 1000 births (Angastiniotis 1998) summing up to more than 40,000 newborns per year (Modell 2008). An estimated number of one to two million people with thalassaemia major, the severe form of the condition, need regular blood transfusions worldwide (Modell 2008; Weatherall 2000) of which only approximately 100,000 are treated as required (Modell 2008). The high frequency of thalassaemia genes can be explained by a protective effect of thalassaemia trait against malaria (Richer 2005; Weatherall 1998).
Due to various mutations in the different genes for the α‐ and β‐chain genes and other modifying factors, there is a broad spectrum of clinical symptoms ranging from intrauterine death through to severe anaemia with the need for regular red blood cell transfusions and to asymptomatic anaemia (Olivieri 1999). Diagnosis is usually confirmed by either using electrophoretic techniques or molecular analysis. According to the clinical severity, the β‐thalassaemia syndromes can be classified into thalassaemia major, thalassaemia intermedia and thalassaemia minor.
Whereas carriers with thalassaemia minor are often asymptomatic, those with thalassaemia intermedia may need occasional red blood cell transfusions (Peters 2013). To achieve sufficiently high haemoglobin levels for adequate growth and development, children with thalassaemia major usually are transfusion‐dependent, starting within their first year of life. Several studies have shown that a haemoglobin level above 9 to 10 g/dL is required to successfully suppress ineffective erythropoiesis and to prevent hepatosplenomegaly, as well as bone deformities due to extra‐medullary hematopoiesis (Olivieri 1999; Rund 2005; Weatherall 2000).
Iron overload in people with thalassaemia is mainly the result of the additional iron load of up to 10 g per year by regular blood transfusions (Kushner 2001). Particularly in people with thalassaemia intermedia, iron overload is also due to increased intestinal iron absorption (Taher 2006). Since the human body has no means of effectively excreting excess iron apart from gastrointestinal mucosal shedding, loss via sweat or through any bleeding (e.g. menstrual loss), iron chelation therapy is essential for these people. Without iron chelation therapy, iron‐mediated free radical damage causes liver fibrosis, endocrine failure and myocardial damage (Borgna‐Pignatti 2005).
Description of the intervention
Deferasirox (4‐(3,5‐bis‐(2‐hydroxyphenyl)‐(1,2,4)‐triazole‐1‐yl)benzoic acid) also known as CGP 72670, ICL670, Exjade®, Osveral®, Desirox®, Defrijet®, Asunra®, Desifer® or Jadenu™ is an oral chelator available for routine use. It is approved for the treatment of secondary iron overload by the US Food and Drug Administration (FDA) (FDA 2005) and the European Medicines Agency (EMA) (EMEA 2007).
Adverse effects (AEs) known from experiences in people with thalassaemia include gastrointestinal disturbances (nausea, stomach pain or diarrhoea) that have generally been mild and a diffuse rash being more common at higher doses (Cappellini 2006). More rarely, fever, headache and cough have been encountered. The main AE with the use of deferasirox seems to be a mild to moderate elevation of the creatinine level in approximately a third of individuals. Elevations of liver enzyme levels have also been described with a lower incidence (5.6%) (Cappellini 2006). As with standard therapy (deferoxamine), hearing loss and ocular disturbances including cataracts and retinal disorders have been reported with a very low incidence (less than 1%).
With wider use outside of clinical studies, other more severe AEs have been reported, such as cytopenias, Fanconi syndrome and renal failure (Grange 2010; Rafat 2009; Yew 2010), liver failure and gastrointestinal bleeding, which resulted in a boxed warning by the FDA (FDA Boxed Warning 2010).
Deferoxamine (DFO, Desferal®), a further iron chelator, which was reviewed in detail in a Cochrane Review (Fisher 2013a), has been the treatment of choice for iron overload for the last 40 years. Due to its long availability it is the only chelating agent for which a profound effect on the long‐term survival of a large cohort of people with thalassaemia has been shown (Borgna‐Pignatti 2004; Brittenham 1994; Gabutti 1996; Zurlo 1989). To be clinically effective, deferoxamine has to be administered as a subcutaneous, or less often an intravenous, infusion over 8 to 12 hours, five to seven days per week. This regimen has been demonstrated to reduce the body iron load, prevent the onset of iron‐induced complications and even reverse some of the organ‐damage due to iron (Davis 2004; Olivieri 1994). But the arduous schedule of overnight subcutaneous infusions often leads to reduced adherence (Cappellini 2005a; Modell 2000; Olivieri 1997). Another problem concerns the toxicity of deferoxamine, particularly at higher doses. Toxicities beside local skin reactions include ophthalmologic (optic neuropathy, retinal pigmentation) and hearing problems (high frequency sensorineural hearing loss). Rare AEs, such as growth retardation, renal impairment (Koren 1991), anaphylactic reactions and pulmonary fibrosis (Freedman 1990) have been reported. The high cost of deferoxamine (approximately USD 10,000 per year) (Delea 2008) and the consumables required (e.g. balloon infusers, which imply additional costs) as well as its complicated mode of administration limit its use in low‐and middle‐income countries.
Oral preparations have been highly sought after for many years. In 1987 two studies showed that the orally active iron chelator deferiprone (1,2 dimethyl‐3‐hydroxypyrid‐4‐1, also known as L1, CP20, Ferriprox® or Kelfer) could achieve effective short‐term iron chelation (Kontoghiorghes 1987a; Kontoghiorghes 1987b). However, doubts on the efficacy to reduce liver iron and prevent liver damage arose due to individuals with progression to overt liver fibrosis (Olivieri 1998). However, the hypothesis of direct liver toxicity of deferiprone could not be confirmed (Wanless 2002; Wu 2006). In the meantime, several studies have shown the efficacy of deferiprone for iron chelation (Ceci 2002; Maggio 2002) and in particular its benefit on cardiac iron and cardiac morbidity (Peng 2008). Adverse effects include gastrointestinal disturbances, arthropathy, neutropenia and agranulocytosis (Hoffbrand 1989). Studies on combination therapy of deferoxamine and deferiprone have been performed, most of which showed additive rather than synergistic effects (Farmaki 2006; Galanello 2006; Kattamis 2003; Kolnagou 2008; Origa 2005; Tanner 2007). An extensive Cochrane Review on the effectiveness of deferiprone in people with thalassaemia was updated in 2013 (Fisher 2013b).
How the intervention might work
Deferasirox is an oral iron chelator which is rapidly absorbed after administration and has a bioavailability of about 70%. Safety and tolerability were shown to be reasonable in a randomised dose escalation study in people with β‐thalassaemia in 2003 (Nisbet‐Brown 2003). The elimination half‐life of 8 to 16 hours allows a once daily administration after the tablets have been added to water or juice. A newer formulation approved in 2015 in the USA (Jadenu™) (Novartis 2015) and in 2016 in the European Union (Exjade® film‐coated tablets) (EMA 2016) allows people to swallow the tablets with water directly. Containing the same active ingredient with comparable pharmacokinetics, the formulation was approved based on safety and efficacy studies investigating the original tablet for suspension (Chalmers 2016).
As deferasirox is a tridentate chelator, two molecules of deferasirox are needed to bind one molecule of iron. The excretion of the bound iron is mainly via faeces.
Why it is important to do this review
Deferoxamine necessitates serious commitment from the user and due to its AEs, deferiprone is only approved as second‐line therapy in some countries. Thus, much hope is being placed in the newer oral chelator deferasirox which apparently offers a promising line of treatment due to its iron chelation properties and safety and tolerability profile (Cappellini 2007). Therefore, an update of our previous Cochrane Review of the effectiveness and safety of deferasirox according to state of the art Cochrane standards is needed in the light of several studies being recently published (Meerpohl 2012).
Objectives
To evaluate the effectiveness and safety of oral deferasirox for management of iron overload in people with thalassaemia.
Methods
Criteria for considering studies for this review
Types of studies
Randomised controlled studies (RCTs) were considered for this review.
Types of participants
People with thalassaemia regardless of age, type of thalassaemia (e.g. thalassaemia major, thalassaemia intermedia) and setting (e.g. country, primary or secondary care), who have developed iron overload (defined as ferritin levels of over 1000 ng/mL on at least two occasions in individuals with transfusion‐dependent thalassaemia and over 300 ng/mL in those with non‐transfusion‐dependent thalassaemia). People with thalassemia who have undergone stem cell transplantation (SCT) are excluded.
Types of interventions
For oral deferasirox (all schedules and doses) the following comparisons were considered:
-
deferasirox compared with no therapy or placebo in people with transfusion‐dependent thalassaemia;
-
deferasirox compared with no therapy or placebo in people with non‐transfusion‐dependent thalassaemia;
-
deferasirox compared with another iron‐chelating treatment (i.e. deferoxamine or deferiprone or any combination thereof) in people with transfusion‐dependent thalassaemia;
-
deferasirox compared with another iron‐chelating treatment (i.e. deferoxamine or deferiprone or any combination thereof) in people with non‐transfusion‐dependent thalassaemia.
However, the necessity of chelation therapy in iron‐overloaded people is well‐established and, if at all, only short‐term (e.g. pharmacokinetic studies) would be ethically justifiable. Longer‐term studies with no therapy or placebo in people with transfusion‐dependent thalassemia would not suffice the paradigm of equipoise.
Types of outcome measures
Primary outcomes
-
Overall mortality measured at any point in time
Secondary outcomes
-
Reduced end‐organ damage due to iron deposition
-
cardiac failure (necessitating medical treatment)
-
endocrine disease (necessitating substitution hormone therapy or treatment of diabetes)
-
histological evidence of hepatic fibrosis
-
pathological surrogate markers of end‐organ damage (i.e. elevated liver enzymes, elevated fasting glucose or pathological oral glucose tolerance test (OGTT), pathological measures (e.g. ejection fraction in echocardiography)
-
-
Measures of iron overload
-
serum ferritin (ng/mL)
-
iron levels in biopsies of liver and other tissue (mg/g liver dry weight)
-
tissue iron assessment by superconducting quantum interference device (SQUID) (mg/g liver wet weight)
-
tissue iron assessment by magnetic resonance imaging (MRI) (ms)
-
responder analysis (deletion of body iron, depending on study definition)
-
-
Measures of iron excretion (urine and faeces) over 24 hours (mg/kg/day)
-
Any AEs
-
raised levels of creatinine or kidney failure (above upper normal limit or rise of more than 20% above baseline level)
-
skin rash
-
gastrointestinal disturbances
-
neutropenia or agranulocytosis (absolute neutrophil count (ANC) less than 1000/µl or less than 500/µL)
-
raised levels of liver enzymes (above upper normal limit or rise of more than 20% above baseline level) or progression to liver fibrosis
-
hearing loss
-
eye problems (e.g. retinal toxicity)
-
unanticipated AEs as reported in the primary studies
-
-
Participant satisfaction (measured e.g. by a validated questionnaire) and adherence to chelation treatment (measured by the number of people in each arm that show adequate level of adherence to treatment (intake or application of iron chelator on five or more days per week))
-
Cost of intervention per year
Data from outcomes not defined a priori but which have arisen from the review were also collected, if the outcome was considered to be of clinical relevance.
Data were extracted at longest follow‐up.
Search methods for identification of studies
No language restriction was applied.
Electronic searches
We searched for relevant studies in the Cystic Fibrosis and Genetic Disorders Group's Haemoglobinopathies Trials Register using the terms: (thalassaemia OR haemoglobinopathies general) AND ICL670(A).
The Haemoglobinopathies Trials Register is compiled from electronic searches of the Cochrane Central Register of Controlled Trials (CENTRAL) (updated each new issue of the Cochrane Library) and quarterly searches of MEDLINE. Unpublished work is identified by searching the abstract books of five major conferences: the European Haematology Association conference; the American Society of Hematology conference; the British Society for Haematology Annual Scientific Meeting; the Caribbean Health Research Council Meetings; and the National Sickle Cell Disease Program Annual Meeting. For full details of all searching activities for the register, please see the relevant section of the Cochrane Cystic Fibrosis and Genetic Disorders Group's website.
Date of most recent search of the Group's Haemoglobinopathies Trials Register: 12 August 2016.
We also searched:
-
Cochrane Database of Systematic Reviews (2015, Issue 8); Cochrane Central Register of Controlled Trials (CENTRAL; 2015, Issue 7); Database of Abstracts of Reviews of Effect (DARE; 2015, Issue 2); Health Technology Assessment Database (2015, Issue 3); NHS Economic Evaluation Database (2015, Issue 2); Cochrane Methodology Register (2012, Issue 3) in the Cochrane Library www.thecochranelibrary.com (searched 6 August 2015);
-
MEDLINE OvidSP (2010 to July Week 5 2015);
-
MEDLINE OvidSP in Process and Other Non‐Indexed Citations (searched 05 August 2015);
-
MEDLINE OvidSP Daily Update (searched 05 August 2015)
-
Embase OvidSP (2010 to 05 August 2015);
-
PubMed www.pubmed.com [limited to MEDLINE subset "supplied by publisher"] (1946 to 06 August 2015);
-
Web of Science Core Collection via Thomson Reuters (2010 to 04 August 2015);
-
Biosis Previews via Thomson Reuters (2010 to 04 August 2015);
-
Google www.google.com – searched for "Osferal" and also "Osveral" (searched 07 January 2016)
An RCT filter was used for searches in MEDLINE, Embase, Biosis Previews and Web of Science Core Collection. In MEDLINE, we used the "Cochrane Highly Sensitive Search Strategy for identifying randomized trials in MEDLINE: sensitivity‐maximizing version (2008 revision); Ovid format" (Lefebvre 2011), but we replaced "randomized" with "randomi#ed". For Embase, Biosis Previews and Web of Science Core Collection, we devised the search for RCTs and used textwords from the Cochrane RCT Filter we used for the MEDLINE search. For details of the search strategies see Appendix 1.
Regarding the search with Google, we screened the first 50 results of both searches. Every link which was suspected to obtain a relevant study was looked at.
Since research into deferasirox treatment is ongoing, we searched the following trial registers for all years available in all possible fields using the basic search function (using separately the following keyword terms: "deferasirox", "ICL670", "ICL 670", "exjade", "desirox" and "jadenu"):
-
ClinicalTrials.gov: www.clinicaltrials.gov (searched 07 August 2015);
-
ICTRP: www.who.int/ictrp/en/ (searched 07 August 2015);
-
German Clinical Trial Register: www.drks.de (searched 07 August 2015).
For the previous version of this review, several databases and ongoing trials registers were searched from 24th June to 1st July 2010. Please see Appendix 2 for full details.
Searching other resources
Additionally, reference lists of all identified primary papers were screened to identify other potentially relevant citations.
Contact was made with selected experts in the field as well as the manufacturer of deferasirox (Novartis) to request information on any unpublished studies that involved deferasirox.
Data collection and analysis
Selection of studies
One author (JM; for the update: CB or LS) screened all titles and abstracts of papers identified by the search strategies for relevance. We only excluded citations which were clearly irrelevant at this stage. We obtained full copies of all potentially relevant papers. At this stage two review authors (JM and DB; for the update: CB and RA or LS and JM) independently screened the full papers, identified relevant studies and assessed eligibility of studies for inclusion. We resolved any disagreement on the eligibility of studies through discussion and consensus or if necessary through a third party (GA; for the update: JM). We excluded all irrelevant records and recorded details of the studies and the reasons for exclusion.
Data extraction and management
In addition to details relating to the risk of bias of the included studies, we extracted two sets of data.
-
Study characteristics: place of publication; date of publication; population characteristics; setting; detailed nature of intervention; detailed nature of comparator; and detailed nature of outcomes. A key purpose of this data was to define unexpected clinical heterogeneity in included studies independently from the analysis of the results.
-
Results of included studies with respect to each of the main outcomes indicated in the review question. We carefully recorded reasons why an included study did not contribute data on a particular outcome and considered the possibility of selective reporting of results on particular outcomes.
Two review authors (JM, DB; for the update: CB and RA or LS and JM) independently undertook data extraction using a data extraction form developed by the authors (except for one Chinese study which was extracted by one Chinese reviewer only). The review authors resolved any disagreements by consensus or through discussion with a third review author (GA ; for the update: JM). Once we had resolved disagreements, we recorded the extracted data on the final data extraction form. One review author (JM; for the update: CB or LS) transcribed these into RevMan 5.3 (Review Manager 2014). Another review author (DB; for the update: JM) verified all data entry for discrepancies. We extracted data primarily from full publications of studies; however, if additional abstracts or results records in clinicaltrials.gov were available, these data were also considered. When only abstracts were available, we extracted data therefrom as far as possible.
Assessment of risk of bias in included studies
Two review authors (JM, DB; for the update: CB, RA or LS, JM) assessed every study using a simple risk of bias form and following the domain‐based evaluation as described in the Cochrane Handbook for Systematic Reviews of Interventions (Higgins 2011a).
We assessed the following domains as having either a low, unclear, or high risk of bias:
-
randomisation;
-
concealment of allocation;
-
blinding (of participants, personnel and outcome assessors);
-
incomplete outcome data;
-
selective outcome reporting;
-
other sources of bias.
We reviewed the assessments and discussed any inconsistencies between the review authors in the interpretation of inclusion criteria and their significance to the selected studies. We resolved any disagreements through discussion with a third author (GA or JM). We did not automatically exclude any study as a result of a rating of 'unclear risk of bias' or a 'high risk of bias'. We presented the evaluation of the risk of bias in included studies in tabular form in the Results section of the review.
Measures of treatment effect
We analysed extracted data using the most up‐to‐date version of the RevMan 5 software available at the time of analysis (Review Manager 2014).
We planned to extract hazard ratios (HR) with their 95% confidence intervals (CI) for the time‐to‐event outcomes mortality and end‐organ damage. If reports did not provide HRs, we planned to use indirect estimation methods described by Parmar and Williamson to calculate them (Parmar 1998; Williamson 2002).
If we were unable to either extract these data from the study reports or receive the necessary information from the primary investigators, alternatively we used, where appropriate, the proportions of participants with the respective outcomes measured at certain time points (i.e. three months, six months, then six‐monthly intervals) to be able to calculate risk ratios (RR). We also extracted data from other time points if available.
We expressed any results for binary outcomes as RR with 95% CIs as measures of uncertainty. Continuous outcomes were expressed as mean differences (MD) with 95% CIs as measures of uncertainty.
Outcomes were not described as means and standard deviations (SD) in all studies, therefore, in order to enter and analyze as many data in RevMan as possible, we undertook further calculations wherever possible. If studies only reported median and range, CI or interquartile range, we estimated means and SDs as described by Wan (Wan 2014). If studies only reported standard error (SE) of the mean (SEM), we used the following calculation: SD = SEM*sqrt(n). If studies provided P values, n and mean, we calculated the SD with the calculator integrated in RevMan 5 (Review Manager 2014). If studies provided Z values, we calculated the SD for the change from baseline. For heavily skewed data, analysis based on means is not appropriate. Although the study authors did not always explain the reasons, means were presented as geometric means (Gmeans) in some cases. We therefore analysed the data on a log scale and report these data as the ratio of Gmeans.
Reporting of results was ambiguous in some studies, so we had to make the following assumptions.
-
One study reported the percentage of participants with dose reductions and interruption and the values for adherence, but the number of participants included for each outcome was not clear (Pennell 2014). For our analysis we assumed that all those who had received the study drug were included.
-
Where results of individual studies were displayed only graphically and we considered estimation to be reasonable, we estimated values visually from the graphs.
-
We assumed that the values of means and SD in neutrophil, alanine transaminase (ALT), aspartate transaminase (AST), and alkaline phosphatase (ALP) levels were confused in one study (Molavi 2014) so we used corrected values for our meta‐analysis.
-
A further study reported different P values for the same outcome "QoL (end of study‐baseline)" in the same journal publication (Elalfy 2015b). We calculated the SD for change from baseline using the most conservative P values given.
-
When the P value was reported as P < 0.001, we used P = 0.001 for our calculation of SD.
-
One study lost three participants across the term of the study (Elalfy 2015a). For calculating change from baseline, we included all 30 participants for our conservative analysis.
-
Sometimes we realised discrepancies in results reported in journal publications and in abstracts or trial registers. In these cases, we usually extract results from full journal publications.
-
For some outcomes, a possible perception of the comparison might be whether deferasirox is not inferior to standard treatment with deferoxamine. Therefore, for these outcomes a per protocol analysis might be chosen.
Unit of analysis issues
We found two three‐armed studies comparing the three different iron chelation monotherapies deferasirox, deferiprone and deferoxamine (Chirico 2013; Elalfy 2015a). To include the results in our meta‐analysis, we divided the number of participants in the deferasirox arms as suggested in chapter 16 of the Cochrane Handbook for Systematic Reviews of Interventions (Higgins 2011b).
One four‐arm study compared two different doses of deferasirox to equivalent placebos, but results of both placebo groups were not reported individually, so we split the placebo group for both comparisons (Taher 2012).
We did not include any cross‐over studies in this review. However, for future updates, we plan to use the methods recommended by Elbourne for combining results from such studies (Elbourne 2002). We will use the methods described by Curtin to combine results from parallel and cross‐over studies (Curtin 2002a; Curtin 2002b; Curtin 2002c).
The study investigators planned that the included phase III study would be a non‐inferiority study (Cappellini 2005b). Therefore, they did not report efficacy outcomes based on an intention‐to‐treat (ITT) analysis. For our review, we used the data as presented, i.e. per protocol.
We did not use any of the below mentioned strategies outlined by Witte (Witte 2004) in this version of the review, because only a few studies could be pooled per outcome. However, for future updates we will consider applying one of these strategies according to the data available.
-
If all studies report only an ITT analysis (or all studies report only a per protocol analysis), we will perform a non‐inferiority meta‐analysis based on Witte's 'perfect case' proposal.
-
If some studies report only an ITT analysis and others only a per protocol analysis (exclusively), we will perform meta‐regression with analysis type as a covariate.
-
If some studies report only an ITT analysis and others only a per protocol analysis, whilst others report both, we will undertake a sensitivity analysis.
-
If all studies give enough information to do both analyses, we will analyse data using a bivariate model.
To interpret results according to a non‐inferiority scenario, we will use the following definitions.
For time‐to‐event data, non‐inferiority is given, if the relative difference in HRs is less than 10%. For RRs, non‐inferiority is defined as a relative RR difference of less than 10% in treatment failures compared to standard therapy. For the continuous outcomes of "measures of iron overload and iron excretion" as well as "costs", a relative difference of less than 10% is considered equivalent.
Dealing with missing data
We contacted the original investigators to clarify some methodological issues and to request additional data from two studies during the development of the previous review version (Galanello 1999; Nisbet‐Brown 2001); however, to date, we have not received any additional data to that presented in the primary reports. For this version of the review, we contacted investigators of 11 studies (Chirico 2013; Elalfy 2015a; Elalfy 2015b; Habibian 2014; Hagag 2015; Kakkar 2014; Kakkar 2015; Molavi 2013; Molavi 2014; Pennell 2014; Taher 2012) and the manufacturer of deferasirox regarding two studies (Pennell 2014: Taher 2012). We could clarify some issues and the original investigator confirmed that our list of included studies is complete. However, additional data on investigator‐sponsored studies have to be requested via a data request platform in most cases. We plan to request available data via this platform for all manufacturer sponsored studies for a future update.
Assessment of heterogeneity
Where feasible, we considered clinical heterogeneity by presenting results of subgroups according to differences in dose of intervention and baseline measures of iron overload. We examined statistical heterogeneity in the results of studies using the I² and Chi² statistics (Higgins 2002; Higgins 2003).
Assessment of reporting biases
We made a great effort to identify unpublished studies and minimise the impact of possible dissemination bias by using a comprehensive search strategy and contacting the manufacturer of deferasirox for the previous version. We did not use funnel plots to assess dissemination bias, since asymmetry is difficult to detect with a small number of studies (i.e. less than 10) and we could only include 16 studies overall in this review, with no more than eight studies per outcome. If in future we are able to include more than 10 studies for a given outcome in the review, we will use funnel plots to graphically assess the likelihood of dissemination bias. We took care in translating the results of the included studies into recommendations for action by involving all review authors in drawing conclusions.
Data synthesis
While extracting data, we had to take the following decisions. Although we would have preferred to consistently present data separately for the different dose groups, we decided to pool safety data of the different dose groups from the Nisbet‐Brown study, since splitting the placebo group (N = 5) did not seem reasonable due to the small size (Nisbet‐Brown 2001). Due to the huge amount of different AE types reported, we decided to pool AEs for the different dose groups for three studies rather than presenting the various subgroups for all AEs (as in the previous version of this review) (Cappellini 2005b; Piga 2002; Taher 2012).
We conducted meta‐analyses of pooled data from all contributing studies using a fixed‐effect model. We took heterogeneity of the pooled data into account by using subgroup analysis or the random‐effects model (or both) (see Effects of interventions for specific details).
'Summary of findings' tables
We created 'Summary of findings' tables for each comparison apart from deferasirox versus placebo in people with transfusion‐dependent thalassemia, because abstaining from iron chelation treatment in this patient group is ethically not justified and therefore not patient‐relevant.
The following outcomes were selected for presentation in the 'summary of findings' tables because we considered these outcomes most relevant for decision‐making given the limitations of the available evidence:
-
overall mortality measured at any point in time;
-
responder analysis (deletion of body iron, depending on study definition);
-
serum ferritin (ng/mL);
-
iron levels in liver measured by biopsies (mg/g liver dry weight) or SQUID (mg/g liver wet weight) or MRI (ms);
-
adherence to chelation treatment (measured by the number of people in each arm that show adequate level of adherence to treatment (intake or application of iron chelator on five or more days per week, or number of patients who discontinued as form of adherence));
-
participant satisfaction (measured e.g. by a validated questionnaire);
-
AEs: raised levels of creatinine or kidney failure (above upper normal limit or rise of more than 20% above baseline level).
We used the five Grading of Recommendations Assessment, Development and Evaluation (GRADE) considerations (risk of bias, inconsistency, indirectness, imprecision and publication bias) to assess the quality of the body of evidence as it relates to the studies that contributed data to the meta‐analyses as described in chapters 11 and 12 of the Cochrane Handbook for Systematic Reviews of Interventions (Higgins 2011). We used footnotes to justify all decisions to down‐ or upgrade the quality of evidence and we made comments to aid readers’ understanding of the review where necessary. We generated 'Summary of findings' tables using the Gradepro software (GRADEpro GDT 2015).
Subgroup analysis and investigation of heterogeneity
If data were available, we presented subgroups according to baseline measures of iron overload or doses of intervention as they were reported in the studies. If relevant, other subgroup analysis as defined in study publications are presented. Due to the amount of reported adverse events, we merged AEs for different subgroups. For future updates of this review, we will assess clinical heterogeneity, if possible, in addition by examining differences due to:
-
age of participants (e.g. zero to two years, three to five years, 6 to 11 years; 12 to 17 years, 18 years or older);
-
age at commencement of the intervention (e.g. zero to two years, three to five years, 6 to 11 years, 12 to 17 years, 18 years or older).
Additional subgroup analyses are planned for different:
-
subtypes of thalassaemia (e.g. thalassaemia major, thalassaemia intermedia, haemoglobin E thalassaemia) where applicable.
Sensitivity analysis
We were only able to include a maximum of nine published studies for each of our comparisons and no additional unpublished studies nor studies with a low risk of bias were identified. Due to missing data regarding SD, we did some calculations according to Wan and undertook sensitivity analysis (Wan 2014). For future updates of this review, we plan to perform additional sensitivity analyses based on assessment of risk of bias (evaluating only studies of low risk of bias) and publication status (unpublished and published studies).
Results
Description of studies
Results of the search
Updated searches
The updated searches for this current version of the review (last search ran in August 2016) identified 1211 citations, including 477 duplicates (Figure 1). The title and abstract screening of the remaining 734 citations identified 71 as potentially eligible for this review. After screening of the full texts, eight new studies (described in 23 references) and a reference to a previously included study were included in the updated version of this review. Four additional studies (reported in five references) were identified through Google‐searches resulting overall in a total of 16 included studies.

Study flow diagram.
Previous searches
For the previous version of this review, the last search was run in November 2011 (see Figure 1). Altogether, 2171 citations, including 1195 duplicates, were identified. After title and abstract screening of the 976 unique citations, 687 citations could be excluded. A total of 289 full texts were screened and four RCTs (described in 33 references) were identified (Cappellini 2005b; Galanello 1999; Nisbet‐Brown 2001; Piga 2002).
The search of the three trial registers (last run on 30 June 2010) identified 49 unique references to studies. One ongoing RCT was identified, which has now been published and was therefore included in this updated review (Pennell 2014).
Included studies
Sixteen studies met the inclusion criteria (Characteristics of included studies) including 1807 randomised participants (range 23 to 586 per study). Twelve studies included two treatment arms comparing deferasirox to placebo (Galanello 1999; Nisbet‐Brown 2001) or deferoxamine (Cappellini 2005b; Habibian 2014; Hassan 2016; Molavi 2013; Peng 2013; Pennell 2014; Piga 2002;) or deferiprone (Sanjeeva 2015) or comparing the combination of deferasirox and deferoxamine to deferoxamine alone (Molavi 2014). One study compared the combination of deferasirox and deferiprone to deferiprone in combination with deferoxamine (Elalfy 2015b). Three studies included three treatment arms comparing deferasirox to deferoxamine and deferiprone (Chirico 2013; Elalfy 2015a) or the combination of deferasirox and deferiprone to deferiprone and deferasirox monotherapy respectively (Kakkar 2014). One study included four treatment arms, comparing two different doses of deferasirox to matching placebo groups (Taher 2012). One identified abstract is a report of a previously included study (Cappellini 2005b).
1. Transfusion‐dependent thalassaemia: deferasirox versus placebo
The two relevant studies comparing deferasirox to placebo are short‐term studies examining mainly safety and pharmacokinetic outcomes while on deferasirox therapy (Galanello 1999; Nisbet‐Brown 2001).
The first study was reported in one full article and one abstract (Galanello 1999). Twenty‐four individuals were allocated to three groups: all groups received two single doses of deferasirox at an interval of at least seven weeks. Group 1 received single doses of 2.5 mg/kg and 20 mg/kg, Group 2 single doses of 5 mg/kg and 40 mg/kg and Group 3 single doses of 10 mg/kg and 80 mg/kg. In each treatment period, two of eight participants received placebo in such a way that a given participant did not receive placebo more than once. Usual deferoxamine and transfusion therapy was given in the interval between the two doses. This study by Galanello on deferasirox focused on safety, tolerability and pharmacokinetics.
The second study was reported in one full article and two abstracts (Nisbet‐Brown 2001). It was designed as a dose‐escalation study focusing on effectiveness and safety; treatment duration was 12 days. A total of 23 individuals were randomly assigned to placebo (n = 5), 10 mg/kg/day of deferasirox (n = 5), 20 mg/kg/day of deferasirox (n = 6) and 40 mg/kg/day of deferasirox (n = 7). Primary objectives included assessment of safety and tolerability (measured by adverse events and clinical laboratory monitoring), pharmacokinetics (measured as drug and drug‐iron complex), and cumulative net iron excretion (measured by faecal and urine output minus food input).
2. Transfusion‐dependent thalassaemia: deferasirox versus deferoxamine
One of the seven studies comparing deferasirox to deferoxamine was reported in one full article and four abstracts (Piga 2002). This is a randomised open‐label phase II study including 71 people with β‐thalassaemia aged over 18 years from four centres in Italy. The primary objective was to determine the safety and tolerability of deferasirox at daily doses of 10 and 20 mg/kg in comparison with a standard dose of deferoxamine 40 mg/kg in individuals with transfusional haemosiderosis. Secondary objectives included evaluation of the effects of deferasirox on liver iron concentration (LIC), serum ferritin, serum iron, transferrin and transferrin saturation. The ITT principle was used for analyses.
Results from the second study were reported in five full articles, 19 abstracts (and two responses to letters) (Cappellini 2005b). This phase 3 open‐label randomised study was planned as a non‐inferiority study with a predefined delta of 15% (two‐sided 95% CI). There were 591 participants actually randomised, but five withdrew consent prior to any study medication; 586 participants were included in the study, of which 541 completed one year of therapy. After randomisation, stratified by three age groups, people were assigned to a treatment dose of either deferasirox or deferoxamine according to baseline LIC; the mean ratio of doses between deferasirox and deferoxamine varied from 1:5.5 to 1:1.8. The primary endpoint was maintenance or reduction of LIC. Secondary criteria for response included evaluation of the change in serum ferritin levels over time and evaluation of net body iron balance.
A third study, a randomised, controlled study in Iran, was reported in one journal article (Molavi 2013). A total of 138 people with thalassaemia major and intermedia with serum ferritin more than 1000 ng/mL and older than two years were randomised to 20 mg/kg oral Osveral® (Iranian generic product of deferasirox) daily or 40 mg/kg to 50 mg/kg subcutaneous Desferal® (deferoxamine) for six nights a week. Due to the different administration routes, we assumed that no blinding took place. Primary outcome was serum ferritin, secondary outcomes were serum levels of ALT, AST, creatinine, haemoglobin and drug side effects (leukopenia, thrombocytopenia).
A further study (reported in one full article in Chinese) compared deferasirox to deferoxamine and was a single‐centre RCT in China (blinding not mentioned) (Peng 2013). A total of 24 people with severe β‐thalassaemia were randomised to oral deferasirox 40 mg/kg daily or deferoxamine 50 mg/kg at least five days a week. During the 12 month follow up, serum ferritin and liver R2* were assessed.
A larger multi‐centre, open‐label study was reported in two full articles and two abstracts (Pennell 2014). A total of 197 people with β‐thalassaemia major (aged 10 years and over) were randomised to 40 mg/kg/day oral deferasirox or deferoxamine 50 mg/kg/day to 60 mg/kg/day as subcutaneous infusion over eight to 12 hours, five to seven days a week. Regarding the primary outcome, change in myocardial T2* during one year follow‐up, the study was designed as a non‐inferiority study with a non‐inferiority margin of 90%. Secondary endpoints were change in left ventricular ejection fraction (LVEF), LIC and serum ferritin. Adverse events and adherence were also reported. Data from the one‐year extension phase were not included in this review due to the high number of individuals who did not continue with deferoxamine therapy after the core phase.
A small study including 30 people with thalassaemia major was only reported in a conference abstract (Habibian 2014). After 12 months, serum ferritin was measured. More information regarding dosing or other outcomes was not reported.
One study, reported in a journal publication, investigated 60 individuals with thalassaemia major (Hassan 2016). Participants were randomised to receive deferasirox (single oral daily dose of 20 to 40 mg/kg/day) or deferoxamine (20 to 50 mg/kg/day via a subcutaneous infusion over 8 to 10 hours, five days a week) for one year. Serum ferritin, ALT, AST, blood urea, serum creatinine, neutrophilic and platelet counts and some adverse events were reported.
3. Transfusion‐dependent thalassaemia: deferasirox versus deferiprone
One single randomised study compared deferasirox 20 mg/kg/day to deferiprone 75 mg/kg/day divided in three doses (Sanjeeva 2015). The study included 41 regularly transfused children with ferritin over 1000 ng/mL who were not on chelation therapy previously. Serum ferritin level (primary outcome) and AEs (secondary outcomes) were assessed during a follow up of 12 months. The study was reported as a journal article and a doctoral thesis.
4. Transfusion‐dependent thalassaemia: deferasirox and deferoxamine versus deferoxamine
The combination of deferasirox (20 mg/kg to 40 mg/kg) and deferoxamine (50 mg/kg, three times a week) was compared to deferoxamine monotherapy in one study, reported in one journal article (Molavi 2014). A total of 100 people with thalassaemia major were randomised to one of the groups at a medical centre in Iran. Six participants were excluded after randomisation but before start of the study. Serum ferritin, liver enzymes, ALP, neutrophils, creatinine and haemoglobin were measured.
5. Transfusion‐dependent thalassaemia: deferasirox and deferiprone versus deferiprone and deferoxamine
One randomised study included two treatment arms and compared two combination regimes: the first group received oral deferiprone 75 mg/kg/day divided into two doses and deferoxamine 40 mg/kg/day by subcutaneous infusion over 10 hours for six days a week, the second group received in addition to deferiprone (75 mg/kg/day) deferasirox 30 mg/kg/day for seven days a week (Elalfy 2015b). The open‐label study was reported in one full article and two abstracts. A total of 96 people with thalassaemia major were randomised into two equal groups. Primary outcomes were change in serum ferritin, LIC and cardiac MRI, secondary outcomes were AEs, serious AEs (SAEs), participant's adherence, participant's satisfaction and health‐related quality of life.
6. Transfusion‐dependent thalassaemia: deferasirox versus deferoxamine versus deferiprone
Two studies compared all three iron‐chelators against each other (Chirico 2013; Elalfy 2015a).
The first study was published as one full article and one abstract (Chirico 2013). The full study had a duration of eight years, but only the last two years were designed as a randomised controlled study. A total of 37 individuals who had not developed a thyreopathy under treatment with deferoxamine in the last six years were randomised to either deferasirox (n = 12), deferoxamine (n = 13) or deferiprone (n = 12) monotherapy. The number of participants with thyroid disease and serum ferritin after two years of follow‐up were reported.
The other study comparing the three iron chelator monotherapies was reported in one full‐text and two abstracts (Elalfy 2015a). The aim of this study was to investigate the effects of vitamin C as an adjuvant therapy to iron chelation in a factorial study with six arms. Therefore, 180 people with iron‐overloaded thalassaemia major with serum ferritin from 1000 ng/mL to 2500 ng/mL and vitamin C deficiency were randomised in a 1:1:1 ratio to deferoxamine 40 mg/kg/day (five days a week), deferiprone 75 mg/kg/day or deferasirox 25 mg/kg/day. Participants were further equally randomised either to receive vitamin C supplementation (100 mg daily) or not. The primary efficacy endpoint was change of serum ferritin, LIC and cardiac MRI T2* during one year of follow‐up. The occurrence of any adverse effects was a secondary outcome measure.
7. Transfusion‐dependent thalassaemia: deferasirox versus deferiprone versus deferasirox and deferiprone
In one study, 40 people were randomised to deferasirox 30 mg/kg/day to 40 mg/kg/day (n = 10), deferiprone (75 mg/kg/day to 100 mg/kg/day) (n = 10), or both drugs administered sequentially every alternate week (n = 20) (Kakkar 2014). Cardiac and liver MRI, serum ferritin, complete blood count (CBC), liver enzymes and renal function tests were performed. Duration of follow‐up was not reported. The study was only reported as a conference abstract.
8. Non‐transfusion‐dependent thalassaemia: deferasirox compared to placebo
One study included participants with non‐transfusion‐dependent thalassaemia with iron overload (Taher 2012). We identified no other RCT evaluating people with non‐transfusion‐dependent thalassaemia. A total of 166 individuals were randomised in a 2:1:2:1 ratio to starting doses of 5 or 10 mg/kg/day or matching placebos. The primary efficacy endpoint was the change in LIC during the 52‐week treatment duration. Secondary endpoints were change in serum ferritin, correlation of serum ferritin and LIC, AEs and adherence. The study lasted for one year and was published in two journal publications and six abstracts.
Excluded studies
Updated searches
Several reports of the extension phases of studies were not included, since after completion of the core first year, cross‐over to deferasirox treatment took place during the extension phase (Cappellini 2005b; Taher 2012). Therefore, data collected during the extension phase represent observational data on a large cohort of deferasirox‐treated individuals; there is no longer a comparison group and participants were not analysed according to their initially assigned group. Due to a high number of participants who did not continue in the deferoxamine treatment group after the core phase, the extension phase of the Pennell study was also excluded (Pennell 2014).
Overall, the reasons for exclusion of 44 reports were:
-
included people with disease other than thalassaemia (n = 3);
-
included people with thalassaemia who had received curative stem cell transplantation (n = 5);
-
review/other, no primary data containing articles (n = 3);
-
intervention/comparison other than deferasirox (n = 2);
-
pharmacokinetic studies (n = 2);
-
non‐randomised data on participants with thalassaemia (n = 29)
-
-
extension phases of core studies (n = 13)
-
other non‐randomised data (n = 16).
-
Previous searches:
256 references were excluded. Reasons for exclusion were:
-
included people with disease other than thalassaemia
-
only sickle cell disease (n = 16)
-
only myelodysplastic syndrome (n = 53)
-
other condition (n = 9);
-
-
review article, editorial or comment (n = 49);
-
intervention other than deferasirox (n = 2);
-
cost‐effectiveness analysis (n = 8);
-
non‐randomised data on people with thalassaemia (n = 119) (for selected references see Characteristics of excluded studies)
-
-
EPIC study (n = 16)
-
ESCALATOR study (n = 13)
-
extension phases of core studies (n = 21)
-
other non‐randomised data (n = 69).
-
Studies awaiting classification and ongoing studies
Three studies identified through searches in electronic databases were classified as 'awaiting classification', because it was not clear if randomisation of participants really took place in two studies (Hagag 2015; Ansari 2015;) and the conference abstract of another study did not mention the number of included participants (Kakkar 2015). Authors of all studies were contacted for clarification; however, we have not yet received any further information.
The searches in trial registers identified four ongoing studies (Cutino 2009; DEEP‐2 2012; NCT02125877; NCT02435212) as well as two unpublished completed studies (EUCTR2010‐023217‐61‐GB; NCT02198508). The Google search also revealed a registry entry of an RCT in the Iranian Registry of Clinical Trials, which met our inclusion criteria and was added as study awaiting classification IRCT201110087677N1).
We contacted the investigators of unpublished completed studies (as far as contact addresses could be identified) to request information on study results. If these studies are published within two years of this update (as per the standard Cochrane updating guidelines), this will trigger an earlier update of this review.
Risk of bias in included studies
The risk of bias for the 16 included studies in this review was classified as previously described (Assessment of risk of bias in included studies).
The three blinded studies comparing deferasirox to placebo were judged overall as having an 'unclear' risk of bias (Galanello 1999; Nisbet‐Brown 2001; Taher 2012). These assessments were mainly based on the inadequate reporting of several of the criteria that are considered to be important in the evaluation of methodological rigour in terms of study design and conduct.
All other included studies were predominantly classified as having an overall 'high' risk of bias, mainly due selective reporting of secondary outcomes and lack of blinding.
For further details see the risk of bias tables in Characteristics of included studies, the risk of bias graph (Figure 2) and the risk of bias summary (Figure 3).
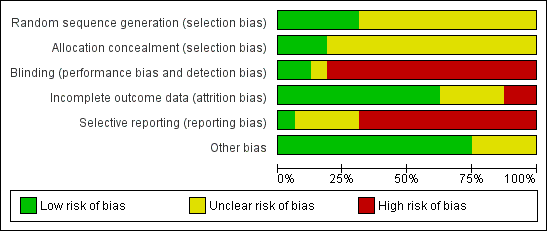
Risk of bias graph: review authors' judgements about each risk of bias item presented as percentages across all included studies.
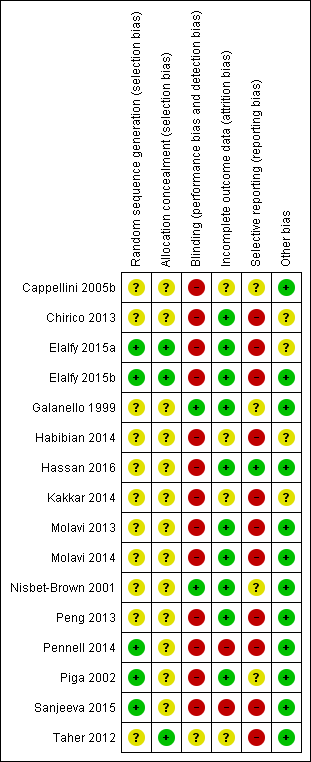
Risk of bias summary: review authors' judgements about each risk of bias item for each included study.
Allocation
The methods to generate the allocation sequence were not described in 11 studies (Galanello 1999;Habibian 2014; Hassan 2016; Nisbet‐Brown 2001; Cappellini 2005b; Chirico 2013; Kakkar 2014; Molavi 2013; Molavi 2014; Peng 2013; Taher 2012). Three studies used computer‐generated randomisation sequences and were therefore assessed as low risk of bias (Elalfy 2015a; Elalfy 2015b; Sanjeeva 2015). One study used a "validated system that generates an automated random assignment of numbers to treatment groups" (Piga 2002). One study described randomisation based on permuted blocks which was considered as low risk of bias (Pennell 2014).
Since no details were given in the reports with regard to allocation concealment, it remains unclear whether allocation concealment was achieved in 12 studies (Cappellini 2005b; Chirico 2013; Galanello 1999; Habibian 2014; Hassan 2016; Kakkar 2014; Molavi 2013; Molavi 2014; Peng 2013; Pennell 2014Piga 2002; Sanjeeva 2015). One study reported using sealed envelopes but it was unclear if these were opaque and numbered (Nisbet‐Brown 2001). Three studies were assessed as low risk of bias regarding allocation concealment. One Elalfy study used opaque and numbered sealed envelopes (Elalfy 2015a), a second ensured allocation concealment through assigning participants to treatment groups by telephone contact from the co‐ordinating centre (Elalfy 2015b). In one study the investigator had to contact an interactive voice system to obtain the linked randomisation number (Taher 2012).
Blinding
Blinding was done in the three placebo‐controlled studies (Galanello 1999; Nisbet‐Brown 2001; Taher 2012), although in the Taher study blinding with regard to the different doses used was not done (Taher 2012).
The remaining 12 studies were open‐label, the reason being the obvious difference in application mode, deferasirox and deferiprone being orally taken, while deferoxamine needs to be applied subcutaneously over several hours and the different frequency of intake regarding both oral iron chelators. One study reported that "patients, physicians, laboratory staff and the epidemiologist who analysed the data were not aware of the intervention for each group" (Chirico 2013). However, no placebo treatment was mentioned, so we assumed that no adequate blinding took place.
Incomplete outcome data
Since the Cappellini and Pennell studies were planned as non‐inferiority studies, efficacy data were not consistently reported on an ITT basis (Cappellini 2005b; Pennell 2014). In the Pennell study, the provided ITT analysis did not include all randomised participants (Pennell 2014). Two studies did not address how many participants reached the end of the study (Habibian 2014; Kakkar 2014). One study reported three dropouts due to AEs; a per protocol analysis was done for most of the outcomes, which was assessed as having a high risk of bias (Sanjeeva 2015). One of the Elalfy studies reported discontinuing participants in an abstract publication, whereas in a later full publication, all participants apparently reached the end of the study (Elalfy 2015b). One study reported that "efficacy was assessed for the full analysis set (all randomised patients)" in the journal publication, but the data set on clinicaltrials.gov states a lower number of analysed participants (Taher 2012). The author confirmed that the change could only be calculated for participants with both a baseline and at least one post‐baseline value. The remaining nine studies fully reported or addressed adequately incomplete outcome data (Chirico 2013; Elalfy 2015a; Galanello 1999; Hassan 2016; Molavi 2013; Molavi 2014; Nisbet‐Brown 2001; Peng 2013; Piga 2002).
Selective reporting
Only one study was assessed as low risk of bias regarding selective reporting (Hassan 2016). Data on a broad spectrum of AEs were usually collected. However, only limited AE data were reported, often only qualitatively. Commonly, laboratory parameters were apparently measured but not reported. However, end of study results for the primary outcome were reported in all studies.
Evidence of publication bias could not be detected.
Other potential sources of bias
Four studies were assessed as unclear, because no or limited information on baseline characteristics was provided (Chirico 2013; Elalfy 2015a; Habibian 2014; Kakkar 2014).
Support and sponsorship
Six studies were conducted with support and involvement of the producer of deferasirox (Novartis) (Cappellini 2005b; Galanello 1999; Nisbet‐Brown 2001; Pennell 2014; Piga 2002; Taher 2012). Also, many authors of these studies were affiliated with Novartis. The relevance of these conflicts of interest is open to interpretation. Four studies declared to have no conflicts of interest (Chirico 2013; Elalfy 2015b; Elalfy 2015a; Hassan 2016), whereas conflicts of interest were not reported at all in five other studies (Kakkar 2014; Sanjeeva 2015; Molavi 2013; Molavi 2014; Habibian 2014 ). One study was funded by a public grant (Peng 2013).
Effects of interventions
See: Summary of findings for the main comparison Deferasirox compared to deferoxamine in people with transfusion‐dependent thalassemia; Summary of findings 2 Deferasirox compared to deferiprone in people with transfusion‐dependent thalassemia; Summary of findings 3 Deferasirox alone compared to combined deferasirox and deferiprone in people with transfusion‐dependent thalassemia; Summary of findings 4 Combined deferasirox and deferiprone compared to deferiprone alone in people with transfusion‐dependent thalassemia; Summary of findings 5 Deferasirox and deferoxamine compared to deferoxamine in people with transfusion‐dependent thalassemia; Summary of findings 6 Deferasirox and deferiprone compared to deferiprone and deferoxamine in people with transfusion‐dependent thalassemia; Summary of findings 7 Deferasirox compared to placebo in people with non‐transfusion‐dependent thalassemia
1. Transfusion‐dependent thalassaemia: deferasirox compared to placebo
Two studies compared deferasirox to placebo (Galanello 1999; Nisbet‐Brown 2001). Due to both its design and the presentation of results in the paper, data could not be extracted quantitatively from the Galanello study (Galanello 1999). Regarding safety data, it was not clear whether participants contributed more than one episode to the count of one AE (such as headache) since safety parameters were assessed after each dose. So, a single participant could theoretically contribute more than one episode of an event such as headache. For this reason, we do not present these data in a forest plot. We have contacted the authors but have not yet been able to clarify all details. Therefore, we decided to report important information in a narrative manner as done by Galanello (Galanello 1999).
Primary outcomes
1. Overall mortality measured at any point in time
No deaths were observed during these two short‐term studies (47 participants) (Galanello 1999; Nisbet‐Brown 2001) (Analysis 1.1).
Secondary outcomes
1. Reduced end‐organ damage due to iron deposition
No data on end‐organ damage were available from either study.
2. Measures of iron overload
Efficacy was not a focus of the Galanello study and no consistent trend on serum iron and transferrin could be observed (as expected after single‐dose administration) (Galanello 1999). Other measures of efficacy were not reported.
For the Nisbet‐Brown study, ferritin levels were reported at baseline and end of study for each group (Nisbet‐Brown 2001). However, since no SD was given for mean change of ferritin and since we were unable to obtain these data from the authors, the mean ferritin levels (µg/L) and SDs at baseline and end of study are presented here (as reported in the primary study):
| Serum ferritin (mean (SD) [µg/L]) | Placebo | 10 mg/day | 20 mg/day | 40 mg/day |
| Baseline | 4265 (3882) | 2452 (869) | 4753 (3168) | 2644 (1320) |
| End of study | 5215 (5430) | 2344 (1606) | 4872 (2511) | 1756 (793) |
We decided against estimating SDs because imputation from another study would require studies similar in design and conduct which are not available (due to the fact that we are dealing here with an early phase dose escalation study). We decided against use of post‐treatment values only, since there were large, clinically relevant differences between groups at baseline due to small sample size despite randomisation.
3. Measures of iron excretion (urine and faeces) over 24 hours (mg/kg/day)
In the Galanello study, the authors note that the majority of iron is excreted in the faeces; however, data are only given for urinary iron excretion (Galanello 1999). These data are presented as urinary iron excretion over 24‐hour intervals for each dose. To minimize the influence of outliers, medians and ranges are given (see table).
| Iron excretion over 24 hours: median (range) (mg/kg/24 hours) | ||||||
| Placebo | 2.5 mg deferasirox | 5 mg deferasirox | 10 mg deferasirox | 20 mg deferasirox | 40 mg deferasirox | 80 mg deferasirox |
| 0.017 (0.006 ‐ 0.629) | 0.009 (0.005 ‐ 0.031) | 0.010 (0.006 ‐ 0.028) | 0.010 (0.004 ‐ 0.014) | 0.016 (0.006 ‐ 0.119) | 0.193 (0.053 ‐ 0.508) | 0.391 (0.121 ‐ 0.842) |
Therefore, we were unable to extract these data to include them in the RevMan graphs. We are trying to obtain additional data on faecal iron excretion.
The Nisbet‐Brown study measured net iron excretion (Nisbet‐Brown 2001). Since the actual data were not given in the publications and we have not received these from the authors, we estimated the values from the figures of the paper and performed an analysis of variance for the three dose groups using the placebo group as reference (Software: R). The mean and SE (mg Fe/kg/day) are 0.03 (0.10) for placebo, 0.12 (0.14) for 10 mg/day deferasirox, 0.31 (0.14) for 20 mg/day and 0.47 (0.13) for 40 mg/day.
4. Any adverse events
Galanello reported that "Adverse events were infrequent and of mild intensity. The most frequently reported adverse event was headache, with no association to the dose level (four participants at 2.5 mg/kg, one participant at 20 mg/kg, and one participant at placebo). Nausea and diarrhoea occurred in the 80‐mg/kg group only (three of eight participants, all from one centre), suggesting that these symptoms were either drug related or possibly related to the dense oral suspension administered. Single occurrences of influenza, joint pain, and vertigo were not dose associated and were not suspected to be drug related. No consistent effect on individual laboratory values was observed. In single cases, hematological, biochemical, and special kidney parameters were outside the normal range, including at baseline, but no correlation with treatment could be observed. Notable parameters outside the normal ranges (and order of magnitude) were as follows: bilirubin, alanine aminotransferase, and aspartate aminotransferase (up to 1.5‐ to 3‐fold increase); alkaline phosphatase (up to 1.5‐fold increase); and creatinine kinase (0.3‐ to 0.6‐fold decrease). A couple of creatinine values were just below the normal ranges (with the exception of a single value observed at screening, which was below the lower limit by a factor of 0.8). Abnormally low hematocrit, haemoglobin, and erythrocytes were frequent but had no association to the dose level, while other hematological parameters were abnormally high, such as platelet, eosinophils, lymphocytes, monocytes, and neutrophils, with an order of magnitude of 1.2 to 1.5. These findings are suspected to be caused by the underlying disease and by frequent blood sampling during the study. As expected in this study population, all patients had elevated ferritin values prior to the study, ranging from 1422 to 4780 ng/mL. No notable change in the levels of the trace elements was observed (zinc, copper, magnesium, and calcium). Among the special kidney function parameters, values of α‐glutathione‐S‐transferase and β2‐ microglobulin were in single instances above the range of the normal values by a factor of 2‐ to 5‐fold (including at baseline) and, in the extreme case, by a factor of more than 10‐ and 30‐fold, respectively, for each parameter. The urinalysis sometimes showed pH values up to 6.5 to 7, as well as traces of urine bilirubin, glucose, ketones, leukocytes, and protein." (Galanello 1999).
Some data reported by Nisbet‐Brown regarding AEs (23 participants) (Analysis 1.2) could be extracted (Nisbet‐Brown 2001). Other safety and tolerability data are only available descriptively.
"No clinically relevant changes in any safety variable were seen between ICL670 and placebo groups. Specifically, no relevant changes were reported in haematological variables, mean concentrations of serum calcium, phosphorus, magnesium, uric acid, creatinine, urea nitrogen, albumin, creatine kinase, triglycerides, or total cholesterol. No abnormalities of renal sediment were noted. Further, no relevant changes from baseline in electrocardiographic, audiometric, or ophthalmologic examinations were noted, with the exception of one patient in whom a myelinated fibre bundle or retinal infarct was seen after seven days of treatment with ICL670 at 20 mg kg–1 day–1. This patient was reviewed by an independent ophthalmologist, and the change was thought to be secondary to his underlying diabetes mellitus. No significant changes between ICL670 and placebo were seen in copper or zinc concentrations in blood over the study period, indicating thus that ICL670 was highly selective for iron." (Nisbet‐Brown 2001).
5. Participant satisfaction and adherence
Only data on discontinuations due to serious adverse events could be extracted (Analysis 1.3). Nisbet‐Brown reported that nine participants in total discontinued treatment for serious AEs, eight of which where receiving deferasirox (24 participants) (Nisbet‐Brown 2001) (Analysis 1.3). However, two participants did not complete a single treatment day and only three discontinuations due to rash were deemed to be drug‐related.
6. Cost of intervention per year
No data on costs of intervention were available from either study (Galanello 1999; Nisbet‐Brown 2001).
7. Other additional outcomes
No other additional outcomes were reported.
2. Transfusion‐dependent thalassaemia: deferasirox compared to deferoxamine
Seven studies compared deferasirox to deferoxamine (Cappellini 2005b; Habibian 2014; Hassan 2016; Molavi 2013; Peng 2013; Pennell 2014; Piga 2002). Two additional studies compared all three iron chelators (Chirico 2013; Elalfy 2015a). To include data in the comparison of deferasirox and deferoxamine as well as deferasirox and deferiprone, the number of participants in the deferasirox group was split for each comparison.
While mainly earlier studies which specified the treatment used lower deferasirox doses (Cappellini 2005b: 5 to 30 mg/kg/day, Molavi 2013: 20 mg/kg/day, Piga 2002: 10 or 20 mg/kg/day, Elalfy 2015a: 25 mg/kg/day), newer studies extended the upper limit of doses to 40 mg/kg/day (Hassan 2016: 20 to 40 mg/kg/day, Peng 2013: 40 mg/kg/day, Pennell 2014: 40 mg/kg/day). Higher doses might affect safety and cause higher costs.
For the Cappellini study, discrepancies between those who discontinued (n = 29) or those who died (n = 4), who were not included in the primary efficacy population (n = 33) and those who did not complete one year of study (n = 45 according to the primary report and n = 29 according to the report on patient‐reported outcomes) were not clearly addressed (Cappellini 2005b). The success rate analysis (Analysis 2.16) was based on the primary efficacy population (n = 553), while changes in ferritin were based on n = 563 (Analysis 2.10), and both changes in LIC and iron excretion to intake ratio were based on those only who compared one year of study (n = 541) (per protocol analysis) (Analysis 2.14; Analysis 2.20). In the Elalfy study, participants were randomised twice: to three iron chelators and to treatment with vitamin C or no treatment with vitamin C, but results are only reported for those who received vitamin C (Elalfy 2015a).
Primary outcomes
1. Overall mortality measured at any point in time
Mortality was reported in eight studies (Cappellini 2005b; Hassan 2016; Molavi 2013; Elalfy 2015a; Pennell 2014; Chirico 2013; Peng 2013; Piga 2002). Piga 2002 reported mortality for both 10 and 20 mg/kg/day subgroups.There was no significant difference in mortality observed; data were pooled despite range from eight months to two years (1170 participants) (Analysis 2.1). However, the number of participants and in particular the number of events was limited. Cappellini reported that all four deaths were felt to be unrelated to the administration of the study drug by the independent Program Safety Board (Cappellini 2005b) (Analysis 2.1).
Secondary outcomes
1. Reduced end‐organ damage due to iron deposition
One study assessed LVEF (%) (172 participants) (Pennell 2014) (Analysis 2.2). Data for mean change from baseline was extracted from clinicaltrials.gov as least squares mean and SEM, SD was calculated. LVEF remained stable in both groups, showing no significant difference between both groups after one year. No significant difference was also seen in the number of individuals for both subgroups with improvement from abnormal LVEF at baseline to normal range (21 participants) (Analysis 2.3) and from normal LVEF at baseline to below lower limit of normal at end of study (151 participants) (Analysis 2.3).
The incidence of thyroid disease was assessed in one study (19 participants) (Chirico 2013) (Analysis 2.4). No difference was observed after two years of treatment, but the included population was very small.
Two studies reported detailed information on ALT levels and creatinine clearance (Hassan 2016; Pennell 2014). Overall mean (SD) ALT levels had decreased in both treatment groups after one year (deferasirox: ‐3.5 (80.4) U/L; deferoxamine: ‐18.9 (35.5) U/L) in the Pennell study, but due to missing number of included participants, we were not able to include these data in our meta‐analysis (Pennell 2014). Among participants with abnormal baseline ALT, levels had improved to within the normal range in a similar number of participants in both groups (119 participants) (Analysis 2.5). In the Hassan study, AST (U/L) and ALT (U/L) levels were significantly different at end of study (Hassan 2016), but values were already significant different at baseline. While ALT levels increased (60 participants), AST levels decreased in both treatment groups (60 participants) during the study (Analysis 2.6; Analysis 2.7). Another study reported, that 32% of participants had increased ALT at baseline, but most participants had normal AST at baseline (Piga 2002). The authors assume liver damage due to chronic viral hepatitis and/or iron overload. No participant had consistent or progressive elevations in transaminase levels during the study.
Hassan reported serum creatinine at end of study (Hassan 2016). The difference between both treatment groups was not significantly different (60 participants) (Analysis 2.8). In the Pennell study, mean (SD) creatinine clearance had decreased in both groups after one year of treatment (deferasirox: ‐37.0 (42.9) mL/min; deferoxamine: ‐23.1 (36.6) mL/min), but the number of included participants was not mentioned (Pennell 2014). One study reported, that blood urea was significantly higher in the deferasirox group at end of study (60 participants), MD 7.10 (95% CI 4.01 to 10.19) (Hassan 2016) (Analysis 2.9).
2. Measures of iron overload
a. Serum ferritin concentration
In the Cappellini study the mean ratio of deferasirox to deferoxamine varied between the predefined subgroups according to iron overload measures at baseline and different effects were seen in the different subgroups accordingly (Cappellini 2005b). Data from Cappellini showed a clear dose‐response effect for serum ferritin levels (Analysis 2.10). At a ratio of less than 1:2.2 of deferasirox to deferoxamine, the latter was statistically more effective; similar efficacy was achieved only in the highly iron‐overloaded subgroup at a mean ratio of 1:1.8.
One study reported serum ferritin as mean change from baseline (Molavi 2013). For the following studies we used the methods as described by Wan to calculate the means and SDs for our analysis (Wan 2014). One study reported median change and range (Pennell 2014). The Peng study reported median and range at end of the study; additionally Z values for change from baseline were given for both treatment groups, so we were able to calculate change from baseline values (Peng 2013). A further study reported median and interquartile ranges at end of study (Elalfy 2015a). A sixth study reported median and range at end of study; due to a given P value for change from baseline (P < 0.001), SD for change from baseline could be calculated (Hassan 2016).
Combined evidence from the meta‐analysis of all six studies showed a significant difference between treatment arms, favouring deferoxamine, MD 454.42 (95% CI 337.13 to 571.71) (1002 participants) (Analysis 2.10). Heterogeneity was very high (I² = 92%), likely due to different baseline iron overload and different chelation doses. Using the random‐effects model, results remained statistically significant, MD 743.14 (95% CI 263.18 to 1223.09).
A sensitivity analysis was undertaken for serum ferritin without all values which were calculated according to Wan (Wan 2014) (701 participants) (Analysis 2.11). The results of the Cappellini and Molavi studies were pooled and remained statistically significant, favouring deferoxamine, MD 418.94 (95% CI 297.23 to 540.65) (Cappellini 2005b; Molavi 2013).
In the Piga study, data for serum ferritin are presented only in a figure giving means and SDs at various time points; since no information was given with regard to change in mean serum ferritin with respective SDs, we were unable to extract data on ferritin (Piga 2002). In the Chirico study, data on serum ferritin could not be extracted as it was unclear if mean or median, range or interquartile range were reported (Chirico 2013). The authors stated, that they did not find statistical differences between serum ferritin changes in all treatment groups after therapy. Although Habibian measured serum ferritin, no data were presented that would allow for inclusion in our meta‐analysis (Habibian 2014). The authors reported that "mean ferritin level was alike between two groups except for third month follow up that was significantly higher in Osveral® group (P < 0.03)." Data from Elalfy were only available for half of the participants receiving adjuvant vitamin C, but data on participants without vitamin C supplementation was missing and could not be included in our meta‐analysis (Elalfy 2015a). The author only describes that serum ferritin was significant improved in iron chelation subgroups receiving vitamin C compared to those receiving no vitamin C.
b. Liver iron concentration (LIC)
LIC was measured in one study (Peng 2013) by R2* after 12 months of treatment (24 participants) (Analysis 2.12). Based on given median and range at end of study, mean and SD could be calculated as stated in our methods. Due to given Z values for change from baseline, mean change and SDs could be calculated. No significant difference was observed, but the study included only a small population of 24 participants.
Change in LIC measured by MRI (R2) was significantly different favouring deferoxamine in one study (Pennell 2014). Elalfy also presented MRI R2* measurements at end of study for those participants receiving vitamin C, (SDs for change could be calculated from P values (both given as < 0.001)), but no difference in LIC was observed between both groups (Elalfy 2015a). When data from the two studies were pooled, the change in LIC was not significantly different between the two groups, but heterogeneity was very high (I² = 79%) (217 participants) (Analysis 2.13). No significant difference was observed when the analysis was repeated using the random effects model. In the Elalfy study, data for the iron chelation subgroups not receiving vitamin C were not given, but the author describes that LIC was significantly improved compared to those who didn't receive vitamin C (Elalfy 2015a).
In most participants in the Cappellini study, the LIC was measured by biopsy (n = 454) and only in a minority by SQUID (n = 87) (Cappellini 2005b). According to the authors, SQUID measurement underestimated LIC; however, since this applies to both groups and data were not completely given for all relevant outcomes, we did not examine these data for the subgroups separately, but rather decided to extract the data on LIC for the combined group measured by either biopsy or SQUID (Analysis 2.14). At a ratio of 1:1.8 deferasirox showed a significantly better efficacy than deferoxamine in the subgroup of highly iron‐overloaded people, while deferoxamine showed higher efficacy in the other three subgroups at ratios of 1:2.2, 1:3.6 and 1:5.5 (541 participants), MD 2.37 (95% CI 1.68 to 3.07) (Analysis 2.14). For both drugs a clear dose‐effect relation was shown. The primary objective of the Cappellini study was to investigate if deferasirox is non‐inferior to deferoxamine regarding success rate in LIC (Cappellini 2005b). Across all dose groups, non‐inferiority was not achieved, because the lower limit of the 95% CI was less than ‐15% (predefined by authors, less conservative than our definition of non‐inferiority).
Two studies also did special responder analysis (Cappellini 2005b; Piga 2002). Responder‐definition varied between the studies (decrease in LIC more than 10% in the Piga study (67 participants) (non‐significant result) (Analysis 2.15). The Cappellini study (553 participants) used a definition of LIC ranging from 1 to less than 7 mg Fe/g dry weight after one year, significantly favouring deferoxamine, RR 0.80 (95% CI 0.69 to 0.92) (Analysis 2.16).
Results for mean change in LIC could not be included in the analysis from the Piga study due to missing SDs (Piga 2002). However, results for mean change in LIC were reported: ‐0.4 mg Fe/g dry weight for the 10 mg/kg/day deferasirox dose group, ‐2.1 mg Fe/g dry weight for the 20 mg/kg/day dose group and ‐2.0 mg Fe/g dry weight for the 40 mg/kg/day deferoxamine group.
c. Myocardial iron concentration
Two studies measured cardiac T2* (Elalfy 2015a; Pennell 2014).
One study measured myocardial T2* after one year of treatment (Pennell 2014). Results are presented as geometric means and coefficients of variance (%) for both groups in the journal publication, so it was not possible to calculate means and SDs for inclusion in our meta‐analysis. Efficacy is reported as ratio of the Gmeans of deferasirox versus deferoxamine. For the ITT‐population, which only included 180 of 197 randomised participants, the ratio was 1.055 (repeated 95% CI, 0.999 to 1.129). Analysing the per protocol population, a ratio of 1.056 (repeated 95% CI, 0.998 to 1.133) was calculated. Both analyses showed no significant difference between the two treatment arms. The Pennell study was designed as a non‐inferiority study regarding myocardial iron removal (Pennell 2014). The authors defined a non‐inferiority margin of 90% (as we did in our review). The results for myocardial T2* revealed that the lower bound of the 95% CI was greater than prespecified margin of 0.9, which demonstrated non‐inferiority of deferasirox compared to deferoxamine.
The second study reported myocardial T2* for participants receiving vitamin C also after one year (Elalfy 2015a). We were able to calculate the change from baseline due to given P values for change from baseline. Meta‐analysis revealed no significant difference between the two groups (Analysis 2.17, 45 participants). In the Elalfy study, data are not given for participants not receiving vitamin C, but the author describes that cardiac MRI T2* was increased compared to groups not receiving vitamin C (Elalfy 2015a).
The Pennell study authors derived myocardial iron concentration from myocardial T2* values based on a formula described by Carpenter (Carpenter 2011) (Pennell 2014). No significant difference was seen for all participants and for the subgroups of participants with myocardial T2* < 10 ms and ≥ 10 ms at baseline (Analysis 2.18, 172 participants). Improvement in myocardial T2* was defined as increase from a range of 6 to < 10 milliseconds at baseline to 10 to 20 ms at end of study. Worsening of myocardial iron was defined as decrease from a range of 10 ms to ≤ 20 ms at baseline to 6 to < 10 ms. Significantly more participants treated with deferasirox reached normalized myocardial T2* than participants with deferoxamine, RR 2.85 (95% CI 1.09 to 7.43) (Analysis 2.19, 172 participants). No significant difference was found for improvement and worsening between the two groups (Analysis 2.19).
d. Other measures of iron overload
One study evaluated the iron excretion‐intake ratio (Cappellini 2005b). The results reflect the dose‐response and ratio effect seen for ferritin, MD ‐0.18 (95% CI ‐0.24 to ‐0.12) (Analysis 2.20, 541 participants). Deferoxamine showed higher efficacy at ratios of 1:2.2, 1:3.6 and 1:5.5, while deferasirox at a ratio of 1:1.8 showed significantly higher efficacy in the subgroup of highly iron‐overloaded people.
3. Measures of iron excretion (urine and faeces) over 24 hours (mg/kg/day)
No data on iron excretion were available from any study.
4. Adverse events
Five studies reported in a detailed manner on AEs (Cappellini 2005b; Molavi 2013; Piga 2002; Pennell 2014; Hassan 2016). In the Cappellini study, it is not clearly stated whether all 586 participants were included in this analysis; however, since discontinuations are reported, we assume that all 586 participants were included (Cappellini 2005b). From the Piga phase II study reports, some safety data were reported by dose group. Our intention was to pool the data with the results of other studies, so we summed the number of AEs of both dose subgroups. Only common (observed in ≥ 5% of participants) adverse events of the Pennell study were reported in the journal publication. On clinicaltrials.gov more adverse events were reported, but due to unexplained differences between journal publication and register entry in the numbers of some adverse events, we extracted the data from the peer‐reviewed journal publication.
Two studies reported the number of participants affected by SAEs (773 participants) (Cappellini 2005b; Pennell 2014) (Analysis 2.21). The pooled results revealed no significant difference between both treatment groups. One study reported SAEs in detail (Pennell 2014). No significant differences were seen in all SAE between the two groups (187 participants) (Analysis 2.22).
No statistically significant difference was found between deferasirox and deferoxamine with regard to the number of participants experiencing "any adverse events" (Pennell 2014; Piga 2002, 258 participants); heterogeneity was high (I² = 74%) (Analysis 2.23). No significant difference was observed using random‐effects model. Different types of AEs were reported, but only isolated increases of creatinine occurred significantly more often while on deferasirox treatment compared to deferoxamine (657 participants) (Analysis 2.24). However, likelihood for a false‐positive finding is high due to the large number of AEs reported and compared. All other reported AEs such as thrombocytopenia, agranulocytosis, neutropenia, leukopenia, cardiac AEs, hearing loss, lens and retinal abnormalities, different gastrointestinal disorders, asthenia, influenza‐like illness, pyrexia, allergic conjunctivitis, bronchitis, upper respiratory tract infection, urinary tract infection, increased ALT, elevated ALT (> 2 x ULN), increased AST, increased blood creatinine, increased platelet count, arthralgia, back pain, osteoporosis, headache, vertigo, proteinuria, cough, influenza, nasopharyngitis, oropharyngeal and pharyngolaryngeal pain, pharyngitis, rhinitis and rash were either not observed at all or at frequencies that were not statistically different between both treatments (Analysis 2.24). Heterogeneity regarding the pooled data for diarrhoea was high (I² = 53%), but results remained not statistically significant using a random‐effects model.
Cappellini describes mild, dose‐dependent increases in serum creatinine in 38% deferasirox participants, mostly in the 20 and 30 mg/kg/day groups in those participants with the highest decreases in LIC and serum ferritin (Cappellini 2005b). Increases were sometimes transient and generally within the normal range. The increases never exceeded 2x ULN. 14% of participants in the deferoxamine group experienced similar increases. Eight participants in the deferasirox and seven participants in the deferoxamine group experienced deafness, neurosensory deafness or hypoacusis. For two participants in the deferasirox group and five participants in the deferoxamine group, cataracts or lenticular opacities were reported. Electrocardiograms were performed for 258 participants in the deferasirox group and 245 participants in the deferoxamine group. The authors reported that no cardiac safety concerns regarding deferasirox were identified and a similar percentage of participants receiving deferasirox (5.1%) and deferoxamine (6.9%) experienced cardiac AEs.
Pennell assessed drug‐related AEs and reported the ones affecting ≥ two participants (Pennell 2014). Hassan also reported different kinds of drug‐related AEs, but not in a systematic way (Hassan 2016). As far as possible, these were included in the analyses; no significant differences were observed regarding the number of participants experiencing drug‐related AEs (Analysis 2.25, 187 participants) or the different kinds of drug‐related AEs (Analysis 2.26, 247 participants). In the Cappellini study, the authors describe the most common AEs with an apparent relationship to deferasirox were transient gastrointestinal events (15.2% of participants) and skin rash (10.8%) (Cappellini 2005b). Median duration of the gastrointestinal events were eight days or less, therefore dose adjustment or discontinuation of deferasirox was rarely required. Two participants receiving deferasirox developed ALT levels > 2x ULN, which was felt by the investigator to be drug‐related. Of the participants experiencing deafness, neurosensory deafness or hypoacusis, these symptoms were considered drug‐related in one participant receiving deferasirox and five participants receiving deferoxamine. Cataracts or lenticular opacities were reported in one participant receiving deferasirox and four participants receiving deferoxamine. There was no drug‐related agranulocytosis reported in this study.
5. Participant satisfaction and adherence
Satisfaction with, convenience of and willingness to continue treatment was significantly higher in the group receiving deferasirox who had previously been treated with deferoxamine, although differences were not as marked in the small group of deferoxamine‐naive participants (Analysis 2.27; Analysis 2.28; Analysis 2.29) (even when those who did not respond to the questionnaire were counted as not satisfied or unwilling to continue treatment). Time lost from normal activities due to treatment was significantly less with deferasirox (Analysis 2.30, 187 participants). For the outcomes "willingness to continue" (Analysis 2.29) and "time lost from normal activities" (Analysis 2.30), the number of participants who responded at end of study were not given; however, to incorporate these data, we assumed that all participants provided this information.
Adherence was evaluated in one study and defined as percentage of the planned dose taken by participants (Pennell 2014). No significant difference was seen between both groups (Analysis 2.31, 187 participants).
Another study measured adherence by either pill or vial count, but no results were reported (Elalfy 2015a). Five participants in the deferoxamine subgroup did not continue till the end of study because of poor adherence, but it was unclear if participants actively discontinued the study or were excluded by the investigators.
One study reported, that all participants were adherent, but adherence was not defined (Hassan 2016).
The number of participants who discontinued the study was not statistically significant different between both groups in eight studies (Analysis 2.32, 1211 participants). In the Piga study, two participants each in the deferasirox 20 mg/kg/day and deferoxamine groups were withdrawn prematurely from the study (Piga 2002). One participant in the deferasirox 20 mg/kg/day group was excluded due to unsatisfactory therapeutic effect and QTc prolongation. The other three participants were excluded due to adverse events. The AEs of one participant in the deferoxamine group (arthralgia, headache and fever) were considered to be study drug‐related by the investigator. In the Elalfy study, five participants in the deferoxamine treatment group discontinued because of poor compliance (Elalfy 2015a). It remains unclear if participants left the study deliberate or were excluded by investigators.
One study reported the number of participants with dose adjustments or dose interruptions, but no significantly difference between both treatments was observed (586 participants) (Cappellini 2005b) (Analysis 2.33); approximately 5% of people discontinued, while dose adjustments were required in approximately one third of people.
Another study evaluated number of participants with at least one dose interruption (187 participants) (Analysis 2.34) or dose reduction (187 participants) (Analysis 2.35) separately (Pennell 2014). No significant differences between both groups were observed.The main reason for interruption (deferasirox: 21/96; deferoxamine: 19/91) and dose reduction (deferasirox: 24/96; deferoxamine: 21/91) was an AE. One study reported the number of participants with dose adjustments (71 participants) (Piga 2002); there were significantly more participants with dose adjustments in the deferasirox group, RR 3.23 (95% CI 1.28 to 8.16) (Analysis 2.36). However, there was no significant difference in the number of participants with dose interruptions due to an AE in this study (71 participants) (Analysis 2.37).
6. Cost of intervention per year
No data on costs of intervention were available from any study.
7. Other reported outcomes not predefined
In the Elalfy study, also transfusion index, haemoglobin, iron, total iron binding capacity, transferrin saturation and vitamin C at baseline and end of study are reported (Elalfy 2015a). We included transfusion index, haemoglobin and transferrin saturation in our analysis. Due to missing P values, we were not able to calculate the SD for change from baseline. Haemoglobin at end of study was significant higher in the deferoxamine group, MD ‐0.70 (95% CI ‐1.33 to ‐0.07) (Analysis 2.38). In the Molavi study, change in haemoglobin levels from beginning to end of study were significant, MD ‐0.46 (95% CI ‐0.81 to ‐0.11) (Molavi 2013). Pooled results of both studies showed a significant lower hemoglobin in the deferasirox group, MD ‐0.52 (95% CI ‐0.82 to ‐0.21) (180 participants) (Analysis 2.38). No significant difference was observed for either transfusion index or transferrin saturation at end of the Elalfy study (42 participants) (Elalfy 2015a) (Analysis 2.39; Analysis 2.40). This study provides only data on participants receiving vitamin C, but the author describes, that improvement in transfusion index, serum iron, Tsat and hemoglobin was significant improved in those receiving vitamin C compared to those not receiving vitamin C.
Hassan reports no significant difference regarding platelet count (x10³/mm³) and absolute neutrophilic count (/mm³) (Hassan 2016) (Analysis 2.41; Analysis 2.42).
In the Piga study, all treatment groups had transient and low grade (< 10‐fold above the ULN) elevations of urinary b‐2 microglobulin, but the elevations were more frequent in those receiving deferasirox 20 mg/kg/day (Piga 2002). The elevations tended to normalize, although the study drug was continued in most cases. In three participants in the deferasirox group, treatment was discontinued and values normalized within seven to 10 days. Two participants in the deferasirox 20 mg/kg/day group had the highest evaluations, the dose was reduced to 10 mg/kg/day which resulted in a normalization of the b‐2 microglobulin levels. Moreover, Piga reported that there were no consistent changes in urinary N‐acetyl‐beta‐glucosaminidase levels (Piga 2002).
Serum copper and zinc levels fluctuated in participants in the Piga study, but no progressive decreases occurred (Piga 2002). In the Cappellini study, the authors describe that zinc and copper levels at the end of the study were comparable in both treatment groups (Cappellini 2005b).
Growth and development was described as normally within children who were receiving deferasirox (Cappellini 2005b).
3. Transfusion‐dependent thalassaemia: deferasirox compared to deferiprone
One study compared deferasirox to deferiprone (Sanjeeva 2015). Two additional studies compared all three iron chelation monotherapies (Chirico 2013; Elalfy 2015a). A further study compared deferasirox to deferiprone monotherapy and combination of both (Kakkar 2014). To include data from these multi‐armed studies into meta‐analysis, deferasirox groups were split.
Primary outcomes
1. Overall mortality measured at any point in time
No deaths were observed (146 participants) (Chirico 2013; Elalfy 2015a; Sanjeeva 2015) (Analysis 3.1).
Secondary outcomes
1. Reduced end‐organ damage due to iron deposition
One study evaluated the incidence of thyroid disease after two years of treatment (18 participants) (Chirico 2013) (Analysis 3.2). No significant difference was seen between both groups, but the population (n = 18) was very small.
One study reported AST, ALT, urea and creatinine levels and neutrophil count at nine months (38 participants) (Sanjeeva 2015) (Analysis 3.3; Analysis 3.4; Analysis 3.5; Analysis 3.6Analysis 3.7). P values for change from baseline were given, so we were able to calculate the SD for change from baseline. No significant differences between both groups were observed.
Although Kakkar reported the performance of monthly renal function tests and measurements of liver enzymes, no results were presented (Kakkar 2014).
2. Measures of iron overload
a. Serum ferritin
Two studies measured serum ferritin concentration at end of study (Sanjeeva 2015; Elalfy 2015a). Mean change from baseline was calculated from P values (baseline to end‐value) for the Sanjeeva study (Sanjeeva 2015). The thesis document additionally reported serum ferritin in different subgroups which were categorized according to their baseline serum ferritin. The second study reported median and interquartile ranges, so we calculated mean and SD at end of study (Elalfy 2015a). No significant difference between both treatment groups was observed for all participants and for subgroups split according to baseline ferritin values (83 participants) (Analysis 3.8).
Two other studies measured serum ferritin every three months, but data could not be extracted (Chirico 2013; Kakkar 2014). In the Chirico study, data on serum ferritin could not be extracted due to insufficient information on the data (Chirico 2013): it was unclear if mean or median, range or interquartile range were given. The authors described, that they did not find statistical differences between serum ferritin changes in all treatment groups after therapy. In the Kakkar study, the authors describe that "serum ferritin reduced significantly in group I [DFP] and II [DFX] [...]" (Kakkar 2014).
b. Liver iron concentration (LIC)
One study measured LIC by MRI R2* at end of study (Elalfy 2015a). We calculated the SD for change from baseline from P values. No significant difference was seen between both treatment groups (45 participants) (Analysis 3.9).
A further study measured liver MRI T2* but no data could be extracted (Kakkar 2014). Mean values for liver MRI T2* were reported, but it remains unclear if these values represent baseline or end of study data.
c. Myocardial iron concentration
One study measured cardiac T2* at end of study (Elalfy 2015a). We calculated the SD for change from baseline from P values. No significant difference was seen between both treatment groups (45 participants) (Analysis 3.10).
Data from the Kakkar study measuring cardiac T2* could not be extracted (Kakkar 2014). The authors describe, that cardiac MRI T2* at the end of the study were slightly better in [deferiprone] group as compared to [deferiprone and deferasirox] group, although this was not statistical significant (P = 0.07).
3. Measures of iron excretion (urine and faeces) over 24 hours (mg/kg/day)
No data on iron excretion were available from any study.
4. Adverse events
Three studies provided information on AEs (Elalfy 2015a; Kakkar 2014; Sanjeeva 2015).
In the Sanjeeva study, AEs were very common in the deferiprone (15 out of 22, 68.2%) and deferasirox group (seven out of 19, 36.8%), but overall no significant difference was observed (41 participants) (Sanjeeva 2015) (Analysis 3.11). Significantly more participants experienced arthralgia in the deferiprone group compared to the deferasirox group, RR 0.13 (95% CI 0.02 to 0.93) (41 participants) (Analysis 3.12), resulting in three participants discontinuing deferiprone treatment. Due to the high number of different types of AEs reported and compared, likelihood for a false‐positive result is increased. Nausea and vomiting appeared frequently in both groups: deferasirox 31.5% (six out of 19), deferiprone 27.2% (six out of 22), respectively, with no significant differences between both groups (41 participants) (Analysis 3.12). One participant in the deferiprone group had abdominal pain (Analysis 3.12, 41 participants). None of the participants experienced rashes or diarrhoea (41 participants) (Analysis 3.12). One participant in the deferiprone group experienced neutropenia, however, agranulocytosis was not observed in any of the groups (38 participants) (Analysis 3.12). The number of participants with ALT or AST levels of 2x above ULN was equal in both treatment groups (38 participants) (Analysis 3.12). One participant in the deferasirox group had 50% increase in serum creatinine levels from baseline (Analysis 3.12, 38 participants). Renal failure was not observed in any of the groups (38 participants) (Analysis 3.12).
Elalfy only states that "no serious adverse reaction to iron chelators nor to vitamin C administration have been reported" (Elalfy 2015a). No data on adverse events could be extracted from the Kakkar study (Kakkar 2014).
5. Participant satisfaction and adherence
No data on participant satisfaction and adherence could be extracted from any study.
One study measured adherence by either pill or vial count, but no results were reported (Elalfy 2015a).
No significant difference was observed in the number of participants discontinuing the study overall (Chirico 2013; Elalfy 2015a; Sanjeeva 2015) (Analysis 3.13, 179 participants) or discontinuing the study due to AEs (41 participants) (Analysis 3.14).
6. Cost of intervention per year
No data on cost of intervention were available from any study.
7. Other additional outcomes
Comparing deferasirox to deferiprone in the identified studies, other, in this review not a priori defined outcomes were measured. A significant higher transferrin saturation was seen in the deferiprone group at end of one study (45 participants), MD ‐7.40 (95% CI ‐13.28 to ‐1.52) (Elalfy 2015a) (Analysis 3.15). No significant differences were observed regarding haemoglobin or transfusion index in this study (45 participants) (Analysis 3.16, Analysis 3.17). Additionally, ALP levels were reported at nine months in one study (Sanjeeva 2015). Due to P values for change from baseline given, we were able to calculate the SD for change from baseline. No significant difference was observed (38 participants) (Analysis 3.18). Moreover, the thesis document reporting the Sanjeeva study also reported phosphorous and calcium levels, which we did not include in our review (Sanjeeva 2015). In the Elalfy study, also iron, total iron binding capacity and vitamin C at end of study are reported (Elalfy 2015a).
4. Transfusion‐dependent thalassaemia: deferasirox compared to deferasirox in combination with deferiprone
One study with 40 participants reported in one abstract included the comparison of deferasirox versus deferasirox and deferiprone administered sequentially (Kakkar 2014).
Cardiac and liver MRI, serum ferritin, CBC, liver enzymes and renal function tests were assessed during the study. Results for liver MRI, serum ferritin and adverse events were only reported narratively and no data could be extracted:
"Liver MRI T2* was not significantly different before and after the study. Serum ferritin reduced significantly in group I [DFP] and II [DFX] but not in group III [DFX+DFP]. Group receiving combination therapy did not show any untoward side effects as compared to single drug regimen."
No results regarding cardiac MRI, CBC, liver enzymes and renal function tests were reported.
5. Transfusion‐dependent thalassaemia: deferasirox in combination with deferiprone compared to deferiprone alone
One study with 40 participants reported in one abstract included the comparison of deferiprone versus deferasirox and deferiprone administered sequentially (Kakkar 2014).
Cardiac and liver MRI, serum ferritin, CBC, liver enzymes and renal function tests were assessed during the study. Results for cardiac and liver MRI, serum ferritin and adverse events were only reported narratively and no data could be extracted:
"Cardiac MRI T2* at the end of the study was slightly better in group I [DFP] as compared to group III [DFP + DFX] although was not statistical significant (p=0.07). [...] Liver MRI T2* was not significantly different before and after the study. Serum ferritin reduced significantly in group I [DFP] and II [DFX] but not in group III [DFP+DFX]. Group receiving combination therapy did not show any untoward side effects as compared to single drug regimen."
No results regarding CBC, liver enzymes and renal function tests were reported.
6. Transfusion‐dependent thalassaemia: deferasirox in combination with deferoxamine compared to deferoxamine alone
One study compared deferasirox in combination with deferoxamine to deferoxamine alone (Molavi 2014).
Primary outcomes
1. Overall mortality measured at any point in time
No loss‐to‐follow‐up was reported in the study (94 participants) (Molavi 2014) (Analysis 6.1). Therefore, we assumed no deaths occurred in any of the groups.
Secondary outcomes
1. Reduced end‐organ damage due to iron deposition
Molavi measured neutrophils, ALT, AST at baseline and at 12 months (Molavi 2014). Due to missing P values for change from baseline, no SDs for change from baseline could be calculated. No significant differences were observed in neutrophils, ALT, and AST levels (94 participants) between the two groups at 12 months (Analysis 6.2; Analysis 6.3; Analysis 6.4).
No other data on end‐organ damage were available from this study.
2. Measures of iron overload
a. Serum ferritin
The Molavi study measured serum ferritin at 12 months (Molavi 2014). Due to missing P values (baseline to end of study), SD for change from baseline couldn't be calculated. No significant difference was observed between both groups at end of study (94 participants) (Analysis 6.5).
3. Measures of iron excretion (urine and faeces) over 24 hours (mg/kg/day)
No data on iron excretion were available from the study.
4. Adverse events
No AEs were reported.
5. Participant satisfaction and adherence
No data on this outcome were available from the Molavi study; however, no participant discontinued the study (94 participants) (Analysis 6.6).
6. Cost of intervention per year
No data on cost of intervention was available from the study.
7. Other additional outcomes
Haemoglobin at 12 months was slightly higher in participants treated with deferoxamine alone (94 participants) (Analysis 6.7). ALP was significantly higher in participants treated with both deferasirox and deferoxamine (94 participants) (Molavi 2014) (Analysis 6.8).
7. Transfusion‐dependent thalassaemia: deferasirox in combination with deferiprone compared to deferiprone + deferoxamine
One study compared deferasirox and deferiprone to deferiprone and deferoxamine (Elalfy 2015b).
Primary outcomes
1. Overall mortality measured at any point in time
No deaths were observed during the study (96 participants) (Elalfy 2015b) (Analysis 7.1).
Secondary outcomes
1. Reduced end‐organ damage due to iron deposition
The authors reported that "change in mean LVEF after one year was not different between the two treatment groups (data not shown)." (Elalfy 2015b). No quantitative data were available.
2. Measures of iron overload
a. Serum ferritin
One study measured serum ferritin at 12 months and reported mean and SD values (Elalfy 2015b). Although not directly stated, we considered the given P value to describe change from baseline so we were able to calculate the mean change and SD. Serum ferritin decreased in both groups, but no significant difference was observed (96 participants) (Analysis 7.2).
b. Liver iron concentration (LIC)
LIC was measured by MRI R2* in the included study and mean and SD values at end of study were reported (Elalfy 2015b). Although not directly stated, we considered the given P value to describe change from baseline, so we calculated the mean change and SD. No significant difference was seen between both groups (96 participants) (Analysis 7.3).
c. Myocardial iron concentration
Myocardial iron concentration was measured by T2* in the included study and mean and SD values at end of study were reported (Elalfy 2015b). Although not directly stated, we considered the given P value to describe change from baseline, so we were able to calculate the mean change and SD. No significant difference was seen between the groups (96 participants) (Analysis 7.4).
3. Measures of iron excretion (urine and faeces) over 24 hours (mg/kg/day)
No data on iron excretion were available from the included study (Elalfy 2015b).
4. Adverse events
The number of participants with a SAE was equal in both groups (96 participants) (Analysis 7.5). An acute cholecystitis was assessed as a drug‐related SAE in a participant receiving deferasirox and deferiprone (96 participants) (Analysis 7.6). A SAE, classified as unrelated to the drugs and which did not lead to death, was reported in one participant who developed appendicitis while receiving deferiprone and deferoxamine (96 participants) (Analysis 7.7).
Mild‐moderate neutropenia was observed in both groups, which resolved with decreasing deferiprone dose (96 participants) (Analysis 7.8). No cases of agranulocytosis were observed (96 participants) (Analysis 7.8). Overall, drug‐related AEs "were mostly of mild to moderate severity" and common in both groups (96 participants) (Analysis 7.9). In the Elalfy study, agranulocytosis, neutropenia, arthralgia, gastrointestinal problems, ALT (at least a three‐fold increase), serum creatinine (an increase of at least 33%) above baseline on two consecutive occasions and skin rash were assessed as drug‐related with similar frequencies in both groups (96 participants) (Elalfy 2015b) (Analysis 7.10).
Non‐drug‐related AEs were reported by 17 of 48 (35.41%) participants in the deferasirox and deferiprone group versus 18 of 48 (37.5%) in the deferiprone and deferoxamine group (96 participants) (Analysis 7.11). Only the three most common non‐drug‐related AEs were reported (infections, gastrointestinal disorders, skin and subcutaneous tissue disorders) and no significant differences were observed (96 participants) (Analysis 7.12). Mild elevation of hepatic transaminases at the start of therapy were observed in both groups, which returned to normal within the first two months (96 participants) (Analysis 7.13). Initial gastrointestinal manifestations also occurred in both groups and "were in form of nausea and mild abdominal pain" (96 participants) (Analysis 7.14).
5. Participant satisfaction and adherence
Quality of life was measured by SF‐36 in one study (Elalfy 2015b). Data were not given, therefore mean and SD at end of study were obtained through estimation from a figure, and SD for change from baseline was calculated from given P values. No significant differences were observed between both groups (96 participants) (Analysis 7.15).
The definition of adherence in the Elalfy study was the actual dose divided by the total prescribed dose (Elalfy 2015b). We calculated missing SD from given P value. Adherence was significantly higher in the deferasirox and deferiprone group, MD 0.15 (95% CI 0.06 to 0.24) (96 participants) (Analysis 7.16).
Overall, no participant discontinued the study (96 participants) (Analysis 7.17) and there were no SAEs necessitating discontinuation or interruption of therapy in any of the groups (96 participants) (Analysis 7.18).
6. Cost of intervention per year
No data on cost of intervention were available from any study.
7. Other additional outcomes
No other additional outcomes were reported.
8. Non‐transfusion‐dependent thalassaemia: deferasirox compared to placebo
One study evaluated people with non‐transfusion‐dependent thalassaemia and compared deferasirox 5 mg/kg/day and deferasirox 10 mg/kg/day starting doses to matching placebos (Taher 2012).
Primary outcomes
1. Overall mortality measured at any point in time
No deaths occurred during the study in any treatment group during one year of treatment (148 participants) (Taher 2012) (Analysis 8.1).
Secondary outcomes
1. Reduced end‐organ damage due to iron deposition
No data on end‐organ damage were available from the study.
2. Measures of iron overload
a. Serum ferritin
Different types of data on change in serum ferritin were reported in the journal publication and on clinicaltrials.gov. The journal publication reports least squares mean (LSM), median and 95% CI; the mean and SD are reported on clinicaltrials.gov. In the journal publication, a LSM of ‐121 ng/mL (95% CI ‐203 to ‐38; median ‐99 ng/mL) and a LSM of ‐222 ng/mL (95% CI ‐304 to ‐140; median ‐190 ng/mL) are given in the 5 and 10 mg/kg/day subgroups, respectively. In the placebo group a LSM of 115 ng/mL (median 78 ng/mL) is reported, but due to missing SD or 95% CI we were not able to include these data in our meta‐analysis.
The change in serum ferritin reported on clinicaltrials.gov was significant in both the 5 and 10 mg/kg/day deferasirox subgroups compared to placebo, with a MD of ‐259.10 (95% CI ‐377.35 to ‐140.85) and ‐377.79 (95% CI ‐522.21 to ‐233.37) in the 5 and 10 mg/kg/day subgroups respectively (154 participants) (Analysis 8.2). The overall result was also significant, MD ‐306.74 (95% CI ‐398.23 to ‐215.24). Only participants with both baseline and post‐baseline values were included in the analyses of the study.
b. Liver iron concentration (LIC)
In the Taher study, the primary efficacy end point was change in LIC from baseline to 52 weeks (159 participants) (Taher 2012). The authors used LSM and SEM when reporting data, so we calculated SD to include the results in our meta‐analysis. Regarding both starting dose subgroups, decrease in LIC was significant in both groups. For the 5 mg/kg/day group, MD ‐2.33 (95% CI ‐4.00 to ‐0.66); for the 10 mg/kg/day group the decrease was larger, MD ‐4.18 (95% CI ‐5.83 to ‐2.53) (Taher 2012) (Analysis 8.3). Regarding the different types of thalassaemia, results, reported as mean (SD), were only significant in favour of deferasirox in the β‐thalassaemia subgroups, with a larger decrease in the 10 mg/kg/day group. Results for α‐thalassaemia and HbE/β‐thalassaemia participants were not significant, but included participant populations were smaller than for the β‐thalassemia subgroup. Comparing LIC regarding age of the participants, LIC decrease in the subgroup of participants under 18 years of age with a deferasirox starting dose of 5 mg/kg/day was the only of the four subgroups without significant LIC decrease, but only 10 out of the 159 participants were included (Analysis 8.4).
In the 5 mg/kg/day group, neither the decrease of ≥ 3 mg Fe/g dry weight in LIC, nor the reduction in Fe/g dry weight ≥ 30% were significant compared to placebo. However, in the 10 mg/kg/day group, significantly more participants had a LIC decrease of ≥ 3 mg Fe/g dry weight, RR 5.26 (95% CI 1.76 to 15.71) (83 participants) (Analysis 8.5) and a reduction in Fe/g dry weight ≥ 30%, RR 13.75 (95% CI 1.97 to 95.97) (83 participants) (Analysis 8.6). When combined, both of these results were significant across dose groups (Analysis 8.5; Analysis 8.6). Significantly more participants in both dose groups combined moved to a lower iron burden range (166 participants), RR 3.35 (95% CI 1.62 to 6.91); for the 5 mg/kg/day group, RR 3.39 (95% CI 1.10 to 10.45) and for the 10 mg/kg/day group, RR 3.31 (95% CI 1.28 to 8.55) (Analysis 8.7). No significant difference was observed in the number of participants in the 5 and 10 mg/kg/day subgroups who had LIC < 5 mg Fe/g dry weight (166 participants) (Analysis 8.8); however, when these data were combined the result was significant, RR 5.35 (95% CI 1.30 to 21.99) (Analysis 8.8).
c. Myocardial iron concentration
No data on myocardial iron concentration were available from the study.
3. Measures of iron excretion (urine and faeces) over 24 hours (mg/kg/day)
No data on iron excretion were available from the study.
4. Adverse events
An extensive data on SAEs and other AEs are available on clinicaltrials.gov. We were not able to include these data in our meta‐analysis, because the data were not reported separately for the core trial.
Six investigator‐assessed drug‐related SAEs were reported in four participants receiving deferasirox (abdominal, pyrexia, hepatotoxicity, cellulitis, pruritus, rash), no drug‐related SAEs were reported with placebo (166 participants), these results were not significant (Analysis 8.9; Analysis 8.10).
No significant difference was found in the number of participants experiencing at least one AE (166 participants) (Analysis 8.11) and in the number of participants with mild, moderate or severe AEs (166 participants) (Analysis 8.12; Analysis 8.13; Analysis 8.14). Neurosensory deafness was reported in a participant receiving placebo 10 mg/kg/day and proteinuria was reported in one participant receiving deferasirox 5 mg/kg/day (166 participants) (Analysis 8.15). No numbers are given, but the authors report that "the overall number of AEs and SAEs reported before and after dose increases was comparable within each treatment group." Comparisons of the number of participants with notable abnormal post‐baseline laboratory results extracted from clinicaltrials.gov (platelet count, neutrophil count, ALT, AST, serum creatinine, creatinine clearance, urinary protein/creatinine ratio, low/high blood pressure, low/high pulse rate), showed no significant differences between both groups (166 participants) (Analysis 8.15).
Investigator‐assessed drug‐related AEs "were reported in 40 (24.1%) patients", but no values for each treatment group separately were given. Most common (at least three participants in total) investigator‐assessed drug‐related AEs were reported (nausea, skin rash, diarrhoea, headache, upper abdominal pain, abdomina pain), but no difference was seen between treatment groups (166 participants) (Analysis 8.16).
5. Participant satisfaction and adherence
No data on participant satisfaction were available from the study.
Adherence was defined as number of participants taking the planned study dose in Taher study (Taher 2012). Adherence was high, showing no difference between treatment groups (166 participants) (Analysis 8.17).
Overall, no significant difference was observed in participants discontinuing the study (166 participants) (Analysis 8.18)
No significant difference was observed in the number of participants who discontinued overall due to AEs (166 participants) (Analysis 8.19): three participants discontinued in the deferasirox 5 mg/kg/day cohort (fractured pelvis, anaemia, increased urine protein level), three participants in the deferasirox 10 mg/kg/day subgroup (pregnancy (n = 2), rash and pruritus) and two participants in the placebo group (optic neuritis and severe anaemia).
No significant differences were observed in the number of participants with dose increase (166 participants) (Analysis 8.20), dose interruption (166 participants) (Analysis 8.21), dose reduction (166 participants) (Analysis 8.22) and dose reduction due to AE (166 participants) (Analysis 8.23).
A total of 46.4% of participants had a dose doubling after 24 weeks.
6. Cost of intervention per year
No data on cost of intervention were available from the study.
7. Other additional outcomes
Taher also reported no significant difference in change in haemoglobin (144 participants) (Analysis 8.24). However, the study reported a significant difference in transferrin saturation in the 5 mg/kg/day subgroup only, MD ‐7.16 (95% CI ‐12.15 to ‐1.37) (70 participants) (Analysis 8.25) (Taher 2012). When dose groups were combined, the difference was also significant, MD ‐7.10 (95% CI ‐11.71 to ‐2.50) (141 participants) (Analysis 8.25).
Discussion
Summary of main results
In the two pharmacokinetic, dose‐finding studies iron eliminating efficacy could be shown. In conclusion, in our opinion efficacy measures in these early studies were of limited value. However, since they fulfilled the review's inclusion criteria and were relevant in particular for safety issues, we included them. They showed a dose‐response effect as expected, but conclusions regarding efficacy when taken continuously were not really appropriate. In conclusion, pharmacodynamic efficacy and acceptable safety could be confirmed justifying further clinical testing in phase II and phase III studies based on an estimated equivalence ratio of deferasirox to deferoxamine of approximately 1 mg: 2 mg.
A phase III study showed that depending on the actual dose of deferasirox, sufficient efficacy could be achieved to lower both serum ferritin level and liver iron concentration (LIC) (measured by biopsy or superconducting quantum interference device (SQUID)) in people with iron‐overloaded thalassaemia (Cappellini 2005b). In comparison to deferoxamine, at a ratio of more than 2:1, deferoxamine showed a higher efficacy compared to deferasirox; however, similar efficacy of deferasirox could be achieved at a mean ratio of 1.8:1 of deferoxamine to deferasirox. Also, of five smaller studies which didn't consider the actual dose in particular, two showed significantly reduced serum ferritin in participants who received deferoxamine compared with deferasirox. Pooling of all six studies showed a significant reduction in serum ferritin favouring deferoxamine, mean difference (MD) 454.42 (95% confidence interval (CI) 337.13 to 571.71). One study showed a significantly greater change in LIC measured by magnetic resonance imaging (MRI) in favour of deferoxamine, but no significant difference was seen when pooled with a smaller study.
Adverse effects, particularly rare adverse effects, are difficult to investigate in randomised clinical studies with a limited number of participants and incomplete or inconsistent reporting. Accordingly, with the exception of "increase in creatinine" (which may also be a false‐positive result due to the large number of different types of adverse events reported and compared) no significant differences in frequencies were observed between deferasirox and deferoxamine. However, from the data it seems that gastrointestinal problems are more common with deferasirox. Due to the low number of included participants who were investigated for adverse events, estimation of rare adverse events (1 to 10 of 10,000 participants) is not possible. Also, data on patient‐relevant outcomes such as mortality or end‐organ damage are either sparse (low number of events for mortality) or too limited to adequately evaluate the efficacy of deferasirox. Due to study duration of maximum two years, long‐term effects of deferasirox can not be judged.
Satisfaction with, and convenience of, deferasirox among those who had previously received deferoxamine treatment was judged significantly better resulting in higher willingness to continue treatment; time lost from normal activities was also reported to be less with deferasirox. The proportion of people who discontinued treatment for any reason or who required dose interruptions or adjustments was similar for both drugs.
Comparing deferasirox to deferiprone, only two small studies reported markers of iron overload. Given the limited patient population, no difference was seen between either treatment. In one study, significantly more participants experienced arthralgia in the deferiprone group, but the validity of the data are limited because the patient population was very small.
Four studies were identified including deferasirox as monotherapy compared to combination therapy or as part of a combination therapy. There was only one study for every comparison and a patient population of 100 or less per study, so the data are very limited. No significant differences were observed in any outcome, except for adherence comparing deferasirox and deferiprone to deferiprone and deferoxamine, which favoured the combination of oral iron chelators, MD 0.15 (95% CI 0.06 to 0.24).
Treatment with deferasirox appears to reduce serum ferritin and LIC significantly in people with non‐transfusion‐dependent thalassaemia as reported in one study including 166 participants. From the available safety data regarding overall number of participants with AEs, similar frequencies were observed, but more detailed and complete information on safety is needed. Results should be confirmed in further studies of longer duration, where patient‐relevant outcomes, such as mortality or satisfaction, are also considered. A total of 46.4% of participants had a dose doubling after 24 weeks due to LIC being more than 7 mg Fe/g dry weight and a LIC reduction less than 15% from baseline, which reflects the importance of dose adjustments.
Overall completeness and applicability of evidence
Given our comprehensive search strategy and contact with Novartis, we are confident that we have identified all relevant randomised studies of deferasirox. However, evidence on deferasirox for treatment of iron overload in people with thalassaemia is still limited due to the limited number of randomised participants included in studies comparing deferasirox to other iron chelators (n = 1594) and the methodological limitations of most of the studies.
Also, pooling of data from different studies was only feasible for a few outcomes, so that for most outcomes data from only one or very few studies were available. Results from ongoing studies and studies which have not been published in full so far will hopefully add information regarding some of these outcomes in the near future.
The applicability of our results is hampered by the use of surrogate endpoints and the short duration of studies. Long‐term studies comparing deferasirox to placebo would be ethically unjustifiable, given that the benefit and therefore also the necessity of iron chelation therapy in people with thalassaemia requiring regular transfusion, has been shown. Since the value of iron chelation therapy with deferoxamine in people with thalassaemia is well‐established (Fisher 2013a), change in surrogate parameters such as serum ferritin or LIC would be acceptable to deduce changes in patient‐relevant endpoints such as mortality or end‐organ damage for studies comparing deferasirox to placebo. However, to adequately compare the efficacy of two iron chelating drugs such as deferasirox and deferoxamine, information on patient‐relevant endpoints such as mortality or end‐organ damage should be available. In particular, there is a lack of data from randomised studies regarding the removal of cardiac iron and the prevention of cardiac complications.
Although long‐term studies investigating these patient‐important endpoints would be important to adequately weigh benefits and AEs of deferasirox compared to standard treatment with deferoxamine, it must acknowledged that such studies take a long time to conduct and are very cost‐intensive. Therefore, it is not surprising that the producers of deferasirox have no particular interest in undertaking these types of studies after treatment has been approved by the Food and Drug Administration (FDA) and the European Medicines Agency (EMA). However, such studies are necessary for a comprehensive evaluation of the effects of deferasirox as compared to deferoxamine.
Furthermore, it has to be acknowledged that six included studies were supported by the manufacturer of deferasirox.
Finally, the oral mode of application of deferasirox offers an important advantage of deferasirox over deferoxamine, which is of high relevance to those with the disease (Taher 2010). Comparing the two oral iron chelators (deferasirox and deferiprone), deferasirox allows for an easier application ‐ once‐daily compared to three‐times daily. Therefore, physicians prefer to prescribe deferasirox. Nevertheless, data on adherence from randomised controlled studies are still limited. One such study comparing deferasirox to deferoxamine showed no difference in adherence (Pennell 2014), while a study comparing deferasirox and deferiprone to deferiprone and deferoxamine showed a significant higher adherence favouring the combination of oral iron chelators (Elalfy 2015b). Whether this advantage will translate into better long‐term adherence and improved patient‐relevant outcomes is still to be shown (Trachtenberg 2011). Recently, the FDA and the EMA have approved a new formulation of deferasirox (Chalmers 2016; EMA 2016; Novartis 2015). These tablets can be swallowed with some water in a single step without dispersing in water, which could further increase adherence. Results of studies investigating this new formulation are not yet available, but may influence future updates of this review, in particular regarding adherence and safety compared to other iron chelators.
Quality of the evidence
The evidence on deferasirox for treating iron overload in thalassaemia is still limited.
The quality of included studies comparing deferasirox to deferoxamine in people with transfusion‐dependent thalassaemia was moderate to low, mainly due to a lack of blinding and selective reporting, the use of a surrogate marker instead of patient‐important outcomes and imprecision. For the comparison of deferasirox to placebo in people with non‐transfusion‐dependent thalassaemia, the quality of the evidence was moderate to very low based on only one small study. For the other comparisons, quality of evidence was low to very low, mainly due to the inclusion of even fewer participants.
Potential biases in the review process
A very comprehensive search strategy was applied to identify all potential studies and their reports. However, information on several relevant outcome data prespecified in our protocol were not reported. Several of these outcome measures are, however, important to make an informed and balanced decision on which chelator to choose. Some of these outcome measures were most likely not ascertained during the study, however, others could have well been collected but not reported. Unfortunately, even after contacting the primary investigators, to date we have not been able to obtain any additional data.
We followed the rigorous methodology for systematic reviews outlined in the Cochrane Handbook for Systematic Reviews of Interventions (Higgins 2011), e.g. extracting data independently in duplicate to minimize errors and reduce bias in the process of doing this systematic review.
Agreements and disagreements with other studies or reviews
Vanorden and Hagemann published the first review on deferasirox based on a systematic literature search in 2006 (Vanorden 2006). Besides data from the phase III study (Cappellini 2005b), this review includes evidence from phase I and phase II as well as pharmacokinetic studies in both humans and non‐humans. The authors made no attempt to pool the data; so findings are presented narratively (including observational data). The authors concluded that their findings suggest that deferasirox is as safe and effective as deferoxamine.
Lindsey and co‐authors summarized the available data from five phase I/II and the one phase III study in their systematic review published in 2007 (Lindsey 2007). All six studies are critically discussed, but no pooling of data was performed and data are synthesized qualitatively. Based on the only study looking at efficacy as a primary endpoint (Cappellini 2006), the authors come to the conclusion that the two agents have similar efficacy, although overall the non‐inferiority of deferasirox could not be shown by the primary phase III study investigators. Tolerability is assessed as good, even though deferasirox is associated with a higher incidence of adverse effects. The authors conclude that long‐term efficacy and safety remain to be established.
In 2009, McLeod and co‐authors published a comprehensive health technology assessment on deferasirox for secondary iron overload in individuals with chronic anaemia, such as thalassaemia and sickle cell disease (McLeod 2009). They identified 14 randomised studies looking at various iron chelation regimens with a high degree of heterogeneity between studies in terms of study design and outcome reporting. Only three of these compared deferasirox to deferoxamine, but data were not included in a meta‐analysis. Furthermore, eight economic evaluations were included in their report. The authors conclude that it appears that there is little difference between agents in terms of reducing serum ferritin. The economic evaluations appear to demonstrate the cost‐effectiveness of deferasirox compared to deferoxamine. However, the authors state that both their clinical and economic analyses were restricted by the available evidence and should only be considered exploratory.
Cochrane Reviews on the effects of deferasirox in people with sickle cell disease (Meerpohl 2014a) and myelodysplastic syndrome (Meerpohl 2014) have been published; both conclude that data on deferasirox in these groups of people are still limited and therefore evidence is insufficient to recommend first‐line use of deferasirox in sickle cell disease or myelodysplastic syndrome. Several narrative reviews on deferasirox have also been published of late. These have usually concluded that efficacy is given and the profile of adverse events manageable and therefore acceptable (Cappellini 2008; Cappellini 2009; Porter 2009).
A clinical practice guideline by the Italian Society of Hematology for the management of iron overload in thalassaemia major and related disorders supports our findings and conclusions by recommending deferoxamine for children who start iron chelation therapy before six years of age and in whom the goal of chelation therapy is the prophylactic maintenance of iron balance; while oral chelators (such as deferasirox) should be considered investigational and be used primarily within clinical trials or registries or for patients with poor adherence to, or experiencing AEs from deferoxamine (Angelucci 2008). Due to the limited evidence, these recommendations were given a level D according to the Scottish Intercollegiate Guidelines Network (SIGN) grading system reflecting consensus of the experts (SIGN 2008). This recommendation is in line with the approval by the EMA as first‐line only in people with thalassemia major from six years of age (EMA 2016). In contrast, the FDA have already approved deferasirox in individuals with thalassemia major aged two years of age and older and in non‐transfusion‐dependent thalassemia individuals aged 10 years and older with a LIC of at least 5 mg Fe/g dry weight and serum ferritin over 300 µg/L (FDA 2013).
A systematic review published by Maggio in 2011 reviewed randomised controlled studies for all three iron chelators used in people with thalassaemia major (Maggio 2011). The authors included two studies considering deferasirox (Cappellini 2005b; Nisbet‐Brown 2001). They did not pool data from the different dosing subgroups, but analysed the comparisons separately and found significantly lower increases in serum ferritin favouring deferoxamine compared to deferasirox 5 mg/day and 10 mg/day, significantly higher decreases in the deferoxamine group compared to deferasirox 20 mg/day and no significant difference in decrease in the deferasirox 30 mg group versus deferoxamine.
Some additional data, including longer‐term effects on deferasirox, were available from observational studies. However, these studies were not systematically searched for nor critically evaluated within this review. Also, due to a higher risk of bias and potential confounding, these types of data are not as well‐suited for comparison of two interventions as are data from high quality randomised studies.
It is important to note, however, that other more severe AEs have been reported, such as: cytopenias; Fanconi syndrome and renal failure (Grange 2010; Rafat 2009; Yew 2010); liver failure; and gastrointestinal bleeding, which resulted in a boxed warning by the FDA (FDA Boxed Warning 2010). These potential severe AEs must be taken into consideration when prescribing or using deferasirox.
Also, some studies have shown that higher doses of deferasirox than those evaluated in the early included studies are often needed to achieve adequate reduction of iron overload or prevent further iron accumulation in heavily‐transfused individuals (Chirnomas 2009; Taher 2009).

Study flow diagram.

Risk of bias graph: review authors' judgements about each risk of bias item presented as percentages across all included studies.

Risk of bias summary: review authors' judgements about each risk of bias item for each included study.

Comparison 1 Transfusion‐dependent thalassemia: deferasirox vs placebo, Outcome 1 Mortality at any time point.

Comparison 1 Transfusion‐dependent thalassemia: deferasirox vs placebo, Outcome 2 AEs.

Comparison 1 Transfusion‐dependent thalassemia: deferasirox vs placebo, Outcome 3 Discontinuations due to serious AEs.
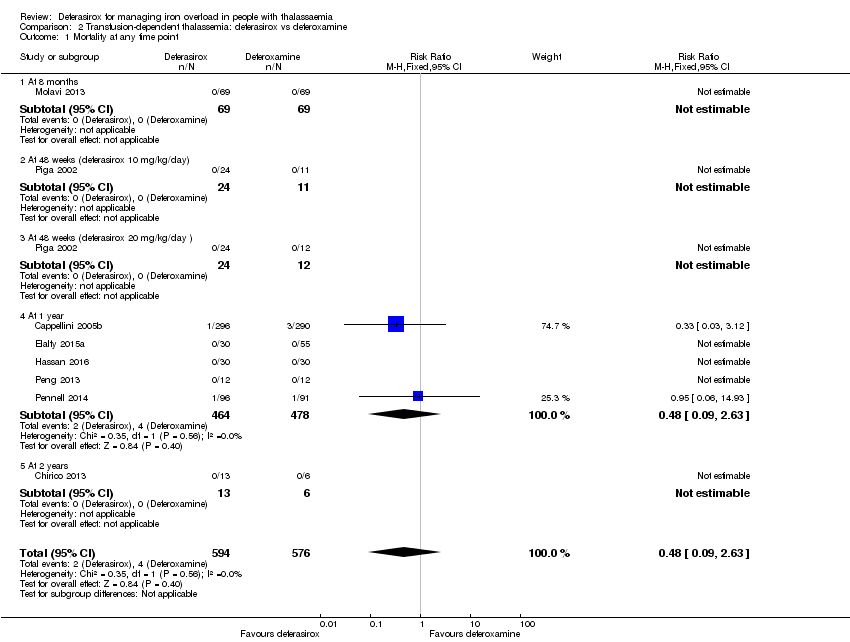
Comparison 2 Transfusion‐dependent thalassemia: deferasirox vs deferoxamine, Outcome 1 Mortality at any time point.

Comparison 2 Transfusion‐dependent thalassemia: deferasirox vs deferoxamine, Outcome 2 LVEF (%): least squares mean change from baseline.

Comparison 2 Transfusion‐dependent thalassemia: deferasirox vs deferoxamine, Outcome 3 LVEF (# participants affected).

Comparison 2 Transfusion‐dependent thalassemia: deferasirox vs deferoxamine, Outcome 4 Incidence of thyroid disease at end of study.

Comparison 2 Transfusion‐dependent thalassemia: deferasirox vs deferoxamine, Outcome 5 ALT (# participants affected): improvement from abnormal to normal range.

Comparison 2 Transfusion‐dependent thalassemia: deferasirox vs deferoxamine, Outcome 6 ALT (U/L) at end of study.

Comparison 2 Transfusion‐dependent thalassemia: deferasirox vs deferoxamine, Outcome 7 AST (U/L) at end of study.

Comparison 2 Transfusion‐dependent thalassemia: deferasirox vs deferoxamine, Outcome 8 Serum creatinine (mg/dL) at end of study.

Comparison 2 Transfusion‐dependent thalassemia: deferasirox vs deferoxamine, Outcome 9 Blood urea (mg/dL): mean at end of study.
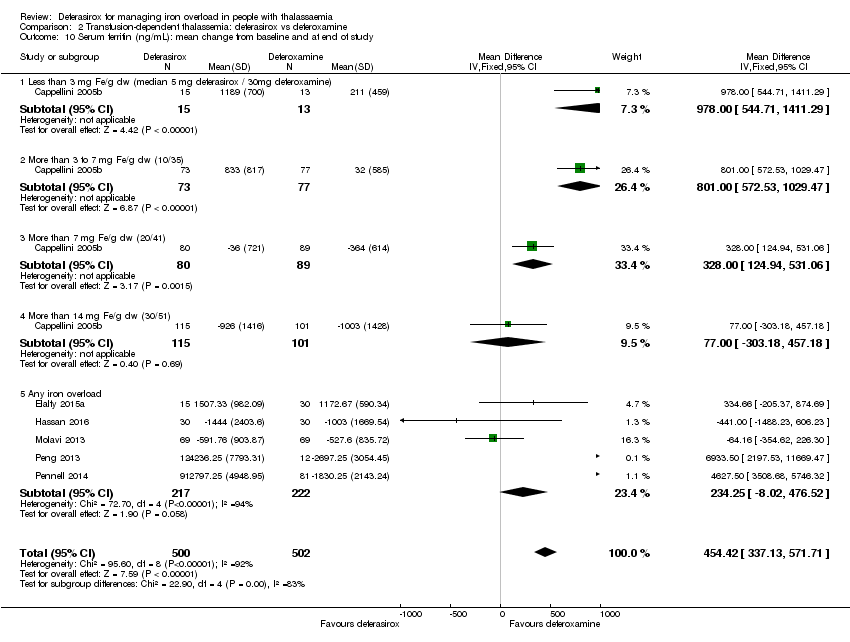
Comparison 2 Transfusion‐dependent thalassemia: deferasirox vs deferoxamine, Outcome 10 Serum ferritin (ng/mL): mean change from baseline and at end of study.

Comparison 2 Transfusion‐dependent thalassemia: deferasirox vs deferoxamine, Outcome 11 Sensitivity analysis: serum ferritin (ng/mL): mean change from baseline.

Comparison 2 Transfusion‐dependent thalassemia: deferasirox vs deferoxamine, Outcome 12 Liver R2* (Hz): mean change from baseline.

Comparison 2 Transfusion‐dependent thalassemia: deferasirox vs deferoxamine, Outcome 13 LIC (mg/g) evaluated by MRI (R2/R2*): mean change from baseline.

Comparison 2 Transfusion‐dependent thalassemia: deferasirox vs deferoxamine, Outcome 14 LIC (mg Fe/g dw) evaluated by biopsy or SQUID: mean change from baseline.

Comparison 2 Transfusion‐dependent thalassemia: deferasirox vs deferoxamine, Outcome 15 Responder analysis I (responder: fall in LIC > 10%).

Comparison 2 Transfusion‐dependent thalassemia: deferasirox vs deferoxamine, Outcome 16 Responder analysis II (responder: LIC 1 to < 7 mg Fe/g dw).

Comparison 2 Transfusion‐dependent thalassemia: deferasirox vs deferoxamine, Outcome 17 Myocardial T2* (ms): mean change from baseline.

Comparison 2 Transfusion‐dependent thalassemia: deferasirox vs deferoxamine, Outcome 18 Myocardial iron concentration derived from T2* value (mg Fe/g dw): change from baseline.

Comparison 2 Transfusion‐dependent thalassemia: deferasirox vs deferoxamine, Outcome 19 Myocardial T2* (# participants affected).

Comparison 2 Transfusion‐dependent thalassemia: deferasirox vs deferoxamine, Outcome 20 Iron excretion‐intake ratio.

Comparison 2 Transfusion‐dependent thalassemia: deferasirox vs deferoxamine, Outcome 21 Any serious AEs (# participants affected).

Comparison 2 Transfusion‐dependent thalassemia: deferasirox vs deferoxamine, Outcome 22 Serious AEs.

Comparison 2 Transfusion‐dependent thalassemia: deferasirox vs deferoxamine, Outcome 23 Any AE (# participants affected).
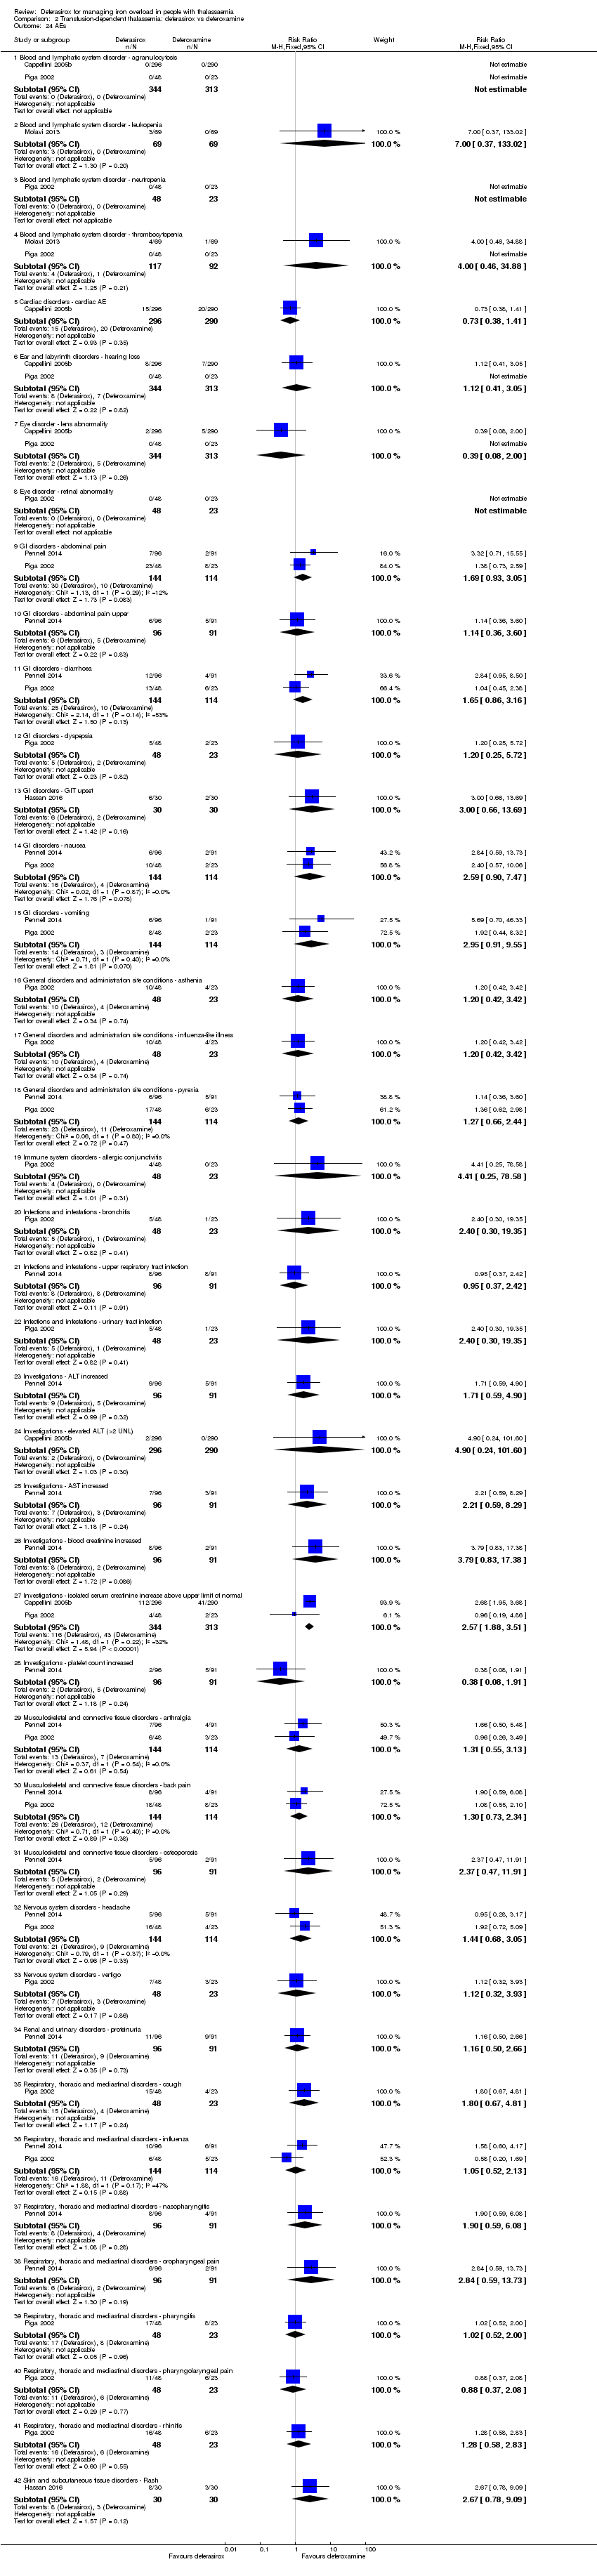
Comparison 2 Transfusion‐dependent thalassemia: deferasirox vs deferoxamine, Outcome 24 AEs.

Comparison 2 Transfusion‐dependent thalassemia: deferasirox vs deferoxamine, Outcome 25 Any drug‐related AE (# participants affected).
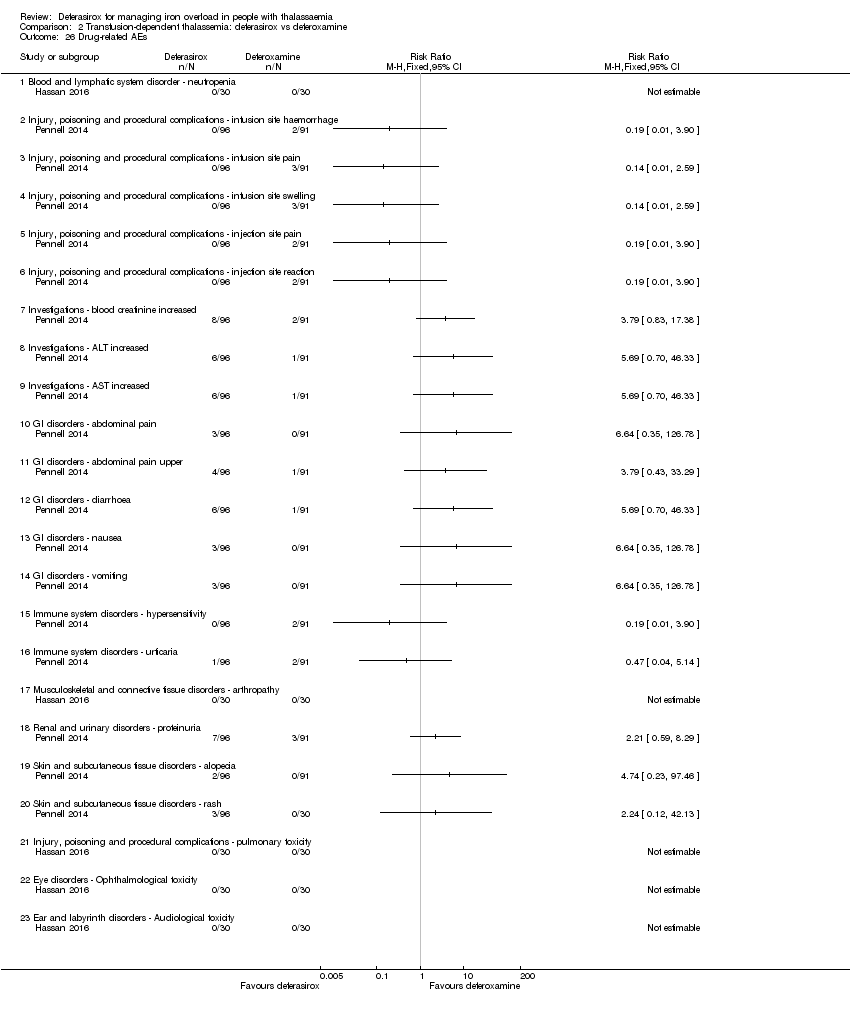
Comparison 2 Transfusion‐dependent thalassemia: deferasirox vs deferoxamine, Outcome 26 Drug‐related AEs.

Comparison 2 Transfusion‐dependent thalassemia: deferasirox vs deferoxamine, Outcome 27 Satisfaction with treatment (very satisfied or satisfied).
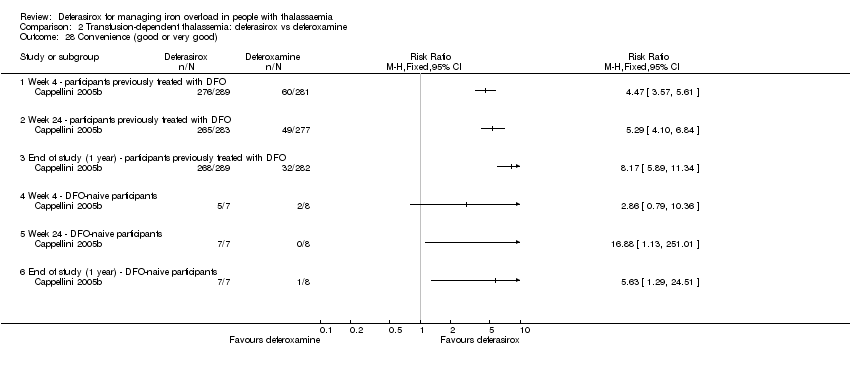
Comparison 2 Transfusion‐dependent thalassemia: deferasirox vs deferoxamine, Outcome 28 Convenience (good or very good).

Comparison 2 Transfusion‐dependent thalassemia: deferasirox vs deferoxamine, Outcome 29 Willingness to continue treatment.

Comparison 2 Transfusion‐dependent thalassemia: deferasirox vs deferoxamine, Outcome 30 Time lost from normal activities due to treatment (hours/month): participants treated previously with DFO.

Comparison 2 Transfusion‐dependent thalassemia: deferasirox vs deferoxamine, Outcome 31 Adherence (% of planned dose).

Comparison 2 Transfusion‐dependent thalassemia: deferasirox vs deferoxamine, Outcome 32 Discontinuations.

Comparison 2 Transfusion‐dependent thalassemia: deferasirox vs deferoxamine, Outcome 33 Dose adjustments and dose interruptions.

Comparison 2 Transfusion‐dependent thalassemia: deferasirox vs deferoxamine, Outcome 34 Dose interruptions (interrupted at least once).

Comparison 2 Transfusion‐dependent thalassemia: deferasirox vs deferoxamine, Outcome 35 Dose reduction (at least once).
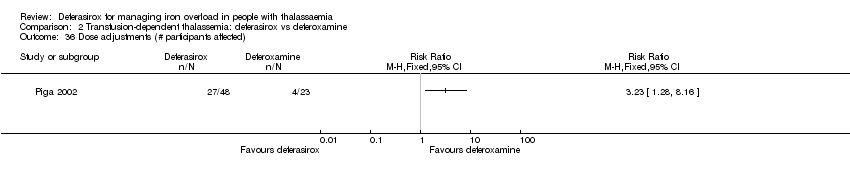
Comparison 2 Transfusion‐dependent thalassemia: deferasirox vs deferoxamine, Outcome 36 Dose adjustments (# participants affected).

Comparison 2 Transfusion‐dependent thalassemia: deferasirox vs deferoxamine, Outcome 37 Dose interruptions due to an AE (# participants affected).
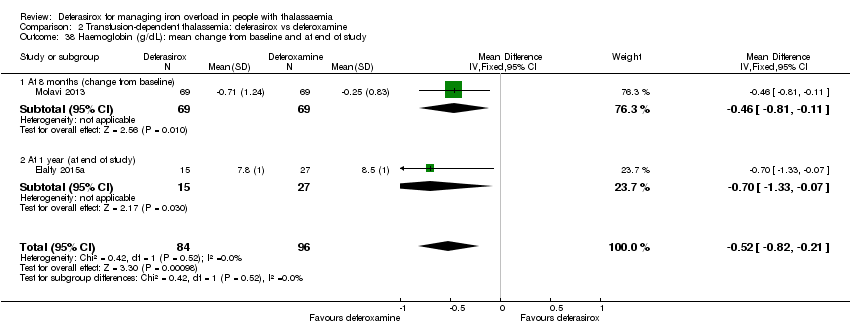
Comparison 2 Transfusion‐dependent thalassemia: deferasirox vs deferoxamine, Outcome 38 Haemoglobin (g/dL): mean change from baseline and at end of study.

Comparison 2 Transfusion‐dependent thalassemia: deferasirox vs deferoxamine, Outcome 39 Transfusion index (mL/kg/year): mean at end of study.

Comparison 2 Transfusion‐dependent thalassemia: deferasirox vs deferoxamine, Outcome 40 Transferrin saturation (%): mean at end of study.

Comparison 2 Transfusion‐dependent thalassemia: deferasirox vs deferoxamine, Outcome 41 Platelet count (x10³/mm³): mean at end of study.

Comparison 2 Transfusion‐dependent thalassemia: deferasirox vs deferoxamine, Outcome 42 Absolute neutrophilic count (/mm³): mean at end of study.

Comparison 3 Transfusion‐dependent thalassemia: deferasirox vs deferiprone, Outcome 1 Mortality at any time point.
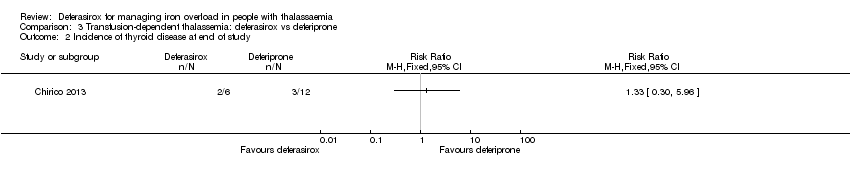
Comparison 3 Transfusion‐dependent thalassemia: deferasirox vs deferiprone, Outcome 2 Incidence of thyroid disease at end of study.

Comparison 3 Transfusion‐dependent thalassemia: deferasirox vs deferiprone, Outcome 3 ALT (U/L): mean change from baseline.

Comparison 3 Transfusion‐dependent thalassemia: deferasirox vs deferiprone, Outcome 4 AST (U/L): mean change from baseline.
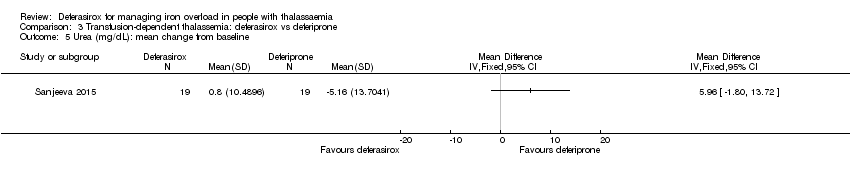
Comparison 3 Transfusion‐dependent thalassemia: deferasirox vs deferiprone, Outcome 5 Urea (mg/dL): mean change from baseline.

Comparison 3 Transfusion‐dependent thalassemia: deferasirox vs deferiprone, Outcome 6 Creatinine (mg/dL): mean change from baseline.

Comparison 3 Transfusion‐dependent thalassemia: deferasirox vs deferiprone, Outcome 7 Neutrophil (count per mm³): mean change from baseline.

Comparison 3 Transfusion‐dependent thalassemia: deferasirox vs deferiprone, Outcome 8 Serum ferritin (ng/mL): mean change from baseline and at end of study.

Comparison 3 Transfusion‐dependent thalassemia: deferasirox vs deferiprone, Outcome 9 LIC (mg/g) evaluated by MRI (R2*): mean change from baseline.
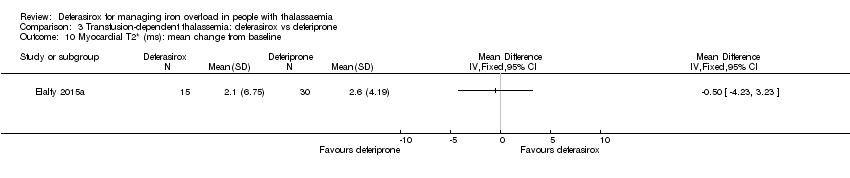
Comparison 3 Transfusion‐dependent thalassemia: deferasirox vs deferiprone, Outcome 10 Myocardial T2* (ms): mean change from baseline.

Comparison 3 Transfusion‐dependent thalassemia: deferasirox vs deferiprone, Outcome 11 Any AE (# participants affected).

Comparison 3 Transfusion‐dependent thalassemia: deferasirox vs deferiprone, Outcome 12 AEs.

Comparison 3 Transfusion‐dependent thalassemia: deferasirox vs deferiprone, Outcome 13 Discontinuations (# participants affected).
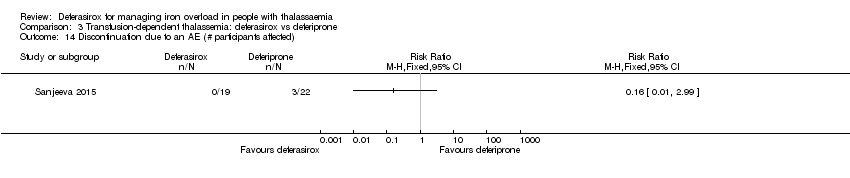
Comparison 3 Transfusion‐dependent thalassemia: deferasirox vs deferiprone, Outcome 14 Discontinuation due to an AE (# participants affected).

Comparison 3 Transfusion‐dependent thalassemia: deferasirox vs deferiprone, Outcome 15 Transferrin saturation (%): mean at end of study.

Comparison 3 Transfusion‐dependent thalassemia: deferasirox vs deferiprone, Outcome 16 Haemoglobin (g/dL): mean at end of study.

Comparison 3 Transfusion‐dependent thalassemia: deferasirox vs deferiprone, Outcome 17 Transfusion index (mL/kg/year): mean at end of study.

Comparison 3 Transfusion‐dependent thalassemia: deferasirox vs deferiprone, Outcome 18 ALP (U/L): mean change from baseline.

Comparison 6 Transfusion‐dependent thalassemia: deferasirox + deferoxamine vs deferoxamine, Outcome 1 Mortality at any time point.

Comparison 6 Transfusion‐dependent thalassemia: deferasirox + deferoxamine vs deferoxamine, Outcome 2 Neutrophil (µg/L): mean at end of study.
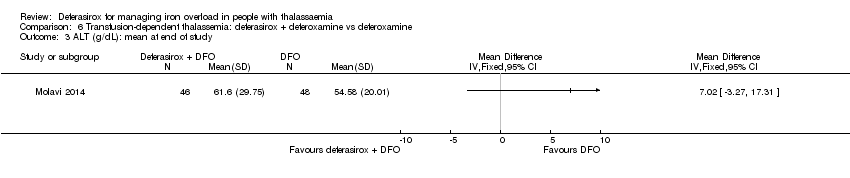
Comparison 6 Transfusion‐dependent thalassemia: deferasirox + deferoxamine vs deferoxamine, Outcome 3 ALT (g/dL): mean at end of study.

Comparison 6 Transfusion‐dependent thalassemia: deferasirox + deferoxamine vs deferoxamine, Outcome 4 AST (g/dL): mean at end of study.

Comparison 6 Transfusion‐dependent thalassemia: deferasirox + deferoxamine vs deferoxamine, Outcome 5 Serum ferritin: mean at end of study (ng/mL).

Comparison 6 Transfusion‐dependent thalassemia: deferasirox + deferoxamine vs deferoxamine, Outcome 6 Discontinuations.
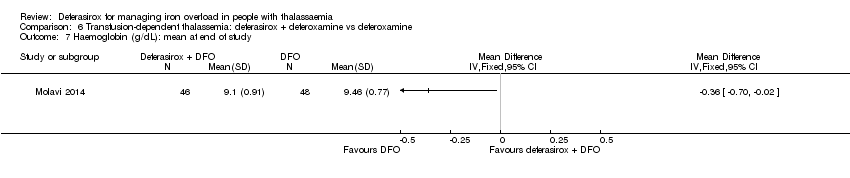
Comparison 6 Transfusion‐dependent thalassemia: deferasirox + deferoxamine vs deferoxamine, Outcome 7 Haemoglobin (g/dL): mean at end of study.

Comparison 6 Transfusion‐dependent thalassemia: deferasirox + deferoxamine vs deferoxamine, Outcome 8 ALP (g/dL): mean at end of study.

Comparison 7 Transfusion‐dependent thalassemia: deferasirox + deferiprone vs deferiprone + deferoxamine, Outcome 1 Mortality at any time point.
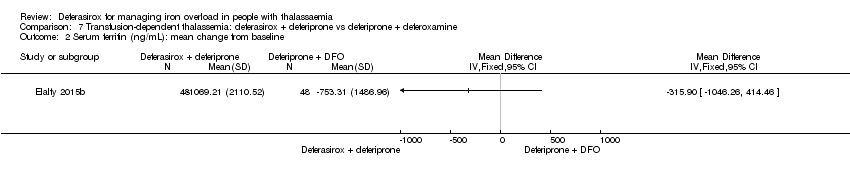
Comparison 7 Transfusion‐dependent thalassemia: deferasirox + deferiprone vs deferiprone + deferoxamine, Outcome 2 Serum ferritin (ng/mL): mean change from baseline.

Comparison 7 Transfusion‐dependent thalassemia: deferasirox + deferiprone vs deferiprone + deferoxamine, Outcome 3 LIC (mg/g) evaluated by MRI (R2*): mean change from baseline.
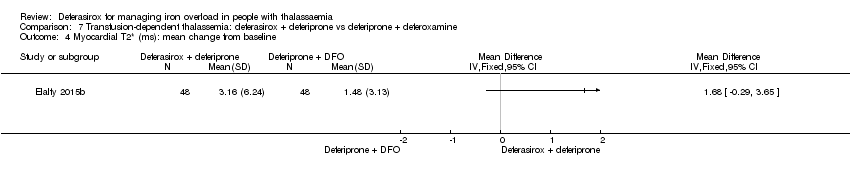
Comparison 7 Transfusion‐dependent thalassemia: deferasirox + deferiprone vs deferiprone + deferoxamine, Outcome 4 Myocardial T2* (ms): mean change from baseline.
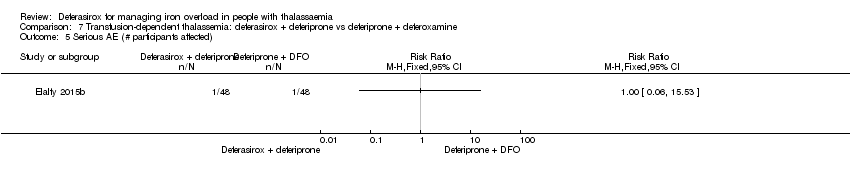
Comparison 7 Transfusion‐dependent thalassemia: deferasirox + deferiprone vs deferiprone + deferoxamine, Outcome 5 Serious AE (# participants affected).

Comparison 7 Transfusion‐dependent thalassemia: deferasirox + deferiprone vs deferiprone + deferoxamine, Outcome 6 Serious drug‐related AE (# participants affected).

Comparison 7 Transfusion‐dependent thalassemia: deferasirox + deferiprone vs deferiprone + deferoxamine, Outcome 7 Serious non‐related drug AE.

Comparison 7 Transfusion‐dependent thalassemia: deferasirox + deferiprone vs deferiprone + deferoxamine, Outcome 8 AEs.

Comparison 7 Transfusion‐dependent thalassemia: deferasirox + deferiprone vs deferiprone + deferoxamine, Outcome 9 Drug‐related AEs (# participants affected).

Comparison 7 Transfusion‐dependent thalassemia: deferasirox + deferiprone vs deferiprone + deferoxamine, Outcome 10 Drug‐related AEs.
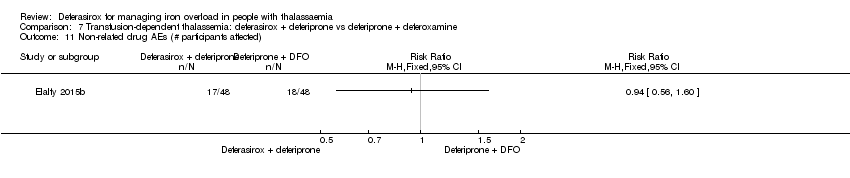
Comparison 7 Transfusion‐dependent thalassemia: deferasirox + deferiprone vs deferiprone + deferoxamine, Outcome 11 Non‐related drug AEs (# participants affected).
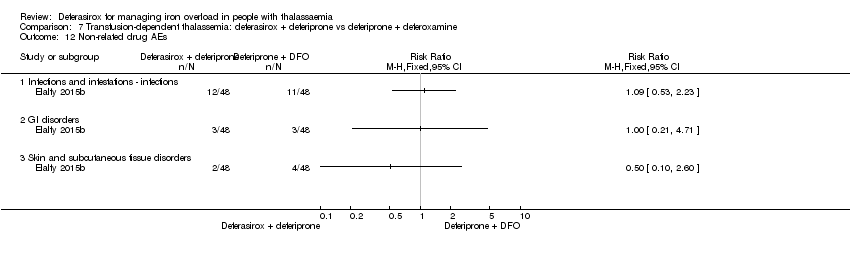
Comparison 7 Transfusion‐dependent thalassemia: deferasirox + deferiprone vs deferiprone + deferoxamine, Outcome 12 Non‐related drug AEs.

Comparison 7 Transfusion‐dependent thalassemia: deferasirox + deferiprone vs deferiprone + deferoxamine, Outcome 13 Mild elevation of hepatic transaminases at start of therapy (# participants affected).

Comparison 7 Transfusion‐dependent thalassemia: deferasirox + deferiprone vs deferiprone + deferoxamine, Outcome 14 Initial gastrointestinal manifestations (# participants affected).

Comparison 7 Transfusion‐dependent thalassemia: deferasirox + deferiprone vs deferiprone + deferoxamine, Outcome 15 Quality of life (%) (measured by SF‐36): mean change from baseline.

Comparison 7 Transfusion‐dependent thalassemia: deferasirox + deferiprone vs deferiprone + deferoxamine, Outcome 16 Adherence: actual dose/total prescribed dose.

Comparison 7 Transfusion‐dependent thalassemia: deferasirox + deferiprone vs deferiprone + deferoxamine, Outcome 17 Discontinuations.

Comparison 7 Transfusion‐dependent thalassemia: deferasirox + deferiprone vs deferiprone + deferoxamine, Outcome 18 Serious AE resulting in study discontinuation or interruption.

Comparison 8 Non‐transfusion‐dependent thalassemia: deferasirox vs placebo, Outcome 1 Mortality at any time point.

Comparison 8 Non‐transfusion‐dependent thalassemia: deferasirox vs placebo, Outcome 2 Serum ferritin (ng/mL): mean change from baseline.

Comparison 8 Non‐transfusion‐dependent thalassemia: deferasirox vs placebo, Outcome 3 LIC (mg Fe/g dw) evaluated by MRI R2: least squares mean change from baseline.

Comparison 8 Non‐transfusion‐dependent thalassemia: deferasirox vs placebo, Outcome 4 LIC (mg Fe/g dw) evaluated by MRI R2: mean change from baseline.
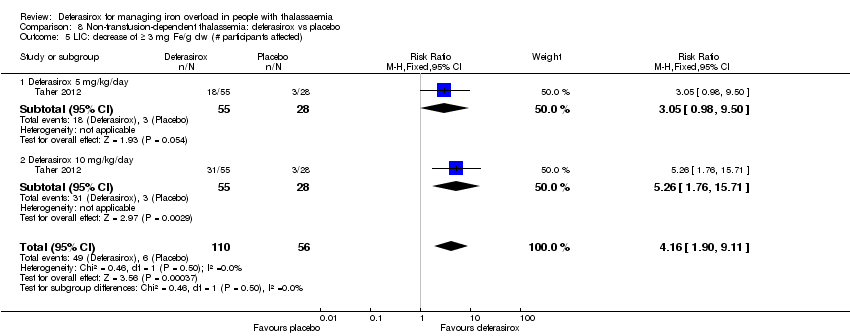
Comparison 8 Non‐transfusion‐dependent thalassemia: deferasirox vs placebo, Outcome 5 LIC: decrease of ≥ 3 mg Fe/g dw (# participants affected).

Comparison 8 Non‐transfusion‐dependent thalassemia: deferasirox vs placebo, Outcome 6 LIC: ≥ 30% reduction Fe/g dw (# participants affected).

Comparison 8 Non‐transfusion‐dependent thalassemia: deferasirox vs placebo, Outcome 7 LIC: shift to lower iron burden range (# participants affected).
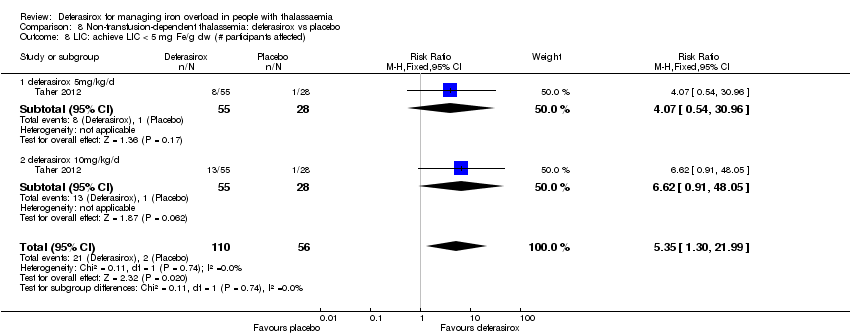
Comparison 8 Non‐transfusion‐dependent thalassemia: deferasirox vs placebo, Outcome 8 LIC: achieve LIC < 5 mg Fe/g dw (# participants affected).

Comparison 8 Non‐transfusion‐dependent thalassemia: deferasirox vs placebo, Outcome 9 Drug‐related serious AEs (# participants affected).

Comparison 8 Non‐transfusion‐dependent thalassemia: deferasirox vs placebo, Outcome 10 Drug‐related serious AEs (# participants affected).

Comparison 8 Non‐transfusion‐dependent thalassemia: deferasirox vs placebo, Outcome 11 Any AE (# participants affected).

Comparison 8 Non‐transfusion‐dependent thalassemia: deferasirox vs placebo, Outcome 12 Mild AE (# participants affected).

Comparison 8 Non‐transfusion‐dependent thalassemia: deferasirox vs placebo, Outcome 13 Moderate AE (# participants affected).

Comparison 8 Non‐transfusion‐dependent thalassemia: deferasirox vs placebo, Outcome 14 Severe AE (# participants affected).

Comparison 8 Non‐transfusion‐dependent thalassemia: deferasirox vs placebo, Outcome 15 AEs.

Comparison 8 Non‐transfusion‐dependent thalassemia: deferasirox vs placebo, Outcome 16 Drug‐related AEs.

Comparison 8 Non‐transfusion‐dependent thalassemia: deferasirox vs placebo, Outcome 17 Adherence (# participants taking the planned study dose).

Comparison 8 Non‐transfusion‐dependent thalassemia: deferasirox vs placebo, Outcome 18 Discontinuations.

Comparison 8 Non‐transfusion‐dependent thalassemia: deferasirox vs placebo, Outcome 19 Discontinuing study due to AE (# participants affected).

Comparison 8 Non‐transfusion‐dependent thalassemia: deferasirox vs placebo, Outcome 20 Dose increase.
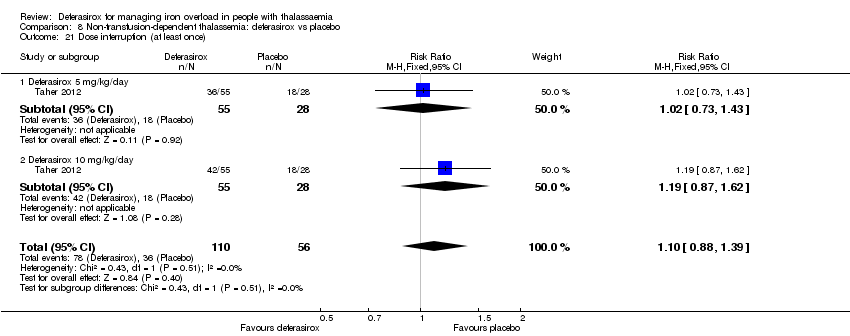
Comparison 8 Non‐transfusion‐dependent thalassemia: deferasirox vs placebo, Outcome 21 Dose interruption (at least once).
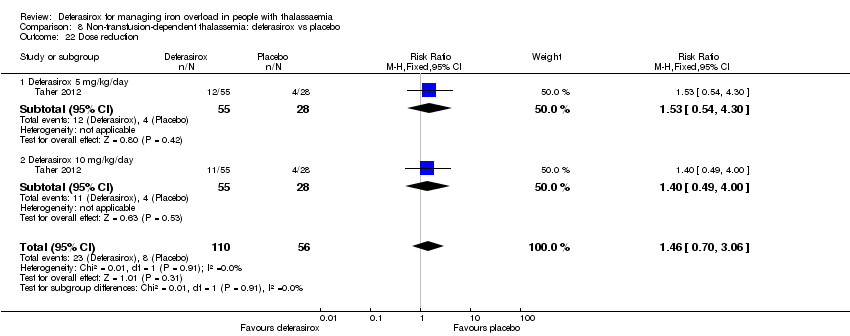
Comparison 8 Non‐transfusion‐dependent thalassemia: deferasirox vs placebo, Outcome 22 Dose reduction.

Comparison 8 Non‐transfusion‐dependent thalassemia: deferasirox vs placebo, Outcome 23 Dose reduction due to AE.

Comparison 8 Non‐transfusion‐dependent thalassemia: deferasirox vs placebo, Outcome 24 Haemoglobin (g/L): mean change from baseline.

Comparison 8 Non‐transfusion‐dependent thalassemia: deferasirox vs placebo, Outcome 25 Transferrin saturation (%): mean change from baseline.
| Deferasirox compared to deferoxamine in people with transfusion‐dependent thalassemia | ||||||
| Patient or population: people with transfusion‐dependent thalassemia | ||||||
| Outcomes | Anticipated absolute effects* (95% CI) | Relative effect | № of participants | Quality of the evidence | Comments | |
| Risk with deferoxamine | Risk with deferasirox | |||||
| Mortality at any time point | Study population | RR 0.48 | 1170 | ⊕⊕⊝⊝ | ||
| 7 per 1.000 | 3 per 1.000 | |||||
| Responder analysis II (responder: LIC 1 to less than 7 mg Fe/g dw) | Study population | RR 0.80 | 553 | ⊕⊕⊕⊝ | ||
| 664 per 1.000 | 531 per 1.000 | |||||
| Serum ferritin (ng/mL): mean change from baseline and at end of study | MD 454.42 higher | ‐ | 1002 | ⊕⊕⊕⊝ | ||
| LIC (mg Fe/g dw) evaluated by biopsy or SQUID: mean change from baseline | MD 2.37 higher | ‐ | 541 | ⊕⊕⊕⊝ | ||
| Satisfaction with treatment (very satisfied or satisfied): participants previously treated with DFO | Study population | RR 2.20 | 571 | ⊕⊕⊕⊝ | ||
| 1.330 per 1.000 | 1000 per 1.000 | |||||
| Adherence: discontinuations | Study population | RR 0.95 | 1211 | ⊕⊕⊝⊝ | ||
| 54 per 1.000 | 52 per 1.000 | |||||
| AE: investigations ‐ isolated serum creatinine increase above ULN | Study population | RR 2.57 | 657 | ⊕⊕⊝⊝ | ||
| 137 per 1.000 | 353 per 1.000 | |||||
| *The risk in the intervention group (and its 95% CI) is based on the assumed risk in the comparison group and the relative effect of the intervention (and its 95% CI). | ||||||
| GRADE Working Group grades of evidence | ||||||
| 1 Serious risk of bias: studies that carry large weight for the overall effect estimate rated as high risk of bias due to lack of blinding and selective reporting. | ||||||
| Deferasirox compared to deferiprone in people with transfusion‐dependent thalassemia | ||||||
| Patient or population:people with transfusion‐dependent thalassemia | ||||||
| Outcomes | Anticipated absolute effects* (95% CI) | Relative effect | № of participants | Quality of the evidence | Comments | |
| Risk with deferiprone | Risk with deferasirox | |||||
| Mortality at any time point | Study population | not estimable | 146 | ⊕⊝⊝⊝ | ||
| 0 per 1.000 | 0 per 1.000 | |||||
| Responder analysis | Not measured | NA | ||||
| Serum ferritin (ng/mL): mean change from baseline and at end of study | MD 229.99 ng/mL higher | ‐ | 83 | ⊕⊝⊝⊝ | ||
| LIC (mg/g) evaluated by MRI R2*: mean change from baseline | MD 0.8 mg/g lower | ‐ | 45 | ⊕⊝⊝⊝ | ||
| Satisfaction | Not measured | NA | ||||
| Adherence: discontinuations | Study population | RR 0.16 | 179 | ⊕⊕⊝⊝ | ||
| 32 per 1.000 | 5 per 1.000 | |||||
| Renal failure | Study population | not estimable | 38 | ⊕⊝⊝⊝ | ||
| 0 per 1.000 | 0 per 1.000 | |||||
| *The risk in the intervention group (and its 95% CI) is based on the assumed risk in the comparison group and the relative effect of the intervention (and its 95% CI). | ||||||
| GRADE Working Group grades of evidence | ||||||
| 1 Very serious imprecision: only very few number of included participants. | ||||||
| Deferasirox alone compared to combined deferasirox and deferiprone in people with transfusion‐dependent thalassaemia | ||||||
| Patient or population: people with transfusion‐dependent thalassaemia | ||||||
| Outcomes | Anticipated absolute effects* (95% CI) | Relative effect | № of participants | Quality of the evidence | Comments | |
| Risk with deferasirox and deferiprone | Risk with deferasirox | |||||
| Mortality at any time point | Not reported1 | NA | ||||
| Responder analysis | Not measured1 | NA | ||||
| Serum ferritin (ng/mL) | Not reported1 | NA | ||||
| LIC (mg Fe/g dry weight) | Not reported1 | NA | ||||
| Satisfaction with treatment | Not measured1 | NA | ||||
| Adherence | Not reported1 | NA | ||||
| AE: serum creatinine increase | Not measured1 | NA | ||||
| *The risk in the intervention group (and its 95% CI) is based on the assumed risk in the comparison group and the relative effect of the intervention (and its 95% CI). | ||||||
| GRADE Working Group grades of evidence | ||||||
| 1 One RCT (40 participants) contributed to this comparison, but no relevant outcome data to this table are available (Kakkar 2014). | ||||||
| Combined deferasirox and deferiprone compared to deferiprone alone in people with transfusion‐dependent thalassaemia | ||||||
| Patient or population: people with transfusion‐dependent thalassemia | ||||||
| Outcomes | Anticipated absolute effects* (95% CI) | Relative effect | № of participants | Quality of the evidence | Comments | |
| Risk with deferasirox and deferiprone | Risk with deferasirox | |||||
| Mortality at any time point | Not reported1 | NA | ||||
| Responder analysis | Not measured1 | NA | ||||
| Serum ferritin (ng/mL) | Not reported1 | NA | ||||
| LIC (mg Fe/g dry weight) | Not reported1 | NA | ||||
| Satisfaction with treatment | Not measured1 | NA | ||||
| Adherence | Not reported1 | NA | ||||
| AE: Serum creatinine increase | Not measured1 | NA | ||||
| *The risk in the intervention group (and its 95% CI) is based on the assumed risk in the comparison group and the relative effect of the intervention (and its 95% CI). | ||||||
| GRADE Working Group grades of evidence | ||||||
| 1 One RCT (40 participants) contributed to this comparison, but no relevant outcome data to this table are available (Kakkar 2014). | ||||||
| Deferasirox and deferoxamine compared to deferoxamine in people with transfusion‐dependent thalassemia | ||||||
| Patient or population: people with transfusion‐dependent thalassemia | ||||||
| Outcomes | Anticipated absolute effects* (95% CI) | Relative effect | № of participants | Quality of the evidence | Comments | |
| Risk with deferoxamine | Risk with deferasirox and deferoxamine | |||||
| Mortality at any time point | Study population | not estimable | 94 | ⊕⊕⊝⊝ | ||
| 0 per 1.000 | 0 per 1.000 | |||||
| Responder analysis | Not measured | NA | ||||
| Serum ferritin (ng/mL) ‐ mean at end of study | MD 87.84 ng/mL higher | ‐ | 94 | ⊕⊝⊝⊝ | ||
| LIC | Not measured | NA | ||||
| Satisfaction with treatment | Not measured | NA | ||||
| Adherence: Discontinuations | Study population | not estimable | 94 | ⊕⊝⊝⊝ | ||
| 0 per 1.000 | 0 per 1.000 | |||||
| AE: serum creatinine increased | Not reported | NA | Serum creatinine was measured in Molavi 2014, but no results were reported. | |||
| *The risk in the intervention group (and its 95% CI) is based on the assumed risk in the comparison group and the relative effect of the intervention (and its 95% CI). | ||||||
| GRADE Working Group grades of evidence | ||||||
| 1 Very serious imprecision: only very few participants included. | ||||||
| Deferasirox and deferiprone compared to deferiprone and deferoxamine in people with transfusion‐dependent thalassemia | ||||||
| Patient or population: people with transfusion‐dependent thalassemia | ||||||
| Outcomes | Anticipated absolute effects* (95% CI) | Relative effect | № of participants | Quality of the evidence | Comments | |
| Risk with deferiprone and deferoxamine | Risk with deferasirox and deferiprone | |||||
| Mortality at any time point | Study population | not estimable | 96 | ⊕⊕⊝⊝ | "All the included patients continued till the end of study with no patients were lost follow‐up." (Elalfy 2015b) | |
| 0 per 1.000 | 0 per 1.000 | |||||
| Responder analysis | Not measured | NA | ||||
| Serum ferritin (ng/mL): mean change from baseline | MD 315.9 ng/mL lower | ‐ | 96 | ⊕⊝⊝⊝ | ||
| LIC evaluated by MRI R2*: mean change from baseline | MD 0.62 mg/g lower | ‐ | 96 | ⊕⊕⊝⊝ | ||
| Satisfaction | Not reported | NA | "Compared to baseline, patient‐reported satisfaction associated with ICT was significantly higher in group B [DFX and DFP] compared to group A [DFP and DFO] (p<0.01)" (Elalfy 2015b) | |||
| Adherence: Discontinuations | Study population | not estimable | 96 | ⊕⊝⊝⊝ | ||
| 0 per 1.000 | 0 per 1.000 | |||||
| Drug‐related AE: serum creatinine increased (≥ 33%) above baseline in 2 consecutive occasions | Study population | RR 3.00 | 96 | ⊕⊝⊝⊝ | ||
| 21 per 1.000 | 63 per 1.000 | |||||
| *The risk in the intervention group (and its 95% CI) is based on the assumed risk in the comparison group and the relative effect of the intervention (and its 95% CI). | ||||||
| GRADE Working Group grades of evidence | ||||||
| 1 Very serious imprecision: very few participants included. | ||||||
| Deferasirox compared to placebo in people with non‐transfusion‐dependent thalassemia | ||||||
| Patient or population: people with non‐transfusion‐dependent thalassemia | ||||||
| Outcomes | Anticipated absolute effects* (95% CI) | Relative effect | № of participants | Quality of the evidence | Comments | |
| Risk with placebo | Risk with deferasirox | |||||
| Mortality at any time point | Study population | not estimable | 148 | ⊕⊕⊕⊝ | "No deaths occurred during the study in any group" (Taher 2012) | |
| 0 per 1.000 | 0 per 1.000 | |||||
| Responder analysis | Not measured | NA | ||||
| Serum ferritin (ng/mL): mean change from baseline | MD 306.74 ng/mL lower | ‐ | 154 | ⊕⊕⊕⊝ | ||
| LIC (mg Fe/g dry weight) evaluated by MRI R2: least squares mean change from baseline | MD 3.27 mg Fe/g dry weight lower | ‐ | 159 | ⊕⊕⊕⊝ | ||
| Satisfaction with treatment | Not measured | NA | ||||
| Adherence: Discontinuations | Study population | RR 1.32 | 166 | ⊕⊕⊝⊝ | ||
| 89 per 1.000 | 118 per 1.000 | |||||
| AE: abnormal serum creatinine (post‐baseline) | Study population | RR 3.59 | 166 | ⊕⊝⊝⊝ | ||
| 0 per 1.000 | 0 per 1.000 | |||||
| *The risk in the intervention group (and its 95% CI) is based on the assumed risk in the comparison group and the relative effect of the intervention (and its 95% CI). | ||||||
| GRADE Working Group grades of evidence | ||||||
| 1 Serious imprecision: only few patients included. | ||||||
| Outcome or subgroup title | No. of studies | No. of participants | Statistical method | Effect size |
| 1 Mortality at any time point Show forest plot | 2 | 47 | Risk Ratio (M‐H, Fixed, 95% CI) | 0.0 [0.0, 0.0] |
| 2 AEs Show forest plot | 1 | Risk Ratio (M‐H, Fixed, 95% CI) | Totals not selected | |
| 2.1 Eye disorders ‐ retinal infarct | 1 | Risk Ratio (M‐H, Fixed, 95% CI) | 0.0 [0.0, 0.0] | |
| 2.2 GI disorders ‐ abdominal pain | 1 | Risk Ratio (M‐H, Fixed, 95% CI) | 0.0 [0.0, 0.0] | |
| 2.3 GI disorders ‐ diarrhoea | 1 | Risk Ratio (M‐H, Fixed, 95% CI) | 0.0 [0.0, 0.0] | |
| 2.4 GI disorders ‐ nausea | 1 | Risk Ratio (M‐H, Fixed, 95% CI) | 0.0 [0.0, 0.0] | |
| 2.5 Investigations ‐ extended QT interval, hypocalcaemia, hypoparathyroidism | 1 | Risk Ratio (M‐H, Fixed, 95% CI) | 0.0 [0.0, 0.0] | |
| 2.6 Skin and subcutaneous tissue disorders ‐ rash | 1 | Risk Ratio (M‐H, Fixed, 95% CI) | 0.0 [0.0, 0.0] | |
| 3 Discontinuations due to serious AEs Show forest plot | 1 | Risk Ratio (M‐H, Fixed, 95% CI) | Totals not selected | |
| Outcome or subgroup title | No. of studies | No. of participants | Statistical method | Effect size |
| 1 Mortality at any time point Show forest plot | 8 | 1170 | Risk Ratio (M‐H, Fixed, 95% CI) | 0.48 [0.09, 2.63] |
| 1.1 At 8 months | 1 | 138 | Risk Ratio (M‐H, Fixed, 95% CI) | 0.0 [0.0, 0.0] |
| 1.2 At 48 weeks (deferasirox 10 mg/kg/day) | 1 | 35 | Risk Ratio (M‐H, Fixed, 95% CI) | 0.0 [0.0, 0.0] |
| 1.3 At 48 weeks (deferasirox 20 mg/kg/day ) | 1 | 36 | Risk Ratio (M‐H, Fixed, 95% CI) | 0.0 [0.0, 0.0] |
| 1.4 At 1 year | 5 | 942 | Risk Ratio (M‐H, Fixed, 95% CI) | 0.48 [0.09, 2.63] |
| 1.5 At 2 years | 1 | 19 | Risk Ratio (M‐H, Fixed, 95% CI) | 0.0 [0.0, 0.0] |
| 2 LVEF (%): least squares mean change from baseline Show forest plot | 1 | Mean Difference (IV, Fixed, 95% CI) | Totals not selected | |
| 3 LVEF (# participants affected) Show forest plot | 1 | Risk Ratio (M‐H, Fixed, 95% CI) | Totals not selected | |
| 3.1 Improvement from abnormal LVEF to normal range | 1 | Risk Ratio (M‐H, Fixed, 95% CI) | 0.0 [0.0, 0.0] | |
| 3.2 Decrease from normal LVEF to below LLN | 1 | Risk Ratio (M‐H, Fixed, 95% CI) | 0.0 [0.0, 0.0] | |
| 4 Incidence of thyroid disease at end of study Show forest plot | 1 | Risk Ratio (M‐H, Fixed, 95% CI) | Totals not selected | |
| 5 ALT (# participants affected): improvement from abnormal to normal range Show forest plot | 1 | Risk Ratio (M‐H, Fixed, 95% CI) | Totals not selected | |
| 6 ALT (U/L) at end of study Show forest plot | 1 | Mean Difference (IV, Fixed, 95% CI) | Totals not selected | |
| 7 AST (U/L) at end of study Show forest plot | 1 | Mean Difference (IV, Fixed, 95% CI) | Totals not selected | |
| 8 Serum creatinine (mg/dL) at end of study Show forest plot | 1 | Mean Difference (IV, Fixed, 95% CI) | Totals not selected | |
| 9 Blood urea (mg/dL): mean at end of study Show forest plot | 1 | Mean Difference (IV, Fixed, 95% CI) | Totals not selected | |
| 10 Serum ferritin (ng/mL): mean change from baseline and at end of study Show forest plot | 6 | 1002 | Mean Difference (IV, Fixed, 95% CI) | 454.42 [337.13, 571.71] |
| 10.1 Less than 3 mg Fe/g dw (median 5 mg deferasirox / 30mg deferoxamine) | 1 | 28 | Mean Difference (IV, Fixed, 95% CI) | 978.0 [544.71, 1411.29] |
| 10.2 More than 3 to 7 mg Fe/g dw (10/35) | 1 | 150 | Mean Difference (IV, Fixed, 95% CI) | 801.0 [572.53, 1029.47] |
| 10.3 More than 7 mg Fe/g dw (20/41) | 1 | 169 | Mean Difference (IV, Fixed, 95% CI) | 328.0 [124.94, 531.06] |
| 10.4 More than 14 mg Fe/g dw (30/51) | 1 | 216 | Mean Difference (IV, Fixed, 95% CI) | 77.0 [‐303.18, 457.18] |
| 10.5 Any iron overload | 5 | 439 | Mean Difference (IV, Fixed, 95% CI) | 234.25 [‐8.02, 476.52] |
| 11 Sensitivity analysis: serum ferritin (ng/mL): mean change from baseline Show forest plot | 2 | 701 | Mean Difference (IV, Fixed, 95% CI) | 418.94 [297.23, 540.65] |
| 11.1 Less than 3 mg Fe/g dw (median 5 mg deferasirox / 30 mg deferoxamine) | 1 | 28 | Mean Difference (IV, Fixed, 95% CI) | 978.0 [544.71, 1411.29] |
| 11.2 More than 3 to 7 mg Fe/g dw (10/35) | 1 | 150 | Mean Difference (IV, Fixed, 95% CI) | 801.0 [572.53, 1029.47] |
| 11.3 More than 7 mg Fe/g dw (20/41) | 1 | 169 | Mean Difference (IV, Fixed, 95% CI) | 328.0 [124.94, 531.06] |
| 11.4 More than 14 mg Fe/g dw (30/51) | 1 | 216 | Mean Difference (IV, Fixed, 95% CI) | 77.0 [‐303.18, 457.18] |
| 11.5 Any iron overload | 1 | 138 | Mean Difference (IV, Fixed, 95% CI) | ‐64.16 [‐354.62, 226.30] |
| 12 Liver R2* (Hz): mean change from baseline Show forest plot | 1 | Mean Difference (IV, Fixed, 95% CI) | Totals not selected | |
| 13 LIC (mg/g) evaluated by MRI (R2/R2*): mean change from baseline Show forest plot | 2 | 217 | Mean Difference (IV, Fixed, 95% CI) | 0.36 [‐1.01, 1.72] |
| 14 LIC (mg Fe/g dw) evaluated by biopsy or SQUID: mean change from baseline Show forest plot | 1 | 541 | Mean Difference (IV, Fixed, 95% CI) | 2.37 [1.68, 3.07] |
| 14.1 LIC 3 mg Fe/g dw or less (5/30) | 1 | 28 | Mean Difference (IV, Fixed, 95% CI) | 4.3 [2.30, 6.30] |
| 14.2 LIC more than 3 mg to 7 mg (10/35) Fe/g dw | 1 | 143 | Mean Difference (IV, Fixed, 95% CI) | 3.80 [2.74, 4.86] |
| 14.3 LIC more than 7 mg to 14 mg Fe/g dw (20/41) | 1 | 164 | Mean Difference (IV, Fixed, 95% CI) | 1.5 [0.28, 2.72] |
| 14.4 LIC more than 14 mg Fe/g dw (30/51) | 1 | 206 | Mean Difference (IV, Fixed, 95% CI) | ‐2.5 [‐4.55, ‐0.45] |
| 15 Responder analysis I (responder: fall in LIC > 10%) Show forest plot | 1 | Risk Ratio (M‐H, Fixed, 95% CI) | Totals not selected | |
| 15.1 Response at 48 weeks (deferasirox 10 mg/kg/day) | 1 | Risk Ratio (M‐H, Fixed, 95% CI) | 0.0 [0.0, 0.0] | |
| 15.2 Response at 48 weeks (deferasirox 20 mg/kg/day) | 1 | Risk Ratio (M‐H, Fixed, 95% CI) | 0.0 [0.0, 0.0] | |
| 16 Responder analysis II (responder: LIC 1 to < 7 mg Fe/g dw) Show forest plot | 1 | 553 | Risk Ratio (M‐H, Fixed, 95% CI) | 0.80 [0.69, 0.92] |
| 16.1 Response at 1 year (LIC below 7 mg Fe/g dw) | 1 | 172 | Risk Ratio (M‐H, Fixed, 95% CI) | 0.48 [0.37, 0.64] |
| 16.2 Response at 1 year (LIC at least 7 mg Fe/g dw) | 1 | 381 | Risk Ratio (M‐H, Fixed, 95% CI) | 0.99 [0.84, 1.18] |
| 17 Myocardial T2* (ms): mean change from baseline Show forest plot | 1 | Mean Difference (IV, Fixed, 95% CI) | Totals not selected | |
| 18 Myocardial iron concentration derived from T2* value (mg Fe/g dw): change from baseline Show forest plot | 1 | Mean Difference (IV, Fixed, 95% CI) | Totals not selected | |
| 18.1 All participants | 1 | Mean Difference (IV, Fixed, 95% CI) | 0.0 [0.0, 0.0] | |
| 18.2 Participants with T2* <10 ms | 1 | Mean Difference (IV, Fixed, 95% CI) | 0.0 [0.0, 0.0] | |
| 18.3 Participants with T2* ≥10 ms | 1 | Mean Difference (IV, Fixed, 95% CI) | 0.0 [0.0, 0.0] | |
| 19 Myocardial T2* (# participants affected) Show forest plot | 1 | Risk Ratio (M‐H, Fixed, 95% CI) | Totals not selected | |
| 19.1 Normalization | 1 | Risk Ratio (M‐H, Fixed, 95% CI) | 0.0 [0.0, 0.0] | |
| 19.2 Improvement (from 6 ‐ < 10 ms to 10 ‐ ≤ 20 ms) | 1 | Risk Ratio (M‐H, Fixed, 95% CI) | 0.0 [0.0, 0.0] | |
| 19.3 Worsening (from 10‐ ≤ 20 ms to 6 ‐ < 10 ms) | 1 | Risk Ratio (M‐H, Fixed, 95% CI) | 0.0 [0.0, 0.0] | |
| 20 Iron excretion‐intake ratio Show forest plot | 1 | 541 | Mean Difference (IV, Fixed, 95% CI) | ‐0.18 [‐0.24, ‐0.12] |
| 20.1 Less than 3 mg Fe/g dw (median 5 mg deferasirox / 30 mg deferoxamine) | 1 | 28 | Mean Difference (IV, Fixed, 95% CI) | ‐0.37 [‐0.54, ‐0.20] |
| 20.2 More than 3 to 7 mg Fe/g dw (10/35) | 1 | 143 | Mean Difference (IV, Fixed, 95% CI) | ‐0.31 [‐0.41, ‐0.21] |
| 20.3 More than 7 mg Fe/g dw (20/41) | 1 | 164 | Mean Difference (IV, Fixed, 95% CI) | ‐0.11 [‐0.21, ‐0.01] |
| 20.4 More than 14 mg Fe/g dw (30/51) | 1 | 206 | Mean Difference (IV, Fixed, 95% CI) | 0.23 [0.05, 0.41] |
| 21 Any serious AEs (# participants affected) Show forest plot | 2 | 773 | Risk Ratio (M‐H, Fixed, 95% CI) | 0.88 [0.42, 1.86] |
| 22 Serious AEs Show forest plot | 1 | Risk Ratio (M‐H, Fixed, 95% CI) | Totals not selected | |
| 22.1 Cardiac disorders ‐ arrhythmia | 1 | Risk Ratio (M‐H, Fixed, 95% CI) | 0.0 [0.0, 0.0] | |
| 22.2 Endocrine disorders ‐ hypogonadism | 1 | Risk Ratio (M‐H, Fixed, 95% CI) | 0.0 [0.0, 0.0] | |
| 22.3 GI disorders abdominal abscess | 1 | Risk Ratio (M‐H, Fixed, 95% CI) | 0.0 [0.0, 0.0] | |
| 22.4 GI disorders amoebiasis | 1 | Risk Ratio (M‐H, Fixed, 95% CI) | 0.0 [0.0, 0.0] | |
| 22.5 GI disorders ‐ appendicitis | 1 | Risk Ratio (M‐H, Fixed, 95% CI) | 0.0 [0.0, 0.0] | |
| 22.6 GI disorders ‐ colitis | 1 | Risk Ratio (M‐H, Fixed, 95% CI) | 0.0 [0.0, 0.0] | |
| 22.7 GI disorders ‐ diarrhoea | 1 | Risk Ratio (M‐H, Fixed, 95% CI) | 0.0 [0.0, 0.0] | |
| 22.8 GI disorders ‐ gastric haemorrhage | 1 | Risk Ratio (M‐H, Fixed, 95% CI) | 0.0 [0.0, 0.0] | |
| 22.9 GI disorders ‐ gastroenteritis | 1 | Risk Ratio (M‐H, Fixed, 95% CI) | 0.0 [0.0, 0.0] | |
| 22.10 GI disorders ‐ ileus | 1 | Risk Ratio (M‐H, Fixed, 95% CI) | 0.0 [0.0, 0.0] | |
| 22.11 GI disorders ‐ upper abdominal pain | 1 | Risk Ratio (M‐H, Fixed, 95% CI) | 0.0 [0.0, 0.0] | |
| 22.12 GI disorders ‐ vomiting | 1 | Risk Ratio (M‐H, Fixed, 95% CI) | 0.0 [0.0, 0.0] | |
| 22.13 GI disorders ‐ GI infection | 1 | Risk Ratio (M‐H, Fixed, 95% CI) | 0.0 [0.0, 0.0] | |
| 22.14 General disorders and administration site conditions ‐ pyrexia | 1 | Risk Ratio (M‐H, Fixed, 95% CI) | 0.0 [0.0, 0.0] | |
| 22.15 General disorders and administration site conditions ‐ local swelling | 1 | Risk Ratio (M‐H, Fixed, 95% CI) | 0.0 [0.0, 0.0] | |
| 22.16 Hepatobiliary disorders ‐ liver abscess | 1 | Risk Ratio (M‐H, Fixed, 95% CI) | 0.0 [0.0, 0.0] | |
| 22.17 Hepatobiliary disorders ‐ cholelithiasis | 1 | Risk Ratio (M‐H, Fixed, 95% CI) | 0.0 [0.0, 0.0] | |
| 22.18 Immune system disorders ‐ face oedema | 1 | Risk Ratio (M‐H, Fixed, 95% CI) | 0.0 [0.0, 0.0] | |
| 22.19 Infections and infestations ‐ herpes zoster | 1 | Risk Ratio (M‐H, Fixed, 95% CI) | 0.0 [0.0, 0.0] | |
| 22.20 Infections and infestations ‐ tooth infection | 1 | Risk Ratio (M‐H, Fixed, 95% CI) | 0.0 [0.0, 0.0] | |
| 22.21 Infections and infestations ‐ urinary tract infection | 1 | Risk Ratio (M‐H, Fixed, 95% CI) | 0.0 [0.0, 0.0] | |
| 22.22 Injury, poisoning and procedural complications ‐ oesophageal rupture | 1 | Risk Ratio (M‐H, Fixed, 95% CI) | 0.0 [0.0, 0.0] | |
| 22.23 Injury, poisoning and procedural complications ‐ haemosiderosis | 1 | Risk Ratio (M‐H, Fixed, 95% CI) | 0.0 [0.0, 0.0] | |
| 22.24 Injury, poisoning and procedural complications ‐ iron overload | 1 | Risk Ratio (M‐H, Fixed, 95% CI) | 0.0 [0.0, 0.0] | |
| 22.25 Metabolism and nutrition disorders ‐ hyperglycaemia | 1 | Risk Ratio (M‐H, Fixed, 95% CI) | 0.0 [0.0, 0.0] | |
| 22.26 Musculoskeletal and connective tissue disorders ‐ back pain | 1 | Risk Ratio (M‐H, Fixed, 95% CI) | 0.0 [0.0, 0.0] | |
| 22.27 Musculoskeletal and connective tissue disorders ‐ pain in jaw | 1 | Risk Ratio (M‐H, Fixed, 95% CI) | 0.0 [0.0, 0.0] | |
| 22.28 Nervous system disorders ‐ grand mal convulsion | 1 | Risk Ratio (M‐H, Fixed, 95% CI) | 0.0 [0.0, 0.0] | |
| 22.29 Nervous system disorders ‐ meningitis | 1 | Risk Ratio (M‐H, Fixed, 95% CI) | 0.0 [0.0, 0.0] | |
| 22.30 Respiratory, thoracic and mediastinal disorders ‐ acute tonsilitis | 1 | Risk Ratio (M‐H, Fixed, 95% CI) | 0.0 [0.0, 0.0] | |
| 23 Any AE (# participants affected) Show forest plot | 2 | 258 | Risk Ratio (M‐H, Fixed, 95% CI) | 0.94 [0.83, 1.08] |
| 24 AEs Show forest plot | 5 | Risk Ratio (M‐H, Fixed, 95% CI) | Subtotals only | |
| 24.1 Blood and lymphatic system disorder ‐ agranulocytosis | 2 | 657 | Risk Ratio (M‐H, Fixed, 95% CI) | 0.0 [0.0, 0.0] |
| 24.2 Blood and lymphatic system disorder ‐ leukopenia | 1 | 138 | Risk Ratio (M‐H, Fixed, 95% CI) | 7.0 [0.37, 133.02] |
| 24.3 Blood and lymphatic system disorder ‐ neutropenia | 1 | 71 | Risk Ratio (M‐H, Fixed, 95% CI) | 0.0 [0.0, 0.0] |
| 24.4 Blood and lymphatic system disorder ‐ thrombocytopenia | 2 | 209 | Risk Ratio (M‐H, Fixed, 95% CI) | 4.0 [0.46, 34.88] |
| 24.5 Cardiac disorders ‐ cardiac AE | 1 | 586 | Risk Ratio (M‐H, Fixed, 95% CI) | 0.73 [0.38, 1.41] |
| 24.6 Ear and labyrinth disorders ‐ hearing loss | 2 | 657 | Risk Ratio (M‐H, Fixed, 95% CI) | 1.12 [0.41, 3.05] |
| 24.7 Eye disorder ‐ lens abnormality | 2 | 657 | Risk Ratio (M‐H, Fixed, 95% CI) | 0.39 [0.08, 2.00] |
| 24.8 Eye disorder ‐ retinal abnormality | 1 | 71 | Risk Ratio (M‐H, Fixed, 95% CI) | 0.0 [0.0, 0.0] |
| 24.9 GI disorders ‐ abdominal pain | 2 | 258 | Risk Ratio (M‐H, Fixed, 95% CI) | 1.69 [0.93, 3.05] |
| 24.10 GI disorders ‐ abdominal pain upper | 1 | 187 | Risk Ratio (M‐H, Fixed, 95% CI) | 1.14 [0.36, 3.60] |
| 24.11 GI disorders ‐ diarrhoea | 2 | 258 | Risk Ratio (M‐H, Fixed, 95% CI) | 1.65 [0.86, 3.16] |
| 24.12 GI disorders ‐ dyspepsia | 1 | 71 | Risk Ratio (M‐H, Fixed, 95% CI) | 1.20 [0.25, 5.72] |
| 24.13 GI disorders ‐ GIT upset | 1 | 60 | Risk Ratio (M‐H, Fixed, 95% CI) | 3.0 [0.66, 13.69] |
| 24.14 GI disorders ‐ nausea | 2 | 258 | Risk Ratio (M‐H, Fixed, 95% CI) | 2.59 [0.90, 7.47] |
| 24.15 GI disorders ‐ vomiting | 2 | 258 | Risk Ratio (M‐H, Fixed, 95% CI) | 2.95 [0.91, 9.55] |
| 24.16 General disorders and administration site conditions ‐ asthenia | 1 | 71 | Risk Ratio (M‐H, Fixed, 95% CI) | 1.20 [0.42, 3.42] |
| 24.17 General disorders and administration site conditions ‐ influenza‐like illness | 1 | 71 | Risk Ratio (M‐H, Fixed, 95% CI) | 1.20 [0.42, 3.42] |
| 24.18 General disorders and administration site conditions ‐ pyrexia | 2 | 258 | Risk Ratio (M‐H, Fixed, 95% CI) | 1.27 [0.66, 2.44] |
| 24.19 Immune system disorders ‐ allergic conjunctivitis | 1 | 71 | Risk Ratio (M‐H, Fixed, 95% CI) | 4.41 [0.25, 78.58] |
| 24.20 Infections and infestations ‐ bronchitis | 1 | 71 | Risk Ratio (M‐H, Fixed, 95% CI) | 2.40 [0.30, 19.35] |
| 24.21 Infections and infestations ‐ upper respiratory tract infection | 1 | 187 | Risk Ratio (M‐H, Fixed, 95% CI) | 0.95 [0.37, 2.42] |
| 24.22 Infections and infestations ‐ urinary tract infection | 1 | 71 | Risk Ratio (M‐H, Fixed, 95% CI) | 2.40 [0.30, 19.35] |
| 24.23 Investigations ‐ ALT increased | 1 | 187 | Risk Ratio (M‐H, Fixed, 95% CI) | 1.71 [0.59, 4.90] |
| 24.24 Investigations ‐ elevated ALT (>2 UNL) | 1 | 586 | Risk Ratio (M‐H, Fixed, 95% CI) | 4.90 [0.24, 101.60] |
| 24.25 Investigations ‐ AST increased | 1 | 187 | Risk Ratio (M‐H, Fixed, 95% CI) | 2.21 [0.59, 8.29] |
| 24.26 Investigations ‐ blood creatinine increased | 1 | 187 | Risk Ratio (M‐H, Fixed, 95% CI) | 3.79 [0.83, 17.38] |
| 24.27 Investigations ‐ isolated serum creatinine increase above upper limit of normal | 2 | 657 | Risk Ratio (M‐H, Fixed, 95% CI) | 2.57 [1.88, 3.51] |
| 24.28 Investigations ‐ platelet count increased | 1 | 187 | Risk Ratio (M‐H, Fixed, 95% CI) | 0.38 [0.08, 1.91] |
| 24.29 Musculoskeletal and connective tissue disorders ‐ arthralgia | 2 | 258 | Risk Ratio (M‐H, Fixed, 95% CI) | 1.31 [0.55, 3.13] |
| 24.30 Musculoskeletal and connective tissue disorders ‐ back pain | 2 | 258 | Risk Ratio (M‐H, Fixed, 95% CI) | 1.30 [0.73, 2.34] |
| 24.31 Musculoskeletal and connective tissue disorders ‐ osteoporosis | 1 | 187 | Risk Ratio (M‐H, Fixed, 95% CI) | 2.37 [0.47, 11.91] |
| 24.32 Nervous system disorders ‐ headache | 2 | 258 | Risk Ratio (M‐H, Fixed, 95% CI) | 1.44 [0.68, 3.05] |
| 24.33 Nervous system disorders ‐ vertigo | 1 | 71 | Risk Ratio (M‐H, Fixed, 95% CI) | 1.12 [0.32, 3.93] |
| 24.34 Renal and urinary disorders ‐ proteinuria | 1 | 187 | Risk Ratio (M‐H, Fixed, 95% CI) | 1.16 [0.50, 2.66] |
| 24.35 Respiratory, thoracic and mediastinal disorders ‐ cough | 1 | 71 | Risk Ratio (M‐H, Fixed, 95% CI) | 1.80 [0.67, 4.81] |
| 24.36 Respiratory, thoracic and mediastinal disorders ‐ influenza | 2 | 258 | Risk Ratio (M‐H, Fixed, 95% CI) | 1.05 [0.52, 2.13] |
| 24.37 Respiratory, thoracic and mediastinal disorders ‐ nasopharyngitis | 1 | 187 | Risk Ratio (M‐H, Fixed, 95% CI) | 1.90 [0.59, 6.08] |
| 24.38 Respiratory, thoracic and mediastinal disorders ‐ oropharyngeal pain | 1 | 187 | Risk Ratio (M‐H, Fixed, 95% CI) | 2.84 [0.59, 13.73] |
| 24.39 Respiratory, thoracic and mediastinal disorders ‐ pharyngitis | 1 | 71 | Risk Ratio (M‐H, Fixed, 95% CI) | 1.02 [0.52, 2.00] |
| 24.40 Respiratory, thoracic and mediastinal disorders ‐ pharyngolaryngeal pain | 1 | 71 | Risk Ratio (M‐H, Fixed, 95% CI) | 0.88 [0.37, 2.08] |
| 24.41 Respiratory, thoracic and mediastinal disorders ‐ rhinitis | 1 | 71 | Risk Ratio (M‐H, Fixed, 95% CI) | 1.28 [0.58, 2.83] |
| 24.42 Skin and subcutaneous tissue disorders ‐ Rash | 1 | 60 | Risk Ratio (M‐H, Fixed, 95% CI) | 2.67 [0.78, 9.09] |
| 25 Any drug‐related AE (# participants affected) Show forest plot | 1 | Risk Ratio (M‐H, Fixed, 95% CI) | Totals not selected | |
| 26 Drug‐related AEs Show forest plot | 2 | Risk Ratio (M‐H, Fixed, 95% CI) | Totals not selected | |
| 26.1 Blood and lymphatic system disorder ‐ neutropenia | 1 | Risk Ratio (M‐H, Fixed, 95% CI) | 0.0 [0.0, 0.0] | |
| 26.2 Injury, poisoning and procedural complications ‐ infusion site haemorrhage | 1 | Risk Ratio (M‐H, Fixed, 95% CI) | 0.0 [0.0, 0.0] | |
| 26.3 Injury, poisoning and procedural complications ‐ infusion site pain | 1 | Risk Ratio (M‐H, Fixed, 95% CI) | 0.0 [0.0, 0.0] | |
| 26.4 Injury, poisoning and procedural complications ‐ infusion site swelling | 1 | Risk Ratio (M‐H, Fixed, 95% CI) | 0.0 [0.0, 0.0] | |
| 26.5 Injury, poisoning and procedural complications ‐ injection site pain | 1 | Risk Ratio (M‐H, Fixed, 95% CI) | 0.0 [0.0, 0.0] | |
| 26.6 Injury, poisoning and procedural complications ‐ injection site reaction | 1 | Risk Ratio (M‐H, Fixed, 95% CI) | 0.0 [0.0, 0.0] | |
| 26.7 Investigations ‐ blood creatinine increased | 1 | Risk Ratio (M‐H, Fixed, 95% CI) | 0.0 [0.0, 0.0] | |
| 26.8 Investigations ‐ ALT increased | 1 | Risk Ratio (M‐H, Fixed, 95% CI) | 0.0 [0.0, 0.0] | |
| 26.9 Investigations ‐ AST increased | 1 | Risk Ratio (M‐H, Fixed, 95% CI) | 0.0 [0.0, 0.0] | |
| 26.10 GI disorders ‐ abdominal pain | 1 | Risk Ratio (M‐H, Fixed, 95% CI) | 0.0 [0.0, 0.0] | |
| 26.11 GI disorders ‐ abdominal pain upper | 1 | Risk Ratio (M‐H, Fixed, 95% CI) | 0.0 [0.0, 0.0] | |
| 26.12 GI disorders ‐ diarrhoea | 1 | Risk Ratio (M‐H, Fixed, 95% CI) | 0.0 [0.0, 0.0] | |
| 26.13 GI disorders ‐ nausea | 1 | Risk Ratio (M‐H, Fixed, 95% CI) | 0.0 [0.0, 0.0] | |
| 26.14 GI disorders ‐ vomiting | 1 | Risk Ratio (M‐H, Fixed, 95% CI) | 0.0 [0.0, 0.0] | |
| 26.15 Immune system disorders ‐ hypersensitivity | 1 | Risk Ratio (M‐H, Fixed, 95% CI) | 0.0 [0.0, 0.0] | |
| 26.16 Immune system disorders ‐ urticaria | 1 | Risk Ratio (M‐H, Fixed, 95% CI) | 0.0 [0.0, 0.0] | |
| 26.17 Musculoskeletal and connective tissue disorders ‐ arthropathy | 1 | Risk Ratio (M‐H, Fixed, 95% CI) | 0.0 [0.0, 0.0] | |
| 26.18 Renal and urinary disorders ‐ proteinuria | 1 | Risk Ratio (M‐H, Fixed, 95% CI) | 0.0 [0.0, 0.0] | |
| 26.19 Skin and subcutaneous tissue disorders ‐ alopecia | 1 | Risk Ratio (M‐H, Fixed, 95% CI) | 0.0 [0.0, 0.0] | |
| 26.20 Skin and subcutaneous tissue disorders ‐ rash | 1 | Risk Ratio (M‐H, Fixed, 95% CI) | 0.0 [0.0, 0.0] | |
| 26.21 Injury, poisoning and procedural complications ‐ pulmonary toxicity | 1 | Risk Ratio (M‐H, Fixed, 95% CI) | 0.0 [0.0, 0.0] | |
| 26.22 Eye disorders ‐ Ophthalmological toxicity | 1 | Risk Ratio (M‐H, Fixed, 95% CI) | 0.0 [0.0, 0.0] | |
| 26.23 Ear and labyrinth disorders ‐ Audiological toxicity | 1 | Risk Ratio (M‐H, Fixed, 95% CI) | 0.0 [0.0, 0.0] | |
| 27 Satisfaction with treatment (very satisfied or satisfied) Show forest plot | 1 | Risk Ratio (M‐H, Fixed, 95% CI) | Totals not selected | |
| 27.1 Week 4 ‐ participants previously treated with DFO | 1 | Risk Ratio (M‐H, Fixed, 95% CI) | 0.0 [0.0, 0.0] | |
| 27.2 Week 24 ‐ participants previously treated with DFO | 1 | Risk Ratio (M‐H, Fixed, 95% CI) | 0.0 [0.0, 0.0] | |
| 27.3 End of study (1 year) ‐ participants previously treated with DFO | 1 | Risk Ratio (M‐H, Fixed, 95% CI) | 0.0 [0.0, 0.0] | |
| 27.4 Week 4 ‐ DFO‐naive participants | 1 | Risk Ratio (M‐H, Fixed, 95% CI) | 0.0 [0.0, 0.0] | |
| 27.5 Week 24 ‐ DFO‐naive participants | 1 | Risk Ratio (M‐H, Fixed, 95% CI) | 0.0 [0.0, 0.0] | |
| 27.6 End of study (1 year) ‐ DFO‐naive participants | 1 | Risk Ratio (M‐H, Fixed, 95% CI) | 0.0 [0.0, 0.0] | |
| 28 Convenience (good or very good) Show forest plot | 1 | Risk Ratio (M‐H, Fixed, 95% CI) | Totals not selected | |
| 28.1 Week 4 ‐ participants previously treated with DFO | 1 | Risk Ratio (M‐H, Fixed, 95% CI) | 0.0 [0.0, 0.0] | |
| 28.2 Week 24 ‐ participants previously treated with DFO | 1 | Risk Ratio (M‐H, Fixed, 95% CI) | 0.0 [0.0, 0.0] | |
| 28.3 End of study (1 year) ‐ participants previously treated with DFO | 1 | Risk Ratio (M‐H, Fixed, 95% CI) | 0.0 [0.0, 0.0] | |
| 28.4 Week 4 ‐ DFO‐naive participants | 1 | Risk Ratio (M‐H, Fixed, 95% CI) | 0.0 [0.0, 0.0] | |
| 28.5 Week 24 ‐ DFO‐naive participants | 1 | Risk Ratio (M‐H, Fixed, 95% CI) | 0.0 [0.0, 0.0] | |
| 28.6 End of study (1 year) ‐ DFO‐naive participants | 1 | Risk Ratio (M‐H, Fixed, 95% CI) | 0.0 [0.0, 0.0] | |
| 29 Willingness to continue treatment Show forest plot | 1 | Risk Ratio (M‐H, Fixed, 95% CI) | Totals not selected | |
| 29.1 Participants treated previously with DFO | 1 | Risk Ratio (M‐H, Fixed, 95% CI) | 0.0 [0.0, 0.0] | |
| 29.2 DFO‐naive participants | 1 | Risk Ratio (M‐H, Fixed, 95% CI) | 0.0 [0.0, 0.0] | |
| 30 Time lost from normal activities due to treatment (hours/month): participants treated previously with DFO Show forest plot | 1 | Mean Difference (IV, Fixed, 95% CI) | Totals not selected | |
| 30.1 week 4 ‐ patients treated previously with DFO | 1 | Mean Difference (IV, Fixed, 95% CI) | 0.0 [0.0, 0.0] | |
| 30.2 week 24 ‐ patients treated previously with DFO | 1 | Mean Difference (IV, Fixed, 95% CI) | 0.0 [0.0, 0.0] | |
| 30.3 end of study (1 year) ‐ patients treated previously with DFO | 1 | Mean Difference (IV, Fixed, 95% CI) | 0.0 [0.0, 0.0] | |
| 30.4 week 4 ‐ DFO‐naive patients | 1 | Mean Difference (IV, Fixed, 95% CI) | 0.0 [0.0, 0.0] | |
| 30.5 week 24 ‐ DFO‐naive patients | 1 | Mean Difference (IV, Fixed, 95% CI) | 0.0 [0.0, 0.0] | |
| 30.6 end of study (1 year) ‐ DFO‐naive patients | 1 | Mean Difference (IV, Fixed, 95% CI) | 0.0 [0.0, 0.0] | |
| 31 Adherence (% of planned dose) Show forest plot | 1 | Mean Difference (IV, Fixed, 95% CI) | Totals not selected | |
| 32 Discontinuations Show forest plot | 8 | 1211 | Risk Ratio (M‐H, Fixed, 95% CI) | 0.95 [0.60, 1.50] |
| 32.1 Deferasirox 10 mg/kg/day | 1 | 35 | Risk Ratio (M‐H, Fixed, 95% CI) | 0.16 [0.01, 3.64] |
| 32.2 Deferasirox 20 mg/kg/day | 2 | 174 | Risk Ratio (M‐H, Fixed, 95% CI) | 1.0 [0.10, 9.96] |
| 32.3 Deferasirox 25 mg/kg/day | 1 | 120 | Risk Ratio (M‐H, Fixed, 95% CI) | 0.09 [0.01, 1.61] |
| 32.4 Deferasirox 40 mg/kg/day | 2 | 211 | Risk Ratio (M‐H, Fixed, 95% CI) | 1.02 [0.51, 2.05] |
| 32.5 Deferasirox ‐ variable dosage | 2 | 646 | Risk Ratio (M‐H, Fixed, 95% CI) | 1.39 [0.67, 2.85] |
| 32.6 Deferasirox dosing unknown | 1 | 25 | Risk Ratio (M‐H, Fixed, 95% CI) | 0.0 [0.0, 0.0] |
| 33 Dose adjustments and dose interruptions Show forest plot | 1 | Risk Ratio (M‐H, Fixed, 95% CI) | Totals not selected | |
| 34 Dose interruptions (interrupted at least once) Show forest plot | 1 | Risk Ratio (M‐H, Fixed, 95% CI) | Totals not selected | |
| 35 Dose reduction (at least once) Show forest plot | 1 | Risk Ratio (M‐H, Fixed, 95% CI) | Totals not selected | |
| 36 Dose adjustments (# participants affected) Show forest plot | 1 | Risk Ratio (M‐H, Fixed, 95% CI) | Totals not selected | |
| 37 Dose interruptions due to an AE (# participants affected) Show forest plot | 1 | Risk Ratio (M‐H, Fixed, 95% CI) | Totals not selected | |
| 38 Haemoglobin (g/dL): mean change from baseline and at end of study Show forest plot | 2 | 180 | Mean Difference (IV, Fixed, 95% CI) | ‐0.52 [‐0.82, ‐0.21] |
| 38.1 At 8 months (change from baseline) | 1 | 138 | Mean Difference (IV, Fixed, 95% CI) | ‐0.46 [‐0.81, ‐0.11] |
| 38.2 At 1 year (at end of study) | 1 | 42 | Mean Difference (IV, Fixed, 95% CI) | ‐0.70 [‐1.33, ‐0.07] |
| 39 Transfusion index (mL/kg/year): mean at end of study Show forest plot | 1 | Mean Difference (IV, Fixed, 95% CI) | Totals not selected | |
| 40 Transferrin saturation (%): mean at end of study Show forest plot | 1 | Mean Difference (IV, Fixed, 95% CI) | Totals not selected | |
| 41 Platelet count (x10³/mm³): mean at end of study Show forest plot | 1 | Mean Difference (IV, Fixed, 95% CI) | Totals not selected | |
| 42 Absolute neutrophilic count (/mm³): mean at end of study Show forest plot | 1 | Mean Difference (IV, Fixed, 95% CI) | Totals not selected | |
| Outcome or subgroup title | No. of studies | No. of participants | Statistical method | Effect size |
| 1 Mortality at any time point Show forest plot | 3 | 146 | Risk Ratio (M‐H, Fixed, 95% CI) | 0.0 [0.0, 0.0] |
| 1.1 at 1 year | 2 | 128 | Risk Ratio (M‐H, Fixed, 95% CI) | 0.0 [0.0, 0.0] |
| 1.2 at 2 years | 1 | 18 | Risk Ratio (M‐H, Fixed, 95% CI) | 0.0 [0.0, 0.0] |
| 2 Incidence of thyroid disease at end of study Show forest plot | 1 | Risk Ratio (M‐H, Fixed, 95% CI) | Totals not selected | |
| 3 ALT (U/L): mean change from baseline Show forest plot | 1 | Mean Difference (IV, Fixed, 95% CI) | Totals not selected | |
| 4 AST (U/L): mean change from baseline Show forest plot | 1 | Mean Difference (IV, Fixed, 95% CI) | Totals not selected | |
| 5 Urea (mg/dL): mean change from baseline Show forest plot | 1 | Mean Difference (IV, Fixed, 95% CI) | Totals not selected | |
| 6 Creatinine (mg/dL): mean change from baseline Show forest plot | 1 | Mean Difference (IV, Fixed, 95% CI) | Totals not selected | |
| 7 Neutrophil (count per mm³): mean change from baseline Show forest plot | 1 | Mean Difference (IV, Fixed, 95% CI) | Totals not selected | |
| 8 Serum ferritin (ng/mL): mean change from baseline and at end of study Show forest plot | 2 | Mean Difference (IV, Fixed, 95% CI) | Subtotals only | |
| 8.1 All participants | 2 | 83 | Mean Difference (IV, Fixed, 95% CI) | 229.99 [‐403.14, 863.11] |
| 8.2 Ferritin > 4000 | 1 | 11 | Mean Difference (IV, Fixed, 95% CI) | 1129.0 [‐2226.18, 4484.18] |
| 8.3 Ferritin 2000 ‐ 4000 | 1 | 16 | Mean Difference (IV, Fixed, 95% CI) | ‐151.0 [‐743.80, 441.80] |
| 8.4 Ferritin < 2000 | 1 | 11 | Mean Difference (IV, Fixed, 95% CI) | 388.0 [‐255.71, 1031.71] |
| 9 LIC (mg/g) evaluated by MRI (R2*): mean change from baseline Show forest plot | 1 | Mean Difference (IV, Fixed, 95% CI) | Totals not selected | |
| 10 Myocardial T2* (ms): mean change from baseline Show forest plot | 1 | Mean Difference (IV, Fixed, 95% CI) | Totals not selected | |
| 11 Any AE (# participants affected) Show forest plot | 1 | Risk Ratio (M‐H, Fixed, 95% CI) | Totals not selected | |
| 12 AEs Show forest plot | 1 | Risk Ratio (M‐H, Fixed, 95% CI) | Totals not selected | |
| 12.1 GI disorders ‐ diarrhoea | 1 | Risk Ratio (M‐H, Fixed, 95% CI) | 0.0 [0.0, 0.0] | |
| 12.2 GI disorders ‐ nausea | 1 | Risk Ratio (M‐H, Fixed, 95% CI) | 0.0 [0.0, 0.0] | |
| 12.3 GI disorders ‐ pain abdomen | 1 | Risk Ratio (M‐H, Fixed, 95% CI) | 0.0 [0.0, 0.0] | |
| 12.4 GI disorders ‐ vomiting | 1 | Risk Ratio (M‐H, Fixed, 95% CI) | 0.0 [0.0, 0.0] | |
| 12.5 Musculoskeletal and connective tissue disorders ‐ arthralgia | 1 | Risk Ratio (M‐H, Fixed, 95% CI) | 0.0 [0.0, 0.0] | |
| 12.6 Skin and subcutaneous tissue disorders ‐ rash | 1 | Risk Ratio (M‐H, Fixed, 95% CI) | 0.0 [0.0, 0.0] | |
| 12.7 Blood and lymphatic system disorder ‐ agranulocytosis | 1 | Risk Ratio (M‐H, Fixed, 95% CI) | 0.0 [0.0, 0.0] | |
| 12.8 Blood and lymphatic system disorder ‐ neutropenia | 1 | Risk Ratio (M‐H, Fixed, 95% CI) | 0.0 [0.0, 0.0] | |
| 12.9 Investigations ‐ AST levels > 2x UNL | 1 | Risk Ratio (M‐H, Fixed, 95% CI) | 0.0 [0.0, 0.0] | |
| 12.10 Investigations ‐ ALT levels > 2x UNL | 1 | Risk Ratio (M‐H, Fixed, 95% CI) | 0.0 [0.0, 0.0] | |
| 12.11 Investigations ‐ serum creatinine 50% increase from baseline | 1 | Risk Ratio (M‐H, Fixed, 95% CI) | 0.0 [0.0, 0.0] | |
| 12.12 Renal and urinary disorders ‐ renal failure | 1 | Risk Ratio (M‐H, Fixed, 95% CI) | 0.0 [0.0, 0.0] | |
| 13 Discontinuations (# participants affected) Show forest plot | 3 | 179 | Risk Ratio (M‐H, Fixed, 95% CI) | 0.16 [0.01, 2.99] |
| 14 Discontinuation due to an AE (# participants affected) Show forest plot | 1 | Risk Ratio (M‐H, Fixed, 95% CI) | Totals not selected | |
| 15 Transferrin saturation (%): mean at end of study Show forest plot | 1 | Mean Difference (IV, Fixed, 95% CI) | Totals not selected | |
| 16 Haemoglobin (g/dL): mean at end of study Show forest plot | 1 | Mean Difference (IV, Fixed, 95% CI) | Totals not selected | |
| 17 Transfusion index (mL/kg/year): mean at end of study Show forest plot | 1 | Mean Difference (IV, Fixed, 95% CI) | Totals not selected | |
| 18 ALP (U/L): mean change from baseline Show forest plot | 1 | Mean Difference (IV, Fixed, 95% CI) | Totals not selected | |
| Outcome or subgroup title | No. of studies | No. of participants | Statistical method | Effect size |
| 1 Mortality at any time point Show forest plot | 1 | Risk Ratio (M‐H, Fixed, 95% CI) | Totals not selected | |
| 1.1 at 12 months | 1 | Risk Ratio (M‐H, Fixed, 95% CI) | 0.0 [0.0, 0.0] | |
| 2 Neutrophil (µg/L): mean at end of study Show forest plot | 1 | Mean Difference (IV, Fixed, 95% CI) | Totals not selected | |
| 3 ALT (g/dL): mean at end of study Show forest plot | 1 | Mean Difference (IV, Fixed, 95% CI) | Totals not selected | |
| 4 AST (g/dL): mean at end of study Show forest plot | 1 | Mean Difference (IV, Fixed, 95% CI) | Totals not selected | |
| 5 Serum ferritin: mean at end of study (ng/mL) Show forest plot | 1 | Mean Difference (IV, Fixed, 95% CI) | Totals not selected | |
| 6 Discontinuations Show forest plot | 1 | Risk Ratio (M‐H, Fixed, 95% CI) | Totals not selected | |
| 7 Haemoglobin (g/dL): mean at end of study Show forest plot | 1 | Mean Difference (IV, Fixed, 95% CI) | Totals not selected | |
| 8 ALP (g/dL): mean at end of study Show forest plot | 1 | Mean Difference (IV, Fixed, 95% CI) | Totals not selected | |
| Outcome or subgroup title | No. of studies | No. of participants | Statistical method | Effect size |
| 1 Mortality at any time point Show forest plot | 1 | Risk Ratio (M‐H, Fixed, 95% CI) | Totals not selected | |
| 1.1 at 12 months | 1 | Risk Ratio (M‐H, Fixed, 95% CI) | 0.0 [0.0, 0.0] | |
| 2 Serum ferritin (ng/mL): mean change from baseline Show forest plot | 1 | Mean Difference (IV, Fixed, 95% CI) | Totals not selected | |
| 3 LIC (mg/g) evaluated by MRI (R2*): mean change from baseline Show forest plot | 1 | Mean Difference (IV, Fixed, 95% CI) | Totals not selected | |
| 4 Myocardial T2* (ms): mean change from baseline Show forest plot | 1 | Mean Difference (IV, Fixed, 95% CI) | Totals not selected | |
| 5 Serious AE (# participants affected) Show forest plot | 1 | Risk Ratio (M‐H, Fixed, 95% CI) | Totals not selected | |
| 6 Serious drug‐related AE (# participants affected) Show forest plot | 1 | Risk Ratio (M‐H, Fixed, 95% CI) | Totals not selected | |
| 6.1 Cholecystitis | 1 | Risk Ratio (M‐H, Fixed, 95% CI) | 0.0 [0.0, 0.0] | |
| 7 Serious non‐related drug AE Show forest plot | 1 | Risk Ratio (M‐H, Fixed, 95% CI) | Totals not selected | |
| 7.1 Appendicitis | 1 | Risk Ratio (M‐H, Fixed, 95% CI) | 0.0 [0.0, 0.0] | |
| 8 AEs Show forest plot | 1 | Risk Ratio (M‐H, Fixed, 95% CI) | Totals not selected | |
| 8.1 Blood and lymphatic system disorder ‐ agranulocytosis | 1 | Risk Ratio (M‐H, Fixed, 95% CI) | 0.0 [0.0, 0.0] | |
| 8.2 Blood and lymphatic system disorder ‐ neutropenia | 1 | Risk Ratio (M‐H, Fixed, 95% CI) | 0.0 [0.0, 0.0] | |
| 9 Drug‐related AEs (# participants affected) Show forest plot | 1 | Risk Ratio (M‐H, Fixed, 95% CI) | Totals not selected | |
| 10 Drug‐related AEs Show forest plot | 1 | Risk Ratio (M‐H, Fixed, 95% CI) | Totals not selected | |
| 10.1 Blood and lymphatic system disorders ‐ agranulocytosis | 1 | Risk Ratio (M‐H, Fixed, 95% CI) | 0.0 [0.0, 0.0] | |
| 10.2 Blood and lymphatic system disorders ‐ neutropenia | 1 | Risk Ratio (M‐H, Fixed, 95% CI) | 0.0 [0.0, 0.0] | |
| 10.3 GI disorders ‐ GI problems | 1 | Risk Ratio (M‐H, Fixed, 95% CI) | 0.0 [0.0, 0.0] | |
| 10.4 Investigations ‐ ALT increase ( ≥ 3 folds) | 1 | Risk Ratio (M‐H, Fixed, 95% CI) | 0.0 [0.0, 0.0] | |
| 10.5 Investigations ‐ serum creatinine ( ≥ 33%) above baseline in 2 consecutive occasions | 1 | Risk Ratio (M‐H, Fixed, 95% CI) | 0.0 [0.0, 0.0] | |
| 10.6 Musculoskeletal and connective tissue disorders ‐ arthralgia | 1 | Risk Ratio (M‐H, Fixed, 95% CI) | 0.0 [0.0, 0.0] | |
| 10.7 Skin and subcutaneous tissue disorders ‐ skin rash | 1 | Risk Ratio (M‐H, Fixed, 95% CI) | 0.0 [0.0, 0.0] | |
| 11 Non‐related drug AEs (# participants affected) Show forest plot | 1 | Risk Ratio (M‐H, Fixed, 95% CI) | Totals not selected | |
| 12 Non‐related drug AEs Show forest plot | 1 | Risk Ratio (M‐H, Fixed, 95% CI) | Totals not selected | |
| 12.1 Infections and infestations ‐ infections | 1 | Risk Ratio (M‐H, Fixed, 95% CI) | 0.0 [0.0, 0.0] | |
| 12.2 GI disorders | 1 | Risk Ratio (M‐H, Fixed, 95% CI) | 0.0 [0.0, 0.0] | |
| 12.3 Skin and subcutaneous tissue disorders | 1 | Risk Ratio (M‐H, Fixed, 95% CI) | 0.0 [0.0, 0.0] | |
| 13 Mild elevation of hepatic transaminases at start of therapy (# participants affected) Show forest plot | 1 | Risk Ratio (M‐H, Fixed, 95% CI) | Totals not selected | |
| 14 Initial gastrointestinal manifestations (# participants affected) Show forest plot | 1 | Risk Ratio (M‐H, Fixed, 95% CI) | Totals not selected | |
| 15 Quality of life (%) (measured by SF‐36): mean change from baseline Show forest plot | 1 | Mean Difference (IV, Fixed, 95% CI) | Totals not selected | |
| 16 Adherence: actual dose/total prescribed dose Show forest plot | 1 | Mean Difference (IV, Fixed, 95% CI) | Totals not selected | |
| 17 Discontinuations Show forest plot | 1 | Risk Ratio (M‐H, Fixed, 95% CI) | Totals not selected | |
| 18 Serious AE resulting in study discontinuation or interruption Show forest plot | 1 | Risk Ratio (M‐H, Fixed, 95% CI) | Totals not selected | |
| Outcome or subgroup title | No. of studies | No. of participants | Statistical method | Effect size |
| 1 Mortality at any time point Show forest plot | 1 | 148 | Risk Ratio (M‐H, Fixed, 95% CI) | 0.0 [0.0, 0.0] |
| 1.1 Deferasirox 5 mg/kg/day: at 12 months | 1 | 73 | Risk Ratio (M‐H, Fixed, 95% CI) | 0.0 [0.0, 0.0] |
| 1.2 Deferasirox 10 mg/kg/day: at 12 months | 1 | 75 | Risk Ratio (M‐H, Fixed, 95% CI) | 0.0 [0.0, 0.0] |
| 2 Serum ferritin (ng/mL): mean change from baseline Show forest plot | 1 | 154 | Mean Difference (IV, Fixed, 95% CI) | ‐306.74 [‐398.23, ‐215.24] |
| 2.1 Deferasirox 5 mg/kg/day | 1 | 78 | Mean Difference (IV, Fixed, 95% CI) | ‐259.1 [‐377.35, ‐140.85] |
| 2.2 Deferasirox 10 mg/kg/day | 1 | 76 | Mean Difference (IV, Fixed, 95% CI) | ‐377.79 [‐522.21, ‐233.37] |
| 3 LIC (mg Fe/g dw) evaluated by MRI R2: least squares mean change from baseline Show forest plot | 1 | 159 | Mean Difference (IV, Fixed, 95% CI) | ‐3.27 [‐4.44, ‐2.09] |
| 3.1 Deferasirox 5 mg/kg/day | 1 | 78 | Mean Difference (IV, Fixed, 95% CI) | ‐2.33 [‐4.00, ‐0.66] |
| 3.2 Deferasirox 10 mg/kg/day | 1 | 81 | Mean Difference (IV, Fixed, 95% CI) | ‐4.18 [‐5.83, ‐2.53] |
| 4 LIC (mg Fe/g dw) evaluated by MRI R2: mean change from baseline Show forest plot | 1 | Mean Difference (IV, Fixed, 95% CI) | Totals not selected | |
| 4.1 Non‐transfusion‐dependent β‐thalassemia 5 mg/kg/day | 1 | Mean Difference (IV, Fixed, 95% CI) | 0.0 [0.0, 0.0] | |
| 4.2 Non‐transfusion‐dependent β‐thalassemia 10 mg/kg/day | 1 | Mean Difference (IV, Fixed, 95% CI) | 0.0 [0.0, 0.0] | |
| 4.3 α‐thalassemia 5 mg/kg/day | 1 | Mean Difference (IV, Fixed, 95% CI) | 0.0 [0.0, 0.0] | |
| 4.4 α‐thalassemia 10 mg/kg/day | 1 | Mean Difference (IV, Fixed, 95% CI) | 0.0 [0.0, 0.0] | |
| 4.5 HbE/β‐thalassemia 5 mg/kg/day | 1 | Mean Difference (IV, Fixed, 95% CI) | 0.0 [0.0, 0.0] | |
| 4.6 HbE/β‐thalassemia 10 mg/kg/day | 1 | Mean Difference (IV, Fixed, 95% CI) | 0.0 [0.0, 0.0] | |
| 4.7 < 18 years 5 mg/kg/day | 1 | Mean Difference (IV, Fixed, 95% CI) | 0.0 [0.0, 0.0] | |
| 4.8 < 18 years 10 mg/kg/day | 1 | Mean Difference (IV, Fixed, 95% CI) | 0.0 [0.0, 0.0] | |
| 4.9 ≥18 years 5 mg/kg/day | 1 | Mean Difference (IV, Fixed, 95% CI) | 0.0 [0.0, 0.0] | |
| 4.10 ≥18 years 10 mg/kg/day | 1 | Mean Difference (IV, Fixed, 95% CI) | 0.0 [0.0, 0.0] | |
| 5 LIC: decrease of ≥ 3 mg Fe/g dw (# participants affected) Show forest plot | 1 | 166 | Risk Ratio (M‐H, Fixed, 95% CI) | 4.16 [1.90, 9.11] |
| 5.1 Deferasirox 5 mg/kg/day | 1 | 83 | Risk Ratio (M‐H, Fixed, 95% CI) | 3.05 [0.98, 9.50] |
| 5.2 Deferasirox 10 mg/kg/day | 1 | 83 | Risk Ratio (M‐H, Fixed, 95% CI) | 5.26 [1.76, 15.71] |
| 6 LIC: ≥ 30% reduction Fe/g dw (# participants affected) Show forest plot | 1 | 166 | Risk Ratio (M‐H, Fixed, 95% CI) | 14.17 [2.88, 69.74] |
| 6.1 Deferasirox 5 mg/kg/day | 1 | 83 | Risk Ratio (M‐H, Fixed, 95% CI) | 15.02 [0.93, 242.87] |
| 6.2 Deferasirox 10 mg/kg/day | 1 | 83 | Risk Ratio (M‐H, Fixed, 95% CI) | 13.75 [1.97, 95.97] |
| 7 LIC: shift to lower iron burden range (# participants affected) Show forest plot | 1 | 166 | Risk Ratio (M‐H, Fixed, 95% CI) | 3.35 [1.62, 6.91] |
| 7.1 Deferasirox 5 mg/kg/day | 1 | 83 | Risk Ratio (M‐H, Fixed, 95% CI) | 3.39 [1.10, 10.45] |
| 7.2 Deferasirox 10 mg/kg/day | 1 | 83 | Risk Ratio (M‐H, Fixed, 95% CI) | 3.31 [1.28, 8.55] |
| 8 LIC: achieve LIC < 5 mg Fe/g dw (# participants affected) Show forest plot | 1 | 166 | Risk Ratio (M‐H, Fixed, 95% CI) | 5.35 [1.30, 21.99] |
| 8.1 deferasirox 5mg/kg/d | 1 | 83 | Risk Ratio (M‐H, Fixed, 95% CI) | 4.07 [0.54, 30.96] |
| 8.2 deferasirox 10mg/kg/d | 1 | 83 | Risk Ratio (M‐H, Fixed, 95% CI) | 6.62 [0.91, 48.05] |
| 9 Drug‐related serious AEs (# participants affected) Show forest plot | 1 | Risk Ratio (M‐H, Fixed, 95% CI) | Totals not selected | |
| 10 Drug‐related serious AEs (# participants affected) Show forest plot | 1 | Risk Ratio (M‐H, Fixed, 95% CI) | Totals not selected | |
| 10.1 GI disorders ‐ abdominal pain | 1 | Risk Ratio (M‐H, Fixed, 95% CI) | 0.0 [0.0, 0.0] | |
| 10.2 Infections and infestations ‐ cellulitis | 1 | Risk Ratio (M‐H, Fixed, 95% CI) | 0.0 [0.0, 0.0] | |
| 10.3 Skin and subcutaneous tissue disorders ‐ pruritus | 1 | Risk Ratio (M‐H, Fixed, 95% CI) | 0.0 [0.0, 0.0] | |
| 10.4 Skin and subcutaneous tissue disorders ‐ rash | 1 | Risk Ratio (M‐H, Fixed, 95% CI) | 0.0 [0.0, 0.0] | |
| 10.5 General disorders ‐ pyrexia | 1 | Risk Ratio (M‐H, Fixed, 95% CI) | 0.0 [0.0, 0.0] | |
| 10.6 Hepatobiliary disorders ‐ hepatotoxicity | 1 | Risk Ratio (M‐H, Fixed, 95% CI) | 0.0 [0.0, 0.0] | |
| 11 Any AE (# participants affected) Show forest plot | 1 | Risk Ratio (M‐H, Fixed, 95% CI) | Totals not selected | |
| 12 Mild AE (# participants affected) Show forest plot | 1 | Risk Ratio (M‐H, Fixed, 95% CI) | Totals not selected | |
| 13 Moderate AE (# participants affected) Show forest plot | 1 | Risk Ratio (M‐H, Fixed, 95% CI) | Totals not selected | |
| 14 Severe AE (# participants affected) Show forest plot | 1 | Risk Ratio (M‐H, Fixed, 95% CI) | Totals not selected | |
| 15 AEs Show forest plot | 1 | Risk Ratio (M‐H, Fixed, 95% CI) | Totals not selected | |
| 15.1 Ear and labyrinth disorders ‐ neurosensory deafness | 1 | Risk Ratio (M‐H, Fixed, 95% CI) | 0.0 [0.0, 0.0] | |
| 15.2 Investigations ‐ abnormal platelet count (post‐baseline) | 1 | Risk Ratio (M‐H, Fixed, 95% CI) | 0.0 [0.0, 0.0] | |
| 15.3 Investigations ‐ abnormal neutrophils count (post‐baseline) | 1 | Risk Ratio (M‐H, Fixed, 95% CI) | 0.0 [0.0, 0.0] | |
| 15.4 Investigations ‐ abnormal ALT (post‐baseline) | 1 | Risk Ratio (M‐H, Fixed, 95% CI) | 0.0 [0.0, 0.0] | |
| 15.5 Investigations ‐ abnormal AST (post‐baseline) | 1 | Risk Ratio (M‐H, Fixed, 95% CI) | 0.0 [0.0, 0.0] | |
| 15.6 Investigations ‐ abnormal serum creatinine (post‐baseline) | 1 | Risk Ratio (M‐H, Fixed, 95% CI) | 0.0 [0.0, 0.0] | |
| 15.7 Investigations ‐ abnormal creatinine clearance (post‐baseline) | 1 | Risk Ratio (M‐H, Fixed, 95% CI) | 0.0 [0.0, 0.0] | |
| 15.8 Investigations ‐ urinary protein/creatinine ratio (post‐baseline) | 1 | Risk Ratio (M‐H, Fixed, 95% CI) | 0.0 [0.0, 0.0] | |
| 15.9 Investigations ‐ abnormal (low) systolic blood pressure (post‐baseline) | 1 | Risk Ratio (M‐H, Fixed, 95% CI) | 0.0 [0.0, 0.0] | |
| 15.10 Investigations ‐ abnormal (high) systolic blood pressure (post‐baseline) | 1 | Risk Ratio (M‐H, Fixed, 95% CI) | 0.0 [0.0, 0.0] | |
| 15.11 Investigations ‐ abnormal (low) diastolic blood pressure (post‐baseline) | 1 | Risk Ratio (M‐H, Fixed, 95% CI) | 0.0 [0.0, 0.0] | |
| 15.12 Investigations ‐ abnormal (high) diastolic blood pressure (post‐baseline) | 1 | Risk Ratio (M‐H, Fixed, 95% CI) | 0.0 [0.0, 0.0] | |
| 15.13 Investigations ‐ abnormal (low) pulse rate (post‐baseline) | 1 | Risk Ratio (M‐H, Fixed, 95% CI) | 0.0 [0.0, 0.0] | |
| 15.14 Investigations ‐ abnormal (high) pulse rate (post‐baseline) | 1 | Risk Ratio (M‐H, Fixed, 95% CI) | 0.0 [0.0, 0.0] | |
| 15.15 Renal and urinary disorders ‐ proteinuria | 1 | Risk Ratio (M‐H, Fixed, 95% CI) | 0.0 [0.0, 0.0] | |
| 16 Drug‐related AEs Show forest plot | 1 | Risk Ratio (M‐H, Fixed, 95% CI) | Totals not selected | |
| 16.1 GI disorders ‐ abdominal pain | 1 | Risk Ratio (M‐H, Fixed, 95% CI) | 0.0 [0.0, 0.0] | |
| 16.2 GI disorders ‐ abdominal pain upper | 1 | Risk Ratio (M‐H, Fixed, 95% CI) | 0.0 [0.0, 0.0] | |
| 16.3 GI disorders ‐ diarrhoea | 1 | Risk Ratio (M‐H, Fixed, 95% CI) | 0.0 [0.0, 0.0] | |
| 16.4 GI disorders ‐ nausea | 1 | Risk Ratio (M‐H, Fixed, 95% CI) | 0.0 [0.0, 0.0] | |
| 16.5 Nervous system disorders ‐ headache | 1 | Risk Ratio (M‐H, Fixed, 95% CI) | 0.0 [0.0, 0.0] | |
| 16.6 Skin and subcutaneous tissue disorders ‐ skin rash | 1 | Risk Ratio (M‐H, Fixed, 95% CI) | 0.0 [0.0, 0.0] | |
| 17 Adherence (# participants taking the planned study dose) Show forest plot | 1 | Risk Ratio (M‐H, Fixed, 95% CI) | Totals not selected | |
| 18 Discontinuations Show forest plot | 1 | 166 | Risk Ratio (M‐H, Fixed, 95% CI) | 1.32 [0.50, 3.52] |
| 18.1 Deferasirox 5 mg/kg/day | 1 | 83 | Risk Ratio (M‐H, Fixed, 95% CI) | 1.19 [0.33, 4.25] |
| 18.2 Deferasirox 10 mg/kg/day | 1 | 83 | Risk Ratio (M‐H, Fixed, 95% CI) | 1.53 [0.33, 7.08] |
| 19 Discontinuing study due to AE (# participants affected) Show forest plot | 1 | Risk Ratio (M‐H, Fixed, 95% CI) | Totals not selected | |
| 20 Dose increase Show forest plot | 1 | 166 | Risk Ratio (M‐H, Fixed, 95% CI) | 0.87 [0.63, 1.19] |
| 20.1 Deferasirox 5 mg/kg/day | 1 | 83 | Risk Ratio (M‐H, Fixed, 95% CI) | 0.88 [0.57, 1.38] |
| 20.2 Deferasirox 10 mg/kg/day | 1 | 83 | Risk Ratio (M‐H, Fixed, 95% CI) | 0.85 [0.54, 1.33] |
| 21 Dose interruption (at least once) Show forest plot | 1 | 166 | Risk Ratio (M‐H, Fixed, 95% CI) | 1.10 [0.88, 1.39] |
| 21.1 Deferasirox 5 mg/kg/day | 1 | 83 | Risk Ratio (M‐H, Fixed, 95% CI) | 1.02 [0.73, 1.43] |
| 21.2 Deferasirox 10 mg/kg/day | 1 | 83 | Risk Ratio (M‐H, Fixed, 95% CI) | 1.19 [0.87, 1.62] |
| 22 Dose reduction Show forest plot | 1 | 166 | Risk Ratio (M‐H, Fixed, 95% CI) | 1.46 [0.70, 3.06] |
| 22.1 Deferasirox 5 mg/kg/day | 1 | 83 | Risk Ratio (M‐H, Fixed, 95% CI) | 1.53 [0.54, 4.30] |
| 22.2 Deferasirox 10 mg/kg/day | 1 | 83 | Risk Ratio (M‐H, Fixed, 95% CI) | 1.4 [0.49, 4.00] |
| 23 Dose reduction due to AE Show forest plot | 1 | 166 | Risk Ratio (M‐H, Fixed, 95% CI) | 1.53 [0.69, 3.38] |
| 23.1 Deferasirox 5 mg/kg/day | 1 | 83 | Risk Ratio (M‐H, Fixed, 95% CI) | 2.04 [0.63, 6.63] |
| 23.2 Deferasirox 10 mg/kg/day | 1 | 83 | Risk Ratio (M‐H, Fixed, 95% CI) | 1.15 [0.39, 3.39] |
| 24 Haemoglobin (g/L): mean change from baseline Show forest plot | 1 | 144 | Mean Difference (IV, Fixed, 95% CI) | 1.54 [‐0.82, 3.90] |
| 24.1 Deferasirox 5 mg/kg/day | 1 | 71 | Mean Difference (IV, Fixed, 95% CI) | 1.00 [‐2.31, 4.31] |
| 24.2 Deferasirox 10 mg/kg/day | 1 | 73 | Mean Difference (IV, Fixed, 95% CI) | 2.10 [‐1.27, 5.47] |
| 25 Transferrin saturation (%): mean change from baseline Show forest plot | 1 | 141 | Mean Difference (IV, Fixed, 95% CI) | ‐7.10 [‐11.71, ‐2.50] |
| 25.1 Deferasirox 5 mg/kg/day | 1 | 70 | Mean Difference (IV, Fixed, 95% CI) | ‐7.16 [‐12.95, ‐1.37] |
| 25.2 Deferasirox 10 mg/kg/day | 1 | 71 | Mean Difference (IV, Fixed, 95% CI) | ‐7.01 [‐14.59, 0.57] |