成人における癌予防のためのビタミンD補充
Appendices
Appendix 1. Search strategies
| Search terms and databases |
| Unless otherwise stated, search terms are free text terms. '$': stands for any character; '?': substitutes one or no character; adj: adjacent (i.e. number of words within range of search term); exp: exploded MeSH; MeSH: medical subject heading (MEDLINE medical index term); pt: publication type; sh: MeSH; tw: text word. |
| The Cochrane Library |
| 1. MeSH descriptor Vitamin D explode all trees |
| MEDLINE |
| 1. exp Vitamin D/ |
| EMBASE |
| 1. exp ergocalciferol/ or exp vitamin D/ |
| LILACS |
| 1. Vitamin D |
| ISI Web of Science |
| 1. TS=(vitamin d2 OR vitamin d 2 OR hydroxyvitamin* OR cholecalciferol* OR calciferol* OR calcitriol* OR calcifediol* OR dihydrotachysterol* OR alfacalcidol* OR alphacalcidol* OR colecalciferol*) |
Appendix 2. Description of interventions
| Characteristic | Intervention(s) [route, frequency, total dose/day] | Comparator(s) [route, frequency, total dose/day] |
| Avenell 2012 | I1: vitamin D₃ (800 IU) orally, daily | C1: calcium (1000 mg) orally, daily |
| I2: vitamin D₃ (800 IU) plus calcium (1000 mg) orally, daily | C2: matched placebo tablet orally, daily | |
| Bolton‐Smith 2007 | I1: vitamin D₃ (400 IU) plus calcium 1000 mg orally, daily | C1: vitamin K₁ 200 μg orally, daily |
| I2: vitamin D₃ (400 IU) plus calcium 1000 mg plus vitamin K₁ 200 μg orally, daily | C2: matched placebo tablet orally, daily | |
| Brunner 2011 | I: vitamin D₃ (400 IU) plus calcium (1000 mg) orally, daily | C: matched placebo tablet orally, daily |
| Daly 2008 | I: calcium‐vitamin D₃‐fortified milk containing vitamin D₃ (800 IU) plus calcium (1000 mg) daily | C: usual diet |
| Gallagher 2001 | I1: calcitriol (0.5 μg) daily | C1: calcitriol (0.5 μg daily) plus conjugated oestrogens 0.625 mg/daily plus medroxyprogesterone acetate 2.5 mg orally, daily |
| I2: conjugated oestrogens 0.625 mg/daily plus medroxyprogesterone acetate 2.5 mg orally, daily | C2: matched placebo tablet orally, daily | |
| Glendenning 2012 | I: cholecalciferol 150,000 IU 3‐monthly | C: placebo vitamin D 3‐monthly |
| Grady 1991 | I: calcitriol (0.5 μg) orally, daily | C: placebo vitamin D orally, daily |
| Janssen 2010 | I: vitamin D₃ (400 IU) plus calcium (500 mg) orally, daily | C: matched placebo vitamin D₃ plus calcium (500 mg) orally, daily |
| Komulainen 1999 | I1: sequential combination of 2 mg estradiol valerate (days 1 to 21) and 1 mg cyproterone acetate (days 12 to 21) and a treatment‐free interval (days 22 to 28) | C1: sequential combination of 2 mg estradiol valerate (days 1 to 21) and 1 mg cyproterone acetate (days 12 to 21) and a treatment‐free interval (days 22 to 28) plus vitamin D₃ (300 IU) and calcium (500 mg) orally, daily |
| I2: vitamin D₃ (300 IU) plus calcium (500 mg) dailya | C2: placebo | |
| Lappe 2007 | I1: vitamin D₃ (1000 IU) plus calcium (1400 to 1500 mg) orally, daily | C1: vitamin D₃ placebo plus calcium placebo, orally, daily |
| I2: vitamin D₃ placebo plus calcium (1400 to 1500 mg) orally, daily | ||
| Larsen 2012 | I: vitamin D₃ 3000 IU orally, daily | C: matched placebo vitamin D orally |
| Murdoch 2012 | I: vitamin D₃ an initial dose of 200,000 IU of vitamin D₃, then 200,000 IU 1 month later, then 100,000 IU monthly orally | C: matched placebo vitamin D orally |
| Ott 1989 | I: calcitriol 0.25 to 2 μg plus calcium 1000 mg, orally, daily | C: matched placebo vitamin D plus calcium 1000 mg orally, daily |
| Prince 2008 | I: vitamin D₂ 1000 IU plus calcium 1000 mg orally, daily | C: matched placebo tablet of vitamin D plus calcium 1000 mg orally, daily |
| Sanders 2010 | I: vitamin D₃ 500,000 IU orally, yearly | C: matched placebo tablet of vitamin D orally, yearly |
| Trivedi 2003 | I: vitamin D₃ 100,000 IU every 4 months orally | C: matched placebo vitamin D every 4 months orally |
| Witham 2013 | I: vitamin D₃ 100,000 IU every 3 months orally | C: matched placebo vitamin D every 3 months orally |
| Wood 2012 | I1: vitamin D₃ 400 IU orally, daily | C: matched placebo vitamin D orally, daily |
| I2: vitamin D₃ 1000 IU orally, daily | ||
| "‐" denotes not reported aNo intake during June to August, the vitamin D₃ dosage was lowered to 100 IU/day after 4 years of treatment C: comparator; I: intervention | ||
Appendix 3. Baseline characteristics (I)
| Characteristic Study ID | Design of study | Duration of intervention | Duration of follow‐up | Description of participants | Country | Setting |
| Avenell 2012 | Factorial RCT | 3.75 | 6.2 | Elderly people with low‐trauma, osteoporotic fracture in the previous 10 years | United Kingdom | Outpatients |
| Bolton‐Smith 2007 | Factorial RCT | 2 | 2 | Elderly nonosteoporotic women | United Kingdom | Outpatients |
| Brunner 2011 | RCT | 7 | 7 | Postmenopausal women | United States | Outpatients |
| Daly 2008 | RCT | 2 | 3.5 | Healthy ambulatory men | Australia | Outpatients |
| Gallagher 2001 | Factorial RCT | 3 | 5 | Elderly women | United States | Outpatients |
| Glendenning 2012 | RCT | 0.5 | 0.75 | Elderly women | Australia | Outpatients |
| Grady 1991 | RCT | 0.5 | 0.5 | Elderly people | United States | Outpatients |
| Janssen 2010 | RCT | 1 | 1 | Elderly vitamin D‐insufficient women | Netherlands | Outpatients |
| Komulainen 1999 | Factorial RCT | 5 | 5 | Postmenopausal women | Finland | Outpatients |
| Lappe 2007 | RCT | 4 | 4 | Postmenopausal women | United States | Outpatients |
| Larsen 2012 | RCT | 0.38 | 0.38 | Hypertensive patients | Denmark | Outpatients |
| Murdoch 2012 | RCT | 1 | 1 | Healthy adults | New Zealand | Outpatients |
| Ott 1989 | RCT | 2 | 2 | Postmenopausal women | United States | Outpatients |
| Prince 2008 | RCT | 1 | 1 | Elderly women with vitamin D insufficiency | Australia | Outpatients |
| Sanders 2010 | RCT | 2.96 | 2.96 | Elderly women | Australia | Outpatients |
| Trivedi 2003 | RCT | 5 | 5 | Elderly people | United Kingdom | Outpatients |
| Witham 2013 | RCT | 1 | 1 | Elderly patients with isolated systolic hypertension | United Kingdom | Outpatients |
| Wood 2012 | RCT | 1 | 1 | Healthy postmenopausal white women | United Kingdom | Outpatients |
Appendix 4. Baseline characteristics (II)
| Characteristic Study ID | Sex | Age | Ethnic groups | Co‐medications / Co‐interventions | Co‐morbidities |
| Avenell 2012 | 85 | 77 | ‐ | ‐ | Low‐trauma osteoporotic fracture in the previous 10 years |
| Bolton‐Smith 2007 | 100 | 68 | ‐ | Vitamin K1 | ‐ |
| Brunner 2011 | 100 | 62.4 (50 to 79) | ‐ | ‐ | ‐ |
| Daly 2008 | 0 | 61.9 | ‐ | ‐ | ‐ |
| Gallagher 2001 | 100 | 71 (65 to 67) | ‐ | Conjugated oestrogens plus medroxyprogesterone acetate | ‐ |
| Glendenning 2012 | 100 | 76.7 | ‐ | ‐ | ‐ |
| Grady 1991 | 54 | 79.1 (70 to 97) | ‐ | ‐ | ‐ |
| Janssen 2010 | 100 | 80.8 | ‐ | ‐ | ‐ |
| Komulainen 1999 | 100 | 52.7 (47 to 56) | ‐ | Oestradiol valerate and cyproterone acetate | ‐ |
| Lappe 2007 | 100 | 66.7 | White: 100 | ‐ | ‐ |
| Larsen 2012 | 69 | 60 | White: 100 | Arterial hypertension | |
| Murdoch 2012 | 75 | 47 | ‐ | ‐ | ‐ |
| Ott 1989 | 100 | 67.5 (50 to 80) | ‐ | ‐ | ‐ |
| Prince 2008 | 100 | 77.2 (70 to 90) | ‐ | ‐ | ‐ |
| Sanders 2010 | 100 | 76 | ‐ | ‐ | ‐ |
| Trivedi 2003 | 24 | 74.7 (65 to 85) | ‐ | ‐ | ‐ |
| Witham 2013 | 48 | 77 (>70) | ‐ | ‐ | Arterial hypertension |
| Wood 2012 | 100 | 64 (60 to 70) | White: 100 | ‐ | ‐ |
| "‐" denotes not reported | |||||
Appendix 5. Matrix of study endpoints
| Characteristic Study ID | Primary endpoint(s) | Secondary endpoint(s) | Other endpoint(s) |
| Avenell 2012 | Fractures | Overall mortality, vascular disease mortality, cancer mortality, and cancer occurrence (3.75, 6.2 y) | ‐ |
| Bolton‐Smith 2007 | Bone mineral density (6, 12, 18, 24 mo) | Markers of bone turnover, and vitamin status (0, 24 mo) | Overall mortality (24 mo) |
| Brunner 2011 | Fractures, cancer occurrence, mortality (3, 7 y) | ‐ | ‐ |
| Daly 2008 | Bone mineral density | ‐ | Overall mortality (24 mo) |
| Gallagher 2001 | Bone mineral density (1.5, 3, 6, 12, 18, 24, 30, 36 mo) | ‐ | Overall mortality (24 mo) |
| Glendenning 2012 | Falls, muscle strength, and mobility (0, 3, 6, 9 mo) | Serum 25‐hidrohyvitamin D levels, and adverse events (0, 3, 6, 9 mo) | Overall mortality (9 mo) |
| Grady 1991 | Muscle strength (1, 2, 4, 8, 12, 18, 24 wk) | ‐ | Overall mortality (24 mo) |
| Janssen 2010 | Muscle strength, power and functional mobility (0, 6 mo) | ‐ | Overall mortality (6 mo) |
| Komulainen 1999 | Bone mineral density (0, 1, 2, 3, 4, 5 y) | ‐ | Adverse events (5 y), overall mortality (5 y) |
| Lappe 2007 | Fractures | Cancer occurrence (0, 6, 12, 18, 24, 30, 36, 42, 48 mo), vitamin D status (0, 12 mo) | Overall mortality (48 mo) |
| Larsen 2012 | Systolic blood pressure | Diastolic blood pressure and heart rate, central blood pressure, central augmentation index, carotid‐femoral pulse wave velocity, urinary calcium‐creatinine ratio, and plasma levels of renin, angiotensin II, aldosterone, brain natriuretic peptide, 25(OH)D, intact parathyroid hormone, ionized calcium, phosphate, and fibroblast growth factor 23 at 20 weeks | Adverse events (20 wk) |
| Murdoch 2012 | Upper respiratory tract infections | Duration and severity of upper respiratory tract infections episodes, and number of days of missed work due to upper respiratory tract infections episodes 1 yr | Adverse events (1 yr) |
| Ott 1989 | Bone mass (0, 6, 12, 18, 24 mo) | Adverse events (24 mo) | Overall mortality (24 mo) |
| Prince 2008 | Falls (12 mo) | Adverse events (12 mo) | Overall mortality (12 mo) |
| Sanders 2010 | Falls and fractures (3, 9, 15, 24, 27, 36 mo) | Adverse events (36 mo) | Overall mortality (36 mo) |
| Trivedi 2003 | Fractures (5 y), cause‐specific mortality (5 y) | Cancer occurrence (5 y), cardiovascular disease (5 y) | Overall mortality (5 y) |
| Witham 2013 | Blood pressure (0, 3, 6, 9, 12 mo) | 24‐hour blood pressure, soluble markers of cardiovascular risk, endothelial function, pulse wave velocity, other biochemical measurements (glucose, total cholesterol, LDL and HDL cholesterol, triglycerides, serum albumin and calcium), exercise capacity and falls (3, 6, 9, 12 mo) | Adverse events (3, 6, 9, 12 mo) |
| Wood 2012 | Markers of cardiovascular disease risk (12 mo) | Adverse events (12 mo) | ‐ |
| Primary or secondary endpoint(s) refer to verbatim statements in the publication, other endpoints relate to outcomes which were not specified as 'primary' or 'secondary' outcomes in the publication "‐" denotes not reported mo: months; wk: weeks; y: years | |||
Appendix 6. Adverse events
| Characteristic Study ID | Intervention(s) and comparator(s) | Randomised | Deaths | All adverse events | Severe/serious adverse events | Discontinued study due to adverse events |
| Avenell 2012 | I1: vitamin D₃ | 2649 | 836/2649 (31.6) | 363/2649 (13.7) | ‐ | ‐ |
| C1: matched placebo | 2643 | 881/2643 (33.3) | 386/2643 (14.6) | |||
| all: | 5292 | 33 (0.6) | ||||
| Bolton‐Smith 2007 | I1: vitamin D₃ plus calcium | 62 | 0/62 (0) | ‐ | ‐ | ‐ |
| C1: matched placebo | 61 | 1/60 (1.7) | ||||
| all: | 123 | |||||
| Brunner 2011 | I1: vitamin D₃ plus calcium | 18,176 | 744/18,176 (4.1) | 449/18176 (2.5) | 449/18,176 (2.5) | ‐ |
| C1: matched placebo | 18,106 | 807/18,106 (4.5) | 381/18106 (2.1) | 381/18,106 (2.1) | ||
| all: | 36,282 | |||||
| Daly 2008 | I1: calcium‐vitamin D₃‐fortified milk plus calcium | 85 | 1/85 (1.2) | 9/85 (10.6) | 9/85 (10.6) | 9/85 (10.6) |
| C1: no intervention | 82 | 0/82 (0) | 2/82 (2.4) | 2/82 (2.4) | 2/82 (2.4) | |
| all: | 167 | |||||
| Gallagher 2001 | I1: calcitriol | 123 | 2/123 (1.6) | 87/123 (71.0) | 55/123 (45.0) | ‐ |
| C1: matched placebo | 123 | 1/123 (0.8) | (56/123 (45.5) | 46/123 (37.0) | ||
| all: | 246 | |||||
| Glendenning 2012 | I: cholecalciferol 150,000 3‐monthly | 353 | 2/353 (0.6) | 24/353 (6.8) | 19/353 (5.4) | ‐ |
| C: placebo vitamin D 3‐monthly | 333 | 0/333 (0) | 21/333 (6.3) | 15/333 (4.5) | ||
| all: | 686 | |||||
| Grady 1991 | I: calcitriol | 50 | 1/50 (2) | 7/50 (14.0) | 7/50 (14.0) | ‐ |
| C: placebo vitamin D | 48 | 0/48 (0) | 2/48 (4.2) | 2/48 (4.2) | ||
| all: | 98 | |||||
| Janssen 2010 | I: vitamin D₃ plus calcium | 36 | 0/36 (0) | ‐ | ‐ | ‐ |
| C: matched placebo vitamin D₃ plus calcium | 34 | 0/34 (0) | ||||
| all: | 70 | |||||
| Komulainen 1999 | I: vitamin D₃ plus calcium | 116 | 0/116 (0) | ‐ | 5/116 (4.3) | ‐ |
| C: placebo | 116 | 1/116 (0.9) | 4/116 (3.4) | |||
| all: | 232 | |||||
| Lappe 2007 | I1: vitamin D₃ plus calcium | 446 | 4/446 (0.9) | 1/446 (0.2) | 13/446 (2.9) | ‐ |
| I2: calcium plus vitamin D placebo | 733 | 18/733 (2.5) | 4/733 (0.5 | 20/733 (2.7) | ||
| all: | 1179 | |||||
| Larsen 2012 | I1: vitamin D₃ | 65 | 2/65 (3.1) | 0/65 (0.0) | 2/65 (3.1) | 1/65 (1.5) |
| C1: matched placebo vitamin D | 65 | 0/65 (0.0) | 0/65 (0.0) | 0/65 (0.0) | 0/65 (0.0) | |
| all: | 130 | |||||
| Murdoch 2012 | I1: vitamin D₃ | 161 | 0/161 (0) | 700/161 | 21/161 (13) | ‐ |
| C1: matched placebo vitamin D | 161 | 0/161 (0) | 792/161 | 19/161 (11.8) | ||
| all: | 322 | |||||
| Ott 1989 | I1: vitamin D3 plus calcium | 43 | 0/43 (0) | 11/43 (25.6) | ‐ | ‐ |
| C1: matched placebo vitamin D plus calcium | 43 | 1/43 (2.3) | 1/43 (2.3) | |||
| all: | 86 | |||||
| Prince 2008 | I1: vitamin D₂2 plus calcium | 151 | 0/151 (0) | ‐ | ‐ | ‐ |
| C1: matched placebo tablet of vitamin D plus calcium | 151 | 1/151 (0.7) | ||||
| all: | 302 | |||||
| Sanders 2010 | I1: vitamin D₃ | 1131 | 40/1131 (3.5) | 223/1131 (19.7) | 244/1131 (19.7) | ‐ |
| C1: matched placebo tablet | 1127 | 47/1127 (4.2) | 201/1127 (17.8) | 207/1127 (17.8) | ||
| all: | 2258 | |||||
| Trivedi 2003 | I1: vitamin D₃ | 1345 | 224/1345 (16.7) | ‐ | ‐ | ‐ |
| C1: matched placebo vitamin D | 1341 | 247/1341 (18.4) | ||||
| all: | 2686 | |||||
| Witham 2013 | I1: vitamin D₃ | 80 | 0/80 (0) | 18/80 (22.5) | 11/80 (13.7) | 0/80 (0) |
| C1: matched placebo vitamin D | 79 | 1/79 (1.3) | 21/79 (26.6) | 13/79 (16.5) | 0/79 (0) | |
| all: | 159 | |||||
| Wood 2012 | I1: vitamin D₃ | 203 | 0/203 (0) | 32/203 (15.8) | 15/203 (7.4) | 11/203 (5.4) |
| C1: matched placebo vitamin D | 102 | 0/102 (0) | 20/102 (19.6) | 4/102 (3.9) | 2/102 (2.0) | |
| all: | 305 | |||||
| "‐" denotes not reported | ||||||

Study flow diagram.

'Risk of bias' graph: review authors' judgements about each risk of bias item presented as percentages across all included studies.

'Risk of bias' summary: review authors' judgements about each risk of bias item for each included study.

Funnel plot of comparison: 1 Vitamin D versus placebo or no intervention, outcome: 1.1 Cancer occurrence in trials with a low or high risk of bias.

Trial sequential analysis on cancer occurrence in the 18 vitamin D trials was performed based on cancer occurrence of 10% in the control group, a relative risk reduction of 5% with vitamin D supplementation, a type I error of 5%, and a type II error of 20% (80% power). There was no diversity. This resulted in a required information size of 110,505 participants. Trial sequential analysis of all vitamin D trials suggests that the futility area is reached after the 10th trial allowing us to conclude that any possible intervention effect, if any, is lower than a 5% relative risk reduction. The blue line represents the cumulative Z‐score of the meta‐analysis. The green lines represent the conventional statistical boundaries. The red inward sloping lines represent the trial sequential monitoring boundaries.
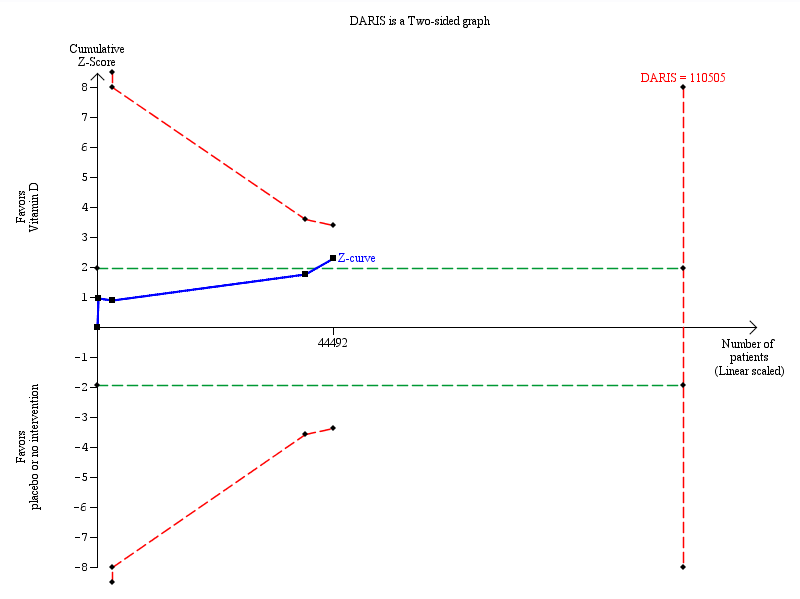
Trial sequential analysis on cancer mortality in the four vitamin D trials was performed based on cancer mortality of 3% in the control group, a relative risk reduction of 10% with vitamin D₃ supplementation, a type I error of 5%, and a type II error of 20% (80% power). There was no diversity. The required information size was 110,505 participants. The cumulative Z‐curve (blue line) did not cross the trial sequential monitoring boundary (red line) after the fourth trial. The blue line represents the cumulative Z‐score of the meta‐analysis. The green lines represent the conventional statistical boundaries. The red inward sloping lines represent the trial sequential monitoring boundaries.

Comparison 1 Vitamin D versus placebo or no intervention, Outcome 1 Cancer occurrence in trials with a low or high risk of bias.
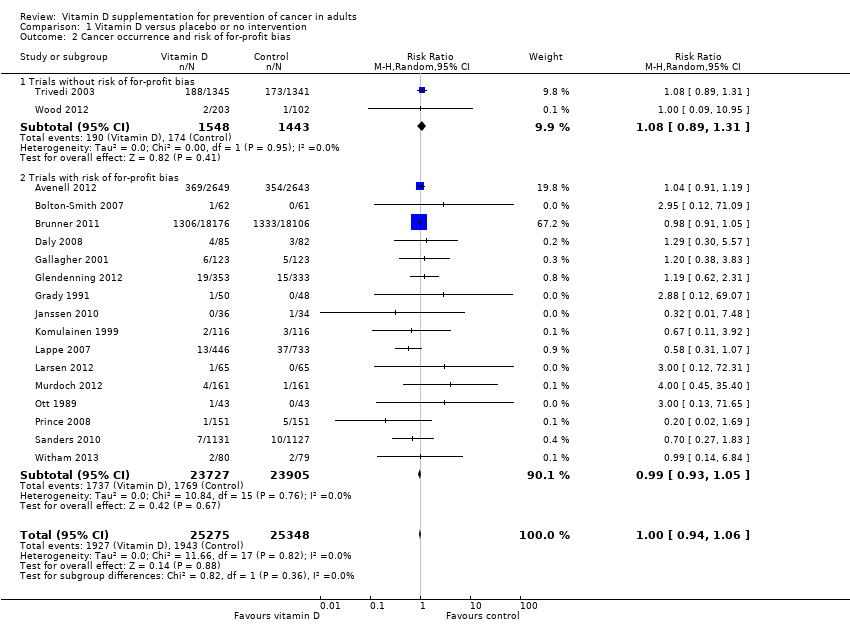
Comparison 1 Vitamin D versus placebo or no intervention, Outcome 2 Cancer occurrence and risk of for‐profit bias.

Comparison 1 Vitamin D versus placebo or no intervention, Outcome 3 Cancer occurrence in primary and secondary prevention trials.

Comparison 1 Vitamin D versus placebo or no intervention, Outcome 4 Cancer occurrence and vitamin D status.

Comparison 1 Vitamin D versus placebo or no intervention, Outcome 5 Cancer occurrence ('best‐worst case' and 'worst‐best case' scenario).

Comparison 1 Vitamin D versus placebo or no intervention, Outcome 6 Cancer occurrence in trials using vitamin D₃ (cholecalciferol).

Comparison 1 Vitamin D versus placebo or no intervention, Outcome 7 Cancer occurrence in trials using vitamin D₃ singly or combined with calcium.
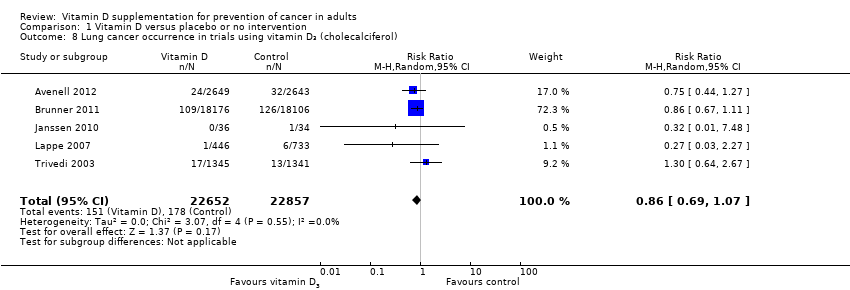
Comparison 1 Vitamin D versus placebo or no intervention, Outcome 8 Lung cancer occurrence in trials using vitamin D₃ (cholecalciferol).
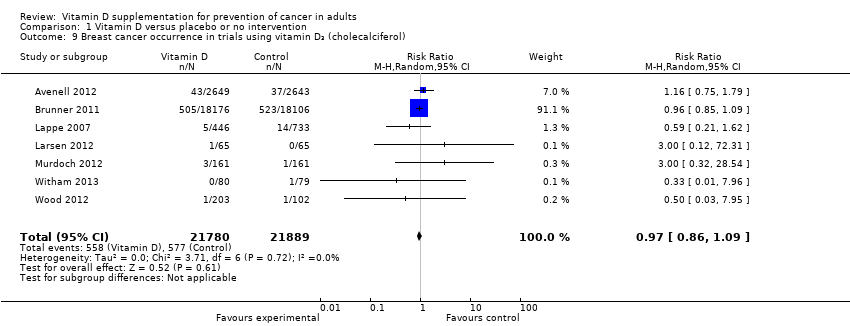
Comparison 1 Vitamin D versus placebo or no intervention, Outcome 9 Breast cancer occurrence in trials using vitamin D₃ (cholecalciferol).

Comparison 1 Vitamin D versus placebo or no intervention, Outcome 10 Colorectal cancer occurrence in trials using vitamin D₃ (cholecalciferol).

Comparison 1 Vitamin D versus placebo or no intervention, Outcome 11 Pancreatic cancer occurrence in trials using vitamin D₃ (cholecalciferol).

Comparison 1 Vitamin D versus placebo or no intervention, Outcome 12 Prostate cancer occurrence in trials using vitamin D₃ (cholecalciferol).
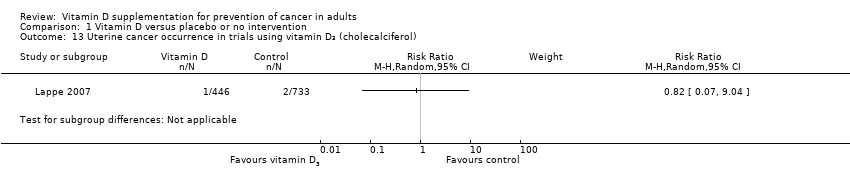
Comparison 1 Vitamin D versus placebo or no intervention, Outcome 13 Uterine cancer occurrence in trials using vitamin D₃ (cholecalciferol).

Comparison 1 Vitamin D versus placebo or no intervention, Outcome 14 Ovarian cancer occurrence in trials using vitamin D₃ (cholecalciferol).

Comparison 1 Vitamin D versus placebo or no intervention, Outcome 15 Oesophageal cancer occurrence in trials using vitamin D₃ (cholecalciferol).
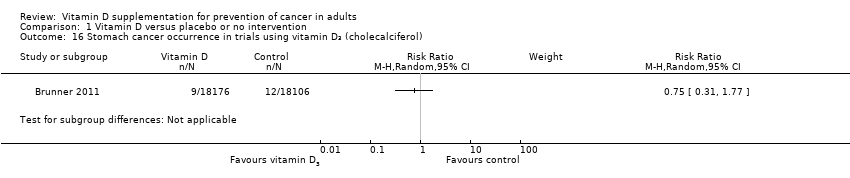
Comparison 1 Vitamin D versus placebo or no intervention, Outcome 16 Stomach cancer occurrence in trials using vitamin D₃ (cholecalciferol).

Comparison 1 Vitamin D versus placebo or no intervention, Outcome 17 Liver cancer occurrence in trials using vitamin D₃ (cholecalciferol).
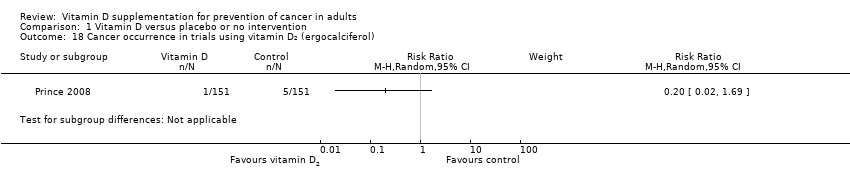
Comparison 1 Vitamin D versus placebo or no intervention, Outcome 18 Cancer occurrence in trials using vitamin D₂ (ergocalciferol).

Comparison 1 Vitamin D versus placebo or no intervention, Outcome 19 Cancer occurrence in trials using calcitriol.

Comparison 1 Vitamin D versus placebo or no intervention, Outcome 20 Breast cancer occurrence in trials using calcitriol.

Comparison 1 Vitamin D versus placebo or no intervention, Outcome 21 Uterine cancer occurrence in trials using calcitriol.

Comparison 1 Vitamin D versus placebo or no intervention, Outcome 22 Stomach cancer occurrence in trials using calcitriol.

Comparison 1 Vitamin D versus placebo or no intervention, Outcome 23 All‐cause mortality in trials with a low or high risk of bias.

Comparison 1 Vitamin D versus placebo or no intervention, Outcome 24 All‐cause mortality ('best‐worst case' and 'worst‐best case' scenario).

Comparison 1 Vitamin D versus placebo or no intervention, Outcome 25 Cancer mortality.

Comparison 1 Vitamin D versus placebo or no intervention, Outcome 26 Cancer mortality ('best‐worst case' and 'worst‐best case' scenario).

Comparison 1 Vitamin D versus placebo or no intervention, Outcome 27 Adverse events.
| Vitamin D versus placebo or no intervention for prevention of cancer in adults | ||||||
| Patient or population: healthy participants or recruited among the general population; individuals diagnosed with a specific disease in a stable phase or with vitamin D deficiency Settings: outpatients | ||||||
| Outcomes | Illustrative comparative risks* (95% CI) | Relative effect | No of participants | Quality of the evidence | Comments | |
| Assumed risk | Corresponding risk | |||||
| Control | Vitamin D versus placebo or no intervention | |||||
| Cancer occurrence Follow‐up: 0.5 to 7 years | Study population | RR 1.00 | 50623 | ⊕⊕⊕⊝ moderatea | Trial sequential analysis of all vitamin D trials suggests that the futility area is reached after the 10th trial allowing us to conclude that any possible intervention effect, if any, is lower than a 5% relative risk reduction. | |
| 77 per 1000 | 77 per 1000 | |||||
| Moderate | ||||||
| 28 per 1000 | 28 per 1000 | |||||
| Cancer occurrence in trials using vitamin D₃ (cholecalciferol) Follow‐up: 0.5 to 7 years | Study population | RR 1.00 | 49891 | ⊕⊕⊕⊝ moderatea | Trial sequential analysis of all vitamin D trials suggests that the futility area is reached after the 10th trial allowing us to conclude that any possible intervention effect, if any, is lower than a 5% relative risk reduction. | |
| 77 per 1000 | 77 per 1000 | |||||
| Moderate | ||||||
| 28 per 1000 | 28 per 1000 | |||||
| All‐cause mortality Follow‐up: 0.5 to 7 years | Study population | RR 0.93 | 49866 | ⊕⊕⊝⊝ lowb | Trial sequential analysis of all trials irrespective of bias risks showed that the required information size had not yet been reached and that the cumulative Z‐curve did not cross the trial sequential monitoring boundary for benefit. | |
| 80 per 1000 | 75 per 1000 | |||||
| Moderate | ||||||
| 16 per 1000 | 15 per 1000 | |||||
| Cancer mortality in trials using vitamin D₃(cholecalciferol) Follow‐up: 5 to 7 years | Study population | RR 0.88 | 44492 | ⊕⊕⊝⊝ lowb | Trial sequential analysis of all trials irrespective of bias risks showed that the required information size had not yet been reached and that the cumulative Z‐curve did not cross the trial sequential monitoring boundary for benefit. | |
| 29 per 1000 | 25 per 1000 | |||||
| Moderate | ||||||
| 37 per 1000 | 33 per 1000 | |||||
| Adverse events: nephrolithiasis in trials using vitamin D₃(cholecalciferol) combined with calcium Follow‐up: 0.5 to 7 years | Study population | RR 1.17 | 42753 | ⊕⊕⊝⊝ lowb | Trial sequential analysis of all trials irrespective of bias risks showed that the required information size had not yet been reached and that the cumulative Z‐curve did not cross the trial sequential monitoring boundary for benefit. | |
| 18 per 1000 | 21 per 1000 | |||||
| Moderate | ||||||
| 1 per 1000 | 1 per 1000 | |||||
| Health‐related quality of life | See comment | Not investigated. | ||||
| Health economics | See comment | Not investigated. | ||||
| *The basis for the assumed risk (e.g. the median control group risk across studies) is provided in footnotes. The corresponding risk (and its 95% confidence interval) is based on the assumed risk in the comparison group and the relative effect of the intervention (and its 95% CI). | ||||||
| GRADE Working Group grades of evidence | ||||||
| aDowngraded by one level because of risk of attrition bias bDowngraded by two levels because of risk of attrition bias and imprecision | ||||||
| Characteristic | Intervention(s) and comparator(s) | Screened/eligible | Randomised | ITT | Finishing study | Randomised finishing study |
| (1) Avenell 2012
| I1: vitamin D₃ | 15,024 | 1343 | 1343 | 1813 | 68 |
| I2: vitamin D₃ plus calcium | 1306 | 1306 | ||||
| C1: calcium | 1311 | 1311 | 1762 | 67 | ||
| C2: matched placebo tablets | 1332 | 1332 | ||||
| total: | 5292 | 5292 | 3575 | 68 | ||
| (2) Bolton‐Smith 2007
| I1: vitamin D₃ plus calcium | ‐ | 62 | 62 | 50 | 81 |
| C1: matched placebo | 61 | 61 | 56 | 92 | ||
| total: | 123 | 123 | 106 | 86 | ||
| (3) Brunner 2011
| I1: vitamin D₃ plus calcium | 68,132 | 18,176 | 18,176 | 16,936 | 93 |
| C1: matched placebo | 18,106 | 18,106 | 16,815 | 93 | ||
| total: | 36,282 | 36,282 | 33,751 | 93 | ||
| (4) Daly 2008
| I1: calcium‐vitamin D₃‐fortified milk plus calcium | 422 | 85 | 85 | 76 | 89 |
| C1: usual diet | 82 | 82 | 73 | 89 | ||
| total: | 167 | 167 | 149 | 89 | ||
| (5) Gallagher 2001
| I1: calcitriol | 1905 | 123 | 123 | 101 | 82 |
| C1: matched placebo | 123 | 123 | 112 | 91 | ||
| total: | 246 | 246 | 213 | 87 | ||
| (6) Glendenning 2012
| I1: cholecalciferol | 2110 | 353 | 353 | 331 | 94 |
| C1: placebo vitamin D | 333 | 333 | 307 | 92 | ||
| total: | 686 | 686 | 638 | 93 | ||
| (7) Grady 1991
| I1: calcitriol | 98 | 50 | 50 | 49 | 98 |
| C1: placebo vitamin D | 48 | 48 | 48 | 100 | ||
| total: | 98 | 50 | 97 | 99 | ||
| (8) Janssen 2010
| I1: vitamin D₃ plus calcium | 91 | 36 | 36 | 18 | 50 |
| C1:placebo vitamin D₃ plus calcium | 34 | 34 | 31 | 91 | ||
| total: | 70 | 70 | 49 | 70 | ||
| (9) Komulainen 1999
| I1: vitamin D₃ plus calcium | 13,100 | 116 | 116 | 112 | 97 |
| C1: placebo | 116 | 116 | 115 | 99 | ||
| total: | 232 | 232 | 227 | 98 | ||
| (10) Lappe 2007
| I1: vitamin D₃ plus calcium | 1180 | 446 | 446 | 403 | 90 |
| C1: vitamin D₃ placebo plus calcium | 445 | 445 | 416 | 93 | ||
| C2: vitamin D₃ placebo plus calcium placebo | 288 | 288 | 266 | 92 | ||
| total: | 1179 | 1179 | 1085 | 92 | ||
| (11) Larsen 2012 | I1: vitamin D₃ | 136 | 65 | 65 | 55 | 85 |
| C1: vitamin D placebo | 65 | 65 | 57 | 88 | ||
| total: | 130 | 130 | 112 | 86 | ||
| (12) Murdoch 2012 | I1: vitamin D₃ | 351 | 161 | 161 | 148 | 92 |
| C1: vitamin D placebo | 161 | 161 | 146 | 91 | ||
| total: | 322 | 322 | 294 | 91 | ||
| (13) Ott 1989
| I1: calcitriol plus calcium | ‐ | 43 | 43 | 39 | 91 |
| C1: placebo vitamin D plus calcium | 43 | 43 | 37 | 86 | ||
| total: | 86 | 86 | 76 | 88 | ||
| (14) Prince 2008
| I1: vitamin D₂ plus calcium | 827 | 151 | 151 | 144 | 95 |
| C1: placebo vitamin D plus calcium | 151 | 151 | 145 | 96 | ||
| total: | 302 | 302 | 289 | 95 | ||
| (15) Sanders 2010
| I1: vitamin D₃ | 7204 | 1131 | 1131 | 1015 | 90 |
| C1: vitamin D placebo | 1127 | 1127 | 1017 | 90 | ||
| total: | 2258 | 2258 | 2032 | 90 | ||
| (16) Trivedi 2003
| I1: vitamin D₃ | ‐ | 1345 | 1345 | 1262 | 94 |
| C1:placebo vitamin D | 1341 | 1341 | 1264 | 94 | ||
| total: | 2686 | 2686 | 2526 | 94 | ||
| (17) Witham 2013 | I1: vitamin D₃ | 341 | 80 | 80 | 73 | 91 |
| C1: placebo vitamin D | 79 | 79 | 69 | 87 | ||
| total: | 159 | 159 | 142 | 89 | ||
| (18) Wood 2012 | I1: vitamin D₃ | 424 | 102 | 102 | 84 | 82 |
| I2: vitamin D₃ | 101 | 101 | 90 | 89 | ||
| C1: placebo vitamin D | 102 | 102 | 91 | 89 | ||
| total: | 305 | 305 | 265 | 87 | ||
| Grand total | All interventions | 25,275 | 22,799 | 90 | ||
| All controls | 25,348 | 22,827 | 90 | |||
| All interventions and controls | 50,623 | 45,626 | 90 | |||
| "‐" denotes not reported | ||||||
| Outcome or subgroup title | No. of studies | No. of participants | Statistical method | Effect size |
| 1 Cancer occurrence in trials with a low or high risk of bias Show forest plot | 18 | 50623 | Risk Ratio (M‐H, Random, 95% CI) | 1.00 [0.94, 1.06] |
| 1.1 Trials with low risk of bias | 2 | 2991 | Risk Ratio (M‐H, Random, 95% CI) | 1.08 [0.89, 1.31] |
| 1.2 Trials with high risk of bias | 16 | 47632 | Risk Ratio (M‐H, Random, 95% CI) | 0.99 [0.93, 1.05] |
| 2 Cancer occurrence and risk of for‐profit bias Show forest plot | 18 | 50623 | Risk Ratio (M‐H, Random, 95% CI) | 1.00 [0.94, 1.06] |
| 2.1 Trials without risk of for‐profit bias | 2 | 2991 | Risk Ratio (M‐H, Random, 95% CI) | 1.08 [0.89, 1.31] |
| 2.2 Trials with risk of for‐profit bias | 16 | 47632 | Risk Ratio (M‐H, Random, 95% CI) | 0.99 [0.93, 1.05] |
| 3 Cancer occurrence in primary and secondary prevention trials Show forest plot | 18 | 50623 | Risk Ratio (M‐H, Random, 95% CI) | 1.00 [0.94, 1.06] |
| 3.1 Primary prevention trials | 16 | 50334 | Risk Ratio (M‐H, Random, 95% CI) | 1.00 [0.94, 1.06] |
| 3.2 Secondary prevention trials | 2 | 289 | Risk Ratio (M‐H, Random, 95% CI) | 1.33 [0.26, 6.96] |
| 4 Cancer occurrence and vitamin D status Show forest plot | 18 | 50623 | Risk Ratio (M‐H, Random, 95% CI) | 1.00 [0.94, 1.06] |
| 4.1 Vitamin D insufficiency | 7 | 44668 | Risk Ratio (M‐H, Random, 95% CI) | 0.99 [0.93, 1.05] |
| 4.2 Vitamin D adequacy | 9 | 4544 | Risk Ratio (M‐H, Random, 95% CI) | 1.12 [0.94, 1.34] |
| 4.3 Unknown vitamin status | 2 | 1411 | Risk Ratio (M‐H, Random, 95% CI) | 0.59 [0.33, 1.05] |
| 5 Cancer occurrence ('best‐worst case' and 'worst‐best case' scenario) Show forest plot | 17 | Risk Ratio (M‐H, Random, 95% CI) | Subtotals only | |
| 5.1 'Best‐worst' case scenario | 17 | 49444 | Risk Ratio (M‐H, Random, 95% CI) | 0.41 [0.31, 0.54] |
| 5.2 'Worst‐best' case scenario | 17 | 49444 | Risk Ratio (M‐H, Random, 95% CI) | 2.76 [1.97, 3.86] |
| 6 Cancer occurrence in trials using vitamin D₃ (cholecalciferol) Show forest plot | 14 | 49891 | Risk Ratio (M‐H, Random, 95% CI) | 1.00 [0.94, 1.06] |
| 6.1 Vitamin D₃ trials with low risk of bias | 2 | 2991 | Risk Ratio (M‐H, Random, 95% CI) | 1.08 [0.89, 1.31] |
| 6.2 Vitamin D₃ trials with high risk of bias | 12 | 46900 | Risk Ratio (M‐H, Random, 95% CI) | 0.99 [0.93, 1.05] |
| 7 Cancer occurrence in trials using vitamin D₃ singly or combined with calcium Show forest plot | 14 | 49870 | Risk Ratio (M‐H, Random, 95% CI) | 0.98 [0.92, 1.04] |
| 7.1 Vitamin D₃ singly | 8 | 9200 | Risk Ratio (M‐H, Random, 95% CI) | 1.03 [0.90, 1.17] |
| 7.2 Vitamin D₃ combined with calcium | 7 | 40670 | Risk Ratio (M‐H, Random, 95% CI) | 0.97 [0.91, 1.04] |
| 8 Lung cancer occurrence in trials using vitamin D₃ (cholecalciferol) Show forest plot | 5 | 45509 | Risk Ratio (M‐H, Random, 95% CI) | 0.86 [0.69, 1.07] |
| 9 Breast cancer occurrence in trials using vitamin D₃ (cholecalciferol) Show forest plot | 7 | 43669 | Risk Ratio (M‐H, Random, 95% CI) | 0.97 [0.86, 1.09] |
| 10 Colorectal cancer occurrence in trials using vitamin D₃ (cholecalciferol) Show forest plot | 5 | 45598 | Risk Ratio (M‐H, Random, 95% CI) | 1.11 [0.92, 1.34] |
| 11 Pancreatic cancer occurrence in trials using vitamin D₃ (cholecalciferol) Show forest plot | 2 | 36405 | Risk Ratio (M‐H, Random, 95% CI) | 0.91 [0.57, 1.46] |
| 12 Prostate cancer occurrence in trials using vitamin D₃ (cholecalciferol) Show forest plot | 1 | Risk Ratio (M‐H, Random, 95% CI) | Subtotals only | |
| 13 Uterine cancer occurrence in trials using vitamin D₃ (cholecalciferol) Show forest plot | 1 | Risk Ratio (M‐H, Random, 95% CI) | Subtotals only | |
| 14 Ovarian cancer occurrence in trials using vitamin D₃ (cholecalciferol) Show forest plot | 1 | Risk Ratio (M‐H, Random, 95% CI) | Subtotals only | |
| 15 Oesophageal cancer occurrence in trials using vitamin D₃ (cholecalciferol) Show forest plot | 1 | Risk Ratio (M‐H, Random, 95% CI) | Subtotals only | |
| 16 Stomach cancer occurrence in trials using vitamin D₃ (cholecalciferol) Show forest plot | 1 | Risk Ratio (M‐H, Random, 95% CI) | Subtotals only | |
| 17 Liver cancer occurrence in trials using vitamin D₃ (cholecalciferol) Show forest plot | 1 | Risk Ratio (M‐H, Random, 95% CI) | Subtotals only | |
| 18 Cancer occurrence in trials using vitamin D₂ (ergocalciferol) Show forest plot | 1 | Risk Ratio (M‐H, Random, 95% CI) | Subtotals only | |
| 19 Cancer occurrence in trials using calcitriol Show forest plot | 3 | 430 | Risk Ratio (M‐H, Random, 95% CI) | 1.45 [0.52, 4.06] |
| 20 Breast cancer occurrence in trials using calcitriol Show forest plot | 1 | Risk Ratio (M‐H, Random, 95% CI) | Subtotals only | |
| 21 Uterine cancer occurrence in trials using calcitriol Show forest plot | 1 | Risk Ratio (M‐H, Random, 95% CI) | Subtotals only | |
| 22 Stomach cancer occurrence in trials using calcitriol Show forest plot | 1 | Risk Ratio (M‐H, Random, 95% CI) | Subtotals only | |
| 23 All‐cause mortality in trials with a low or high risk of bias Show forest plot | 15 | 49866 | Risk Ratio (M‐H, Random, 95% CI) | 0.93 [0.88, 0.98] |
| 23.1 Trials with low risk of bias | 1 | 2686 | Risk Ratio (M‐H, Random, 95% CI) | 0.90 [0.77, 1.07] |
| 23.2 Trials with high risk of bias | 14 | 47180 | Risk Ratio (M‐H, Random, 95% CI) | 0.93 [0.88, 0.99] |
| 24 All‐cause mortality ('best‐worst case' and 'worst‐best case' scenario) Show forest plot | 14 | Risk Ratio (M‐H, Random, 95% CI) | Subtotals only | |
| 24.1 'Best‐worst' case scenario | 14 | 48687 | Risk Ratio (M‐H, Random, 95% CI) | 0.43 [0.31, 0.60] |
| 24.2 'Worst‐best' case scenario | 14 | 48687 | Risk Ratio (M‐H, Random, 95% CI) | 2.03 [1.47, 2.80] |
| 25 Cancer mortality Show forest plot | 4 | 44492 | Risk Ratio (M‐H, Random, 95% CI) | 0.88 [0.78, 0.98] |
| 26 Cancer mortality ('best‐worst case' and 'worst‐best case' scenario) Show forest plot | 4 | Risk Ratio (M‐H, Random, 95% CI) | Subtotals only | |
| 26.1 'Best‐worst' case scenario | 4 | 44492 | Risk Ratio (M‐H, Random, 95% CI) | 0.48 [0.33, 0.70] |
| 26.2 'Worst‐best' case scenario | 4 | 44492 | Risk Ratio (M‐H, Random, 95% CI) | 1.69 [1.04, 2.75] |
| 27 Adverse events Show forest plot | 15 | Risk Ratio (M‐H, Random, 95% CI) | Subtotals only | |
| 27.1 Hypercalcaemia in trials using supplemental forms of vitamin D | 4 | 5879 | Risk Ratio (M‐H, Random, 95% CI) | 1.41 [0.64, 3.09] |
| 27.2 Hypercalcaemia in trials using active forms of vitamin D | 2 | 332 | Risk Ratio (M‐H, Random, 95% CI) | 4.03 [0.56, 29.22] |
| 27.3 Nephrolithiasis in trials using vitamin D₃ combined with calcium | 3 | 42753 | Risk Ratio (M‐H, Random, 95% CI) | 1.17 [1.03, 1.34] |
| 27.4 Nephrolithiasis in trials using calcitriol | 1 | 246 | Risk Ratio (M‐H, Random, 95% CI) | 0.33 [0.01, 8.10] |
| 27.5 Hypercalciuria | 1 | 98 | Risk Ratio (M‐H, Random, 95% CI) | 12.49 [0.72, 215.84] |
| 27.6 Renal insufficiency | 3 | 5549 | Risk Ratio (M‐H, Random, 95% CI) | 0.65 [0.23, 1.82] |
| 27.7 Cardiovascular disorders | 8 | 4938 | Risk Ratio (M‐H, Random, 95% CI) | 0.95 [0.86, 1.05] |
| 27.8 Gastrointestinal disorders | 7 | 1624 | Risk Ratio (M‐H, Random, 95% CI) | 1.19 [0.88, 1.59] |
| 27.9 Psychiatric disorders | 2 | 332 | Risk Ratio (M‐H, Random, 95% CI) | 1.42 [0.46, 4.38] |