Regangan untuk rawatan dan pencegahan kejang
Abstract
Background
Contractures are a common complication of neurological and non‐neurological conditions, and are characterised by a reduction in joint mobility. Stretch is widely used for the treatment and prevention of contractures. However, it is not clear whether stretch is effective. This review is an update of the original 2010 version of this review.
Objectives
The aim of this review was to determine the effects of stretch on contractures in people with, or at risk of developing, contractures.The outcomes of interest were joint mobility, quality of life, pain, activity limitations, participation restrictions, spasticity and adverse events.
Search methods
In November 2015 we searched CENTRAL, DARE, HTA; MEDLINE; Embase; CINAHL; SCI‐EXPANDED; PEDro and trials registries.
Selection criteria
We included randomised controlled trials and controlled clinical trials of stretch applied for the purpose of treating or preventing contractures.
Data collection and analysis
Two review authors independently selected trials, extracted data, and assessed risk of bias. The outcomes of interest were joint mobility, quality of life, pain, activity limitations, participation restrictions and adverse events. We evaluated outcomes in the short term (up to one week after the last stretch) and in the long term (more than one week). We expressed effects as mean differences (MD) or standardised mean differences (SMD) with 95% confidence intervals (CI). We conducted meta‐analyses with a random‐effects model. We assessed the quality of the body of evidence for the main outcomes using GRADE.
Main results
Forty‐nine studies with 2135 participants met the inclusion criteria. No study performed stretch for more than seven months. Just over half the studies (51%) were at low risk of selection bias; all studies were at risk of detection bias for self reported outcomes such as pain and at risk of performance bias due to difficulty of blinding the intervention. However, most studies were at low risk of detection bias for objective outcomes including range of motion, and the majority of studies were free from attrition and selective reporting biases. The effect of these biases were unlikely to be important, given that there was little benefit with treatment. There was high‐quality evidence that stretch did not have clinically important short‐term effects on joint mobility in people with neurological conditions (MD 2°; 95% CI 0° to 3°; 26 studies with 699 participants) or non‐neurological conditions (SMD 0.2, 95% CI 0 to 0.3, 19 studies with 925 participants).
In people with neurological conditions, it was uncertain whether stretch had clinically important short‐term effects on pain (SMD 0.2; 95% CI ‐0.1 to 0.5; 5 studies with 174 participants) or activity limitations (SMD 0.2; 95% CI ‐0.1 to 0.5; 8 studies with 247 participants). No trials examined the short‐term effects of stretch on quality of life or participation restrictions in people with neurological conditions. Five studies involving 145 participants reported eight adverse events including skin breakdown, bruising, blisters and pain but it was not possible to statistically analyse these data.
In people with non‐neurological conditions, there was high‐quality evidence that stretch did not have clinically important short‐term effects on pain (SMD ‐0.2, 95% CI ‐0.4 to 0.1; 7 studies with 422 participants) and moderate‐quality evidence that stretch did not have clinically important short‐term effects on quality of life (SMD 0.3, 95% CI ‐0.1 to 0.7; 2 studies with 97 participants). The short‐term effect of stretch on activity limitations (SMD 0.1; 95% CI ‐0.2 to 0.3; 5 studies with 356 participants) and participation restrictions were uncertain (SMD ‐0.2; 95% CI ‐0.6 to 0.1; 2 studies with 192 participants). Nine studies involving 635 participants reported 41 adverse events including numbness, pain, Raynauds’ phenomenon, venous thrombosis, need for manipulation under anaesthesia, wound infections, haematoma, flexion deficits and swelling but it was not possible to statistically analyse these data.
Authors' conclusions
There was high‐quality evidence that stretch did not have clinically important effects on joint mobility in people with or without neurological conditions if performed for less than seven months. Sensitivity analyses indicate results were robust in studies at risk of selection and detection biases in comparison to studies at low risk of bias. Sub‐group analyses also suggest the effect of stretch is consistent in people with different types of neurological or non‐neurological conditions. The effects of stretch performed for periods longer than seven months have not been investigated. There was moderate‐ and high‐quality evidence that stretch did not have clinically important short‐term effects on quality of life or pain in people with non‐neurological conditions, respectively. The short‐term effects of stretch on quality of life and pain in people with neurological conditions, and the short‐term effects of stretch on activity limitations and participation restrictions for people with and without neurological conditions are uncertain.
PICO
Ringkasan bahasa mudah
Adakah regangan berkesan untuk merawat dan mencegah kecacatan sendi?
Soalan ulasan: kami telah mengulas bukti tentang kesan regangan pada orang yang pernah mengalami atau terdedah pada kecacatan sendi.
Latar belakang: kami ingin mengetahui keberkesanan intervensi regangan untuk rawatan dan pencegahan kecacatan sendi (juga dikenali sebagai kejang) pada orang yang mengalami keadaan neurologi dan bukan neurologi. Beberapa keadaan dalam ulasan ini termasuklah pesakit dengan patah tulang, strok, kecederaan otak, artritis atau melecur.
Regangan boleh dilakukan dengan splint dan program penentududukan, atau dengan cast, yang ditukar pada selang masa yang tetap (cast bersiri). Sebagai alternatif, regangan boleh dilakukan sendiri atau diberikan secara manual oleh ahli terapi.
Ciri kajian: ulasan Cochrane ini adalah terkini hingga November 2015. Ia menyertakan keputusan untuk 49 kajian rawak terkawal yang melibatkan 2135 peserta. Para peserta mempunyai keadaan neurologi dan bukan neurologi yang bervariasi termasuk strok, kecederaan otak dan saraf tunjang yang diperolehi, artritis, patah pergelangan tangan dan melecur.
Kajian membandingkan regangan dengan tanpa regangan, selalunya disampaikan dengan penjagaan standard untuk gangguan atau intervensi lain seperti senaman atau suntikan toksin botulinum dalam kes spastik.
Regangan telah dilakukan dalam pelbagai cara yang berbeza termasuk melalui regangan pasif (dilakukan sendiri, dibantu oleh ahli terapi dan dibantu oleh peranti), penentududukan, penggunaan splint, dan cast bersiri.
Dos regangan sangat pelbagai, antara lima minit hingga 24 jam sehari (median 420 minit, IQR 38 hingga 600) untuk antara dua hari dan tujuh bulan (median 35 hari, IQR 23 hingga 84). Jumlah masa kumulatif untuk regangan yang dilakukan adalah antara 23 minit hingga 1456 jam (median 168 jam, IQR 24 hingga 672).
Hasil yang diminati ialah julat pergerakan sendi, spastik, kesakitan, keupayaan untuk bergerak, keupayaan untuk mengambil bahagian dalam kehidupan, kualiti hidup dan kejadian buruk. Kesan jangka pendek (kurang daripada satu minggu) dan jangka panjang (lebih daripada satu minggu) telah disiasat secara berasingan.
Sumber pembiayaan kajian: tiada kajian dibiayai oleh pengeluar ubat atau oleh agensi yang mempunyai kepentingan komersial dalam hasil kajian.
Keputusan utama: kami mendapati kesan jangka pendek berikut setelah satu minggu selepas intervensi regangan terakhir dalam kajian yang dapat membandingkan kesan regangan dengan tanpa regangan:
Pergerakan Sendi (skor tinggi adalah lebih baik)
Keadaan neurologi: regangan meningkatkan pergerakan sendi sebanyak 1% (0% hingga 2% lebih baik) atau 2 ° (0 ° hingga 3 ° )
Keadaan bukan neurologi: regangan memperbaiki pergerakan sendi sebanyak 1% (0% hingga 3% lebih baik)
Kualiti hidup (skor tinggi adalah hasil yang lebih baik)
Keadaan neurologi: tiada kajian
Keadaan bukan neurologi: regangan memperbaiki kualiti hidup sebanyak 1% (0% hingga 3% lebih baik)
Kesakitan (skor rendah adalah lebih baik)
Keadaan neurologi: regangan meningkatkan kesakitan sebanyak 2% (1% hingga 6% lebih teruk)
Keadaan bukan neurologi: regangan mengurangkan kesakitan sebanyak 1% (3% lebih baik hingga 1% lebih teruk)
Had pergerakan (skor tinggi adalah lebih baik)
Keadaan neurologi: regangan memperbaiki kebolehan untuk bergerak sebanyak 1% (0% hingga 2% lebih baik)
Keadaan bukan neurologi: regangan memperbaiki kebolehan untuk bergerak sebanyak 1% (2% lebih teruk hingga 4% lebih baik)
Penglibatan (skor tinggi adalah lebih baik)
Keadaan neurologi: tiada kajian
Keadaan bukan neurologi: regangan mengurangkan penglibatan dalam aktiviti kehidupan sebanyak 12% (31% lebih teruk kepada 6% lebih baik)
Kejadian buruk
Keadaan neurologi dan bukan neurologi: 49 kesan sampingan buruk dilaporkan, termasuklah kerosakan kulit, kesakitan, rasa kebas, trombosis vena, jangkitan luka, hematoma, kekurangan lenturan dan bengkak. Kami tidak dapat mengira risiko kejadian tersebut kerana kesan‐kesan buruk tidak dilaporkan dalam semua kajian, atau tidak dilaporkan untuk kedua‐dua kumpulan rawatan dan kawalan.
Kualiti bukti: terdapat bukti berkualiti tinggi bahawa regangan tidak mempunyai kesan jangka pendek yang penting secara klinikal pada mobiliti sendi pada orang yang mempunyai keadaan neurologi atau bukan neurologi. Terdapat bukti berkualiti tinggi bahawa regangan tidak mempunyai kesan jangka pendek yang penting secara klinikal terhadap kesakitan, dan bukti berkualiti sederhana bahawa regangan tidak mempunyai kesan jangka pendek yang penting secara klinikal terhadap kualiti hidup pada orang yang mempunyai keadaan bukan neurologi.
Kesimpulan: regangan tidak berkesan untuk rawatan dan pencegahan kejang dan tidak mempunyai kesan jangka pendek pada kualiti hidup dan kesakitan pada orang yang mempunyai keadaan bukan neurologi. Kesan jangka pendek dan jangka panjang regangan pada hasil lain bagi orang yang mempunyai keadaan neurologi dan bukan neurologi adalah tidak diketahui.
Authors' conclusions
Summary of findings
| Short‐term effects of stretch for the treatment and prevention of contractures | ||||||
| Patient or population: people with neurological conditions1 | ||||||
| Outcomes | Illustrative comparative risks* (95% CI) | Relative effect | No of participants | Quality of the evidence | Comments, summary statistics, NNTB and absolute risk difference (ARD) | |
| Assumed risk | Corresponding risk | |||||
| Control | Short‐term effects of stretch | |||||
| Joint mobility | Mean joint mobility in the control groups was 10°2 | The mean joint mobility in the intervention groups was 2° higher (0° to 3° higher) | 549 | ⊕⊕⊕⊕ | Absolute change = 1% better (0% to 2% better) Relative change = 2% better (0% to 3% better) | |
| Quality of life | No studies measured quality of life | Not estimable | Not estimable | Not estimable | Not measured | |
| Pain 10‐point VAS | The mean pain in the control group was 0.6 points on a 10‐point VAS4 | This translates to an absolute mean increase of 0.2 higher (‐0.1 to 0.6) points compared with control group on a 10‐point scale.5 | 174 | ⊕⊕⊝⊝ | SMD = 0.2 higher (0.1 lower to 0.5 higher) Absolute change = 2% worse (1% better to 6% worse) Relative change = 55% worse (28% better to 138% worse) | |
| Activity limitations 18‐point upper limb scale | The mean activity limitation in the control group was 0.9 points on an 18‐point upper limb scale7 | This translates to an absolute mean increase of 0.1 (‐0.1 to 0.3) points compared with control group on an 18‐point scale8 | 237 | ⊕⊕⊝⊝ | SMD = 0.2 higher (0.1 lower to 0.5 higher) Absolute change = 1% better (0% to 2% better) Relative change = 38% better (26% worse to 104% better) | |
| Participation restrictions | 1 study measured participation restrictions but it did not provide useable data | Not estimable | Not estimable | Not estimable | Not estimable | |
| Adverse events | Five studies involving 145 participants reported 8 adverse events that may have been related to the intervention. These included skin breakdown, bruising or blisters from plaster casts, and shoulder and wrist pain from stretches applied through positioning | Not estimable | Not estimable | Not estimable | Not estimable | |
| *The assumed risk (e.g. the mean control group risk across studies) is based on one representative study chosen on the basis of its size and susceptibility to bias. The corresponding risk (and its 95% CI) is based on the assumed risk in the comparison group and the relative effect of the intervention (and its 95% CI). | ||||||
| GRADE Working Group grades of evidence | ||||||
| 1 All the studies included in this review and included in the 'Summary of findings' outcomes included people with the following neurological conditions: stroke, Charcot‐Marie‐Tooth disease, acquired brain injury, spinal cord injury and cerebral palsy. The treatment effects were consistent across all types of neurological conditions except acquired brain injury (see Discussion). 2 Post data of the control group in Refshauge 2006 (the corresponding data in Analysis 1.1 is not raw data). 3 The quality of evidence was not downgraded due to risk of bias even though at least some of the included trials had selection, performance, detection, attrition and reporting bias. These types of bias would tend to exaggerate treatment effectiveness. Given this review did not demonstrate treatment effectiveness these forms of bias are probably not important. 4 Post data of the control group in Horsley 2007 (the corresponding data in Analysis 4.1 is not post data). 5 Calculations based on the control group baseline mean (SD) pain: 0.4 (1.1) points on a 0‐10 scale (from Horsley 2007). 6 The quality of the evidence was downgraded due to indirectness and imprecision. The downgrading for indirectness was because the results are only based on studies involving people with stroke and spinal cord injury thereby limiting their generalisability. The downgrading for imprecision was because the 95% CI is wide, particularly when the results are expressed as a relative % change (the 95% CI is narrow when the results are expressed as an absolute risk difference). 7 Post data of the control group in Horsley 2007 (the corresponding data in Analysis 6.1 is not post data). 8 Calculations based on the control group baseline mean (standard deviation) activity limitation: 0.3 (0.6) points on an 18‐point Upper Limb Activity scale (from Horsley 2007). 9 The quality of the evidence was downgraded due to indirectness and imprecision. The downgrading for indirectness was because the results are only based on studies involving people with stroke, cerebral palsy and Charcot‐Marie‐Tooth disease thereby limiting their generalisability. The downgrading for imprecision was because the 95% CI was wide particularly when the results are expressed as a relative % change (the 95% CI is narrow when the results are expressed as an absolute risk difference). | ||||||
| Short‐term effects of stretch for the treatment and prevention of contractures | ||||||
| Patient or population: people with non‐neurological conditions1 | ||||||
| Outcomes | Illustrative comparative risks* (95% CI) | Relative % change | No of Participants | Quality of the evidence | Comments, summary statistics and absolute risk difference | |
| Assumed risk | Corresponding risk | |||||
| Control | Short‐term effects of stretch | |||||
| Joint mobility Range of motion | The mean joint mobility in the control groups was 104°2 | This translates to an absolute mean increase of 1° higher (0° to 2° higher) compared with control group on a 90° scale3 | 865 | ⊕⊕⊕⊕ | SMD = 0.2 higher (0.0 to 0.3 higher) Absolute change = 1% better (0% to 2% better) Relative change = 1% better (0% to 2% better) | |
| Quality of life 160‐point Burn Specific Health Scale‐Brief questionnaire | The mean quality of life in the control group was 128 points on a 160‐point scale6 | This translates to an absolute mean increase of 3 (‐1 to 6) points compared with control group on a 160‐point scale7 | 97 | ⊕⊕⊕⊝ | SMD = 0.3 higher (0.1 lower to 0.7 higher) Absolute change = 2% better (1% worse to 4% better) Relative change = 2% better (1% worse to 5% better) | |
| Pain 10‐point VAS | The mean pain in the control group was 4 points on a 10‐point VAS10 | This translates to an absolute mean decrease of 0.2 (‐0.4 to 0.1) points compared with control group on an 10‐point scale11 | 422 | ⊕⊕⊕⊕ | SMD 0.2 lower (0.4 lower to 0.1 higher) Absolute change = 1% better (3% better to 1% worse) Relative change = 2% better (4% better to 1% worse) | |
| Activity limitations 100‐point Disabilities of the Arm, Shoulder and Hand questionnaire (lower score reflects better outcome) | The mean activity limitation in the control group was 7 points on a 100‐point upper limb scale12 | This translates to an absolute mean increase of 1.2 (‐2.2 to 4.5) points compared with control group on a 100‐point scale13 | 356 | ⊕⊕⊕⊕ | SMD = 0.1 higher (0.2 lower to 0.3 higher) Absolute change = 1% better (2% worse to 4% better) Relative change= 8% better (15% worse to 29% better) | |
| Participation restrictions 100 mm return to usual work activities VAS | The mean participant restriction in the control group was 39 points on a 100‐point VAS for return to work activities14 | This translates to an absolute mean decrease of 11 points (‐30 to 6) points compared with control group on a 100‐point scale15 | 129 | ⊕⊕⊝⊝ | SMD = 0.2 lower (0.6 lower to 0.1 higher) Absolute change = 12% worse (31% worse to 6% better) Relative change = 31% worse (79% worse to 17% better) | |
| Adverse events | Nine studies involving 635 participants reported 41 adverse events that may have been related to the intervention. These included transient numbness (n = 10), pain (n = 1), Raynauds’ phenomenon (n = 4), venous thrombosis (n = 1), need for manipulation under anaesthesia (n = 1), wound infections (n = 10), haematoma (n = 5), flexion deficits (n= 8) and swelling (n = 1). These were predominantly from splints | Not estimable | Not estimable | Not estimable | Not estimable | |
| *The assumed risk (e.g. the mean control group risk across studies) is based on one representative study chosen on the basis of its size and susceptibility to bias. The corresponding risk (and its 95% confidence interval) is based on the assumed risk in the comparison group and the relative effect of the intervention (and its 95% CI). | ||||||
| GRADE Working Group grades of evidence | ||||||
| 1 All the studies included in this review and included in the 'Summary of Findings' outcomes included people with the following non‐neurological conditions: frail elderly and people with ankle fracture, anklylosing spondylitis, oral submucous fibrosis, post‐radiation therapy to the breast, post‐radiation therapy to jaw, progressive systemic sclerosis, total knee replacement, arthritis, Dupuytren's contractures, shoulder adhesive capsulitis/frozen shoulder, hallux limitus, wrist fracture and burns. An additional study included in this review but not included in the 'Summary of Findings' outcomes included people following anterior cruciate ligament reconstruction. The treatment effects were consistent across all types of non‐neurological conditions. 2 Post data of the control group in Moseley 2005 (the corresponding data in Analysis 1.2 is not post data). 3 Calculations based on the control group baseline mean (SD) range of motion: 98.4 (5.5) points on a 90‐degree range of motion measure (from Moseley 2005). 4 The quality of evidence was not downgraded due to risk of bias even though at least some of the included trials had selection, performance, detection, attrition and reporting bias. These types of bias would tend to exaggerate treatment effectiveness. Given this review did not demonstrate treatment effectiveness these forms of bias are probably not important. 5 The quality of the evidence was not downgraded due to indirectness because the results are based on studies involving people with many different types of underlying conditions (e.g. arthritis, frail elderly,ankle fractures). 6 Post data of the control group in Kolmus 2012 (see Analysis 3.1). 7 Calculations based on the control group post mean (SD) quality of life: 123 (9) on the 160‐point Burn Specific Health Scale Brief (no study provided baseline mean (SD) data for quality of life) (from Kolmus 2012). 8 The quality of the evidence was not downgraded due to imprecision because the point estimate is reasonably precise if expressed as relative % change and absolute risk difference. 9 The quality of the evidence was downgraded due to indirectness because the results are based on only two studies involving people with burns and post radiation therapy to the breast thereby limiting their generalisability. 10 Post data of the control group in Paul 2014 (see Analysis 4.1). 11 Calculations based on the control group baseline mean (SD) pain: 8.0 (0.8) on a 10‐point pain scale (from Paul 2014). 12 Post data of the control group in Jerosch‐Herold 2011 (see Analysis 6.2). 13 Calculations based on the control group baseline mean (SD) activity limitation: 15.4 (13.2) on a 100‐point scale (from Jerosch‐Herold 2011). 14 Post data of the control group in Moseley 2005 (see Analysis 8.1). 15 Calculations based on the control group baseline mean (SD) participation restriction: 39.0 (54.1) on a 100‐point scale (from Moseley 2005). 16 The quality of the evidence was downgraded due to indirectness because the results are based on only two studies involving people with ankle and wrist fracture thereby limiting their generalisability. | ||||||
Background
Description of the condition
Contractures are common in people with neurological conditions including stroke, spinal cord injury, acquired brain injury and cerebral palsy (Diong 2012; Fergusson 2007; Kwah 2012). They are also common in people with non‐neurological conditions associated with various musculoskeletal conditions and diseases including rheumatoid arthritis, surgery and burns (Fergusson 2007). Contractures are characterised by a reduction in joint range of motion or an increase in resistance to passive joint movement (Fergusson 2007; Fox 2000), both limiting joint mobility.
The causes of contractures are not well known. However, it is generally agreed that contractures are due to both neurally and non‐neurally mediated factors (Lieber 2004). Neurally mediated factors refer to spasticity which directly limits the extensibility of the muscle‐tendon unit. Spasticity is only present in people with neurological conditions and hence is only relevant in these individuals. In contrast, non‐neurally mediated factors can play a role in the development of contractures in people with all types of conditions. The term is used to refer to structural changes in the muscle‐tendon unit and other soft tissue structures overlying joints which together limit joint mobility. Debate exists over the relative contribution of different soft tissue structures to non‐neurally mediated contractures. Some animal studies indicate the importance of muscle fibre length (Tabary 1972; Williams 1978) while other studies suggest that muscle tendons may also play a role (Herbert 1997). Whilst the exact causes of contractures remain an area of debate, the deleterious consequences of contractures are clear. They interfere with activities of daily living and can cause pain, sleep disturbances and pressure ulcers (Harvey 2002; Clavet 2015; Scott 1981). They can also result in unsightly deformities and increase burden of care (Fergusson 2007; Harvey 2002). For these reasons considerable time and therapeutic resources are directed at treating and preventing contractures.
Description of the intervention
Stretch is widely used for the treatment and prevention of contractures. The aim of stretch is to maintain or increase joint mobility by influencing the extensibility of soft tissues spanning joints. Stretch can be administered with splints and positioning programmes, or with casts which are changed at regular intervals (serial casts). Alternatively, stretch can be self‐administered or applied manually by therapists (for over 100 examples of techniques used to administer stretches see www.physiotherapyexercises.com). All techniques involve the mechanical elongation of soft tissues for varying periods of time. Some techniques can only be applied for short periods of time. For example, it is difficult for therapists to apply stretches through their hands for more than a few minutes. Other techniques, such as positioning, provide a way of administering stretch for sustained periods of time. Splints or serial casts are used to provide stretch for even longer periods and are sometimes used to provide uninterrupted stretch for many days or even weeks.
How the intervention might work
To understand how stretch might work it is important to highlight the difference between the transient and lasting effects of stretch. The transient effects of stretch have been extensively examined in animals and humans, with and without contractures. Animal studies have shown immediate increases in the length of soft tissues with stretch (Taylor 1990). Human studies have demonstrated similar findings, with immediate increases in joint range of motion and decreases in resistance to passive joint movement (Bohannon 1984; Duong 2001; Magnusson 1995; Magnusson 1996a; Magnusson 1996b). This phenomenon is termed viscous deformation (Magnusson 1995; Weppler 2010). Importantly, the effects of viscous deformation only last briefly once the stretch is removed (Duong 2001; Magnusson 1996b).
The lasting effects of stretch are more important than any transient effects for the treatment and prevention of contractures. Unfortunately, the mechanisms underlying any possible lasting effects of stretch are less understood. Current knowledge is based on animal studies which indicate that soft tissues undergo structural adaptations in response to regular and intensive stretch (Goldspink 1974; Tabary 1972). These studies have primarily examined the effect of stretch on sarcomeres, the basic units of muscle. For example, studies on animal muscles have shown that four weeks of sustained stretch increases the number of muscle sarcomeres that are in series (Tabary 1972), with sarcomere numbers returning to normal four weeks after the last stretch (Goldspink 1974). Further animal studies have also suggested that only 30 minutes of stretch per day is required to prevent loss of sarcomeres in series (Williams 1990). Thus it would appear that animal muscles are highly adaptable in response to stretch.
On one level the results of animal studies appear to be consistent with observations in humans, suggesting that stretch induces lasting changes in joint range of motion and soft tissue extensibility. For example, the extreme extensibility of yoga enthusiasts and ballerinas is often attributed to the intensive stretch routines performed by these individuals. Furthermore, a large number of human studies (many non‐randomised) also indicate that stretch increases joint range of motion and soft tissue extensibility (Decoster 2005; Leong 2002). However, these observations and results are not based on high‐quality evidence and in some cases any apparent effects may be solely due to poor terminology (Weppler 2010). Consequently, there is uncertainty and controversy about the effectiveness of stretch for the treatment and prevention of contractures in clinical populations.
While contractures are associated with a variety of different conditions, there is no reason to believe that the effectiveness of stretch is determined by the underlying condition. However, the effectiveness of stretch may be influenced by involvement of the nervous system. For this reason, we have divided this review into two, namely the effectiveness of stretch for neurological and non‐neurological conditions.
Why it is important to do this review
A large amount of healthcare resources are allocated to the administration of stretch for the treatment and prevention of contractures. A systematic review is required to determine what is known of the effects of this intervention. It is hoped that the results of this systematic review will guide clinical practice and future research.
Objectives
The aim of this review was to determine the effects of stretch on contractures in people with, or at risk of developing, contractures.The outcomes of interest were joint mobility, quality of life, pain, activity limitations, participation restrictions, spasticity and adverse events.
Methods
Criteria for considering studies for this review
Types of studies
We included published and unpublished randomised controlled trials (RCTs) and controlled clinical trials (CCTs). We included studies regardless of language. Studies that used parallel‐group designs, within‐subject designs or cross‐over designs were all included.
Types of participants
Participants could be of any age or either gender provided they had existing contractures or were at risk of developing contractures. Participants were deemed to be at risk of developing contractures based on the clinical judgement of the Review authors, or if they had one or more of the following conditions:
-
neurological conditions (e.g. stroke, multiple sclerosis, spinal cord injury, acquired brain injury, Guillain Barré syndrome, Parkinson's disease);
-
advanced age (e.g. frailty);
-
a history of trauma or surgery (e.g. burns, joint replacement surgery);
-
underlying joint or muscle pathology and disease processes (e.g. inflammatory arthritis, osteoarthritis).
We separated participants according to their diagnoses, and then categorised them as having either a neurological or non‐neurological condition.
Types of interventions
Interventions
We included any stretch intervention that aimed to maintain or increase the mobility of any synovial joint. To be included, the stretch needed to sustain the soft tissues in a lengthened position for a minimum of 20 seconds on more than one occasion. This was considered to be the minimum plausible period of stretch that was likely to affect joint mobility. Examples of stretch interventions that were eligible, based on these criteria, were sustained passive stretching, positioning, splinting and serial casting.
We excluded interventions that were described as moving joints throughout range (that is, where the soft tissues were not sustained in a lengthened position). Examples of interventions that were excluded, based on this criterion, were joint mobilisation, joint manipulation, continuous passive motion, passive movements and active movements.
Comparisons
We included all studies that allowed the effects of stretch to be isolated. We included studies if they compared:
-
stretch versus no stretch;
-
stretch versus placebo or sham stretch;
-
stretch plus co‐intervention versus co‐intervention. We accepted all co‐interventions provided they were applied in the same manner to both the treatment and control groups.
To reduce the complexity of the review we excluded studies that compared the effectiveness of competing interventions. Therefore, we excluded studies if they compared:
-
stretch versus another stretch;
-
stretch versus another active intervention.
Types of outcome measures
Outcomes included measures of impairment, activity limitations and participation restrictions. To be included in this review studies needed to have measured joint mobility, the primary focus of this review. This focus is justified because joint mobility is the key outcome used to deem the success of stretch interventions. Without a change in joint mobility there is no known mechanism for changes in activity limitations or participation restrictions.
Major outcomes
The major outcomes of interest were joint mobility, quality of life, pain (for example, visual analogue scale, Huskisson 1974), activity limitations (for example, Functional Independence Measure, Keith 1987; or Motor Assessment Scale, Carr 1985), participation restrictions (for example, return to work), and adverse events.
All measures of joint mobility were accepted. Some of the more commonly used measures of joint mobility were:
-
active joint range of motion (expressed in degrees);
-
passive joint range of motion (expressed in degrees); and
-
passive joint stiffness (expressed in degrees per unit of torque).
Both uni‐directional measures of joint range of motion (for example, maximal ankle dorsiflexion) and bi‐directional measures of joint range of motion (for example, arc of movement between maximal ankle dorsiflexion and maximal ankle plantarflexion) were eligible for inclusion. Data were expressed in millimetres in studies that used linear measures to reflect range of motion (for example, tests of combined hip and knee range of motion reflected by finger‐tip to floor distance).
Quality of life provides a holistic measure of the effectiveness of stretch. There may be people with contractures whose quality of life does not improve even with improvements in joint mobility. Therefore, we also selected quality of life as a major outcome. Examples of commonly used quality‐of‐life measures include:
-
Short Form 36 (Ware 1992); and
-
Assessment of Quality of Life (Hawthorne 1999; Hawthorne 2001).
Minor outcome
A minor outcome of interest was spasticity which was only relevant for people with neurological conditions (for example, Tardieu scale, Tardieu 1954; or modified Ashworth scale, Bohannon 1987).
Timing of outcome assessment
Outcomes could be measured at any time following intervention. We grouped outcomes into two main categories which were classified according to the time after which the stretch intervention was ceased:
-
short‐term effects following stretch (outcomes measured up to one week after the last stretch ceased);
-
long‐term effects following stretch (outcomes measured more than one week after the last stretch ceased).
If studies collected data at multiple points within one of the pre‐determined time periods then we used data collected at the latest time.
Adverse outcomes
We classified adverse outcomes into the following groups: muscle tears, joint subluxation or dislocation, heterotopic ossification, pain or other adverse outcome. We contacted study authors for incomplete reporting of adverse events and losses to follow‐up where possible. We asked them to explain why participants withdrew.
Search methods for identification of studies
Electronic searches
We conducted electronic searches to identify potential studies. There was no language restriction applied to any component of the search strategies. We searched the following electronic databases (see appendices for details):
-
Cochrane Central Register of Controlled Trials (CENTRAL), The Database of Abstracts of Reviews of Effects (DARE) and The Health Technology Assessment Database (HTA) (The Cochrane Library 2015, Issue 11), (Appendix 1);
-
MEDLINE (Ovid) (1950 to 19 November 2015), (Appendix 2);
-
Embase (Ovid) (1980 to 19 November 2015), (Appendix 3);
-
CINAHL (Ovid) (1982 to 19 November 2015), (Appendix 4);
-
SCI‐EXPANDED (ISI Web of Knowledge) (1900 to 19 November 2015), (Appendix 5);
-
PEDro (www.pedro.org.au), (inception to 19 November 2015), (Appendix 6).
Searching other resources
The electronic searches were complemented with a search of the reference lists of included studies and relevant systematic reviews. We also used forward citation tracking of included studies to search for additional studies using the ISI Web of Knowledge. We contacted authors of included studies for additional studies and unpublished data.
We also searched the World Health Organization International Clinical Trials Registry Platform (www.who.int/trialsearch) and clinicaltrials.gov/ to identify unpublished and ongoing trials.
Data collection and analysis
Selection of studies
Two review authors independently screened the titles and abstracts of the search output to identify potentially relevant studies. We retrieved full‐length reports of all potentially relevant studies and re‐examined them to ensure that they met the inclusion criteria. The two review authors resolved any disagreements by discussion and, when necessary, a third author arbitrated.
Data extraction and management
Two review authors independently extracted data from the included studies using pre‐constructed data extraction forms. They extracted the following data:
-
study design, inclusion criteria and exclusion criteria;
-
characteristics of the participants including the type of health condition, number of participants, age, gender, and whether participants were at risk of developing contracture or had existing contracture, or a combination of the two;
-
characteristics of the intervention and comparison including details of treatment and control interventions, duration of intervention, frequency of intervention, intensity of intervention, details of co‐interventions, compliance with treatment and treated joint;
-
details of the primary and secondary outcomes:
-
methods used to measure joint mobility,
-
time between last stretch and outcome measurement,
-
mean scores and standard deviations of outcomes for each treatment group,
-
direction of effect for each outcome; and
-
-
adverse events.
We standardised the direction of effect for each outcome between studies, with the direction of effect selected for each outcome as follows.
-
Joint mobility: positive between‐group difference favoured stretch.
-
Quality of life: positive between‐group difference favoured stretch.
-
Pain: negative between‐group difference favoured stretch.
-
Spasticity: negative between‐group difference favoured stretch.
-
Activity limitations: positive between‐group difference favoured stretch.
-
Participation restrictions: positive between‐group difference favoured stretch.
If outcomes were only reported graphically, we estimated means and standard deviations from the graphs. We extracted ANCOVA‐adjusted between‐group means and standard deviations in preference to change scores. However, if neither were provided, we used post‐intervention scores.
If studies reported data as medians and inter‐quartile ranges, we extracted medians and estimated standard deviations as 80% of the interquartile range.
We extracted torque‐controlled measures of joint mobility in preference to all other joint mobility measures. If the studies did not report torque‐controlled measures, next in order of preference were passive joint mobility measures. If passive joint mobility measures were not reported, we extracted active joint mobility measures.
Differences in the data extracted by the two review authors were resolved by discussion and, when necessary, arbitrated by a third author. Review authors did not extract data on studies in which they had been involved; data from these studies were extracted by other authors.
Assessment of risk of bias in included studies
Two review authors independently assessed the risk of bias of the included studies. As recommended in Chapter 8 of the Cochrane Handbook for Systematic Reviews of Interventions ((Higgins 2011), we assessed the following methodological domains:
-
sequence generation;
-
allocation sequence concealment;
-
blinding of participants and therapists;
-
blinding of outcome assessors for objective outcomes;
-
blinding of outcome assessors for self‐report outcomes;
-
incomplete outcome data;
-
selective outcome reporting; and
-
other potential threats to validity.
We judged these domains explicitly using the following criteria: 'Yes' = low risk of bias; 'No' = high risk of bias; 'Unclear' = either lack of information or uncertainty over the potential for bias. When studies reported incomplete data in more than 15% of participants, we deemed them to have high risk of bias from incomplete outcome data.
We resolved disagreements in quality ratings by discussion or, when necessary, a third author arbitrated. Review authors did not evaluate the risk of bias of studies in which they were involved; these studies were evaluated by other authors.
Measures of treatment effect
No dichotomous outcomes were reported. For continuous outcomes we reported the mean differences for each study to provide a summary estimate of the effectiveness of stretch. For continuous outcomes with the same units, we expressed effects as mean differences (MD) and 95% confidence intervals (CI). For continuous outcomes with different units, we expressed effects as standardised mean differences (SMD) and 95% CI. SMD was back‐translated to a typical scale (e.g. 0 to 10 for pain) by multiplying the SMD by a typical among‐person standard deviation (e.g. the standard deviation of the control group at baseline from the most representative trial) (as per Chapter 12 of the Cochrane Handbook for Systematic Reviews of Interventions (Schünemann 2011).
In the 'Effects of intervention' results section and the 'Comments' column of the 'Summary of findings' table, we have reported the absolute percent difference, the relative percent change from baseline, and the number needed to treat for an additional beneficial outcome (NNTB) (we provided the NNTB only for the short‐term effect of joint mobility in people with neurological conditions because this was the sole outcome with a statistically significant difference). We calculated the NNTB for joint mobility using the Wells calculator (available at the Cochrane Musculoskeletal editorial office) using a minimally clinically important difference of 5°. We calculated the absolute benefit as the improvement in the intervention group minus the improvement in the control group, in the original units, expressed as a percentage. We calculated the relative difference in the change from baseline as the absolute benefit divided by the baseline mean of the control group, expressed as a percentage.
Unit of analysis issues
Cross‐over studies
We analysed cross‐over studies using combined data from all study periods (Fox 2000, McNee 2007; Moseley 1997; Refshauge 2006). We back‐calculated the between‐group standard deviations from the presented data using the method described by Fleiss 1993. Using combined data yields more accurate weighting for cross‐over studies in meta‐analyses than using first period data only (Curtin 2002).
Studies with multiple treatment groups
In studies with more than two treatment groups, we only extracted data from the two groups with the most different interventions.
Studies with multiple measures for the same joint
In studies with multiple measures for the same joint, we only extracted data for the measure deemed most likely to reflect a beneficial effect of stretch. For example, we used the data reflecting shoulder rotation in studies that applied an aggressive stretch for shoulder rotation but only a mild stretch for shoulder flexion.
Studies with measures on different joints
In studies where the effects of stretch were measured across different joints, we only extracted data for the measure deemed most likely to reflect a beneficial effect of stretch. For example, in studies where the stretch involved shoulder, elbow and wrist positioning, we only extracted one set of data for the joint that was deemed most likely to respond to the stretch. Also, in instances where data were reported for both right and left sides, we always extracted the right side data in preference to the left side.
Dealing with missing data
We contacted authors of included studies when there was incomplete reporting of data. When authors of included studies were unable to provide additional data we included all available data in the review. Where possible, all analyses were performed on an intention‐to‐treat basis.
Assessment of heterogeneity
When there were at least two clinically homogeneous studies (studies that investigated the effect of similar interventions on similar populations and reported similar outcomes) we considered meta‐analysis. In such circumstances we used the I2 statistic to quantify the heterogeneity of outcomes and to inform decisions about whether to pool data (Higgins 2003). Where heterogeneity was substantial (I2 > 50%), we explored the possible causes of heterogeneity in sensitivity analyses, in which individual studies were omitted one at a time or stratified by particular characteristics or, where appropriate, with meta‐regression (Deeks 2011).
Assessment of reporting biases
We used funnel plots to examine the possibility of small sample bias in the estimates of the short‐term effects of stretch on joint mobility for people with neurological and non‐neurological conditions.
Data synthesis
We used a random‐effects model to conduct meta‐analyses and analysed data using Review Manager 5.3 (RevMan) (RevMan 2014). We explored the effect of stretch on the subgroups outlined below using random‐effects meta‐regression (see 'Subgroup analyses'). We used the user‐written 'metareg routine' in the Stata Statistical Software package for this purpose.
GRADE and 'Summary of findings' tables
We compiled two 'Summary of findings' tables using GRADEpro software (GRADEpro GDT 2015); one for neurological and the other for non‐neurological conditions. Both summarised the short‐term effects of stretch on the following outcomes: joint mobility, quality of life, pain, activity limitations, participant restrictions and adverse events.
We reported the NNTB or the NNTH, absolute and relative per cent change in the Comments column of the 'Summary of Findings' table as described in the Measures of treatment effect section above. We also reported if the pooled result ruled out a clinically important treatment effect based on the 95% CI. The clinically important treatment effect for joint mobility and pain was 5° and 2 points (on a 10‐point visual analogue scale), respectively. We did not articulate clinically important treatment effects for other outcomes but instead used clinical reasoning after considering the absolute and relative changes.
We used the GRADE approach to evaluate the quality of the evidence (GRADE Working Group 2004; Guyatt 2008a;Guyatt 2008b; Schünemann 2011). The GRADE approach specifies four levels of quality:
-
high‐quality, randomised trials or double‐upgraded observational studies;
-
medium‐quality, downgraded randomised trials or upgraded observational studies;
-
low‐quality, double‐downgraded randomised trials or observational studies; and
-
very low‐quality, triple‐downgraded randomised trials, downgraded observational studies or case series or case reports.
The quality of evidence was downgraded if:
-
there were limitations in the design and implementation of available studies, suggesting high likelihood of bias;
-
there was indirectness of evidence (indirect population, intervention, control, outcomes);
-
there was unexplained heterogeneity or inconsistency of results (including problems with subgroup analyses);
-
there was imprecision of results (wide confidence intervals); and
-
there was a high probability of publication bias.
Subgroup analysis and investigation of heterogeneity
We conducted planned subgroup analyses to determine the following effects on joint mobility for people with neurological and non‐neurological conditions:
-
compare the short‐term effects following stretch (i.e. effects present less than one week after the last stretch was ceased) with the long‐term effects following stretch (i.e. effect present more than one week after the last stretch was ceased);
-
compare the effects of stretch administered to different populations (i.e. the effects of stretch administered to people with stroke versus spinal cord injury versus acquired brain injury versus cerebral palsy, etc.);
-
determine the effects of different stretch dosages (i.e. total stretch time);
-
determine the effects of different stretch interventions (i.e. the effects of stretch administered manually by therapists versus the effects of self‐administered stretch versus the effects of stretch administered with positioning programmes versus the effects of stretch administered with plaster casts versus the effects of stretch administered with splints);
-
determine the effects of stretch when administered to large joints (e.g. shoulder, elbow, hip and knee) versus small joints (e.g. wrist, ankle, hand and foot);
-
determine the effects of stretch when outcomes could be influenced by participants' perceptions of discomfort (e.g. measures of active range of motion, measures of passive range of motion with a non‐standardised measurement torque) versus when outcomes could not be influenced by participants' perceptions of discomfort (e.g. studies involving unconscious or insensate people, measurements taken with a standardised torque) (Harvey 2002; Weppler 2010);
-
determine the effects of stretch administered for the treatment of contractures versus the effects of stretch administered for the prevention of contractures; and
-
determine the effects of stretch when measurements were taken less than one day after the last stretch versus when measurements were taken more than one day after the last stretch.
We used the formal test for subgroup interactions in RevMan 2014 to aid in the interpretation of subgroup analyses. We compared the magnitude of the effects between the subgroups by assessing the overlap of the CIs of the summary estimates. CIs that did not overlap indicated statistical significance.
Sensitivity analysis
To examine the robustness of the findings to potential selection, detection and attrition biases, we conducted sensitivity analyses. The sensitivity analyses examined the effects on joint mobility of randomisation (adequate versus inadequate sequence generation), allocation concealment (concealed versus non‐concealed allocation), blinding of assessors (blinding versus no blinding) and completeness of outcome data (complete versus incomplete outcome data available).
Results
Description of studies
Results of the search
The electronic searches, citation tracking and reference list searches produced 5048 references. After screening titles and abstracts, we identified 135 studies as potentially eligible. After inspecting the full reports, we included 49 studies, with four studies awaiting classification and one study ongoing (see Figure 1). We excluded 86 studies and have summarised the reasons for exclusion in the Characteristics of excluded studies table.

Study flow diagram
1. These numbers are approximate only
Included studies
We included 49 studies with a total of 2135 participants.
Twenty‐eight studies with a total of 898 participants investigated the effects of stretch in people with neurological conditions (Ackman 2005; Ada 2005; Basaran 2012; Ben 2005; Burge 2008; Copley 2013; Crowe 2000; De Jong 2006; Dean 2000; DiPasquale‐Lehnerz 1994; Gustafsson 2006; Harvey 2000; Harvey 2003; Harvey 2006; Hill 1994; Horsley 2007; Hyde 2000; Krumlinde‐Sundholm 2011; Lai 2009; Lannin 2003a; Lannin 2007a; Law 1991; McNee 2007; Moseley 1997; Refshauge 2006; Rose 2010; Sheehan 2006; Turton 2005) and included people with stroke, spinal cord injury, acquired brain injury, cerebral palsy, Charcot‐Marie‐Tooth disease and Duchenne muscular dystrophy. One study recruited people with spinal cord injury, acquired brain injury and stroke (Harvey 2006). In this study, participants were separated according to their diagnoses.
Twenty‐one studies with a total of 1237 participants investigated the effects of stretch in people with non‐neurological conditions (Aoki 2009; Buchbinder 1993; Bulstrode 1987; Collis 2013; Cox 2009; Fox 2000; Horton 2002; Hussein 2015; Jang 2015; Jerosch‐Herold 2011; John 2011; Jongs 2012; Kemler 2012; Kolmus 2012; Lee 2007; Melegati 2003; Moseley 2005; Paul 2014; Seeger 1987; Steffen 1995; Zenios 2002) and included people with osteoarthritis, Dupuytren's contractures, frozen shoulder, knee replacement surgery, wrist fracture, ankle fracture, hallux limitus, anterior cruciate reconstruction surgery, ankle fracture, ankylosing spondylitis, radiotherapy for breast cancer, burns, radiotherapy to the jaw, systemic sclerosis and frailty.
The following types of stretch were administered in all studies: passive stretching (self‐administered, therapist‐administered and device‐administered), positioning, splinting and serial casting. The stretch dosage was highly variable, ranging from five minutes to 24 hours per day (median 420 minutes, IQR 38 to 600) for between two days and seven months (median 35 days, IQR 23 to 84). The total cumulative time that stretch was administered ranged from 23 minutes to 1456 hours (median 168 hours, IQR 24 to 672).
All included studies reported joint mobility, while only three studies reported quality of life (Buchbinder 1993; Kolmus 2012; Lee 2007). Eighteen studies reported pain (Ada 2005; Aoki 2009; Buchbinder 1993; Burge 2008; Cox 2009; Crowe 2000; De Jong 2006; Dean 2000; Fox 2000; Gustafsson 2006; Horsley 2007; Hussein 2015; Kemler 2012; Lannin 2003a; Lannin 2007a; Lee 2007; Moseley 2005; Paul 2014) and eight studies reported spasticity (Ackman 2005; Basaran 2012; Burge 2008; Copley 2013; De Jong 2006; Hill 1994; Lai 2009; Lannin 2007a). Activity limitations were reported in 21 studies (Ada 2005; Aoki 2009; Collis 2013; Crowe 2000; De Jong 2006; DiPasquale‐Lehnerz 1994; Gustafsson 2006; Hill 1994; Horsley 2007; Hussein 2015; Hyde 2000; Jerosch‐Herold 2011; Jongs 2012; Kolmus 2012; Lannin 2003a; Lannin 2007a; Law 1991; McNee 2007; Moseley 2005; Paul 2014; Rose 2010) and three studies reported participation restrictions (Harvey 2006; Jongs 2012; Moseley 2005).
Forty‐five studies investigated the short‐term effects following stretch (that is, outcomes were measured less than one week after the last stretch was ceased) (Ada 2005; Aoki 2009; Basaran 2012; Ben 2005;, Buchbinder 1993; Bulstrode 1987; Burge 2008; Collis 2013; Copley 2013; Cox 2009; Crowe 2000; De Jong 2006; Dean 2000; DiPasquale‐Lehnerz 1994; Fox 2000; Gustafsson 2006; Harvey 2000; Harvey 2003; Harvey 2006; Hill 1994; Horsley 2007; Horton 2002; Hussein 2015; Hyde 2000; Jang 2015; Jerosch‐Herold 2011; John 2011; Jongs 2012; Kemler 2012; Kolmus 2012; Krumlinde‐Sundholm 2011; Lai 2009; Lannin 2003a; Lannin 2007a; Law 1991; Lee 2007; Moseley 1997; Moseley 2005; Paul 2014; Refshauge 2006; Rose 2010; Seeger 1987; Sheehan 2006; Steffen 1995; Turton 2005). Eighteen studies investigated the long‐term effects following stretch (that is, outcomes were measured more than one week after the last stretch was ceased) (Ackman 2005; Bulstrode 1987; Copley 2013; Gustafsson 2006; Harvey 2000; Horsley 2007; Horton 2002; Hussein 2015; Jerosch‐Herold 2011; Jongs 2012; Kemler 2012; Lannin 2003a; Lannin 2007a; Law 1991; McNee 2007; Melegati 2003; Moseley 2005; Zenios 2002).
Five studies (DiPasquale‐Lehnerz 1994; Hill 1994; Hyde 2000; Krumlinde‐Sundholm 2011; Sheehan 2006) did not provide any useable data for any of the analyses and are described qualitatively in Characteristics of included studies. Characteristics of all other included studies are also detailed in the 'Characteristics of included studies' tables.
Excluded studies
We excluded 86 studies (for reasons see Characteristics of excluded studies).
Risk of bias in included studies
The risk of bias in the 49 included studies was variable. We have summarised results in Figure 2, with further details about the risk of bias in the included studies reported in the Characteristics of included studies tables.
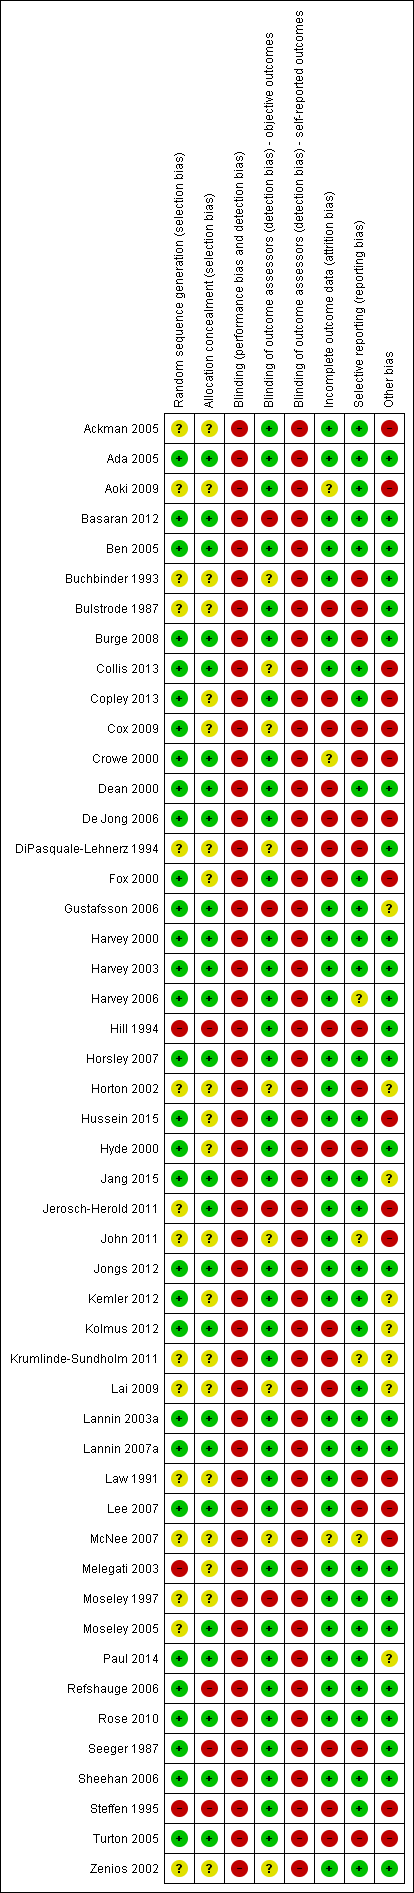
Methodological quality summary: review authors' judgements about each methodological quality item for each included study
Allocation
Thiry‐one studies (63%) used adequate methods for generating the randomisation sequence whilst 25 studies (51%) used adequate methods to conceal allocation (see Figure 2 and 'Characteristics of included studies' tables).
Blinding
Blinding of participants and therapists was not possible in any of the studies due to the nature of the intervention. Thirty‐six studies (73%) blinded assessors of objective outcomes to group allocation (see Figure 2 and 'Characteristics of included studies' tables).
Incomplete outcome data
Thirty‐one studies (63%) were free of selective outcome reporting (see Figure 2 and 'Characteristics of included studies' tables).
Selective reporting
Thirty‐one studies (63%) had complete outcome data (see Figure 2 and 'Characteristics of included studies' tables).
Other potential sources of bias
Twenty‐six studies (53%) were free of other bias (see Figure 2 and 'Characteristics of included studies' tables).
Effects of interventions
See: Summary of findings for the main comparison Short‐term effects of stretch for the treatment and prevention of contractures in people with neurological conditions; Summary of findings 2 Short‐term effects of stretch for the treatment and prevention of contractures in people with non‐neurological conditions
The included studies all compared stretch plus co‐intervention versus co‐intervention. Co‐interventions included usual care, botulinum toxin, passive stretches, exercise and therapy. The studies applied the co‐interventions in the same manner to both groups.
All but four studies measured joint mobility in degrees (Buchbinder 1993; Cox 2009; Melegati 2003; Sheehan 2006). All four studies involved people with non‐neurological conditions and hence we expressed the short‐ and long‐term effects of stretch for non‐neurological conditions as standardised mean difference (SMD). Quality of life, spasticity, activity limitations and participation restrictions were measured using various scales and therefore we expressed results as SMDs and back‐translated them to a common scale. The exception was pain. In some analyses, pain was uniformly measured using the 100 mm visual analogue scale. We therefore expressed results for these analyses as mean differences (MD). When only one study was included in an analysis, we reported the results as MDs using the scales of the study.
Where sufficient data were available we included all studies in analyses; that is, where means and standard deviations could be extracted or estimated. All analyses were initially restricted to each sub‐group of participants, however, there were no statistically significant differences between sub‐groups within the neurological or non‐neurological conditions for any outcome. Therefore we pooled the results across the sub‐groups within neurological and non‐neurological condition (see Analysis 1.1 to Analysis 9.1).
We evaluated the quality of evidence using the GRADE approach for the short‐term effect of stretch on joint mobility, quality of life, pain, activity limitations, participation restrictions and adverse events for neurological conditions (see summary of findings Table for the main comparison) and non‐neurological conditions (see summary of findings Table 2). The results of all analyses are reported below.
Joint mobility
Short‐term effects following stretch
Neurological conditions
Twenty‐six studies with a total of 699 participants investigated the short‐term effects on joint mobility following stretch in people with neurological conditions (Ada 2005; Basaran 2012; Ben 2005; Burge 2008; Copley 2013; Crowe 2000; De Jong 2006; Dean 2000; DiPasquale‐Lehnerz 1994; Gustafsson 2006; Harvey 2000; Harvey 2003; Harvey 2006; Hill 1994; Horsley 2007; Hyde 2000; Krumlinde‐Sundholm 2011; Lai 2009; Lannin 2003a; Lannin 2007a; Law 1991; Moseley 1997; Refshauge 2006; Rose 2010; Sheehan 2006; Turton 2005). Eighteen studies with a total of 549 participants provided sufficient data (Ada 2005; Basaran 2012; Ben 2005; Copley 2013; De Jong 2006; Dean 2000; Gustafsson 2006; Harvey 2000; Harvey 2003; Harvey 2006; Horsley 2007; Lai 2009; Lannin 2003a; Lannin 2007a; Moseley 1997; Refshauge 2006; Rose 2010; Turton 2005). The participants included people with stroke, Charcot‐Marie‐Tooth disease, acquired brain injury and spinal cord injury. The mean difference (MD) was 2° (95% CI 0° to 3°; I2 = 37%; P = 0.009) (see Analysis 1.1; Figure 3; summary of findings Table for the main comparison). The GRADE quality of evidence for this result was high.
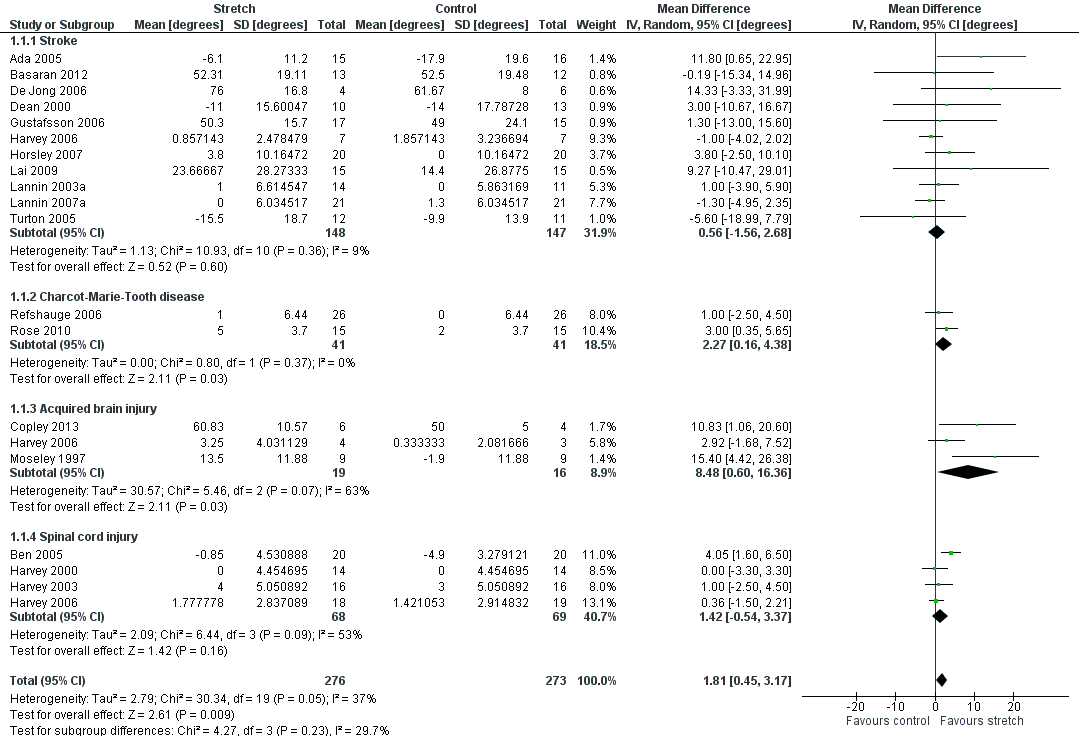
Forest plot of comparison: Joint mobility ‐ short‐term effects following stretch ‐ neurological conditions (degrees)
Non‐neurological conditions
Nineteen studies with a total of 925 participants investigated the short‐term effects on joint mobility following stretch in people with non‐neurological conditions (Aoki 2009; Buchbinder 1993; Bulstrode 1987; Collis 2013; Cox 2009; Fox 2000; Horton 2002; Hussein 2015; Jang 2015; Jerosch‐Herold 2011; John 2011; Jongs 2012; Kemler 2012; Kolmus 2012; Lee 2007; Moseley 2005; Paul 2014; Seeger 1987; Steffen 1995). All studies provided sufficient data but two studies (Buchbinder 1993; Cox 2009) did not measure joint mobility in degrees and hence data were pooled using a SMD. There was substantial statistical heterogeneity between studies (I2 = 67%) and the SMD was 0.3 (95% CI 0.1 to 0.6). The main reason for this heterogeneity was the Hussein 2015 study. The results for two of its three outcomes included in this review were between 5 and 30 times greater than the results for any other study. There was no obvious explanation for this but the extreme results all favouring the experimental condition seemed implausible. Therefore 18 studies with a total of 865 participants were included in the analyses (Aoki 2009; Buchbinder 1993; Bulstrode 1987; Collis 2013; Cox 2009; Fox 2000; Horton 2002; Jang 2015; Jerosch‐Herold 2011; John 2011; Jongs 2012; Kemler 2012; Kolmus 2012; Lee 2007; Moseley 2005; Paul 2014; Seeger 1987; Steffen 1995). The participants included frail elderly and people with ankle fracture, anklylosing spondylitis, oral submucous fibrosis, post‐radiation therapy to the breast, post‐radiation therapy to jaw, progressive systemic sclerosis, total knee replacement, arthritis, Dupuytren's contractures, shoulder adhesive capsulitis/frozen shoulder, hallux limitus, wrist fracture and burns. The SMD was 0.2 (95% CI 0.0 to 0.3; I2 = 28%; P = 0.05) (see Analysis 1.2; Figure 4; summary of findings Table 2).The GRADE quality of evidence for this result was high.

Forest plot of comparison: Joint mobility ‐ short‐term effects following stretch ‐ non‐neurological conditions (SMD)
Long‐term effects following stretch
Neurological conditions
Nine studies with a total of 248 participants investigated the long‐term effects on joint mobility following stretch in people with neurological conditions (Ackman 2005; Copley 2013; Gustafsson 2006; Harvey 2000; Horsley 2007; Lannin 2003a; Lannin 2007a; Law 1991; McNee 2007). Eight studies with a total of 211 participants provided sufficient data (Ackman 2005; Copley 2013; Gustafsson 2006; Harvey 2000; Horsley 2007; Lannin 2003a; Lannin 2007a; McNee 2007). The participants included people with stroke, cerebral palsy, spinal cord injury and acquired brain injury. The MD was 1° (95% CI ‐1 to 3; I2 = 17%; P = 0.50) (see Analysis 2.1; Figure 5).
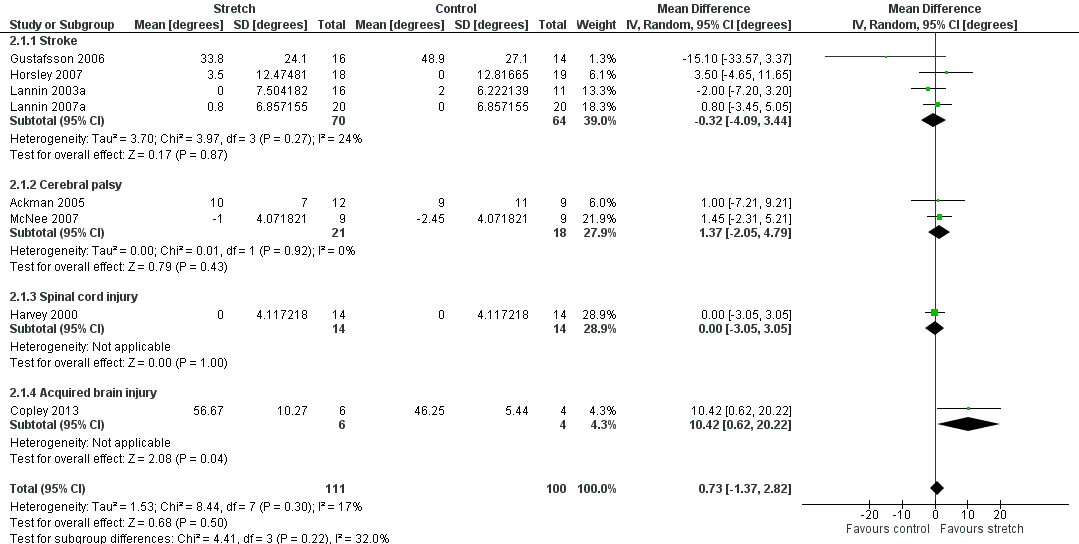
Forest plot of comparison: Joint mobility ‐ long‐term effects following stretch ‐ neurological conditions (degrees)
Non‐neurological conditions
Nine studies with a total of 558 participants investigated the long‐term effects on joint mobility following stretch in people with non‐neurological conditions (Bulstrode 1987; Horton 2002; Hussein 2015; Jerosch‐Herold 2011; Jongs 2012; Kemler 2012; Melegati 2003; Moseley 2005; Zenios 2002). Seven studies with a total of 498 participants provided sufficient data (Hussein 2015; Jerosch‐Herold 2011; Jongs 2012; Kemler 2012; Melegati 2003; Moseley 2005; Zenios 2002) but one study (Melegati 2003) did not measure joint mobility in degrees and hence data were pooled using a SMD. There was substantial statistical heterogeneity between studies (I2 = 94%) and the SMD was 0.6 (95% CI ‐0.2 to 1.5). The main reason for this heterogeneity was the Hussein 2015 study. As indicated in the short‐term effects following stretch section, this study had very large, implausible effects so we decided to omit it from the analysis. Therefore six studies with a total of 438 participants were included in the analyses (Jerosch‐Herold 2011; Jongs 2012; Kemler 2012; Melegati 2003; Moseley 2005; Zenios 2002). The participants included people with anterior cruciate ligament reconstruction, ankle fracture, total knee replacement, Dupuytren's contracture and wrist fracture. The SMD was ‐0.1 (95% CI ‐0.4 to 0.2; I2 = 42%; P = 0.43) (see Analysis 2.2).
Quality of life
Short‐term effects following stretch
Neurological conditions
No study measured a quality of life outcome during this time period.
Non‐neurological conditions
Three studies with a total of 111 participants investigated the short‐term effects on quality of life following stretch in people with non‐neurological conditions (Buchbinder 1993; Kolmus 2012; Lee 2007). Two studies with a total of 97 participants provided sufficient data (Lee 2007; Kolmus 2012). The participants included people post radiation therapy and with burns. The SMD was 0.3 (95% CI ‐0.1 to 0.7; I2 = 0%; P = 0.13) (see Analysis 3.1; summary of findings Table 2).The GRADE quality of evidence for this result was moderate.
Long‐term effects following stretch
Neurological conditions
No study measured a quality of life outcome during this time period.
Non‐neurological conditions
No study measured a quality of life outcome during this time period.
Pain
Short‐term effects following stretch
Neurological conditions
Nine studies with a total of 265 participants investigated the short‐term effects on pain following stretch in people with neurological conditions (Ada 2005; Burge 2008; Crowe 2000; De Jong 2006; Dean 2000; Gustafsson 2006; Horsley 2007; Lannin 2003a; Lannin 2007a). Five studies with a total of 174 participants provided sufficient data (Crowe 2000; Gustafsson 2006; Horsley 2007; Lannin 2003a; Lannin 2007a). The participants included people with stroke and spinal cord injury. The SMD was 0.2 (95% CI ‐0.1 to 0.5; I2 = 0%; P = 0.19) (see Analysis 4.1; summary of findings Table for the main comparison).The GRADE quality of evidence for this result was low.
Non‐neurological conditions
Nine studies with a total of 460 participants investigated the short‐term effects on pain following stretch in people with non‐neurological conditions (Aoki 2009; Buchbinder 1993; Cox 2009; Fox 2000; Hussein 2015; Kemler 2012; Lee 2007; Moseley 2005; Paul 2014). Seven studies with a total of 422 participants provided sufficient data (Aoki 2009; Fox 2000; Hussein 2015; Kemler 2012; Lee 2007; Moseley 2005; Paul 2014). The participants included frail elderly people and people with ankle fracture, post‐radiation therapy to the breast, arthritis, shoulder adhesive capsulitis/frozen shoulder and Dupuytren's contracture. The SMD was ‐0.2 (95% CI ‐0.4 to 0.1; I2 = 44%; P = 0.22) (see Analysis 4.2; summary of findings Table 2). The GRADE quality of evidence for this result was high.
Long‐term effects following stretch
Neurological conditions
Four studies with a total of 132 participants investigated the long‐term effects on pain following stretch in people with neurological conditions (Gustafsson 2006; Horsley 2007; Lannin 2003a; Lannin 2007a). All studies provided sufficient data. The participants included people with stroke. The SMD was 0 (95% CI ‐0.4 to 0.5; I2 = 38%; P = 0.90) (see Analysis 5.1).
Non‐neurological conditions
Three studies with a total of 204 participants investigated the long‐term effects on pain following stretch in people with non‐neurological conditions (Hussein 2015; Kemler 2012; Moseley 2005). Two studies with a total of 150 participants provided sufficient data (Hussein 2015; Moseley 2005). Data were not pooled due to clinical heterogeneity between studies. The participants included people with shoulder adhesive capsulitis and ankle fracture. The point estimates of effect of the two studies were ‐0.6 and 0 on a 10 cm visual analogue scale (see Analysis 5.2).
Activity limitations
Short‐term effects following stretch
Neurological conditions
Twelve studies with a total of 321 participants investigated the short‐term effects on activity limitations following stretch in people with neurological conditions (Ada 2005; Crowe 2000; De Jong 2006; DiPasquale‐Lehnerz 1994; Gustafsson 2006; Hill 1994; Horsley 2007; Hyde 2000; Lannin 2003a; Lannin 2007a; Law 1991; Rose 2010). Eight studies with a total of 247 participants provided sufficient data (Ada 2005; De Jong 2006; Gustafsson 2006; Horsley 2007; Lannin 2003a; Lannin 2007a; Law 1991; Rose 2010). There was substantial statistical heterogeneity between studies (I2 = 56%) and the SMD was 0.3 (95% CI ‐0.1 to 0.7). After exploring the reasons for this heterogeneity we decided to exclude the De Jong 2006 study because author correspondence revealed that some of the participants received confounding interventions including botulinum toxin injections, and additional physiotherapy and occupational therapy. Therefore seven studies with a total of 237 participants were included in the analyses (Ada 2005; Gustafsson 2006; Horsley 2007; Lannin 2003a; Lannin 2007a; Law 1991; Rose 2010). The participants included people with stroke, cerebral palsy and Charcot‐Marie‐Tooth disease. The SMD was 0.2 (95% CI ‐0.1 to 0.5; I2 = 37%; P = 0.25) (see Analysis 6.1; summary of findings Table for the main comparison). The GRADE quality of evidence for this result was low.
Non‐neurological conditions
Eight studies with a total of 556 participants investigated the short‐term effects on activity limitations following stretch in people with non‐neurological conditions (Aoki 2009; Collis 2013; Hussein 2015; Jerosch‐Herold 2011; Jongs 2012; Kolmus 2012; Moseley 2005; Paul 2014). Six studies with a total of 416 participants provided sufficient data (Aoki 2009; Hussein 2015; Jerosch‐Herold 2011; Jongs 2012; Kolmus 2012; Moseley 2005). There was substantial statistical heterogeneity between studies (I2 = 85%) and the SMD was 0.2 (95% CI ‐0.3 to 0.7). The main reason for this heterogeneity was the Hussein 2015 study. As indicated in the short‐term effects following stretch section, this study had very large, implausible effects so we decided to omit it from the analysis. Therefore five studies with a total of 356 participants were included in the analyses (Aoki 2009; Jerosch‐Herold 2011; Jongs 2012; Kolmus 2012; Moseley 2005). The participants included people with ankle fracture, arthritis, Dupuytren's contracture, wrist fracture and burns. The SMD was 0.1 (95% CI ‐0.2 to 0.3; I2 = 25%; P = 0.49) (see Analysis 6.2; summary of findings Table 2). The GRADE quality of evidence for this result was high.
Long‐term effects following stretch
Neurological conditions
Six studies with a total of 191 participants investigated the long‐term effects on activity limitations following stretch in people with neurological conditions (Gustafsson 2006; Horsley 2007; Lannin 2003a; Lannin 2007a; Law 1991; McNee 2007). All studies provided sufficient data. The participants included people with stroke and cerebral palsy. The SMD was 0.2 (95% CI ‐0.1 to 0.6; I2 = 25%; P = 0.19) (see Analysis 7.1).
Non‐neurological conditions
Four studies with a total of 328 participants investigated the long‐term effects on activity limitations following stretch in people with non‐neurological conditions (Hussein 2015; Jerosch‐Herold 2011; Jongs 2012; Moseley 2005). There was substantial statistical heterogeneity between studies (I2 = 91%) and the SMD was 0.4 (95% CI ‐0.4 to 1.2). The main reason for this heterogeneity was the Hussein 2015 study. As indicated in the short‐term effects following stretch section, this study had very large, implausible effects so we decided to omit it from the analysis. Therefore three studies with a total of 268 participants were included in the analyses (Jerosch‐Herold 2011; Jongs 2012; Moseley 2005). The participants included people with ankle fracture, Dupuytren's contracture and wrist fracture. The SMD was ‐0.1 (95% CI ‐0.3 to 0.2; I2 = 0%; P = 0.49) (see Analysis 7.2).
Participation restrictions
Short‐term effects following stretch
Neurological conditions
One study with a total of 58 participants investigated the short‐term effects on participation restrictions following stretch in people with neurological conditions (Harvey 2006). This study did not provide sufficient data.
Non‐neurological conditions
Two studies with a total of 129 participants investigated the short‐term effects on participation restrictions following stretch in people with non‐neurological conditions (Jongs 2012; Moseley 2005). Both studies provided sufficient data. The participants included people with ankle and wrist fracture. The SMD was ‐0.2 (95% CI ‐0.6 to 0.1; I2 = 0%; P = 0.21) (see Analysis 8.1; summary of findings Table 2). The GRADE quality of evidence for this result was low.
Long‐term effects following stretch
Neurological conditions
No study measured a participation restriction outcome during this time period.
Non‐neurological conditions
Two studies with a total of 122 participants investigated the long‐term effects on participation restrictions following stretch in people with non‐neurological conditions (Jongs 2012; Moseley 2005). Both studies provided sufficient data. The participants included people with ankle and wrist fracture. The SMD was ‐0.2 (95% CI ‐0.6 to 0.3; I2 = 26%; P = 0.50) (see Analysis 9.1).
Spasticity
Short‐term effects following stretch
Neurological conditions
Seven studies with a total of 159 participants investigated the short‐term effects on spasticity following stretch in people with neurological conditions (Basaran 2012; Burge 2008; Copley 2013; De Jong 2006; Hill 1994; Lai 2009; Lannin 2007a). Six studies with a total of 144 participants provided sufficient data (Basaran 2012; Burge 2008; Copley 2013; De Jong 2006; Lai 2009; Lannin 2007a). The participants included people with stroke and acquired brain injury. The SMD was 0.0 (95% CI ‐0.3 to 0.4; I2 = 0%; P = 0.85) (see Analysis 10.1).
Non‐neurological conditions
No study measured a spasticity outcome during this time period as spasticity is not relevant to this group.
Long‐term effects following stretch
Neurological conditions
Three studies with a total of 73 participants investigated the long‐term effects on spasticity following stretch in people with neurological conditions (Ackman 2005; Copley 2013; Lannin 2007a). All studies provided sufficient data. The participants included people with stroke, cerebral palsy and acquired brain injury. The SMD was ‐0.3 (95% CI ‐0.8 to 0.1; I2 = 0%; P = 0.16) (see Analysis 11.1).
Non‐neurological conditions
No study measured a spasticity outcome during this time period as spasticity is not relevant to this group.
Adverse events
Neurological conditions
Five studies with a total of 145 participants provided statements about adverse events (Ackman 2005; Horsley 2007; Fox 2000; Rose 2010; Turton 2005). However, the data were not sufficiently detailed or comparable to analyse quantitatively. The details of the adverse events described in the five studies are:
-
Ackman 2005 stated that there were no adverse events directly related to the experimental intervention (plaster cast) but three children from the experimental group withdrew from the study because their parents felt they were tripping and falling more than usual.
-
Fox 2000 and Rose 2010 reported five adverse events, including skin breakdown, mild bruising, and a blister on a toe. These adverse events were thought to be due to the intervention (application of plaster casts).
-
Horsley 2007 reported one death in the control group. It is very unlikely the death was caused by the intervention.
-
Turton 2005 stated that three participants ceased the intervention because of shoulder pain (n = 1) or wrist pain (n = 2). It is not clear if these adverse events were caused by the intervention.
Non‐neurological conditions
Nine studies with a total of 635 participants included statements about adverse events (Horton 2002; Jerosch‐Herold 2011; Jongs 2012; Kemler 2012; Kolmus 2012; Lee 2007; Paul 2014; Seeger 1987; Zenios 2002). Two studies (Kolmus 2012; Paul 2014) explicitly stated that there were no adverse events. One study (Jerosch‐Herold 2011) indicated that some participants did not comply with the experimental intervention because of discomfort, pain, sleep disturbance, a rash or stiffness but did not provide any further details. The data from the remaining six studies were not sufficiently detailed or comparable to analyse quantitatively. The details of the adverse events described in the six studies are:
-
Horton 2002 reported one adverse event in a control participant (haematoma) and three adverse events in participants receiving the intervention (one deep venous thrombosis, one death and one requiring manipulation under anaesthesia).
-
Jongs 2012 stated that some participants in the intervention group experienced transient numbness (n = 10) or pain (n = 1) due to the splint. It is not clear if adverse events were monitored in the control participants.
-
Kemler 2012 reported 14 adverse events in experimental participants (haematoma = 5; flexion deficits = 8) and eight adverse events in control participants (haematoma = 4; flexion deficits = 4).
-
Lee 2007 reported swelling in control (n = 4) and intervention participants (n = 1).
-
Seeger 1987 stated that four participants in the intervention group dropped out because of exacerbation of Raynauds’ phenomenon due to the splint. It is not clear if adverse events were monitored in the control participants.
-
Zenios 2002 reported wound infections in control (n = 1) and intervention participants (n = 10).
Subgroup analyses
The effects of different stretch dosages on joint mobility (total stretch time)
Thirty seven studies with a total of 1519 participants measured joint mobility in degrees and provided sufficient data to estimate the effect of mean total stretch time on joint mobility (Ackman 2005; Ada 2005; Aoki 2009; Basaran 2012; Collis 2013; Copley 2013; Ben 2005; Bulstrode 1987; De Jong 2006; Dean 2000; Fox 2000; Gustafsson 2006; Harvey 2000; Harvey 2003; Harvey 2006; Horsley 2007; Horton 2002; Hussein 2015; Jang 2015; Jerosch‐Herold 2011; John 2011; Jongs 2012; Kemler 2012; Kolmus 2012; Lai 2009; Lannin 2003a; Lannin 2007a; Lee 2007; McNee 2007; Moseley 1997; Moseley 2005; Paul 2014; Refshauge 2006; Seeger 1987; Steffen 1995; Turton 2005; Zenios 2002). As mean time data were skewed, they were transformed by taking the natural logarithm of time. We adjusted total stretch time for the length of time between randomisation and measurement as well as the length of time between the last stretch and measurement using multiple meta‐regression. The MD was 0° for each log hour increase in total stretch time (95% CI ‐1 to 1; I2 = 31%; P = 0.119) (see Figure 6).

Bubble plot of meta‐regression analysis: Joint mobility ‐ effects of total stretch time on joint mobility ‐ all conditions (degrees)
The effects of different stretch interventions on joint mobility
Thirty seven studies with a total of 1530 participants measured joint mobility in degrees and provided sufficient data to estimate the effect of different stretch interventions on joint mobility (Ackman 2005; Ada 2005; Aoki 2009; Basaran 2012; Collis 2013; Copley 2013; Ben 2005; Bulstrode 1987; De Jong 2006; Dean 2000; Fox 2000; Gustafsson 2006; Harvey 2000; Harvey 2003; Harvey 2006; Horsley 2007; Horton 2002; Hussein 2015; Jang 2015; Jerosch‐Herold 2011; John 2011; Jongs 2012; Kemler 2012; Kolmus 2012; Lai 2009; Lannin 2003a; Lannin 2007a; Lee 2007; McNee 2007; Moseley 1997; Moseley 2005; Paul 2014; Refshauge 2006; Seeger 1987; Steffen 1995; Turton 2005; Zenios 2002). We examined the overall effect of administering stretch in five different ways: serial casting; positioning; splinting; self‐administration; and other ways. The effect of stretch on joint mobility was not influenced by the way stretch was administered (test for subgroup differences; P = 0.33) although these results need to be interpreted with caution because some subgroups only included two studies.
Three studies with a total of 57 participants investigated the effect of serial casting on joint mobility (Ackman 2005; McNee 2007; Moseley 2005). The MD of serial casting on joint mobility was 5° (95% CI ‐3 to 12; I2= 65%; P = 0.21) (see Analysis 12.1).
Seven studies with a total of 165 participants investigated the effect of positioning on joint mobility (Ada 2005; De Jong 2006; Dean 2000; Fox 2000; Gustafsson 2006; Jang 2015; Turton 2005). The MD of positioning on joint mobility was 3° (95% CI ‐3 to 8; I2 = 40%; P = 0.32) (see Analysis 12.1).
Eighteen studies with a total of 847 participants investigated the effects of splinting on joint mobility (Basaran 2012; Collis 2013; Copley 2013; Harvey 2006; Horton 2002; Hussein 2015; Jerosch‐Herold 2011; John 2011; Jongs 2012; Kemler 2012; Kolmus 2012; Lai 2009; Lannin 2003a; Lannin 2007a; Refshauge 2006; Seeger 1987; Steffen 1995; Zenios 2002). There was substantial statistical heterogeneity between studies (I2 = 97%). The main reason for this heterogeneity was the Hussein 2015 study. As indicated in the short‐term effects following stretch section, this study had very large, implausible effects so we decided to omit it from the analysis. Therefore 17 studies with a total of 787 participants were included in the analyses (Basaran 2012; Collis 2013; Copley 2013; Harvey 2006; Horton 2002; Jerosch‐Herold 2011; John 2011; Jongs 2012; Kemler 2012; Kolmus 2012; Lai 2009; Lannin 2003a; Lannin 2007a; Refshauge 2006; Seeger 1987; Steffen 1995; Zenios 2002). The MD of splinting on joint mobility was 0° (95% CI ‐1 to 2; I2 = 28%; P = 0.68) (see Analysis 12.1 and Figure 7).

Forest plot of comparison: Joint mobility ‐ subgroup analyses by type of stretch intervention ‐ neurological conditions (degrees)
Two studies with a total of 75 participants investigated the effects of self‐administered stretches on joint mobility (Aoki 2009; Bulstrode 1987). The MD of self‐administered stretches on joint mobility was 3° (95% CI 0 to 6; I2 = 0%; P = 0.04) (see Analysis 12.1 and Figure 7).
Seven studies with a total of 386 participants investigated the effects of other stretch interventions on joint mobility (Ben 2005; Harvey 2000; Harvey 2003; Horsley 2007; Lee 2007; Moseley 2005; Paul 2014). The MD of other stretch interventions on joint mobility was 1° (95% CI ‐1 to 3; I2 = 48%; P = 0.41) (see Analysis 12.1 and Figure 7).
The effects of stretch on joint mobility in small joints versus large joints
Thirty seven studies with a total of 1506 participants measured joint mobility in degrees and provided sufficient data to estimate the effects of stretch in small versus large joints (Ackman 2005; Ada 2005; Aoki 2009; Basaran 2012; Collis 2013; Copley 2013; Ben 2005; Bulstrode 1987; De Jong 2006; Dean 2000; Fox 2000; Gustafsson 2006; Harvey 2000; Harvey 2003; Harvey 2006; Horsley 2007; Horton 2002; Hussein 2015; Jang 2015; Jerosch‐Herold 2011; John 2011; Jongs 2012; Kemler 2012; Kolmus 2012; Lai 2009; Lannin 2003a; Lannin 2007a; Lee 2007; McNee 2007; Moseley 1997; Moseley 2005; Paul 2014; Refshauge 2006; Seeger 1987; Steffen 1995; Turton 2005; Zenios 2002). The effect of stretch on joint mobility was not influenced by the size of the joint (test for subgroup differences; P = 0.42).
Twenty studies with a total of 822 participants investigated the effects of stretch in small joints (Ackman 2005; Ben 2005; Basaran 2012; Collis 2013; Copley 2013; Harvey 2000; Harvey 2006; Horsley 2007; Jerosch‐Herold 2011; Lannin 2003a; Lannin 2007a; John 2011; Jongs 2012; Kemler 2012; McNee 2007; Moseley 1997; Moseley 2005; Refshauge 2006; Seeger 1987; Turton 2005). The MD of stretch in small joints was 1° (95% CI 0 to 3; I2 = 45%; P = 0.07) (see Analysis 12.2).
Seventeen studies with a total of 705 participants measured joint mobility in degrees and provided sufficient data to estimate the effects of stretch in large joints (Aoki 2009; Ada 2005; Bulstrode 1987; De Jong 2006; Dean 2000; Fox 2000; Gustafsson 2006; Harvey 2003; Horton 2002; Hussein 2015; Jang 2015; Kolmus 2012; Lai 2009; Lee 2007; Paul 2014; Steffen 1995; Zenios 2002). There was substantial statistical heterogeneity between studies (I2 = 97%). The main reason for this heterogeneity was the Hussein 2015 study. As indicated in the short‐term effects following stretch section, this study had very large, implausible effects so we decided to omit it from the analysis. Therefore 16 studies with a total of 645 participants were included in the analyses (Aoki 2009; Ada 2005; Bulstrode 1987; De Jong 2006; Dean 2000; Fox 2000; Gustafsson 2006; Harvey 2003; Horton 2002; Jang 2015; Kolmus 2012; Lai 2009; Lee 2007; Paul 2014; Steffen 1995; Zenios 2002). The MD of splinting on joint mobility was 1° (95% CI ‐1 to 2; I2 = 36%; P = 0.44) (see Analysis 12.2).
The effects of stretch on joint mobility when influenced by participants' perceptions of discomfort
Thirty‐seven studies with a total of 1506 participants measured joint mobility in degrees and provided sufficient data to estimate the effects of stretch when measurements could be influenced by participants' perceptions of discomfort versus when measurements could not be influenced by participants' perceptions of discomfort (Ackman 2005; Ada 2005; Aoki 2009; Basaran 2012; Collis 2013; Copley 2013; Ben 2005; Bulstrode 1987; De Jong 2006; Dean 2000; Fox 2000; Gustafsson 2006; Harvey 2000; Harvey 2003; Harvey 2006; Horsley 2007; Horton 2002; Hussein 2015; Jang 2015; Jerosch‐Herold 2011; John 2011; Jongs 2012; Kemler 2012; Kolmus 2012; Lai 2009; Lannin 2003a; Lannin 2007a; Lee 2007; McNee 2007; Moseley 1997; Moseley 2005; Paul 2014; Refshauge 2006; Seeger 1987; Steffen 1995; Turton 2005; Zenios 2002). The effect of stretch on joint mobility was not influenced by participants' perceptions of discomfort (test for subgroup differences; P = 0.90).
Twenty‐six studies with a total of 1069 participants used methods where joint mobility measurements could be influenced by participants' perceptions of discomfort (e.g. studies that measured maximal passive or active joint range of motion) (Ackman 2005; Ada 2005; Aoki 2009; Basaran 2012; Collis 2013; Copley 2013; Bulstrode 1987; De Jong 2006; Dean 2000; Fox 2000; Gustafsson 2006; Horton 2002; Hussein 2015; Jang 2015; Jerosch‐Herold 2011; John 2011; Jongs 2012; Kemler 2012; Kolmus 2012; Lai 2009; Lee 2007; McNee 2007; Paul 2014; Seeger 1987; Turton 2005; Zenios 2002). There was substantial statistical heterogeneity between studies (I2 = 95%) and the SMD was 7° (95% CI 1° to 10°). The main reason for this heterogeneity was the Hussein 2015 study. As indicated in the short‐term effects following stretch section, this study had very large, implausible effects so we decided to omit it from the analysis. Therefore 25 studies with a total of 1009 participants were included in the analyses (Ackman 2005; Ada 2005; Aoki 2009; Basaran 2012; Collis 2013; Copley 2013; Bulstrode 1987; De Jong 2006; Dean 2000; Fox 2000; Gustafsson 2006; Horton 2002; Jang 2015; Jerosch‐Herold 2011; John 2011; Jongs 2012; Kemler 2012; Kolmus 2012; Lai 2009; Lee 2007; McNee 2007; Paul 2014; Seeger 1987; Turton 2005; Zenios 2002). The MD of stretch on joint mobility when joint mobility measurements could be influenced by participants' perceptions of discomfort was 1° (95% CI 0 to 3; I2 = 42%; P = 0.14) (see Analysis 12.3).
Eleven studies with a total of 461 participants used methods where joint mobility measurements could not be influenced by participants' perceptions of discomfort (e.g. studies that standardised passive joint torque when measuring joint mobility) (Ben 2005; Harvey 2000; Harvey 2003; Harvey 2006; Horsley 2007; Lannin 2003a; Lannin 2007a; Moseley 1997; Moseley 2005; Refshauge 2006; Steffen 1995). The MD of stretch on joint mobility when joint mobility measurements could not be influenced by participants' perceptions of discomfort was 1° (95% CI 0 to 3; I2 = 46%; P = 0.16).
The effects of stretch on joint mobility for the treatment of contractures versus the prevention of contractures
The distinction between stretch for the treatment and prevention of contractures was often ambiguous. Many studies recruited a mix of participants (that is, some participants had existing contractures whilst other participants were at risk of developing contractures). Only four studies clearly investigated the effects of stretch for the prevention of contractures (that is, participants did not have contractures on entry to the study) (Ada 2005; Copley 2013; Crowe 2000; Melegati 2003). However, only two studies provided sufficient data (Ada 2005; Copley 2013), preventing the planned subgroup analysis.
The effect of stretch on joint mobility when measurements were taken within one day of the last stretch
Studies did not always clearly state the time period between the last stretch and the first post‐intervention assessment of joint mobility. This is important because measurements taken within 24 hours of the last stretch may reflect the short‐lived viscous effects of stretch. Therefore, when not stated, we assumed that the first post‐intervention assessment of joint mobility was taken within 24 hours of the last stretch.
Twenty‐eight studies with a total of 1128 participants measured joint mobility in degrees and provided sufficient data to estimate the effects of stretch when measurements were taken less than one day after the last stretch intervention (Ada 2005; Aoki 2009; Basaran 2012; Bulstrode 1987; Collis 2013; Copley 2013; Dean 2000; De Jong 2006; Fox 2000; Gustafsson 2006; Horton 2002; Jang 2015; Jerosch‐Herold 2011; John 2011; Jongs 2012; Kemler 2012; Kolmus 2012; Lai 2009; Lannin 2003a; Lannin 2007a; Lee 2007; Moseley 1997; Moseley 2005; Paul 2014; Refshauge 2006; Rose 2010; Seeger 1987; Steffen 1995). The MD was 1° (95% CI 0 to 2; I2 = 30; P = 0.02) (see Analysis 12.4).
Seven studies with a total of 245 participants measured joint mobility in degrees and provided sufficient data to estimate the effects of stretch when measurements were taken more than one day after the last stretch intervention (Ben 2005; Fox 2000; Harvey 2000; Harvey 2003; Harvey 2006; Horsley 2007; Turton 2005). The MD was 1° (95% CI 0 to 2; I2 = 31%; P = 0.02) (see Analysis 12.4).
Sensitivity analyses
We conducted sensitivity analyses on the neurological and non‐neurological populations to examine the effects of randomisation (adequate sequence generation versus inadequate sequence generation), allocation concealment (concealed versus non‐concealed), blinding of assessors (blinding versus no blinding) and completeness of outcome data (complete outcome data available versus incomplete outcome data available) on the primary outcome of joint mobility (details below).
Short‐term effects following stretch on joint mobility
Neurological conditions
Excluding studies that did not fulfil the risk of bias criteria (adequate sequence generation, allocation concealment, blinding of assessors and completeness of outcome data) had no effect on the mean difference. We excluded between two and five studies (out of a total of 18 studies) for each of the criteria. We have summarised the results in Table 1 (Additional tables).
| Joint mobility ‐ neurological conditions | Pooled results | Randomisation (studies with adequate sequence generation) | Allocation (studies with concealed allocation) | Assessors (studies with blinded assessors) | Dropout rate (studies with ≤ 15% dropouts) |
| Short‐term effects following stretch | 2 ° (0 to 3) n = 18 | 2 ° (0 to 3) n = 16 | 1 ° (0 to 3) n = 15 | 2 ° (0 to 3) | 2 ° (0 to 3) n = 13 |
| Long‐term effects following stretch | 1 ° (‐1 to 3) n = 8 | 1 ° (‐3 to 4) n = 6 | 0 ° (‐2 to 2) n = 5 | 1 ° (‐2 to 3) n = 6 | 0 ° (‐2 to 2) n = 6 |
Results are presented in degrees; mean (95% CI).
n = number of studies included in analysis
Non‐neurological conditions
Excluding studies that did not fulfil the risk of bias criteria (adequate sequence generation, allocation concealment, blinding of assessors and completeness of outcome data) had no effect on the mean difference. We excluded between four and eight studies (out of a total of 16 studies) for each of the criteria. We have summarised the results in Table 2 (Additional tables).
| Joint mobility ‐ non‐neurological conditions | Pooled results | Randomisation (studies with adequate sequence generation) | Allocation (studies with concealed allocation) | Assessors (studies with blinded assessors) | Dropout rate (studies with ≤ 15% dropouts) |
| Short‐term effects following stretch | 1° (‐1 to 2) n = 16 | 1° (‐1 to 3) n = 9 | ‐1° (‐2 to 1) n = 8 | 1° (‐1 to 3) n = 12 | 0° (‐2 to 1) n = 10 |
| Long‐term effects following stretch | ‐1° (‐3 to 2) n = 5 | 0° (‐6 to 7) n = 3 | 1° (‐5 to 7) n = 3 | 0° (‐7 to 7) n = 3 | ‐1° (‐3 to 2) n = 5 |
Results are presented in degrees; mean (95%CI). Studies in which data were no expressed in degrees were excluded from all analyses (Buchbinder 1993, Cox 2009 and Melegati 2003).
n = number of studies included in analysis.
Long‐term effects following stretch on joint mobility
Neurological conditions
Excluding studies that did not fulfil the risk of bias criteria (adequate sequence generation, allocation concealment, blinding of assessors and completeness of outcome data) had no effect on the mean difference. We excluded between two and three studies (out of a total of eight studies) for each of the criteria. We have summarised the results Table 1 (Additional tables).
Non‐neurological conditions
Excluding studies that did not fulfil the risk of bias criteria (adequate sequence generation, allocation concealment, blinding of assessors and completeness of outcome data) had no effect on the mean difference. We excluded between no studies and two studies (out of a total of five studies) for each of the criteria. We have summarised the results in Table 2 (Additional tables).
Small sample bias
To examine the possibility of small sample bias in the estimates of the short‐term effects of stretch on joint mobility for people with neurological (see Figure 8) and non‐neurological conditions (see Figure 9), we generated two funnel plots. Both funnel plots indicated evidence of small sample bias with the effect being greater in the non‐neurological conditions than the neurological conditions.

Funnel plot of comparison: 1 Joint mobility ‐ short‐term effects following stretch, outcome: 1.1 Neurological conditions (degrees)
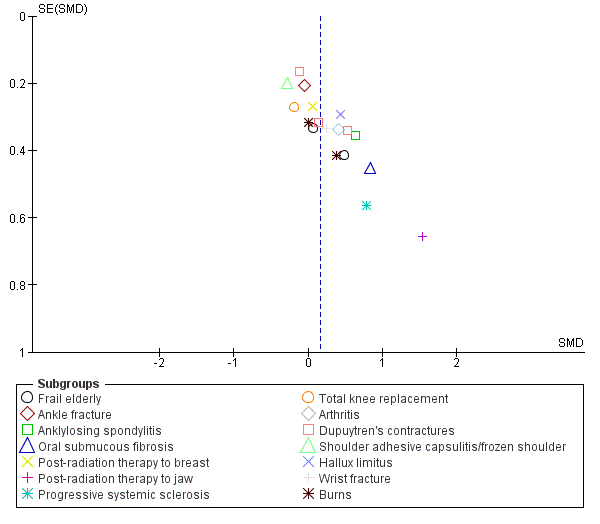
Funnel plot of comparison: 1 Joint mobility ‐ short‐term effects following stretch, outcome: 1.2 Non‐neurological conditions
Discussion
Summary of main results
The primary objective of this systematic review was to determine whether stretch increases joint mobility in people with existing contractures or those at risk of developing contractures. The results provided high‐quality evidence that stretch did not have a clinically important short‐term effect on joint mobility in people with or without neurological conditions. Similarly, there was no evidence of a long‐term effect of stretch. These findings were robust in most sensitivity and sub‐group analyses. This systematic review also provides moderate‐ and high‐quality evidence that stretch did not have clinically important short‐term effects on quality of life or pain, respectively, in people with non‐neurological conditions. The short‐ and long‐term effects of stretch on quality of life and pain in people with neurological conditions were uncertain. There was little or no evidence about the short or long‐term effects of stretch on activity limitations or participation restrictions in people with or without neurological conditions but there was initial evidence to indicate that stretch did not have a short‐term effect on spasticity in people with neurological conditions (see Table 3 for a summary of the interpretation of all results). There was no useable data to determine the possible adverse events of stretch for people either with or without neurological conditions.
| Neurological conditions | Non‐neurological conditions | |||
| Short‐term | Long‐term | Short‐term | Long‐term | |
| Joint ROM | Ineffective1 – HIGH | Ineffective1 | Ineffective1 – HIGH | Ineffective1 |
| QOL | Not measured | Not measured | Ineffective2 – MOD | Not measured |
| Pain* | Uncertain ‐ LOW | Uncertain | Ineffective3 – HIGH | Uncertain |
| Spasticity* | Uncertain | Uncertain | Not relevant for people with non‐neurological conditions | Not relevant or people with non‐neurological conditions |
| Activity limitations | Uncertain – LOW | Uncertain | Uncertain ‐ HIGH | Uncertain |
| Participation restrictions | Not measured | Not measured | Uncertain ‐ LOW | Uncertain |
* Negative value favours stretch
Ineffective = the results rule out a clinically important treatment effect.
The quality of the evidence for the short‐term effects was rated using GRADE and is indicated by high, moderate (mod) or low. GRADE was not used to rate the quality of evidence for the long‐term effects.
1 The results rule out a clinically important treatment effect of 5°. Results expressed as SMD were back converted to degrees (see summary of findings Table for the main comparison).
2 The results rule out a clinically important treatment effect equivalent to 10 points on a 160‐point scale, and an absolute change and relative change of 5% (see summary of findings Table 2).
3 The results rule out a clinically important treatment effect equivalent to 2 points on a 10‐point pain scale, and an absolute change and relative change of 5% (see summary of findings Table 2).
4 A meta‐analysis was not performed on the two studies because of clinical heterogeneity between studies (see Results).
The studies in this review included a diverse group of people with conditions such as spinal cord injury, acquired brain injury, stroke, ankylosing spondylitis, oral submucous fibrosis, systemic sclerosis, ankle fracture and arthritis. The studies were categorised into neurological and non‐neurological conditions. We reasoned that it was justified to pool data across these two populations because (a) stretch is used in routine clinical practice in a similar manner across a range of different conditions, and (b) there was relatively little between‐study heterogeneity of estimates of effect. We separated neurological from non‐neurological conditions to guard against the possibility that involvement of the nervous system, and specifically spasticity, influences the response of people to stretch. The results of the sub‐group analyses suggest that the response of different groups of people to stretch is remarkably consistent with little evidence that stretch has a differing effect on joint mobility for people with different types of neurological (see subgroup analyses in Analysis 1.1; Analysis 2.1) or non‐neurological conditions (see subgroup analyses in Analysis 1.2; Analysis 2.2). The only exception was acquired brain injury which we discuss below.
The point estimates for the short‐ or long‐term effects of stretch on joint mobility in people with neurological conditions are very small and precise (mean difference (MD) 2°; 95% confidence interval (CI) 0 to 3; and MD 1°; 95% CI ‐1 to 3, respectively) (see summary of findings Table for the main comparison; summary of findings Table 2). The precision around both estimates indicates that any possible treatment effect is not greater than 4°. Most would not consider a treatment effect of less than 5° (Ben 2005; Harvey 2000; Harvey 2003; Harvey 2006; Lannin 2003a; Lannin 2007a; Moseley 2005; Refshauge 2006) or even less than 10° (Dean 2000; Gustafsson 2006; Horsley 2007; Lee 2007) as clinically important. The inconsequential size of possible treatment effects are also evident when the results are expressed as absolute change (MD 1%; 95% CI 0 to 2; see summary of findings Table for the main comparison). The results are very similar for all sub‐group analyses with the exception of acquired brain injury. The point estimates for both the short‐term and long‐term effects of stretch for people with acquired brain injury are very imprecise failing to rule in or rule out a clinically important treatment effect. However, the results of these sub‐group analyses need to be interpreted with caution because the point estimate describing the long‐term effect is only based on one study (Copley 2013) of 10 people and this study is highly susceptible to bias (see Figure 2). The point estimate for the short‐term effects is based on three studies, however one study is vulnerable to bias (Copley 2013) and another study measured joint mobility immediately after the removal of a plaster cast. The measurement of joint mobility immediately after the removal of a cast may only reflect viscous deformation and may not indicate any therapeutic effect on contracture management (Weppler 2010).
The point estimates describing the short‐ or long‐term effects of stretch on joint mobility in people with non‐neurological conditions are more difficult to interpret because not all studies measured joint mobility in degrees and consequently the results are expressed as standardised mean differences (SMD). Nonetheless, there is no indication of a short‐term or long‐term treatment effect (SMD 0.2; 95% CI 0 to 0.3; SMD ‐0.1; 95% CI ‐0.4 to 0.2, respectively). This is also evident when the results are expressed as absolute change. For example, the mean (95% CI) absolute change for the short‐term effect of stretch is 1% (0 to 3; see summary of findings Table 2).
There is moderate‐quality evidence to indicate that stretch has no short‐term effects on quality of life for people with non‐neurological conditions. No study has examined the long‐term effects although it is unlikely that there would be long‐term effects if there were no short‐term effects. No study has examined the short‐ or long‐term effect of stretch on quality of life in people with neurological conditions.
A secondary purpose of this systematic review was to determine the effect of stretch on pain. There is high‐quality evidence to suggest that stretch has no short‐term effects on pain in people with non‐neurological conditions (SMD ‐0.2; 95% CI ‐0.4 to 0.1) (see summary of findings Table for the main comparison). The long‐term effects of stretch on pain in people with non‐neurological conditions and the short‐ and long‐term effects of stretch on pain in people with neurological conditions are less clear, failing to rule in or rule out a possible therapeutic effect.
Stretch is sometimes administered to decrease spasticity in people with neurological conditions. Spasticity is believed to contribute to loss of joint mobility as well as directly interfere with attempts at movement. However, spasticity is notoriously difficult to quantify in clinical studies. Typically it is measured with the Ashworth or Tardieu scales (Bohannon 1987; Tardieu 1954). Only six and three studies provided useable data to determine the short‐term and long‐term effects of stretch on spasticity, respectively. These studies failed to rule in or rule out a possible therapeutic effect however none specifically included people with spasticity. We do not know the effects of stretch from studies that restrict inclusion to those with problematic spasticity.
The effects of stretch on activity limitations and participation restrictions have not been well investigated. In the few instances where effects on these outcomes were evaluated, there was no clear beneficial effect. This is not altogether surprising given the failure of stretch to increase joint mobility or decrease pain. Without underlying changes at the impairment level, it is difficult to envisage a mechanism whereby stretch could have therapeutic effects on activity limitations and participation restrictions.
The dosage of stretch administered in the included studies was highly variable. We used meta‐regression to explore the possibility that total stretch time influences joint mobility. The results indicated that increasing dosages of stretch did not influence joint mobility (mean effect 0° for each log hour increase in total stretch time; 95% CI ‐1 to 1). We also used meta‐analysis to investigate the relative effectiveness of different stretch interventions including serial casting, positioning, splinting, self‐administered stretches and other stretches. The data do not support the hypothesis that any particular intervention is superior to another. In addition, there was no evidence that the effects of stretch differed between large and small joints. However, the results of all these meta‐analyses and sub‐group analyses need to be interpreted with some caution because they are based on non‐randomised between‐study comparisons, rather than on randomised within‐study comparisons, so there is potential for serious confounding.
Overall completeness and applicability of evidence
Most studies only investigated the use of stretch over relatively short time periods of four to 12 weeks. No study investigated the use of stretch over periods greater than seven months. The effectiveness of stretch that is performed for periods longer than seven months remains unknown. It is conceivable that small effects of stretch accumulate over many years. Studies conducted with this time frame will be difficult to conduct and pose a logistic challenge to future researchers, although we did identify one study that is still being conducted that is examining the effect of orthoses worn for one year in children with cerebral palsy (Characteristics of ongoing studies).
Most of the included studies examined the added benefit of stretch over and above the usual care provided to both experimental and control groups. Usual care was rarely defined, but in most studies probably involved comprehensive skin, nursing and in some instances rehabilitation programmes. Stretch may have been administered as participants moved or were moved by others as part of these programmes and as part of routine daily activities. Therefore, while the results of this review indicate that stretch as typically applied by physiotherapists does not produce lasting increases in joint mobility, the effects or possible importance of stretch administered as part of usual nursing care has not been answered in this review. For example, the results of this review do not shed light on the assumed importance of appropriate positioning in bed for people who are paralysed or unconscious. To answer this question, clinical trials comparing nursing care that involves appropriate positioning in bed with nursing care that does not are required. However, these trials are not likely to be conducted because appropriate positioning in bed is now considered standard care.
Quality of the evidence
The risk of bias in the 49 included studies was variable. Some of the more serious risks of bias included the failure to use adequate methods to generate the randomisation sequence (37% of studies), failure to conceal allocation (49% of studies), failure to blind assessors to objective outcomes (27% of studies), and incomplete outcome data (37% of studies). We included results from all studies in the main analyses regardless of quality. When studies at risk of selection, detection or attrition bias were excluded in the sensitivity analyses, there was no or little change in the estimates of the effect of stretch (Table 1; Table 2). This suggests that the main findings are robust.
There is some indication of small study bias (see Figure 8; Figure 9). That is, there is a disproportionate number of smaller studies with positive findings rather than negative findings. This is more pronounced in studies involving people with non‐neurological conditions than people with neurological conditions. Small study bias exaggerates treatment effects. Therefore, our results are probably conservative. That is, the size of treatment effects may be even lower than we have reported, particularly for people with non‐neurological conditions.
The GRADE methodology indicates that four of our findings are based on high‐quality evidence, namely the short‐term effects of stretch on joint mobility in neurological conditions, and the short‐term effects of stretch on joint mobility, pain and activity limitations in non‐neurological conditions (see summary of findings Table for the main comparison; summary of findings Table 2). In contrast, the quality of the evidence about the short‐term effects of stretch on pain and activity limitations in people with neurological conditions is low. The evidence was downgraded for three reasons: (i) some of the included studies had a high risk of bias (ii) the results were only based on studies involving people with stroke and spinal cord injury (iii) the point estimates were imprecise when expressed as a relative percent change (although they were precise when expressed as an absolute change).
In people with non‐neurological conditions, the quality of evidence about the short‐term effects of stretch on quality of life and participation restrictions is moderate and low, respectively. The evidence of stretch on quality of life was downgraded because the results are based on only two studies involving people with burns and post‐radiation therapy to the breast. Similarly, the evidence of stretch on participation restrictions in people with non‐neurological conditions is low because the results are only based on studies involving people with ankle and wrist fracture and the point estimates are imprecise if expressed as relative percent change or absolute change.
Potential biases in the review process
A common source of bias in systematic reviews is the failure to identify all relevant studies. We attempted to minimise this bias by performing thorough database searches, including studies in all languages, using forward citation tracking and reference list searches of included studies and relevant systematic reviews, and corresponding with authors of included studies. Despite these efforts, bias may have been introduced from failing to identify unpublished studies. We did identify one unpublished study (Evans 1994) and a study which was only reported in a conference proceeding (Krumlinde‐Sundholm 2011). We attempted to attain the data from the authors of these two studies without success. Nonetheless, the main findings are probably robust because retrieval bias generally tends to inflate estimates of effects (Dickersin 1993; Egger 1998) and most estimates of effect were small in this review.
Bias may have been introduced by the exclusion of one of the studies (Hussein 2015) from some analyses. This study included people with shoulder adhesive capsulitis. This study was excluded from some analyses because its results were so extreme that they seemed highly implausible. For example, the authors reported a mean between‐group difference of 74° in shoulder abduction one year after the end of a four‐week intervention involving the application of a splint for up to 1.5 hours per day. This is between 5 and 30 times greater than the results for any other study including studies which only looked at the short‐term effects of stretch. There were other aspects of this study that raised concern. For example, the authors claimed a 100% follow‐up rate of 60 participants at one year post randomisation. This is possible but unusual. Our attempts to contact the study authors for clarification were unsuccessful. The potential source of bias in this study is not clear although it is noted that the splint used in this study is very costly and raises the question as to whether the study was sponsored by a commercial company (no sponsorship or funding are declared in any of the three papers that report the results of this study).
Bias in this systematic review may have been introduced because four of the six authors of this systematic review have undertaken randomised controlled trials on this topic. To address this issue review authors did not extract data, assess risk of bias or assess the quality of the evidence for studies in which they had been involved. Instead, these tasks were performed by the other two review authors.
Agreements and disagreements with other studies or reviews
A number of systematic reviews have examined the effects of stretch administered in varying ways on joint mobility (Autti‐Ramo 2006; Blackmore 2007; Bovend'Eerdt 2008; Hellweg 2008; Lannin 2003b; Lannin 2007b; Pin 2006; Singer 2001; Van Peppen 2004). The conclusions vary, and not surprisingly, systematic reviews that include non‐randomised studies (Michlovitz 2004; Mortenson 2003; Teplicky 2002) tend to report more positive results than systematic reviews that do not. Two recent systematic reviews used meta‐analysis to estimate the effects of stretch for improving joint mobility after stroke and similar conditions (Borisova 2009; Tyson 2009). The authors concluded that stretch did not improve joint mobility or upper limb function. These findings are in agreement with the findings of our review.

Study flow diagram
1. These numbers are approximate only

Methodological quality summary: review authors' judgements about each methodological quality item for each included study

Forest plot of comparison: Joint mobility ‐ short‐term effects following stretch ‐ neurological conditions (degrees)
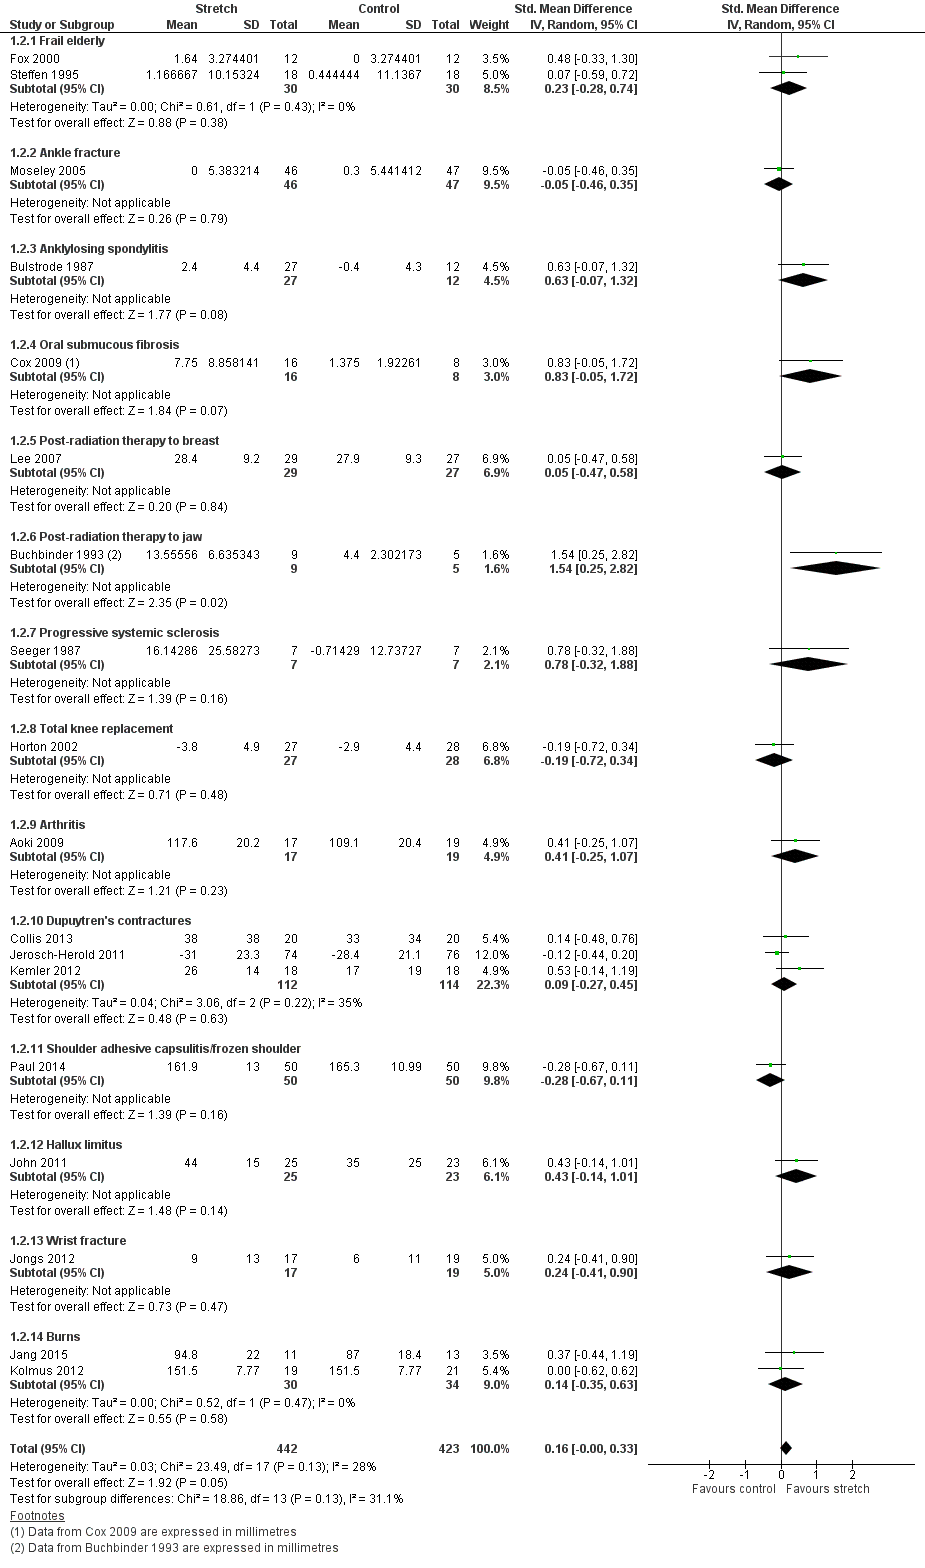
Forest plot of comparison: Joint mobility ‐ short‐term effects following stretch ‐ non‐neurological conditions (SMD)

Forest plot of comparison: Joint mobility ‐ long‐term effects following stretch ‐ neurological conditions (degrees)

Bubble plot of meta‐regression analysis: Joint mobility ‐ effects of total stretch time on joint mobility ‐ all conditions (degrees)

Forest plot of comparison: Joint mobility ‐ subgroup analyses by type of stretch intervention ‐ neurological conditions (degrees)

Funnel plot of comparison: 1 Joint mobility ‐ short‐term effects following stretch, outcome: 1.1 Neurological conditions (degrees)

Funnel plot of comparison: 1 Joint mobility ‐ short‐term effects following stretch, outcome: 1.2 Non‐neurological conditions

Comparison 1 Joint mobility ‐ short‐term effects following stretch, Outcome 1 Neurological conditions.

Comparison 1 Joint mobility ‐ short‐term effects following stretch, Outcome 2 Non‐neurological conditions.

Comparison 2 Joint mobility ‐ long‐term effects following stretch, Outcome 1 Neurological conditions.
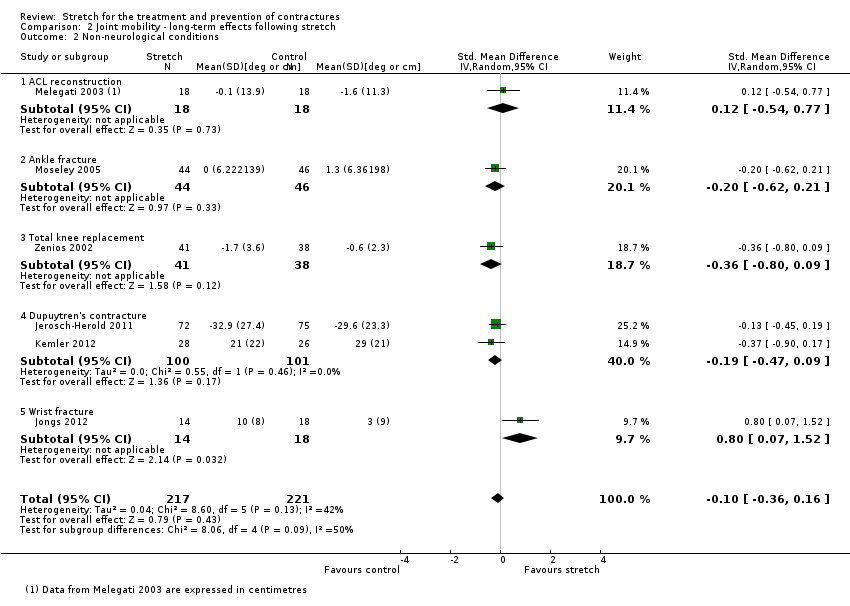
Comparison 2 Joint mobility ‐ long‐term effects following stretch, Outcome 2 Non‐neurological conditions.

Comparison 3 Quality of life ‐ short‐term effects following stretch, Outcome 1 Non‐neurological conditions.
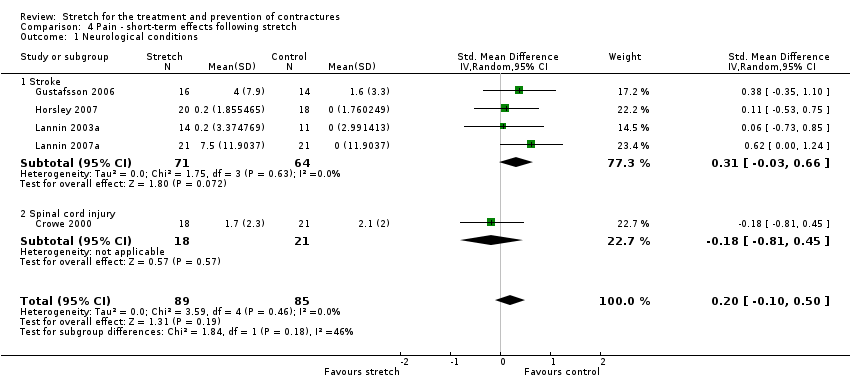
Comparison 4 Pain ‐ short‐term effects following stretch, Outcome 1 Neurological conditions.

Comparison 4 Pain ‐ short‐term effects following stretch, Outcome 2 Non‐neurological conditions.

Comparison 5 Pain ‐ long‐term effects following stretch, Outcome 1 Neurological conditions.

Comparison 5 Pain ‐ long‐term effects following stretch, Outcome 2 Non‐neurological conditions.
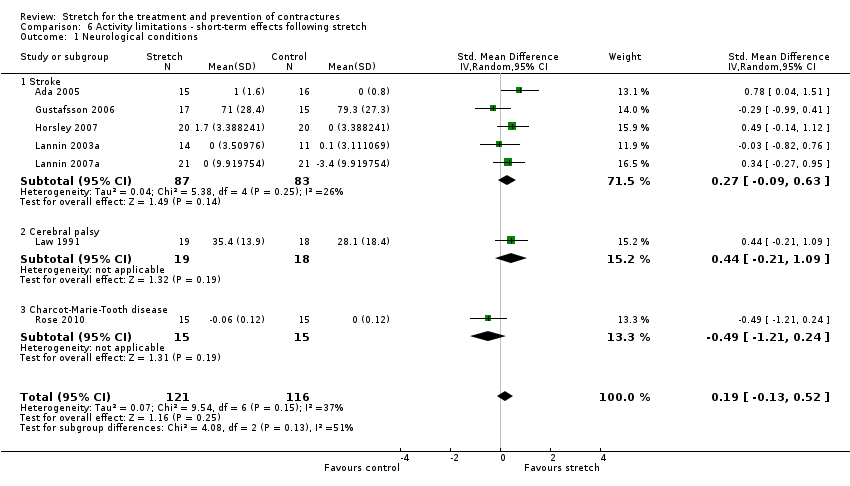
Comparison 6 Activity limitations ‐ short‐term effects following stretch, Outcome 1 Neurological conditions.

Comparison 6 Activity limitations ‐ short‐term effects following stretch, Outcome 2 Non‐neurological conditions.
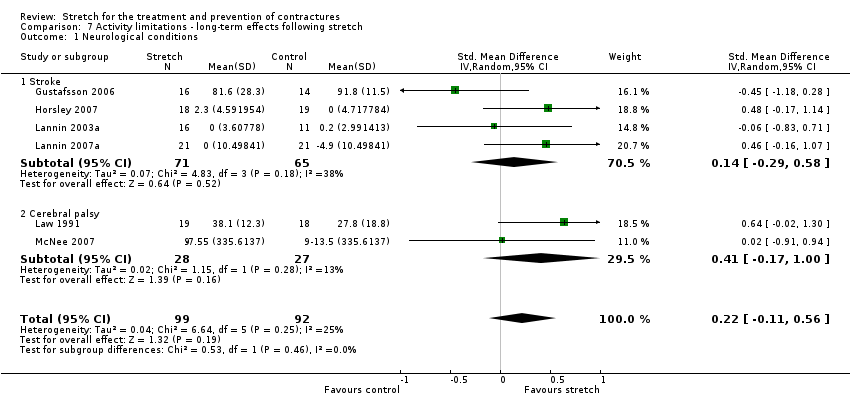
Comparison 7 Activity limitations ‐ long‐term effects following stretch, Outcome 1 Neurological conditions.

Comparison 7 Activity limitations ‐ long‐term effects following stretch, Outcome 2 Non‐neurological conditions.
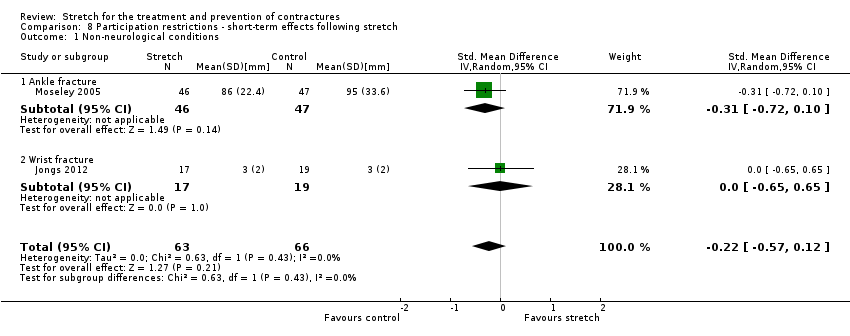
Comparison 8 Participation restrictions ‐ short‐term effects following stretch, Outcome 1 Non‐neurological conditions.
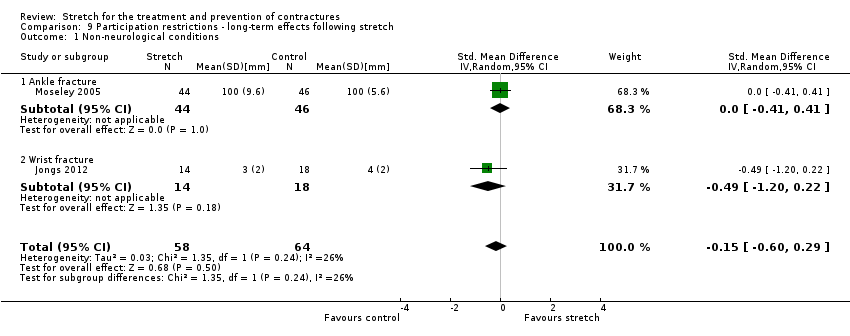
Comparison 9 Participation restrictions ‐ long‐term effects following stretch, Outcome 1 Non‐neurological conditions.

Comparison 10 Spasticity ‐ short‐term effects following stretch, Outcome 1 Neurological conditions.

Comparison 11 Spasticity ‐ long‐term effects following stretch, Outcome 1 Neurological conditions.
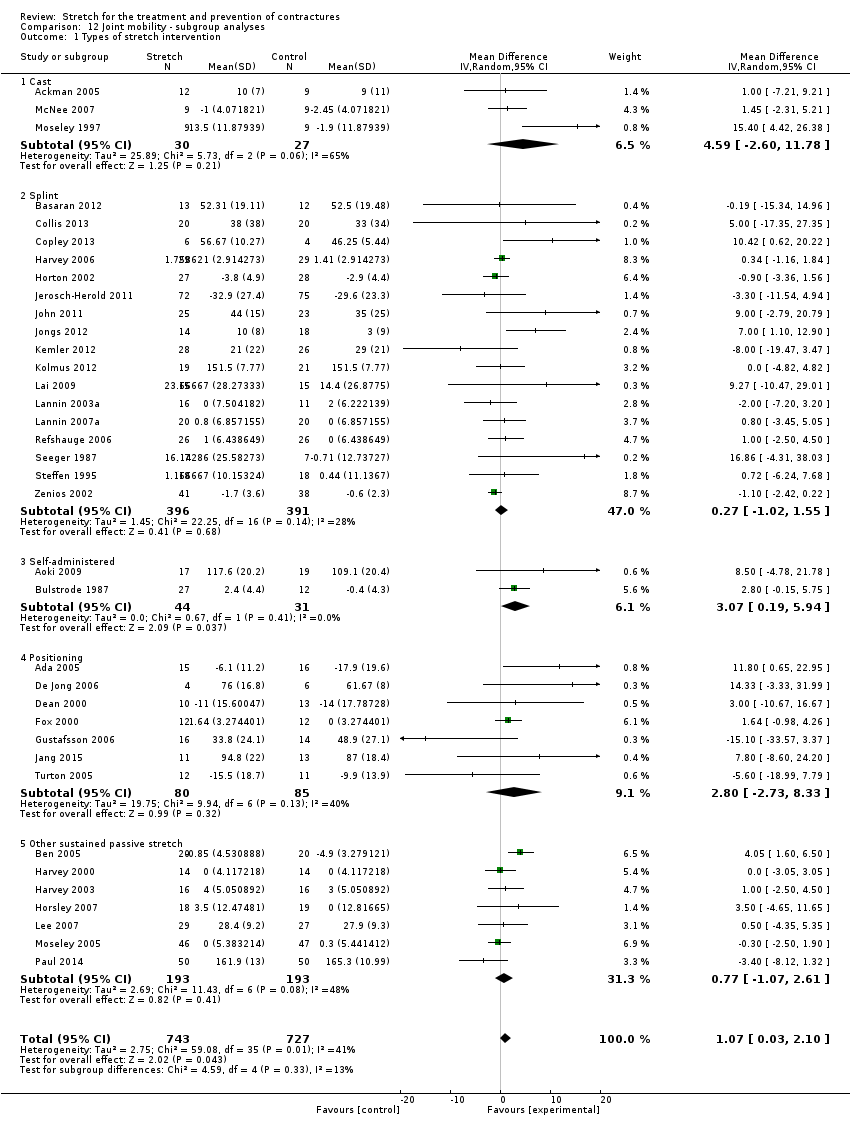
Comparison 12 Joint mobility ‐ subgroup analyses, Outcome 1 Types of stretch intervention.

Comparison 12 Joint mobility ‐ subgroup analyses, Outcome 2 Large versus small joints.
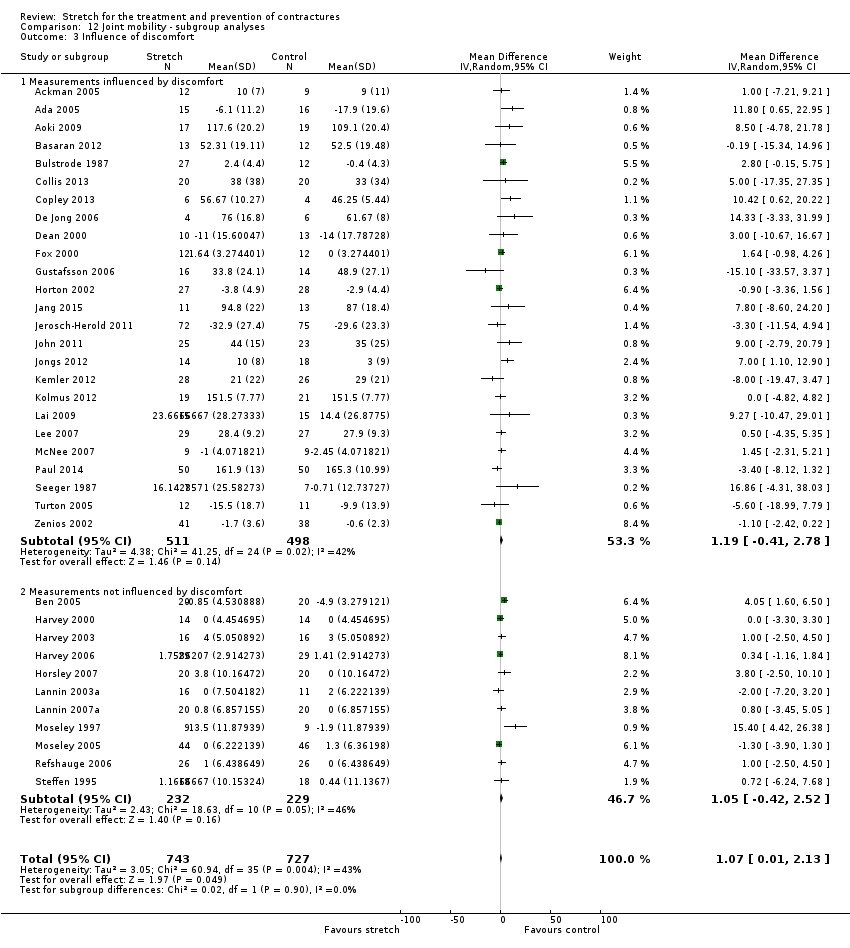
Comparison 12 Joint mobility ‐ subgroup analyses, Outcome 3 Influence of discomfort.

Comparison 12 Joint mobility ‐ subgroup analyses, Outcome 4 Joint mobility measured less than one day versus more than one day.
| Short‐term effects of stretch for the treatment and prevention of contractures | ||||||
| Patient or population: people with neurological conditions1 | ||||||
| Outcomes | Illustrative comparative risks* (95% CI) | Relative effect | No of participants | Quality of the evidence | Comments, summary statistics, NNTB and absolute risk difference (ARD) | |
| Assumed risk | Corresponding risk | |||||
| Control | Short‐term effects of stretch | |||||
| Joint mobility | Mean joint mobility in the control groups was 10°2 | The mean joint mobility in the intervention groups was 2° higher (0° to 3° higher) | 549 | ⊕⊕⊕⊕ | Absolute change = 1% better (0% to 2% better) Relative change = 2% better (0% to 3% better) | |
| Quality of life | No studies measured quality of life | Not estimable | Not estimable | Not estimable | Not measured | |
| Pain 10‐point VAS | The mean pain in the control group was 0.6 points on a 10‐point VAS4 | This translates to an absolute mean increase of 0.2 higher (‐0.1 to 0.6) points compared with control group on a 10‐point scale.5 | 174 | ⊕⊕⊝⊝ | SMD = 0.2 higher (0.1 lower to 0.5 higher) Absolute change = 2% worse (1% better to 6% worse) Relative change = 55% worse (28% better to 138% worse) | |
| Activity limitations 18‐point upper limb scale | The mean activity limitation in the control group was 0.9 points on an 18‐point upper limb scale7 | This translates to an absolute mean increase of 0.1 (‐0.1 to 0.3) points compared with control group on an 18‐point scale8 | 237 | ⊕⊕⊝⊝ | SMD = 0.2 higher (0.1 lower to 0.5 higher) Absolute change = 1% better (0% to 2% better) Relative change = 38% better (26% worse to 104% better) | |
| Participation restrictions | 1 study measured participation restrictions but it did not provide useable data | Not estimable | Not estimable | Not estimable | Not estimable | |
| Adverse events | Five studies involving 145 participants reported 8 adverse events that may have been related to the intervention. These included skin breakdown, bruising or blisters from plaster casts, and shoulder and wrist pain from stretches applied through positioning | Not estimable | Not estimable | Not estimable | Not estimable | |
| *The assumed risk (e.g. the mean control group risk across studies) is based on one representative study chosen on the basis of its size and susceptibility to bias. The corresponding risk (and its 95% CI) is based on the assumed risk in the comparison group and the relative effect of the intervention (and its 95% CI). | ||||||
| GRADE Working Group grades of evidence | ||||||
| 1 All the studies included in this review and included in the 'Summary of findings' outcomes included people with the following neurological conditions: stroke, Charcot‐Marie‐Tooth disease, acquired brain injury, spinal cord injury and cerebral palsy. The treatment effects were consistent across all types of neurological conditions except acquired brain injury (see Discussion). 2 Post data of the control group in Refshauge 2006 (the corresponding data in Analysis 1.1 is not raw data). 3 The quality of evidence was not downgraded due to risk of bias even though at least some of the included trials had selection, performance, detection, attrition and reporting bias. These types of bias would tend to exaggerate treatment effectiveness. Given this review did not demonstrate treatment effectiveness these forms of bias are probably not important. 4 Post data of the control group in Horsley 2007 (the corresponding data in Analysis 4.1 is not post data). 5 Calculations based on the control group baseline mean (SD) pain: 0.4 (1.1) points on a 0‐10 scale (from Horsley 2007). 6 The quality of the evidence was downgraded due to indirectness and imprecision. The downgrading for indirectness was because the results are only based on studies involving people with stroke and spinal cord injury thereby limiting their generalisability. The downgrading for imprecision was because the 95% CI is wide, particularly when the results are expressed as a relative % change (the 95% CI is narrow when the results are expressed as an absolute risk difference). 7 Post data of the control group in Horsley 2007 (the corresponding data in Analysis 6.1 is not post data). 8 Calculations based on the control group baseline mean (standard deviation) activity limitation: 0.3 (0.6) points on an 18‐point Upper Limb Activity scale (from Horsley 2007). 9 The quality of the evidence was downgraded due to indirectness and imprecision. The downgrading for indirectness was because the results are only based on studies involving people with stroke, cerebral palsy and Charcot‐Marie‐Tooth disease thereby limiting their generalisability. The downgrading for imprecision was because the 95% CI was wide particularly when the results are expressed as a relative % change (the 95% CI is narrow when the results are expressed as an absolute risk difference). | ||||||
| Short‐term effects of stretch for the treatment and prevention of contractures | ||||||
| Patient or population: people with non‐neurological conditions1 | ||||||
| Outcomes | Illustrative comparative risks* (95% CI) | Relative % change | No of Participants | Quality of the evidence | Comments, summary statistics and absolute risk difference | |
| Assumed risk | Corresponding risk | |||||
| Control | Short‐term effects of stretch | |||||
| Joint mobility Range of motion | The mean joint mobility in the control groups was 104°2 | This translates to an absolute mean increase of 1° higher (0° to 2° higher) compared with control group on a 90° scale3 | 865 | ⊕⊕⊕⊕ | SMD = 0.2 higher (0.0 to 0.3 higher) Absolute change = 1% better (0% to 2% better) Relative change = 1% better (0% to 2% better) | |
| Quality of life 160‐point Burn Specific Health Scale‐Brief questionnaire | The mean quality of life in the control group was 128 points on a 160‐point scale6 | This translates to an absolute mean increase of 3 (‐1 to 6) points compared with control group on a 160‐point scale7 | 97 | ⊕⊕⊕⊝ | SMD = 0.3 higher (0.1 lower to 0.7 higher) Absolute change = 2% better (1% worse to 4% better) Relative change = 2% better (1% worse to 5% better) | |
| Pain 10‐point VAS | The mean pain in the control group was 4 points on a 10‐point VAS10 | This translates to an absolute mean decrease of 0.2 (‐0.4 to 0.1) points compared with control group on an 10‐point scale11 | 422 | ⊕⊕⊕⊕ | SMD 0.2 lower (0.4 lower to 0.1 higher) Absolute change = 1% better (3% better to 1% worse) Relative change = 2% better (4% better to 1% worse) | |
| Activity limitations 100‐point Disabilities of the Arm, Shoulder and Hand questionnaire (lower score reflects better outcome) | The mean activity limitation in the control group was 7 points on a 100‐point upper limb scale12 | This translates to an absolute mean increase of 1.2 (‐2.2 to 4.5) points compared with control group on a 100‐point scale13 | 356 | ⊕⊕⊕⊕ | SMD = 0.1 higher (0.2 lower to 0.3 higher) Absolute change = 1% better (2% worse to 4% better) Relative change= 8% better (15% worse to 29% better) | |
| Participation restrictions 100 mm return to usual work activities VAS | The mean participant restriction in the control group was 39 points on a 100‐point VAS for return to work activities14 | This translates to an absolute mean decrease of 11 points (‐30 to 6) points compared with control group on a 100‐point scale15 | 129 | ⊕⊕⊝⊝ | SMD = 0.2 lower (0.6 lower to 0.1 higher) Absolute change = 12% worse (31% worse to 6% better) Relative change = 31% worse (79% worse to 17% better) | |
| Adverse events | Nine studies involving 635 participants reported 41 adverse events that may have been related to the intervention. These included transient numbness (n = 10), pain (n = 1), Raynauds’ phenomenon (n = 4), venous thrombosis (n = 1), need for manipulation under anaesthesia (n = 1), wound infections (n = 10), haematoma (n = 5), flexion deficits (n= 8) and swelling (n = 1). These were predominantly from splints | Not estimable | Not estimable | Not estimable | Not estimable | |
| *The assumed risk (e.g. the mean control group risk across studies) is based on one representative study chosen on the basis of its size and susceptibility to bias. The corresponding risk (and its 95% confidence interval) is based on the assumed risk in the comparison group and the relative effect of the intervention (and its 95% CI). | ||||||
| GRADE Working Group grades of evidence | ||||||
| 1 All the studies included in this review and included in the 'Summary of Findings' outcomes included people with the following non‐neurological conditions: frail elderly and people with ankle fracture, anklylosing spondylitis, oral submucous fibrosis, post‐radiation therapy to the breast, post‐radiation therapy to jaw, progressive systemic sclerosis, total knee replacement, arthritis, Dupuytren's contractures, shoulder adhesive capsulitis/frozen shoulder, hallux limitus, wrist fracture and burns. An additional study included in this review but not included in the 'Summary of Findings' outcomes included people following anterior cruciate ligament reconstruction. The treatment effects were consistent across all types of non‐neurological conditions. 2 Post data of the control group in Moseley 2005 (the corresponding data in Analysis 1.2 is not post data). 3 Calculations based on the control group baseline mean (SD) range of motion: 98.4 (5.5) points on a 90‐degree range of motion measure (from Moseley 2005). 4 The quality of evidence was not downgraded due to risk of bias even though at least some of the included trials had selection, performance, detection, attrition and reporting bias. These types of bias would tend to exaggerate treatment effectiveness. Given this review did not demonstrate treatment effectiveness these forms of bias are probably not important. 5 The quality of the evidence was not downgraded due to indirectness because the results are based on studies involving people with many different types of underlying conditions (e.g. arthritis, frail elderly,ankle fractures). 6 Post data of the control group in Kolmus 2012 (see Analysis 3.1). 7 Calculations based on the control group post mean (SD) quality of life: 123 (9) on the 160‐point Burn Specific Health Scale Brief (no study provided baseline mean (SD) data for quality of life) (from Kolmus 2012). 8 The quality of the evidence was not downgraded due to imprecision because the point estimate is reasonably precise if expressed as relative % change and absolute risk difference. 9 The quality of the evidence was downgraded due to indirectness because the results are based on only two studies involving people with burns and post radiation therapy to the breast thereby limiting their generalisability. 10 Post data of the control group in Paul 2014 (see Analysis 4.1). 11 Calculations based on the control group baseline mean (SD) pain: 8.0 (0.8) on a 10‐point pain scale (from Paul 2014). 12 Post data of the control group in Jerosch‐Herold 2011 (see Analysis 6.2). 13 Calculations based on the control group baseline mean (SD) activity limitation: 15.4 (13.2) on a 100‐point scale (from Jerosch‐Herold 2011). 14 Post data of the control group in Moseley 2005 (see Analysis 8.1). 15 Calculations based on the control group baseline mean (SD) participation restriction: 39.0 (54.1) on a 100‐point scale (from Moseley 2005). 16 The quality of the evidence was downgraded due to indirectness because the results are based on only two studies involving people with ankle and wrist fracture thereby limiting their generalisability. | ||||||
| Joint mobility ‐ neurological conditions | Pooled results | Randomisation (studies with adequate sequence generation) | Allocation (studies with concealed allocation) | Assessors (studies with blinded assessors) | Dropout rate (studies with ≤ 15% dropouts) |
| Short‐term effects following stretch | 2 ° (0 to 3) n = 18 | 2 ° (0 to 3) n = 16 | 1 ° (0 to 3) n = 15 | 2 ° (0 to 3) | 2 ° (0 to 3) n = 13 |
| Long‐term effects following stretch | 1 ° (‐1 to 3) n = 8 | 1 ° (‐3 to 4) n = 6 | 0 ° (‐2 to 2) n = 5 | 1 ° (‐2 to 3) n = 6 | 0 ° (‐2 to 2) n = 6 |
| Results are presented in degrees; mean (95% CI). n = number of studies included in analysis | |||||
| Joint mobility ‐ non‐neurological conditions | Pooled results | Randomisation (studies with adequate sequence generation) | Allocation (studies with concealed allocation) | Assessors (studies with blinded assessors) | Dropout rate (studies with ≤ 15% dropouts) |
| Short‐term effects following stretch | 1° (‐1 to 2) n = 16 | 1° (‐1 to 3) n = 9 | ‐1° (‐2 to 1) n = 8 | 1° (‐1 to 3) n = 12 | 0° (‐2 to 1) n = 10 |
| Long‐term effects following stretch | ‐1° (‐3 to 2) n = 5 | 0° (‐6 to 7) n = 3 | 1° (‐5 to 7) n = 3 | 0° (‐7 to 7) n = 3 | ‐1° (‐3 to 2) n = 5 |
| Results are presented in degrees; mean (95%CI). Studies in which data were no expressed in degrees were excluded from all analyses (Buchbinder 1993, Cox 2009 and Melegati 2003). n = number of studies included in analysis. | |||||
| Neurological conditions | Non‐neurological conditions | |||
| Short‐term | Long‐term | Short‐term | Long‐term | |
| Joint ROM | Ineffective1 – HIGH | Ineffective1 | Ineffective1 – HIGH | Ineffective1 |
| QOL | Not measured | Not measured | Ineffective2 – MOD | Not measured |
| Pain* | Uncertain ‐ LOW | Uncertain | Ineffective3 – HIGH | Uncertain |
| Spasticity* | Uncertain | Uncertain | Not relevant for people with non‐neurological conditions | Not relevant or people with non‐neurological conditions |
| Activity limitations | Uncertain – LOW | Uncertain | Uncertain ‐ HIGH | Uncertain |
| Participation restrictions | Not measured | Not measured | Uncertain ‐ LOW | Uncertain |
| * Negative value favours stretch Ineffective = the results rule out a clinically important treatment effect. The quality of the evidence for the short‐term effects was rated using GRADE and is indicated by high, moderate (mod) or low. GRADE was not used to rate the quality of evidence for the long‐term effects. 1 The results rule out a clinically important treatment effect of 5°. Results expressed as SMD were back converted to degrees (see summary of findings Table for the main comparison). 2 The results rule out a clinically important treatment effect equivalent to 10 points on a 160‐point scale, and an absolute change and relative change of 5% (see summary of findings Table 2). 3 The results rule out a clinically important treatment effect equivalent to 2 points on a 10‐point pain scale, and an absolute change and relative change of 5% (see summary of findings Table 2). 4 A meta‐analysis was not performed on the two studies because of clinical heterogeneity between studies (see Results). | ||||
| Outcome or subgroup title | No. of studies | No. of participants | Statistical method | Effect size |
| 1 Neurological conditions Show forest plot | 18 | 549 | Mean Difference (IV, Random, 95% CI) | 1.81 [0.45, 3.17] |
| 1.1 Stroke | 11 | 295 | Mean Difference (IV, Random, 95% CI) | 0.56 [‐1.56, 2.68] |
| 1.2 Charcot‐Marie‐Tooth disease | 2 | 82 | Mean Difference (IV, Random, 95% CI) | 2.27 [0.16, 4.38] |
| 1.3 Acquired brain injury | 3 | 35 | Mean Difference (IV, Random, 95% CI) | 8.48 [0.60, 16.36] |
| 1.4 Spinal cord injury | 4 | 137 | Mean Difference (IV, Random, 95% CI) | 1.42 [‐0.54, 3.37] |
| 2 Non‐neurological conditions Show forest plot | 18 | 865 | Std. Mean Difference (IV, Random, 95% CI) | 0.16 [‐0.00, 0.33] |
| 2.1 Frail elderly | 2 | 60 | Std. Mean Difference (IV, Random, 95% CI) | 0.23 [‐0.28, 0.74] |
| 2.2 Ankle fracture | 1 | 93 | Std. Mean Difference (IV, Random, 95% CI) | ‐0.05 [‐0.46, 0.35] |
| 2.3 Anklylosing spondylitis | 1 | 39 | Std. Mean Difference (IV, Random, 95% CI) | 0.63 [‐0.07, 1.32] |
| 2.4 Oral submucous fibrosis | 1 | 24 | Std. Mean Difference (IV, Random, 95% CI) | 0.83 [‐0.05, 1.72] |
| 2.5 Post‐radiation therapy to breast | 1 | 56 | Std. Mean Difference (IV, Random, 95% CI) | 0.05 [‐0.47, 0.58] |
| 2.6 Post‐radiation therapy to jaw | 1 | 14 | Std. Mean Difference (IV, Random, 95% CI) | 1.54 [0.25, 2.82] |
| 2.7 Progressive systemic sclerosis | 1 | 14 | Std. Mean Difference (IV, Random, 95% CI) | 0.78 [‐0.32, 1.88] |
| 2.8 Total knee replacement | 1 | 55 | Std. Mean Difference (IV, Random, 95% CI) | ‐0.19 [‐0.72, 0.34] |
| 2.9 Arthritis | 1 | 36 | Std. Mean Difference (IV, Random, 95% CI) | 0.41 [‐0.25, 1.07] |
| 2.10 Dupuytren's contractures | 3 | 226 | Std. Mean Difference (IV, Random, 95% CI) | 0.09 [‐0.27, 0.45] |
| 2.11 Shoulder adhesive capsulitis/frozen shoulder | 1 | 100 | Std. Mean Difference (IV, Random, 95% CI) | ‐0.28 [‐0.67, 0.11] |
| 2.12 Hallux limitus | 1 | 48 | Std. Mean Difference (IV, Random, 95% CI) | 0.43 [‐0.14, 1.01] |
| 2.13 Wrist fracture | 1 | 36 | Std. Mean Difference (IV, Random, 95% CI) | 0.24 [‐0.41, 0.90] |
| 2.14 Burns | 2 | 64 | Std. Mean Difference (IV, Random, 95% CI) | 0.14 [‐0.35, 0.63] |
| Outcome or subgroup title | No. of studies | No. of participants | Statistical method | Effect size |
| 1 Neurological conditions Show forest plot | 8 | 211 | Mean Difference (IV, Random, 95% CI) | 0.73 [‐1.37, 2.82] |
| 1.1 Stroke | 4 | 134 | Mean Difference (IV, Random, 95% CI) | ‐0.32 [‐4.09, 3.44] |
| 1.2 Cerebral palsy | 2 | 39 | Mean Difference (IV, Random, 95% CI) | 1.37 [‐2.05, 4.79] |
| 1.3 Spinal cord injury | 1 | 28 | Mean Difference (IV, Random, 95% CI) | 0.0 [‐3.05, 3.05] |
| 1.4 Acquired brain injury | 1 | 10 | Mean Difference (IV, Random, 95% CI) | 10.42 [0.62, 20.22] |
| 2 Non‐neurological conditions Show forest plot | 6 | 438 | Std. Mean Difference (IV, Random, 95% CI) | ‐0.10 [‐0.36, 0.16] |
| 2.1 ACL reconstruction | 1 | 36 | Std. Mean Difference (IV, Random, 95% CI) | 0.12 [‐0.54, 0.77] |
| 2.2 Ankle fracture | 1 | 90 | Std. Mean Difference (IV, Random, 95% CI) | ‐0.20 [‐0.62, 0.21] |
| 2.3 Total knee replacement | 1 | 79 | Std. Mean Difference (IV, Random, 95% CI) | ‐0.36 [‐0.80, 0.09] |
| 2.4 Dupuytren's contracture | 2 | 201 | Std. Mean Difference (IV, Random, 95% CI) | ‐0.19 [‐0.47, 0.09] |
| 2.5 Wrist fracture | 1 | 32 | Std. Mean Difference (IV, Random, 95% CI) | 0.80 [0.07, 1.52] |
| Outcome or subgroup title | No. of studies | No. of participants | Statistical method | Effect size |
| 1 Non‐neurological conditions Show forest plot | 2 | 97 | Std. Mean Difference (IV, Random, 95% CI) | 0.31 [‐0.09, 0.71] |
| 1.1 Post‐radiation therapy to breast | 1 | 57 | Std. Mean Difference (IV, Random, 95% CI) | 0.15 [‐0.37, 0.67] |
| 1.2 Burns | 1 | 40 | Std. Mean Difference (IV, Random, 95% CI) | 0.55 [‐0.08, 1.18] |
| Outcome or subgroup title | No. of studies | No. of participants | Statistical method | Effect size |
| 1 Neurological conditions Show forest plot | 5 | 174 | Std. Mean Difference (IV, Random, 95% CI) | 0.20 [‐0.10, 0.50] |
| 1.1 Stroke | 4 | 135 | Std. Mean Difference (IV, Random, 95% CI) | 0.31 [‐0.03, 0.66] |
| 1.2 Spinal cord injury | 1 | 39 | Std. Mean Difference (IV, Random, 95% CI) | ‐0.18 [‐0.81, 0.45] |
| 2 Non‐neurological conditions Show forest plot | 7 | 422 | Std. Mean Difference (IV, Random, 95% CI) | ‐0.17 [‐0.43, 0.10] |
| 2.1 Ankle fracture | 1 | 93 | Std. Mean Difference (IV, Random, 95% CI) | 0.0 [‐0.41, 0.41] |
| 2.2 Frail elderly | 1 | 24 | Std. Mean Difference (IV, Random, 95% CI) | ‐0.30 [‐1.10, 0.51] |
| 2.3 Post‐radiotherapy to breast | 1 | 55 | Std. Mean Difference (IV, Random, 95% CI) | ‐0.10 [‐0.63, 0.43] |
| 2.4 Arthritis | 1 | 36 | Std. Mean Difference (IV, Random, 95% CI) | ‐0.30 [‐0.96, 0.35] |
| 2.5 Shoulder adhesive capsulitis/frozen shoulder | 2 | 160 | Std. Mean Difference (IV, Random, 95% CI) | ‐0.20 [‐1.17, 0.78] |
| 2.6 Dupuytren's contracture | 1 | 54 | Std. Mean Difference (IV, Random, 95% CI) | ‐0.09 [‐0.62, 0.44] |
| Outcome or subgroup title | No. of studies | No. of participants | Statistical method | Effect size |
| 1 Neurological conditions Show forest plot | 4 | 132 | Std. Mean Difference (IV, Random, 95% CI) | 0.03 [‐0.41, 0.47] |
| 1.1 Stroke | 4 | 132 | Std. Mean Difference (IV, Random, 95% CI) | 0.03 [‐0.41, 0.47] |
| 2 Non‐neurological conditions Show forest plot | 2 | Mean Difference (IV, Random, 95% CI) | Totals not selected | |
| 2.1 Ankle fracture | 1 | Mean Difference (IV, Random, 95% CI) | 0.0 [0.0, 0.0] | |
| 2.2 Shoulder adhesive capsulitis | 1 | Mean Difference (IV, Random, 95% CI) | 0.0 [0.0, 0.0] | |
| Outcome or subgroup title | No. of studies | No. of participants | Statistical method | Effect size |
| 1 Neurological conditions Show forest plot | 7 | 237 | Std. Mean Difference (IV, Random, 95% CI) | 0.19 [‐0.13, 0.52] |
| 1.1 Stroke | 5 | 170 | Std. Mean Difference (IV, Random, 95% CI) | 0.27 [‐0.09, 0.63] |
| 1.2 Cerebral palsy | 1 | 37 | Std. Mean Difference (IV, Random, 95% CI) | 0.44 [‐0.21, 1.09] |
| 1.3 Charcot‐Marie‐Tooth disease | 1 | 30 | Std. Mean Difference (IV, Random, 95% CI) | ‐0.49 [‐1.21, 0.24] |
| 2 Non‐neurological conditions Show forest plot | 5 | 356 | Std. Mean Difference (IV, Random, 95% CI) | 0.09 [‐0.17, 0.34] |
| 2.1 Ankle fracture | 1 | 93 | Std. Mean Difference (IV, Random, 95% CI) | 0.10 [‐0.30, 0.51] |
| 2.2 Arthritis | 1 | 36 | Std. Mean Difference (IV, Random, 95% CI) | 0.47 [‐0.20, 1.13] |
| 2.3 Dupuytren's contracture | 1 | 151 | Std. Mean Difference (IV, Random, 95% CI) | ‐0.07 [‐0.39, 0.25] |
| 2.4 Wrist fracture | 1 | 36 | Std. Mean Difference (IV, Random, 95% CI) | ‐0.31 [‐0.97, 0.35] |
| 2.5 Burns | 1 | 40 | Std. Mean Difference (IV, Random, 95% CI) | 0.51 [‐0.12, 1.14] |
| Outcome or subgroup title | No. of studies | No. of participants | Statistical method | Effect size |
| 1 Neurological conditions Show forest plot | 6 | 191 | Std. Mean Difference (IV, Random, 95% CI) | 0.22 [‐0.11, 0.56] |
| 1.1 Stroke | 4 | 136 | Std. Mean Difference (IV, Random, 95% CI) | 0.14 [‐0.29, 0.58] |
| 1.2 Cerebral palsy | 2 | 55 | Std. Mean Difference (IV, Random, 95% CI) | 0.41 [‐0.17, 1.00] |
| 2 Non‐neurological conditions Show forest plot | 3 | 268 | Std. Mean Difference (IV, Random, 95% CI) | ‐0.09 [‐0.32, 0.15] |
| 2.1 Ankle fracture | 1 | 90 | Std. Mean Difference (IV, Random, 95% CI) | ‐0.07 [‐0.48, 0.35] |
| 2.2 Dupuytren's contracture | 1 | 146 | Std. Mean Difference (IV, Random, 95% CI) | ‐0.08 [‐0.41, 0.24] |
| 2.3 Wrist fracture | 1 | 32 | Std. Mean Difference (IV, Random, 95% CI) | ‐0.16 [‐0.86, 0.54] |
| Outcome or subgroup title | No. of studies | No. of participants | Statistical method | Effect size |
| 1 Non‐neurological conditions Show forest plot | 2 | 129 | Std. Mean Difference (IV, Random, 95% CI) | ‐0.22 [‐0.57, 0.12] |
| 1.1 Ankle fracture | 1 | 93 | Std. Mean Difference (IV, Random, 95% CI) | ‐0.31 [‐0.72, 0.10] |
| 1.2 Wrist fracture | 1 | 36 | Std. Mean Difference (IV, Random, 95% CI) | 0.0 [‐0.65, 0.65] |
| Outcome or subgroup title | No. of studies | No. of participants | Statistical method | Effect size |
| 1 Non‐neurological conditions Show forest plot | 2 | 122 | Std. Mean Difference (IV, Random, 95% CI) | ‐0.15 [‐0.60, 0.29] |
| 1.1 Ankle fracture | 1 | 90 | Std. Mean Difference (IV, Random, 95% CI) | 0.0 [‐0.41, 0.41] |
| 1.2 Wrist fracture | 1 | 32 | Std. Mean Difference (IV, Random, 95% CI) | ‐0.49 [‐1.20, 0.22] |
| Outcome or subgroup title | No. of studies | No. of participants | Statistical method | Effect size |
| 1 Neurological conditions Show forest plot | 6 | 144 | Std. Mean Difference (IV, Random, 95% CI) | 0.03 [‐0.30, 0.36] |
| 1.1 Stroke | 5 | 134 | Std. Mean Difference (IV, Random, 95% CI) | 0.05 [‐0.29, 0.39] |
| 1.2 Acquired brain injury | 1 | 10 | Std. Mean Difference (IV, Random, 95% CI) | ‐0.27 [‐1.55, 1.00] |
| Outcome or subgroup title | No. of studies | No. of participants | Statistical method | Effect size |
| 1 Neurological conditions Show forest plot | 3 | 73 | Std. Mean Difference (IV, Random, 95% CI) | ‐0.34 [‐0.81, 0.13] |
| 1.1 Stroke | 1 | 42 | Std. Mean Difference (IV, Random, 95% CI) | ‐0.50 [‐1.12, 0.11] |
| 1.2 Cerebral palsy | 1 | 21 | Std. Mean Difference (IV, Random, 95% CI) | 0.14 [‐0.73, 1.00] |
| 1.3 Traumatic brain injury | 1 | 10 | Std. Mean Difference (IV, Random, 95% CI) | ‐0.70 [‐2.03, 0.62] |
| Outcome or subgroup title | No. of studies | No. of participants | Statistical method | Effect size |
| 1 Types of stretch intervention Show forest plot | 36 | 1470 | Mean Difference (IV, Random, 95% CI) | 1.07 [0.03, 2.10] |
| 1.1 Cast | 3 | 57 | Mean Difference (IV, Random, 95% CI) | 4.59 [‐2.60, 11.78] |
| 1.2 Splint | 17 | 787 | Mean Difference (IV, Random, 95% CI) | 0.27 [‐1.02, 1.55] |
| 1.3 Self‐administered | 2 | 75 | Mean Difference (IV, Random, 95% CI) | 3.07 [0.19, 5.94] |
| 1.4 Positioning | 7 | 165 | Mean Difference (IV, Random, 95% CI) | 2.80 [‐2.73, 8.33] |
| 1.5 Other sustained passive stretch | 7 | 386 | Mean Difference (IV, Random, 95% CI) | 0.77 [‐1.07, 2.61] |
| 2 Large versus small joints Show forest plot | 36 | 1467 | Mean Difference (IV, Random, 95% CI) | 1.03 [‐0.02, 2.09] |
| 2.1 Large joints | 16 | 645 | Mean Difference (IV, Random, 95% CI) | 0.57 [‐0.89, 2.03] |
| 2.2 Small joints | 20 | 822 | Mean Difference (IV, Random, 95% CI) | 1.44 [‐0.11, 3.00] |
| 3 Influence of discomfort Show forest plot | 36 | 1470 | Mean Difference (IV, Random, 95% CI) | 1.07 [0.01, 2.13] |
| 3.1 Measurements influenced by discomfort | 25 | 1009 | Mean Difference (IV, Random, 95% CI) | 1.19 [‐0.41, 2.78] |
| 3.2 Measurements not influenced by discomfort | 11 | 461 | Mean Difference (IV, Random, 95% CI) | 1.05 [‐0.42, 2.52] |
| 4 Joint mobility measured less than one day versus more than one day Show forest plot | 34 | 1400 | Mean Difference (IV, Fixed, 95% CI) | 1.17 [0.50, 1.85] |
| 4.1 Less than one day | 28 | 1155 | Mean Difference (IV, Fixed, 95% CI) | 1.10 [0.20, 2.00] |
| 4.2 More than one day | 7 | 245 | Mean Difference (IV, Fixed, 95% CI) | 1.26 [0.24, 2.28] |