Эффективность снижения кровяного давления монотерапиией бета‐блокаторами ‐ частичными агонистами при первичной артериальной гипертензии
Abstract
Background
Partial agonists are a subclass of beta blockers used to treat hypertension in many countries. Partial agonist act by stimulating beta receptors when they are quiescent and blocking beta receptors when they are active. The blood pressure (BP) lowering effect of partial agonist beta blockers has not been quantified.
Objectives
To quantify the dose‐related effects of various partial agonists beta blockers on systolic blood pressure (SBP), diastolic blood pressure (DBP) and heart rate versus placebo in patients with primary hypertension.
Search methods
We searched the Hypertension Group Specialised Register, the Cochrane Central Register of Controlled Trials (CENTRAL), MEDLINE, MEDLINE In‐Process, EMBASE and ClinicalTrials.gov for randomized controlled trials up to October 2014. The WHO International Clinical Trials Registry Platform (ICTRP) is searched for inclusion in the Group's Specialised Register.
Selection criteria
Randomized double‐blinded placebo‐controlled parallel or cross‐over trials. Studies must contain a partial agonist monotherapy arm with fixed dose. Patients enrolled into the studies must have primary hypertension at baseline (defined as SBP/DBP > 140/90 mmHg). Duration of studies must be between three to 12 weeks.
Data collection and analysis
Two authors (GW and HB) confirmed the inclusion of studies and extracted the data independently.
Main results
Thirteen randomized double‐blinded placebo‐controlled trials that examined the blood pressure lowering efficacy of six partial agonists in 605 hypertensive patients were included in this review. Five of the included studies were parallel studies and the other eight were cross‐over studies. The overall risk of bias is high in this review due to the small sample size and high risk of detection bias. Pindolol, celiprolol and alprenolol lowered SBP and DBP compared to placebo. Acebutolol lowered SBP but there was no clear evidence that it lowered DBP. There was no clear evidence that pindolol and oxprenolol lowered SBP or DBP. Other than for celiprolol, sample sizes were generally small increasing the uncertainty in findings for individual agents versus placebo. In patients with moderate to severe hypertension, partial agonists (considered as a subclass) lowered peak BP by an average of 8 mmHg systolic (95% CI, ‐10 to ‐6, very low quality evidence), 4 mmHg diastolic (95%CI, ‐5 to ‐3, very low quality evidence) and reduced heart rate by five beats per minute (95%CI, ‐6 to ‐4, very low quality evidence). Higher dose partial agonists did not appear to provide additional BP lowering effects compared to lower dose. The maximum BP lowering effect of the overall subclass occurred at the starting dose. Partial agonists reduced pulse pressure by 4 mmHg (95% CI, ‐5 to ‐2, very low evidence). Only one study reported withdrawal due to adverse effects, the risk ratio (95% confidence interval) was 0.72 (0.07, 7.67).
Authors' conclusions
There was very low quality evidence that in patients with moderate to severe hypertension, partial agonists lowered peak BP by an average of 8/4 mmHg and reduced heart rate by five beats per minute. There was no evidence of a greater effect at doses higher than the initial doses. This estimate was probably exaggerated as it was subject to a high risk of bias. Based on the indirect comparison of the results in this review and two Cochrane reviews on angiotensin‐converting‐enzyme (ACE) inhibitors and angiotensin receptor blockers (ARBs), which also used similar inclusion criteria as this review, the BP lowering effect appeared to be less than the effect in patients with mild to moderate elevated BP who were taking ACE inhibitors and ARBs based on an indirect comparison. Withdrawals due to adverse effects were only reported in one trial so it is impossible to assess the harm of these drugs.
PICO
Резюме на простом языке
Частичные агонисты для лечения высокого кровяного давления.
Актуальность
Частичные агонисты это подкласс бета‐блокаторов, используемых для лечения высокого кровяного давления. Препараты, которые принадлежат к этому классу, включали ацебутолол (Sectral), пиндолол (Visken) и целипролол (Cardem). Мы исследовали, насколько это класс препаратов снижает артериальное давление.
Характеристика исследований
Мы разработали всеобъемлющую стратегию поиска, чтобы провести поиск по соответствующим научным базам данных для клинических испытаний, и нашли 13 испытаний, в которых рандомизировали 605 пациентов с высоким кровяным давлением в группу лечения фиксированной дозой частичных агонистов или в группу плацебо в течение периода времени длительностью до 12 недель.
Основные результаты
В среднем, частичные агонисты снижали артериальное давление на восемь пунктов систолического и четыре пункта диастолического давления у пациентов с умеренной и тяжелой артериальной гипертензией. Мы не нашли каких‐либо доказательств, свидетельствующих, что дозы превышающие рекомендуемые начальные дозы, будут дополнительно снижать кровяное давление. В среднем, частичные агонисты снижали пульсовое давление на 4 мм рт.ст. Во включенных исследованиях в целом не сообщали о побочных эффектах, достаточно серьезных, чтобы они приводили к прекращению лечения. Не было ясно, вызывают ли частичные агонисты больше достаточно серьезных побочных эффектов, которые приводят к отказу от лечения, по сравнению с плацебо.
Качество доказательств
Качество доказательств является очень низким из‐за небольшого размера выборки и высокого риска смещения.
Authors' conclusions
Summary of findings
| Blood pressure lowering effects of partial agonists compared with placebo for primary hypertension | |||
| Patient or population: Adults with primary hypertension Intervention: Partial agonists Comparison: Placebo | |||
| Outcomes | Mean estimates of 1x and 2x starting dose | No of Participants | Quality of the evidence |
| Decrease in systolic blood pressure | ‐8.1 [‐10.1 to ‐6.1]1,2,3,4 | 490 (10) | Very low5,6,7 |
| Decrease in diastolic blood pressure | ‐4.0 [‐5.1 to ‐2.9]1,2,3,4 | 490 (10) | Very low5,6,7 |
| Decrease in heart rate | ‐4.9 [‐6.2 to ‐3.7]2,3 | 256 (7) | Very low5,6,7 |
| Decrease in pulse pressure | ‐3.6 [‐5.3 to ‐1.9]1,2 | 490 (10) | Very low5,6,7,8 |
| Withdrawal due to adverse effect | RR [95%CI]: 0.72 [0.07 to 7.67]9 | 117 (1) | Very low5,6,10 |
| 95% CI: 95% confidence interval; RR: relative risk | |||
| GRADE Working Group grades of evidence | |||
| Footnotes | |||
|
| |||
Background
Description of the condition
Elevated blood pressure is a highly prevalent condition that is associated with an increased risk of adverse cardiovascular events including stroke, myocardial infarction, congestive heart failure and renal failure. Antihypertensive drug treatment has been shown to reduce the incidence of these adverse events. There are a number of classes of antihypertensive drugs used to treat elevated blood pressure. Beta adrenergic receptor blockers (beta blockers) are one of these classes of drugs.
Description of the intervention
Beta‐blockers were originally marketed and used to treat angina. During their use in angina patients, it was discovered that they also lower blood pressure. Since then, they have received clinical attention because of their proven effectiveness for certain arrhythmias and to prevent recurrence in patients who have had a myocardial infarction.
Five previous published systematic reviews are relevant to this proposed review. Wright 2000 assessed the mortality and morbidity associated with different types of beta blockers. He found that patients treated with non‐selective beta blockers post myocardial infarction had a statistically significant reduction in total mortality as compared to placebo, whereas those treated with beta1‐selective beta blockers or partial agonist beta‐blockers did not. A recent review assessed the effects of beta adrenergic blocking agents on morbidity and mortality in adults with hypertension (Wiysonge 2007). This review concluded that beta blockers are not the best class of drugs to use as first‐line antihypertensive therapy. However, it is possible that these findings were related to beta1‐selective beta blockers, as atenolol was the beta‐blocker used in 75% of the trials.
Two systematic reviews have assessed the effects of beta‐blockers on blood pressure. A Cochrane systematic review on beta blockers in hypertension during pregnancy (Magee 2003) showed that oral beta‐blockers decrease the incidence of severe hypertension and the need for additional antihypertensive therapy. A systematic review of the dose‐response blood pressure lowering effect of beta blocker drugs and other antihypertensive drugs (Law 2005) did not differentiate between the different classes of beta‐blockers. Finally, a systematic review of the blood pressure lowering efficacy of beta‐blockers as a second‐line drug also did not differentiate between the different classes of beta‐blockers (Chen 2010).
How the intervention might work
Beta adrenergic receptors are present in many body systems including the heart, blood vessels, kidneys, and nervous system. At the present time, the mechanism whereby beta‐blockers lower blood pressure is not known, though many hypothetical mechanisms have been proposed. Beta blockers could lower blood pressure by decreasing cardiac output, reducing renin production, modulating the sympathetic nervous system or other mechanisms. It is likely to be a combination of mechanisms that lead to the blood pressure lowering effect.
Beta‐blockers were designed to competitively inhibit adrenergic beta receptors, thus modulating sympathetic nervous system activity. There are three main classes of beta receptors; beta‐1, beta‐2 and beta‐3. Currently, there are no known selective antagonists for beta‐3 receptors. Some beta blockers have partial agonist activity. The main effect of partial agonists is inhibition during beta‐receptors stimulation, and activation when the beta receptors are quiescent. Drugs in this class can be non‐selective or beta‐1 selective but do not cause any alpha blocking effects.
Why it is important to do this review
Since it is probable that beta blockers with different mechanisms of action have different effects to reduce morbidity and mortality, it is crucial to determine whether they have different abilities to lower blood pressure. No published review has compared the blood pressure lowering effect of beta blockers based on their mechanism of action. If beta blockers with different beta receptor selectivity lower blood pressure differently, it would provide useful information towards understanding the mechanism by which they lower blood pressure.
Furthermore, since blood pressure measurements are used on a daily basis by physicians managing patients with high blood pressure, it is important to accurately assess the magnitude of blood pressure lowering effects of beta blockers, both individually and as a subclass. The results from this review will be compared to the reviews of the non‐selective beta blockers and the beta‐1 selective beta blockers. The information found in this review will be useful for clinicians, researchers designing future drug trials and authors of other systematic reviews.
Objectives
Primary objective
To quantify the dose‐related effects and types of partial agonist beta adrenergic receptor blockers (partial agonists) on systolic and diastolic blood pressure versus placebo in patients with primary hypertension.
Secondary objectives
To determine dose‐related effects of partial agonist on variability of blood pressure; pulse pressure, heart rate and withdrawals due to adverse effects (WDAEs).
-
To determine dose‐related effects of partial agonist beta adrenergic receptor blockers on variability of blood pressure.
-
To determine dose‐related effects of partial agonist beta adrenergic receptor blockers on pulse pressure.
-
To quantify dose‐related effects of partial agonist beta adrenergic receptor blockers on heart rate.
-
To quantify the effects of partial agonist beta adrenergic receptor blockers at different doses on WDAEs.
Methods
Criteria for considering studies for this review
Types of studies
Study design must meet the following criteria:
-
placebo‐controlled;
-
random allocation to beta adrenergic receptor blocker group and placebo group;
-
parallel or cross‐over design;
-
double blinded;
-
duration of follow‐up of at least three weeks;
-
blood pressure measurements at baseline (following washout) and at one or more time points between three to 12 weeks after starting treatment.
Types of participants
Participants must have a baseline blood pressure of at least 140 mmHg systolic and/or a diastolic blood pressure of at least 90 mmHg, measured in a standard way. Patients must not have creatinine levels greater than 1.5 times the normal level. Participants must not be restricted by age, gender, baseline risk or any other co‐morbid conditions.
Types of interventions
Fixed‐dose monotherapy with any beta adrenergic receptor blocker that has partial agonist activity, including acebutolol, celiprolol, oxprenolol, pindolol, alprenolol and bopindolol.
Data from trials in which titration to a higher dose was based on blood pressure response were not eligible.
Types of outcome measures
Primary outcomes
Change in trough (13 to 26 hours after the dose) and/or peak (one to 12 hours after the dose) systolic and diastolic blood pressure compared to placebo. If blood pressure measurements were available at more than one time point, the weighted means of blood pressures taken in the three to 12‐week range were used.
Secondary outcomes
-
Change in standard deviation compared to placebo.
-
Change in pulse pressure compared to placebo.
-
Change in heart rate compared to placebo.
-
Number of patients who withdraw due to adverse events (WDAE) compared to placebo.
Search methods for identification of studies
The Database of Abstracts of Reviews of Effects (DARE) was searched for related reviews. Previously published meta‐analyses on dose‐response of beta adrenergic receptor blockers were used to help identify references to trials.
The Hypertension Group Specialised Register, the Cochrane Central Register of Controlled Trials (CENTRAL) (2014, Issue 9), MEDLINE (1946 ‐ October 2014), EMBASE (1974 ‐ October 2014) and ClinicalTrials.gov (all years to October 2014) were searched for randomized controlled trials. No language restrictions were applied. The WHO International Clinical Trials Registry Platform (ICTRP) is searched for inclusion in the Group's Specialised Register.
A modified, expanded version of the standard search strategy of the Hypertension Group with additional terms related to beta adrenergic receptor blockers in general and all the specific drugs listed above was used to identify the relevant articles. The MEDLINE strategy (Appendix 1) was translated into CENTRAL (Appendix 2), EMBASE (Appendix 3), ClinicalTrials.gov (Appendix 4), and the Hypertension Group Specialised Register (Appendix 5).
The initial search of all the databases was performed to identify citations with potential relevance. The initial screen of these abstracts excluded articles whose titles and/or abstracts were clearly irrelevant. The full text of remaining articles were retrieved (and translated into English where required). The bibliographies of pertinent articles, reviews and texts were searched for additional citations. Two review authors independently assessed the eligibility of the trials using a trial selection form. A third review author resolved discrepancies.
Data collection and analysis
Selection of studies
References and abstracts of search results were imported to Reference Manager 11 software. Selection of studies was based on the criteria listed above.
Data extraction and management
Two review authors independently extracted data using a standard form, and then cross‐checked the results. All numeric calculations and graphic interpolations were confirmed by a second person.
Assessment of risk of bias in included studies
Standard quality measures were not useful to distinguish between trials meeting the strict entry criteria of this review (Jadad 1996). We assessed the risk of bias for each trial using 'Risk of bias' tables.
Measures of treatment effect
The position of the patient during blood pressure measurement may affect the blood pressure lowering effect. However, in order not to lose valuable data if only one position was reported, data from that position were collected. When blood pressure measurement data were available from more than one position, sitting blood pressure was the first preference. If both standing and supine data were available, standing blood pressure data were used.
Dealing with missing data
Attempts were made to contact study authors for missing information in the included studies (using email, letter and/or fax).
In the case of missing standard deviation of the change in blood pressure, the standard deviation was imputed based on the information in the same trial or from other trials using the same drug. We used the following hierarchy (listed from high to low preference) to impute standard deviation values:
-
Standard deviation of change in blood pressure taken in a different position than that of the blood pressure data used
-
Standard deviation of blood pressure at the end of treatment
-
Standard deviation of blood pressure at the end of treatment measured in a different position than that of the blood pressure data used
-
Standard deviation of blood pressure at baseline (except if this measure is used for entry criteria)
-
Mean standard deviation of change in blood pressure from other trials using the same drug
Assessment of heterogeneity
Test for heterogeneity of treatment effect between the trials was made using a standard chi‐square statistic for heterogeneity. The fixed‐effect model was applied to obtain summary statistics of pooled trials, unless significant between‐study heterogeneity was present, in which case the random‐effects model was used.
Data synthesis
Data synthesis and analyses were carried out using the Cochrane Review Manager software, RevMan 5.3.
Data for changes in blood pressure and heart rate were combined using the mean difference with 95% confidence intervals (CIs). The WDAEs were analyzed using risk ratio. We planned to report risk difference, and number needed to treat or to harm when it was appropriate.
When the generic inverse variance method was used to incorporate cross‐over trials into meta‐analysis, the formula listed in Cochrane Handbook for Systematic Reviews of Interventions, section 16.4.6.1 (Higgins 2011) was used to calculate the standard deviation of difference between treatment and placebo. The standard error and sample sizes shown in the data analysis tables were unadjusted for subgroup comparison in order to minimize the lose of statistical power for the estimates. If necessary, the standard error would have been adjusted in dose‐response analysis for studies containing multiple dosage subgroups in order to avoid double counting of patients.
Subgroup analysis and investigation of heterogeneity
If possible, we planned to include the following subgroup analyses.
-
Different regimens of the same active chemical entity
-
Gender, age and race
-
Co‐morbid conditions: ischemic heart disease, peripheral vascular disease, diabetes
-
Baseline severity of hypertension: mild, moderate, or severe
Sensitivity analysis
We planned to test the robustness of the results using the following sensitivity analyses.
-
Trials that are industry‐sponsored versus non‐industry sponsored
-
Trials with blood pressure data measured in the sitting position versus other measurement positions
-
Trials with reported standard deviations of blood pressure change versus imputed standard deviations
Results
Description of studies
Please refer to Characteristics of included studies and Characteristics of excluded studies.
Results of the search
In order to save time and effort, a comprehensive search strategy (Appendix 1; Appendix 2; Appendix 3; Appendix 4) was developed so that all four subclasses of beta blockers were searched simultaneously. All four beta blocker reviews (Wong 2008 (alpha and beta blockers); Wong 2008 (beta‐1 blockers); Wong 2014) used the same study inclusion criteria. Citations were then sorted according to their respective subclasses afterward. Please refer to Figure 1 for the flow of study selection. The search was first run in May 2010, and subsequent searches have been performed up to October 2014. A total of 22,195 citations were identified in all searches since May 2010, of which 8353 were confirmed to be duplicates. The reviewers then screened 13,842 titles and abstracts, of which 13,229 citations were excluded. Six‐hundred and thirteen citations were judged to potentially meet the inclusion criteria based on title and abstract. These were retrieved for detailed review. Four‐hundred and eighty full text articles did not meet our inclusion criteria and were excluded. One citation was a separate publication of the same trial. One‐hundred and thirty two trials met our inclusion criteria but 116 of them were excluded because they studied other subclasses of beta blockers, but not partial agonists. Three studies were excluded for reasons listed in the Characteristics of excluded studies table. Thirteen trials were included for the partial agonist review.

Study flow diagram
Included studies
Please refer to the Characteristics of included studies table for detailed descriptions of each included study. We included 13 studies examining the blood pressure lowering efficacy of six partial agonists in 612 hypertensive patients. Six hundred and five of 612 patients randomized to placebo or partial agonist mono therapy, completed the studies. Five of the 13 included studies were parallel studies and the other eight were cross‐over studies. The duration of most of the included studies was four weeks. The average age of the participants was 52 and weighted mean baseline BP was 174.9/106.7 mmHg. Seven of the nine included studies that provided baseline BP had a baseline BP over 160/100 mmHg, therefore most of the patients included in these studies had moderate to severe hypertension. The baseline characteristic of partial agonist studies was different from the patient populations included in most trials in the other beta blocker reviews (Wong 2008 (alpha and beta blockers); Wong 2008 (beta‐1 blockers); Wong 2014), which were mild hypertensive patients.
Celiprolol was the most studied drug in this class with the largest sample size. Only two of the 13 included studies specified the time (peak or trough) when BP was measured. Vandongen 1986 measured BP at peak (zero to 12 hours after dose) and Watson 1980 measured at trough (13 to 20 hours after dose). The medications were either taken multiple times a day or in the morning, therefore it should be reasonable to assume that most of the studies measured BP at peak hours.
Excluded studies
Please refer to Characteristics of excluded studies for detailed description of reasons for exclusion. Three studies that met the inclusion criteria were excluded from this review. The reasons for exclusion were lack of useful information (SBP and DBP data were not reported), adjustment of treatment according to BP and lack of randomization in the placebo group.
Risk of bias in included studies
Figure 2 shows the 'Risk of bias' summary of each included study.

'Risk of bias' summary: review authors' judgements about each risk of bias item for each included study
Allocation
The procedure of randomization was poorly reported in most studies. We examined the baseline characteristics of each group in parallel studies. The baseline BP was significantly different in Motolese 1975 between the groups. This raised the concern about selection bias. This issue was mentioned in the discussion. We did not find any reason to suspect that high risk of selection bias in any other studies. In cross‐over studies, information was not sufficient to make any judgment on selection bias.
Blinding
Beta blockers generally lowered heart rate. For this reason, blinding could be compromised if the investigators had used mercury sphygmomanometer to measure blood pressure. Only one study used an automated machine which would mitigate the risk of detection bias (Vandongen 1986). The risk of detection bias remained high in this review.
Incomplete outcome data
Blood pressure and heart rate were reported by all the included studies. Due to the short duration of the studies, the dropout rate was low. Most of the patients randomized were included into the analyses. We judged that the risk of attrition bias was low.
Selective reporting
SBP and DBP were reported in all the included studies. They were reported as the end treatment values for each intervention group. Some of the studies did not report heart rate. The difference in the effect on heart rate compared to non‐selective beta blockers could potentially distinguish partial agonists from other classes. Failure to report heart rate could be an indication of potential bias in reporting.
Although the dropout rate was low, only one study reported withdrawals due adverse effects (WDAEs). The overall subclass assessment of adverse effects serious enough to cause withdrawal could not be done due to lack of data. WDAE is an important outcome to assess drug tolerability, particularly in short‐term studies. The selective reporting of WDAE raises concern about the risk of reporting bias.
Effects of interventions
See: Summary of findings for the main comparison
All results have been rounded up to whole number because it is not clinical meaningful to report blood pressure measure in two decimal places.
Acebutolol
Acebutolol is indicated for treatment of hypertension and ventricular arrhythmia in Canada (eCPS), the United States of America (USA) (FDA) and the European Union (EU) (EMC). The recommended dose for acebutolol in Canada to treat hypertension is 100 to 400 mg twice daily (eCPS).
Three studies examining the blood pressure lowering efficacy of acebutolol in 85 participants were included. Forette 1979 and Watson 1980 were cross‐over studies, Hansson 1977 was a parallel study. Only 400 mg/day acebutolol was studied with a treatment duration ranging from four to eight weeks. The mean baseline BP for acebutolol studies was 176/113 mmHg.
Please refer to Analysis 1.1 to Analysis 1.4 for results of acebutolol. Based on available data, acebutolol 400 mg/day lowered SBP by ‐5 mmHg [95% CI, ‐9 to ‐1], but did not significantly lower DBP compared to placebo (‐2 mmHg [95% CI, ‐4 to 0]). Acebutolol 400 mg/day lowered heart rate by ‐9 BPM [‐11 to ‐7] compared to placebo but did not significantly change pulse pressure (‐2 mmHg [95% CI, ‐5 to 1]).
Pindolol
Pindolol is indicated for treatment of hypertension and angina pectoris in Canada and the EU (eCPS; EMC), and only for hypertension in the USA (FDA).The recommended dose for pindolol in Canada to treat hypertension is 5 mg twice daily to 15 mg three times daily (eCPS) Three studies examining blood pressure lowering efficacy of 10 and 30 mg/day pindolol in 50 hypertensive patients were included. Forty‐five of 50 randomized patients completed the studies. All of the pindolol studies were cross‐over studies with a duration ranging from three to eight weeks. Only one study provided baseline DBP information, which was 93 mmHg.
Please refer to Analysis 2.1 to Analysis 2.4 for results of pindolol. Pindolol 10 mg/day significantly lowered SBP (‐14 mmHg [95% CI, ‐20 to ‐9]), DBP (‐7 mmHg [95% CI, ‐10 to ‐4]) and heart rate (‐6 BPM [95% CI, ‐10 to ‐2]) compared to placebo. At 30 mg/day, pindolol significantly lowered SBP (‐13 mmHg [95% CI, ‐20 to ‐5]) and DBP (‐9 mmHg [95% CI, ‐15 to ‐3]). Heart rate was not reported for 30 mg/day. Indirect comparison did not find any significant difference in SBP and DBP between 10 mg/day and 30 mg/day pindolol. Pindolol 10 mg/day significantly lowered pulse pressure compared to placebo. However, 30 mg/day pindolol did not significantly change pulse pressure.
Celiprolol
Celiprolol is indicated for treatment of hypertension in the EU. It is not available in Canada or the USA. The recommended dose for celiprolol to treat hypertension is 200 to 400 mg once daily (EMC). Three studies examining the blood pressure lowering efficacy of 200 to 600 mg/day celiprolol in 267 hypertensive patients were included in this analysis. Two of the randomised controlled trials were parallel studies and the other one was a cross‐over study. These studies had a duration ranging from four to 12 weeks. Mean baseline BP for the celiprolol studies was 163/100 mmHg.
Please refer to Analysis 3.1 to Analysis 3.4 for celiprolol results. All three doses of celiprolol significantly lowered both SBP and DBP compared to placebo. Celiprolol 200 mg/day, which contained the largest sample size, lowered SBP by ‐8 mmHg [95% CI, ‐12 to ‐4] and DBP by ‐5 mmHg [ 95% CI, ‐7 to ‐3]. The direct comparisons of dose effect did not find a significant difference between 200 mg/day and 400 mg/day in both SBP and DBP (Analysis 3.5; Analysis 3.6). The overlapping 95% CIs are consistent with such findings. Trafford 1989 was the only study that reported information on heart rate in celiprolol. Celiprolol 200 mg/day and 400 mg/day did not significantly lowered heart rate compared to placebo. Celiprolol 200 mg/day was the only subgroup that significantly lowered pulse pressure compared to placebo.
Alprenolol
Alprenolol is not available in Canada, the USA or the EU. We did not find the product monograph from these government agencies, therefore we were unable to provide the indication and recommended dosage for alprenolol. Two studies examining the blood pressure lowering efficacy of 400 mg/day alprenolol in 27 hypertensive patients were included in this analysis. Both of the studies were cross‐over studies with a duration ranging from eight to 10 weeks. Alprenolol 400 mg/day significantly lowered SBP (‐17 mmHg [95% CI, ‐24 to ‐10]), DBP (‐7 mmHg [95% CI, ‐10 to ‐3]), heart rate (‐8 BPM [95% CI, ‐15 to ‐1]) and pulse pressure (‐9 mmHg [95% CI, ‐15 to ‐3]) compared to placebo. Please refer to Analysis 4.1 to Analysis 4.4 for alprenolol results.
Bopindolol
Bopindolol is not available in Canada, the USA or the EU. We did not find the product monograph of bopindolol from any government agencies therefore we cannot provide the indication and recommended dosage for bopindolol. Bopindolol is a prodrug of pindolol with an ester. One parallel study examining blood pressure lowering efficacy of 0.5 to 2 mg once daily bopindolol for four weeks in 117 hypertensive patients was included in this review. A hundred and fifteen out of 117 randomized patients completed the study.
Please refer to Analysis 5.1 to Analysis 5.4 for bopindolol hemodynamic results. Bopindolol, in all doses, did not significantly lower SBP or DBP compared to placebo. Bopindolol 1 mg/day and 2 mg/day significantly lowered heart rate compared to placebo. Bopindolol did not significantly change pulse pressure compared to placebo in all doses tested.
Withdrawal due to adverse effects (WDAE)
Moleur 1988 was the only study that reported usable WDAE data in this review. Bopindolol was not significantly different from placebo in terms of WDAE (RR 0.72 [0.07, 7.67]) (Analysis 5.5).
Oxprenolol
Oxprenolol is not available in Canada, the USA or the EU. It was indicated for the treatment of hypertension in the EU. When it was available in the EU, the recommended dose of oxprenolol for treatment of hypertension was 80 to 320 mg once daily (EMC). One parallel study examining blood pressure lowering efficacy of 20 to 80 mg once daily oxprenolol in 66 hypertensive patients for four weeks was included in this review.
Please refer to Analysis 6.1 to Analysis 6.2 for oxprenolol hemodynamic results. Oxprenolol at 60 and 80 mg/day (the starting dose) significantly lowered SBP (‐12 mmHg [95% CI, ‐22 to ‐1]) compared to placebo. No other doses of the oxprenolol significantly lowered SBP or DBP compared to placebo. Motolese 1975 did not report any data on heart rate. Oxprenolol did not significantly change pulse pressure in any dose subgroup.
Pooled effects of partial agonists
We pooled the results of partial agonists based on the manufacturer's recommended starting doses (Analysis 7.1; Analysis 7.2; Analysis 7.3; Analysis 7.4). This allowed us to analyze the effects of partial agonists as a whole subclass. summary of findings Table for the main comparison summarizes the overall results in SBP, DBP, heart rate and pulse pressure.
Partial agonists in 0.25x and 0.5x starting dose contained little data and generally did not significantly lower SBP or DBP compared to placebo, although the 0.5x starting dose subgroup showed a marginally significant result. Starting from the recommended starting dose, partial agonists significantly lowered SBP and DBP compared to placebo. Test for subgroup differences within the recommended dose range (1x, 2x and 4x the starting dose) by the direct comparison method was not significant for SBP (P = 0.84) or DBP (P = 0.74). This suggested that higher‐dose partial agonists did not offer greater BP lowering effect compared to the recommended starting dose of partial agonists. When we combined the starting dose and twice the starting dose subgroups (Analysis 7.6), partial agonists lowered SBP by 8 mmHg [95% CI, ‐10 to ‐6] and DBP by 4 mmHg [95% CI, ‐5 to ‐3].
The recommended starting dose of partial agonists was the only dose that significantly lowered heart rate compared to placebo. Test for subgroup differences for heart rate using a direct comparison method was not significant. We calculated the pulse pressure by subtracting DBP from SBP. Partial agonists at starting and 2x starting doses significantly lowered pulse pressure. The combined effect of starting and twice starting dose for pulse pressure was ‐4 mmHg [95% CI, ‐5 to ‐2]; 4x starting dose subgroup showed similar point estimate but the 95% CI was wide and not statistically significant.
Only one study (bopindolol) reported WDAE (Moleur 1988). Bopindolol was not significantly different compared to placebo in terms of WDAE. It is a small study with 117 patients taking beta blockers for four weeks. We did not find any data on WDAE for other partial agonists.
Blood pressure variability
We tested the BP variability by paired t‐test comparing the standard deviations of the partial agonist group and the placebo group. The average end treatment standard deviation of SBP in partial agonist group was 16.3 and in placebo group was 14.8. The average SD of DBP for the treatment group was 8.4 and placebo group was also 8.4. The P value for the paired t‐test for SBP was 0.02 and for DBP was 0.64. The results suggested that partial agonists might increase the variability of SBP but not DBP. We only included a small sample of nine end‐treatment standard deviations for each group. Therefore, more data are needed in order to answer this question.
Subgroup and sensitivity analysis
Due to lack of data and small sample size, we were not able to perform any of the subgroup or sensitivity analyses.
Discussion
Summary of main results
Celiprolol was the most studied partial agonist in this review. The blood pressure (BP) and heart rate lowering profile of celiprolol reflected the effects that were expected from a partial agonist. Celiprolol significantly lowered SBP and DBP compared to placebo while having no significant effect on heart rate. We did not find a significant dose‐response effect between celiprolol 200 mg/day and 400 mg/day. This suggested that 400 mg/day celiprolol did not lower blood pressure more than the 200 mg/day celiprolol.
Motolese 1975 was the only study included in oxprenolol analyses. The baseline of the 60 and 80 mg/day subgroups (188/112 mmHg) were much higher than placebo (175/109 mmHg). The unbalanced baseline BP raised concerns for the adequacy of randomization. Since no other oxprenolol subgroup significantly lowered BP and the risk of selection bias was high in this subgroup, the effect in the 60 and 80 mg/day subgroup could be an exaggeration. This subgroup only had a small sample size and did not significantly affect the overall pooled results.
The sample sizes of other partial agonists were too small to draw any definitive conclusion. It is troubling that acebutolol and pindolol, which are approved in Canada and the USA to treat hypertension, provided little publicly available data.
Overall subclass effect of partial agonists
The mean baseline BP of partial agonists studies (175/107 mmHg) was higher than the other classes of beta blockers. The patients enrolled in the studies generally had moderate to severe hypertension. Most of the studies were published back in the 1970s and 1980s. The definition of hypertension at that time was >160/100 mmHg.
Only two of the 13 included studies specified whether BP was measured at peak (one to 12 hours after dose) or trough hours (13 to 24 hours after dose). However, the fact that many of the partial agonists used in the studies were taken two to three times a day, it is reasonable to assume that BP was measured at peak hours in these studies.
In the pooled data, 0.25 and 0.5 times the recommended starting dose did not significantly lower SBP or DBP. The recommended starting dose and higher doses significantly lowered both SBP and DBP. Direct comparison showed no significant difference in BP lowering effect between the starting dose and higher doses. The 1x and 2x starting dose subgroups contained the largest sample size. The estimate of BP lowering efficacy for partial agonists by combining the 1x and 2x starting dose subgroup was ‐8/‐4 mmHg.
Heart rate
The combined effects of 1x and 2x starting dose subgroups on heart rate for partial agonist (‐5 beats per minute) was smaller than non‐selective beta blockers (‐9 beats per minute). This result suggests that partial agonists might be less likely to cause bradycardia than other non‐selective beta blockers.
The rationale of developing partial agonists was that by having agonistic properties, partial agonists could produce fewer side effects of beta antagonism, such as bradycardia, fatigue, and rebound hypertension after withdrawal. The available data did not answer whether this was the case as many trials did not report the effect on heart rate or withdrawals due to adverse effects (WDAEs).
Pulse pressure
Partial agonists significantly lowered pulse pressure compared to placebo. The relatively small effect on DBP could help explain why partial agonist, with smaller sample size, was the only beta blocker subclass that showed an effect on pulse pressure of this magnitude. The agonistic property of partial agonists on peripheral beta‐2 receptors, causing vasodilation and improving blood vessel compliance, could lower pulse pressure and offer another explanation for this finding.
BP variability
In this review, we found that the SBP end treatment standard deviation of partial agonists was significantly higher compared to placebo. Due to the small sample size it was difficult to draw a definitive conclusion. Only six of 13 studies provided the end treatment standard deviations in the partial agonist and placebo groups. Attempts to contact the authors in order to obtain this information were not successful. In addition, measuring BP at peak hours might increase BP variability. It was possible that the higher variability in SBP might disappear when BP was measured at trough hours. Large, well‐conducted studies comparing the BP variability of partial agonists and placebo are needed in order to shed more light on this matter.
Compared to other classes of drugs
Based on an informal indirect comparison of peak BP lowering effects observed in other Cochrane reviews on angiotensin‐converting‐enzyme (ACE) inhibitors (‐11/‐6 mm Hg) and ARBs (‐12/‐7 mmHg) compared with placebo (Heran 2008 (ACEI); Heran 2008 (ARB)), which used similar inclusion/exclusion criteria to the present review, partial agonist (‐8/‐4 mmHg) lowered peak BP by a smaller magnitude. The estimate of the effect of partial agonists on pulse pressure was larger at 4 mmHg than other beta blockers, but because of the very low quality of the evidence more studies are needed to know whether partial agonists have a different effect on pulse pressure than other subclasses of beta blockers.
The baseline BP in trials of partial agonists (175/107 mmHg) was much higher than ACE inhibitors (157/101 mmHg) and ARBs (156/101 mmHg). The absolute amount of reduction of BP is expected to be higher when the baseline BP is higher. Therefore, it is likely that the trough BP lowering effect of partial agonists in a mild hypertensive population would be smaller than the current estimate.
Overall completeness and applicability of evidence
This review represents the best evidence available for the blood pressure lowering efficacy of partial agonist beta blockers. The objectives of the included studies were similar to our review. The participants of these trials were middle‐aged, primary hypertensive patients. The average baseline blood pressures were mostly in the moderately elevated range and most of the trials were performed in the 1970's and 1980's.
Quality of the evidence
summary of findings Table for the main comparison summarizes the combined effect size of the combined starting and 2x the starting dose of partial agonists. In addition, it provides a judgment of the quality of evidence in this review. Included in this review were 13 studies examining the BP lowering effect of partial agonists in 605 middle age hypertensive patients. The average baseline blood pressures were mostly in the severely elevated range.
Only one study used an automated machine to measure blood pressure. This suggests that the risk of detection bias is high due to loss of blinding in this review. Because of the high risk of detection bias, the quality of evidence was downgraded by one level.
Due to the small sample size of this review, the estimates are likely to change when additional data are made available in the future. This is the reason that the quality of evidence was downgraded by another level.
In addition, a search for acebutolol and pindolol trials, which are approved for treatment of hypertension in North America, had yielded only a small amount of data. This raises suspicion that large trials required to achieve licensing have not been published. Therefore, the risk of publication bias in this review is high, which downgraded the quality of evidence by another level.
For these reasons, the estimates of the BP lowering effect shown in the 'Summary of findings' table are very likely an exaggeration of the true effect. This is reflected in the table by the very low judgment of the quality of the evidence.
Potential biases in the review process
The rigid inclusion criteria of this review minimized potential bias during the review process. The inclusion of the studies was based strictly on the methodology of the studies, the results of the studies paid no role in the decision. The duty of the review authors were solely to determine whether the methodology had met the inclusion criteria. Therefore, we were confident that the risk of bias during review process was very low.
Agreements and disagreements with other studies or reviews
Two other reviews, Chen 2010 and Law 2005, assessed the blood pressure lowering efficacy of beta blockers. However, these two reviews pooled the results of different classes of beta blockers together as one large class. We believe that this could be problematic as different classes of beta blockers, which have differences in mechanism of action, could have different effects on blood pressure. Pooling the data together could lead to misrepresentation of the effect of individual beta blockers. Therefore, it was inappropriate to compare the results of this review to these previously published reviews.

Study flow diagram

'Risk of bias' summary: review authors' judgements about each risk of bias item for each included study

Comparison 1 Acebutolol vs Placebo, Outcome 1 SBP.

Comparison 1 Acebutolol vs Placebo, Outcome 2 DBP.

Comparison 1 Acebutolol vs Placebo, Outcome 3 Heart rate.
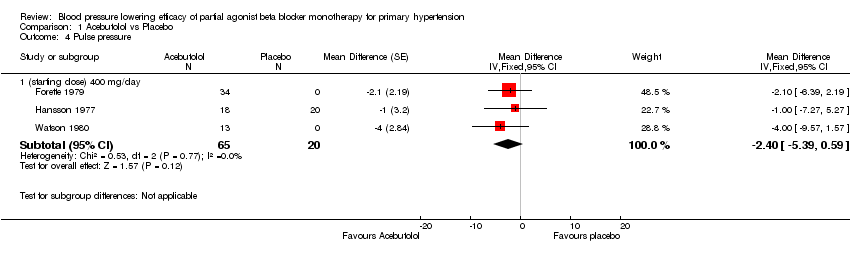
Comparison 1 Acebutolol vs Placebo, Outcome 4 Pulse pressure.

Comparison 2 Pindolol vs Placebo, Outcome 1 SBP.

Comparison 2 Pindolol vs Placebo, Outcome 2 DBP.

Comparison 2 Pindolol vs Placebo, Outcome 3 Heart rate.

Comparison 2 Pindolol vs Placebo, Outcome 4 Pulse pressure.

Comparison 3 Celiprolol vs Placebo, Outcome 1 SBP.

Comparison 3 Celiprolol vs Placebo, Outcome 2 DBP.
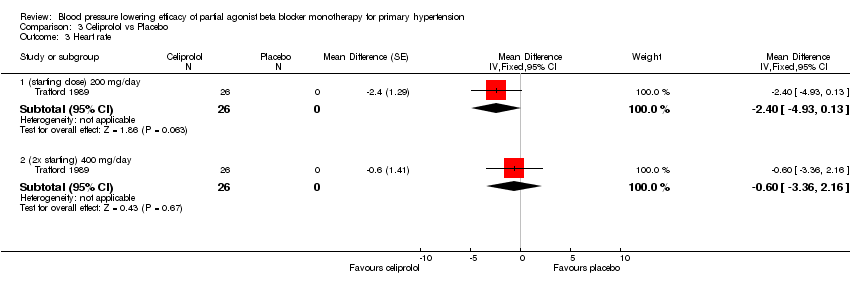
Comparison 3 Celiprolol vs Placebo, Outcome 3 Heart rate.

Comparison 3 Celiprolol vs Placebo, Outcome 4 Pulse pressure.

Comparison 3 Celiprolol vs Placebo, Outcome 5 SBP dose comparison.

Comparison 3 Celiprolol vs Placebo, Outcome 6 DBP dose comparison.

Comparison 4 Alprenolol vs Placebo, Outcome 1 SBP.

Comparison 4 Alprenolol vs Placebo, Outcome 2 DBP.

Comparison 4 Alprenolol vs Placebo, Outcome 3 Heart rate.

Comparison 4 Alprenolol vs Placebo, Outcome 4 Pulse pressure.

Comparison 5 Bopindolol vs Placebo, Outcome 1 SBP.

Comparison 5 Bopindolol vs Placebo, Outcome 2 DBP.

Comparison 5 Bopindolol vs Placebo, Outcome 3 Heart rate.

Comparison 5 Bopindolol vs Placebo, Outcome 4 Pulse pressure.

Comparison 5 Bopindolol vs Placebo, Outcome 5 WDAE.

Comparison 6 Oxprenolol vs Placebo, Outcome 1 SBP.

Comparison 6 Oxprenolol vs Placebo, Outcome 2 DBP.

Comparison 6 Oxprenolol vs Placebo, Outcome 3 Pulse pressure.

Comparison 7 Pooled partial agonist effects, Outcome 1 SBP.

Comparison 7 Pooled partial agonist effects, Outcome 2 DBP.

Comparison 7 Pooled partial agonist effects, Outcome 3 Heart rate.

Comparison 7 Pooled partial agonist effects, Outcome 4 Pulse Pressure.

Comparison 7 Pooled partial agonist effects, Outcome 5 WDAE.

Comparison 7 Pooled partial agonist effects, Outcome 6 Combined starting and twice the starting dose.
| Blood pressure lowering effects of partial agonists compared with placebo for primary hypertension | |||
| Patient or population: Adults with primary hypertension Intervention: Partial agonists Comparison: Placebo | |||
| Outcomes | Mean estimates of 1x and 2x starting dose | No of Participants | Quality of the evidence |
| Decrease in systolic blood pressure | ‐8.1 [‐10.1 to ‐6.1]1,2,3,4 | 490 (10) | Very low5,6,7 |
| Decrease in diastolic blood pressure | ‐4.0 [‐5.1 to ‐2.9]1,2,3,4 | 490 (10) | Very low5,6,7 |
| Decrease in heart rate | ‐4.9 [‐6.2 to ‐3.7]2,3 | 256 (7) | Very low5,6,7 |
| Decrease in pulse pressure | ‐3.6 [‐5.3 to ‐1.9]1,2 | 490 (10) | Very low5,6,7,8 |
| Withdrawal due to adverse effect | RR [95%CI]: 0.72 [0.07 to 7.67]9 | 117 (1) | Very low5,6,10 |
| 95% CI: 95% confidence interval; RR: relative risk | |||
| GRADE Working Group grades of evidence | |||
| Footnotes | |||
|
| |||
| Outcome or subgroup title | No. of studies | No. of participants | Statistical method | Effect size |
| 1 SBP Show forest plot | 3 | Mean Difference (Fixed, 95% CI) | Subtotals only | |
| 1.1 (starting dose) 400mg/day | 3 | 85 | Mean Difference (Fixed, 95% CI) | ‐5.12 [‐8.85, ‐1.40] |
| 2 DBP Show forest plot | 3 | Mean Difference (Fixed, 95% CI) | Subtotals only | |
| 2.1 (starting dose) 400mg/day | 3 | 85 | Mean Difference (Fixed, 95% CI) | ‐1.77 [‐3.88, 0.34] |
| 3 Heart rate Show forest plot | 3 | Mean Difference (Fixed, 95% CI) | Subtotals only | |
| 3.1 (starting dose) 400mg/day | 3 | 85 | Mean Difference (Fixed, 95% CI) | ‐8.68 [‐10.85, ‐6.51] |
| 4 Pulse pressure Show forest plot | 3 | Mean Difference (Fixed, 95% CI) | Subtotals only | |
| 4.1 (starting dose) 400 mg/day | 3 | 85 | Mean Difference (Fixed, 95% CI) | ‐2.40 [‐5.39, 0.59] |
| Outcome or subgroup title | No. of studies | No. of participants | Statistical method | Effect size |
| 1 SBP Show forest plot | 3 | Mean Difference (Fixed, 95% CI) | Subtotals only | |
| 1.1 (starting dose) 10 mg/day | 2 | 29 | Mean Difference (Fixed, 95% CI) | ‐14.46 [‐19.84, ‐9.08] |
| 1.2 (4x starting) 30 mg/day | 1 | 16 | Mean Difference (Fixed, 95% CI) | ‐12.5 [‐20.16, ‐4.84] |
| 2 DBP Show forest plot | 3 | Mean Difference (Fixed, 95% CI) | Subtotals only | |
| 2.1 (starting dose) 10 mg/day | 2 | 29 | Mean Difference (Fixed, 95% CI) | ‐6.88 [‐10.15, ‐3.61] |
| 2.2 (4x starting) 30 mg/day | 1 | 16 | Mean Difference (Fixed, 95% CI) | ‐8.8 [‐14.80, ‐2.80] |
| 3 Heart rate Show forest plot | 2 | Mean Difference (Fixed, 95% CI) | Subtotals only | |
| 3.1 (starting dose) 10 mg/day | 2 | 29 | Mean Difference (Fixed, 95% CI) | ‐5.91 [‐9.50, ‐2.32] |
| 4 Pulse pressure Show forest plot | 3 | Mean Difference (Fixed, 95% CI) | Subtotals only | |
| 4.1 (starting dose)10 mg/day | 2 | 29 | Mean Difference (Fixed, 95% CI) | ‐8.01 [‐12.74, ‐3.29] |
| 4.2 (4x starting) 30 mg/day | 1 | 16 | Mean Difference (Fixed, 95% CI) | ‐3.70 [‐10.34, 2.94] |
| Outcome or subgroup title | No. of studies | No. of participants | Statistical method | Effect size |
| 1 SBP Show forest plot | 3 | Mean Difference (Fixed, 95% CI) | Subtotals only | |
| 1.1 (starting dose) 200 mg/day | 3 | 171 | Mean Difference (Fixed, 95% CI) | ‐7.86 [‐11.88, ‐3.84] |
| 1.2 (2x starting) 400 mg/day | 2 | 120 | Mean Difference (Fixed, 95% CI) | ‐8.59 [‐13.41, ‐3.77] |
| 1.3 (4x starting) 600 mg/day | 1 | 90 | Mean Difference (Fixed, 95% CI) | ‐10.0 [‐16.47, ‐3.53] |
| 2 DBP Show forest plot | 3 | Mean Difference (Fixed, 95% CI) | Subtotals only | |
| 2.1 (starting dose) 200 mg/day | 3 | 171 | Mean Difference (Fixed, 95% CI) | ‐4.57 [‐6.62, ‐2.53] |
| 2.2 (2x starting) 400 mg/day | 2 | 120 | Mean Difference (Fixed, 95% CI) | ‐4.88 [‐7.25, ‐2.52] |
| 2.3 (4x starting) 600 mg/day | 1 | 90 | Mean Difference (Fixed, 95% CI) | ‐6.0 [‐9.49, ‐2.51] |
| 3 Heart rate Show forest plot | 1 | Mean Difference (Fixed, 95% CI) | Subtotals only | |
| 3.1 (starting dose) 200 mg/day | 1 | 26 | Mean Difference (Fixed, 95% CI) | ‐2.4 [‐4.93, 0.13] |
| 3.2 (2x starting) 400 mg/day | 1 | 26 | Mean Difference (Fixed, 95% CI) | ‐0.6 [‐3.36, 2.16] |
| 4 Pulse pressure Show forest plot | 3 | Mean Difference (Fixed, 95% CI) | Subtotals only | |
| 4.1 (starting dose) 200 mg/day | 3 | 171 | Mean Difference (Fixed, 95% CI) | ‐3.76 [‐7.26, ‐0.25] |
| 4.2 (2x starting) 400 mg/day | 2 | 120 | Mean Difference (Fixed, 95% CI) | ‐3.89 [‐8.09, 0.32] |
| 4.3 (4x starting) 600 mg/day | 1 | 90 | Mean Difference (Fixed, 95% CI) | ‐4.0 [‐9.59, 1.59] |
| 5 SBP dose comparison Show forest plot | 2 | Mean Difference (Fixed, 95% CI) | Subtotals only | |
| 5.1 200 mg/day | 2 | 80 | Mean Difference (Fixed, 95% CI) | ‐7.42 [‐12.15, ‐2.69] |
| 5.2 400 mg/day | 2 | 85 | Mean Difference (Fixed, 95% CI) | ‐8.59 [‐13.41, ‐3.77] |
| 6 DBP dose comparison Show forest plot | 2 | Mean Difference (Fixed, 95% CI) | Subtotals only | |
| 6.1 200 mg/day | 2 | 80 | Mean Difference (Fixed, 95% CI) | ‐5.09 [‐7.34, ‐2.85] |
| 6.2 400 mg/day | 2 | 85 | Mean Difference (Fixed, 95% CI) | ‐4.88 [‐7.25, ‐2.52] |
| Outcome or subgroup title | No. of studies | No. of participants | Statistical method | Effect size |
| 1 SBP Show forest plot | 2 | Mean Difference (Fixed, 95% CI) | Subtotals only | |
| 1.1 400 mg/day | 2 | 27 | Mean Difference (Fixed, 95% CI) | ‐16.94 [‐23.86, ‐10.01] |
| 2 DBP Show forest plot | 2 | Mean Difference (Fixed, 95% CI) | Subtotals only | |
| 2.1 400 mg/day | 2 | 27 | Mean Difference (Fixed, 95% CI) | ‐6.73 [‐10.06, ‐3.39] |
| 3 Heart rate Show forest plot | 1 | Mean Difference (Fixed, 95% CI) | Subtotals only | |
| 3.1 400 mg/day | 1 | 16 | Mean Difference (Fixed, 95% CI) | ‐8.0 [‐15.45, ‐0.55] |
| 4 Pulse pressure Show forest plot | 2 | Mean Difference (Fixed, 95% CI) | Subtotals only | |
| 4.1 400 mg/day | 2 | 27 | Mean Difference (Fixed, 95% CI) | ‐8.71 [‐14.77, ‐2.65] |
| Outcome or subgroup title | No. of studies | No. of participants | Statistical method | Effect size |
| 1 SBP Show forest plot | 1 | Mean Difference (IV, Fixed, 95% CI) | Subtotals only | |
| 1.1 0.5 mg/day | 1 | 55 | Mean Difference (IV, Fixed, 95% CI) | ‐5.90 [‐15.77, 3.97] |
| 1.2 1 mg/day | 1 | 60 | Mean Difference (IV, Fixed, 95% CI) | ‐6.10 [‐15.58, 3.38] |
| 1.3 2 mg/day | 1 | 60 | Mean Difference (IV, Fixed, 95% CI) | ‐5.80 [‐14.64, 3.04] |
| 2 DBP Show forest plot | 1 | Mean Difference (IV, Fixed, 95% CI) | Subtotals only | |
| 2.1 0.5 mg/day | 1 | 55 | Mean Difference (IV, Fixed, 95% CI) | ‐1.5 [‐6.84, 3.84] |
| 2.2 1 mg/day | 1 | 60 | Mean Difference (IV, Fixed, 95% CI) | ‐4.0 [‐9.05, 1.05] |
| 2.3 2 mg/day | 1 | 60 | Mean Difference (IV, Fixed, 95% CI) | ‐2.40 [‐7.24, 2.44] |
| 3 Heart rate Show forest plot | 1 | Mean Difference (IV, Fixed, 95% CI) | Subtotals only | |
| 3.1 0.5 mg/day | 1 | 55 | Mean Difference (IV, Fixed, 95% CI) | ‐2.23 [‐7.33, 2.87] |
| 3.2 1 mg/day | 1 | 60 | Mean Difference (IV, Fixed, 95% CI) | ‐5.57 [‐10.13, ‐1.01] |
| 3.3 2 mg/day | 1 | 60 | Mean Difference (IV, Fixed, 95% CI) | ‐6.06 [‐10.21, ‐1.91] |
| 4 Pulse pressure Show forest plot | 1 | Mean Difference (Fixed, 95% CI) | Subtotals only | |
| 4.1 0.5 mg/day | 1 | 55 | Mean Difference (Fixed, 95% CI) | ‐4.8 [‐13.35, 3.75] |
| 4.2 1 mg/day | 1 | 60 | Mean Difference (Fixed, 95% CI) | ‐2.1 [‐10.39, 6.19] |
| 4.3 2 mg/day | 1 | 60 | Mean Difference (Fixed, 95% CI) | ‐3.4 [‐11.06, 4.26] |
| 5 WDAE Show forest plot | 1 | 117 | Risk Ratio (M‐H, Fixed, 95% CI) | 0.72 [0.07, 7.67] |
| Outcome or subgroup title | No. of studies | No. of participants | Statistical method | Effect size |
| 1 SBP Show forest plot | 1 | Mean Difference (IV, Fixed, 95% CI) | Subtotals only | |
| 1.1 (0.25x starting) 20 mg/day | 1 | 26 | Mean Difference (IV, Fixed, 95% CI) | 3.40 [‐8.57, 15.37] |
| 1.2 (0.5x starting) 40 mg/day | 1 | 27 | Mean Difference (IV, Fixed, 95% CI) | ‐6.20 [‐17.93, 5.53] |
| 1.3 (starting dose) 60 & 80 mg/day | 1 | 39 | Mean Difference (IV, Fixed, 95% CI) | ‐11.50 [‐21.60, ‐1.40] |
| 2 DBP Show forest plot | 1 | Mean Difference (IV, Fixed, 95% CI) | Subtotals only | |
| 2.1 (0.25x starting) 20 mg/day | 1 | 26 | Mean Difference (IV, Fixed, 95% CI) | 4.2 [‐2.33, 10.73] |
| 2.2 (0.5x starting) 40 mg/day | 1 | 27 | Mean Difference (IV, Fixed, 95% CI) | 0.40 [‐6.02, 6.82] |
| 2.3 (starting dose) 60 & 80 mg/day | 1 | 39 | Mean Difference (IV, Fixed, 95% CI) | ‐3.30 [‐8.94, 2.34] |
| 3 Pulse pressure Show forest plot | 1 | Mean Difference (Fixed, 95% CI) | Subtotals only | |
| 3.1 (0.25x starting) 20 mg/day | 1 | 26 | Mean Difference (Fixed, 95% CI) | 5.3 [‐5.11, 15.71] |
| 3.2 (0.5x starting) 40 mg/day | 1 | 27 | Mean Difference (Fixed, 95% CI) | 0.7 [‐9.51, 10.91] |
| 3.3 (starting dose) 60 & 80 mg/day | 1 | 39 | Mean Difference (Fixed, 95% CI) | 2.7 [‐7.71, 13.11] |
| Outcome or subgroup title | No. of studies | No. of participants | Statistical method | Effect size |
| 1 SBP Show forest plot | 11 | Mean Difference (Fixed, 95% CI) | Subtotals only | |
| 1.1 0.25x starting dose | 1 | 26 | Mean Difference (Fixed, 95% CI) | 3.4 [‐8.58, 15.38] |
| 1.2 0.5x starting dose | 2 | 82 | Mean Difference (Fixed, 95% CI) | ‐6.12 [‐11.36, ‐0.87] |
| 1.3 starting dose | 10 | 384 | Mean Difference (Fixed, 95% CI) | ‐8.11 [‐10.41, ‐5.81] |
| 1.4 2x starting dose | 3 | 180 | Mean Difference (Fixed, 95% CI) | ‐7.95 [‐12.18, ‐3.72] |
| 1.5 4x starting dose | 2 | 106 | Mean Difference (Fixed, 95% CI) | ‐11.04 [‐15.98, ‐6.10] |
| 2 DBP Show forest plot | 11 | 778 | Mean Difference (Fixed, 95% CI) | ‐3.89 [‐4.87, ‐2.91] |
| 2.1 0.25x starting dose | 1 | 26 | Mean Difference (Fixed, 95% CI) | 4.2 [‐2.33, 10.73] |
| 2.2 0.5x starting dose | 2 | 82 | Mean Difference (Fixed, 95% CI) | ‐0.73 [‐4.83, 3.38] |
| 2.3 starting dose | 10 | 384 | Mean Difference (Fixed, 95% CI) | ‐3.81 [‐5.08, ‐2.55] |
| 2.4 2x starting dose | 3 | 180 | Mean Difference (Fixed, 95% CI) | ‐4.41 [‐6.53, ‐2.28] |
| 2.5 4x starting dose | 2 | 106 | Mean Difference (Fixed, 95% CI) | ‐6.71 [‐9.72, ‐3.69] |
| 3 Heart rate Show forest plot | 7 | Mean Difference (Fixed, 95% CI) | Subtotals only | |
| 3.1 0.5x starting dose | 1 | 55 | Mean Difference (Fixed, 95% CI) | ‐2.23 [‐7.33, 2.87] |
| 3.2 1x starting dose | 7 | 200 | Mean Difference (Fixed, 95% CI) | ‐5.96 [‐7.38, ‐4.53] |
| 3.3 2x starting dose | 2 | 86 | Mean Difference (Fixed, 95% CI) | ‐2.27 [‐4.58, 0.03] |
| 4 Pulse Pressure Show forest plot | 11 | 765 | Mean Difference (Fixed, 95% CI) | ‐3.40 [‐4.94, ‐1.87] |
| 4.1 0.25x starting dose | 1 | 26 | Mean Difference (Fixed, 95% CI) | 5.3 [‐5.11, 15.71] |
| 4.2 0.5x starting dose | 2 | 82 | Mean Difference (Fixed, 95% CI) | ‐2.53 [‐9.09, 4.02] |
| 4.3 1x starting dose | 10 | 371 | Mean Difference (Fixed, 95% CI) | ‐3.58 [‐5.54, ‐1.63] |
| 4.4 2x starting dose | 3 | 180 | Mean Difference (Fixed, 95% CI) | ‐3.76 [‐7.39, ‐0.14] |
| 4.5 4x starting dose | 2 | 106 | Mean Difference (Fixed, 95% CI) | ‐3.88 [‐8.15, 0.40] |
| 5 WDAE Show forest plot | 1 | 117 | Risk Ratio (M‐H, Fixed, 95% CI) | 0.72 [0.07, 7.67] |
| 6 Combined starting and twice the starting dose Show forest plot | 10 | Mean Difference (Fixed, 95% CI) | Subtotals only | |
| 6.1 SBP | 10 | 564 | Mean Difference (Fixed, 95% CI) | ‐8.07 [‐10.09, ‐6.05] |
| 6.2 DBP | 10 | 564 | Mean Difference (Fixed, 95% CI) | ‐3.97 [‐5.05, ‐2.88] |
| 6.3 Heart rate | 7 | 286 | Mean Difference (Fixed, 95% CI) | ‐4.94 [‐6.15, ‐3.73] |
| 6.4 Pulse pressure | 10 | 551 | Mean Difference (Fixed, 95% CI) | ‐3.62 [‐5.34, ‐1.90] |